Attached files
| file | filename |
|---|---|
| 8-K - 8-K - Acadia Healthcare Company, Inc. | d737216d8k.htm |
| EX-99.1 - EX-99.1 - Acadia Healthcare Company, Inc. | d737216dex991.htm |
 June
2014 Investor Presentation
Exhibit 99.2
*
*
*
*
*
*
* |
| Some
of
the
statements
made
in
this
presentation
constitute
forward-looking
statements
within
the
meaning
of
the
Private
Securities
Litigation
Reform
Act
of
1995.
Forward-looking
statements
include
any
statements
that
address
future
results
or
occurrences.
In
some
cases
you
can
identify
forward-looking
statements
by
terminology
such
as
“may,”
“might,
“will,”
“should,”
“could”
or
the
negative
thereof.
Generally,
the
words
“anticipate,”
“believe,”
“continues,”
“expect,”
“intend,”
“estimate,”
“project,”
“plan”
and
similar
expressions
identify
forward-looking
statements.
In
particular,
statements
about
our
expectations,
beliefs,
plans,
objectives,
assumptions
or
future
events
or
performance
contained
in
this
are
forward-looking
statements.
We
have
based
these
forward-looking
statements
on
our
current
expectations,
assumptions,
estimates
and
projections.
While
we
believe
these
expectations,
assumptions,
estimates
and
projections
are
reasonable,
such
forward-looking
statements
are
only
predictions
and
involve
known
and
unknown
risks,
uncertainties
and
other
factors,
many
of
which
are
outside
of
our
control,
which
could
cause
our
actual
results,
performance
or
achievements
to
differ
materially
from
any
results,
performance
or
achievements
expressed
or
implied
by
such
forward-looking
statements.
Given
these
risks
and
uncertainties,
you
are
cautioned
not
to
place
undue
reliance
on
such
forward-looking
statements.
These
risks
and
uncertainties
may
cause
our
actual
future
results
to
be
materially
different
than
those
expressed
in
our
forward-looking
statements.
Additional
risks
and
uncertainties
are
described
more
fully
in
our
periodic
reports
and
other
filings
with
the
Securities
&
Exchange
Commission.
These
forward-looking
statements
are
made
only
as
of
the
date
of
this
presentation.
We
do
not
undertake
and
specifically
decline
any
obligation
to
update
any
such
statements
or
to
publicly
announce
the
results
of
any
revisions
to
any
such
statements
to
reflect
future
events
or
developments.
Safe Harbor
1 |
| We
have
included
certain
financial
measures
in
this
presentation,
including
Pro
Forma
EBITDA,
Pro
Forma
Adjusted
EBITDA,
Adjusted
Diluted
Earning
per
Share,
PiC
EBITDA
and
PiC
Adjusted
EBITDA,
which
are
“non-GAAP
financial
measures”
as
defined
under
the
rules
and
regulations
promulgated
by
the
U.S.
Securities
and
Exchange
Commission
(“SEC”).
We
define
Pro
Forma
EBITDA
as
pro
forma
net
income
(loss)
adjusted
for
loss
(income)
from
discontinued
operations,
net
interest
expense,
income
tax
provision
(benefit)
and
depreciation
and
amortization.
We
define
Pro
Forma
Adjusted
EBITDA
as
Pro
Forma
EBITDA
adjusted
for
equity-based
compensation
expense,
cost
savings/synergies,
rate
increases,
integration
and
closing
costs,
rent
elimination,
other
and
debt
extinguishment
costs.
We
define
PiC
EBITDA
as
PiC
loss
from
continuing
operations
adjusted
for
net
interest
expense,
income
tax
benefit
and
depreciation
and
amortization.
We
define
PiC
Adjusted
EBITDA
as
PiC
EBITDA
adjusted
for
other
costs.
For
a
reconciliation
of
pro
forma
net
income
(loss)
to
Pro
Forma
Adjusted
EBITDA,
see
page
22
(Adjusted
EBITDA
Reconciliation).
For
a
reconciliation
of
Adjusted
Diluted
Earnings
per
Share,
see
page
23
(Adjusted
EPS
Reconciliation).
For
a
reconciliation
of
PiC
loss
from
continuing
operations
to
PiC
Adjusted
EBITDA,
see
page
24
(PiC
Adjusted
EBITDA
Reconciliation).
We
may
not
achieve
all
of
the
expected
benefits
from
synergies,
cost
savings
and
recent
improvements
to
our
revenue
base.
Pro
Forma
EBITDA,
Pro
Forma
Adjusted
EBITDA
and
PiC
Adjusted
EBITDA,
as
presented
in
this
presentation,
are
supplemental
measures
of
our
performance
and
are
not
required
by,
or
presented
in
accordance
with,
generally
accepted
accounting
principles
in
the
United
States
(“GAAP”).
Pro
Forma
EBITDA,
Pro
Forma
Adjusted
EBITDA
and
PiC
Adjusted
EBITDA
are
not
measures
of
our
financial
performance
under
GAAP
and
should
not
be
considered
as
alternatives
to
net
income
or
any
other
performance
measures
derived
in
accordance
with
GAAP
or
as
an
alternative
to
cash
flow
from
operating
activities
as
measures
of
our
liquidity.
Our
measurements
of
Pro
Forma
EBITDA,
Pro
Forma
Adjusted
EBITDA
and
PiC
Adjusted
EBITDA
may
not
be
comparable
to
similarly
titled
measures
of
other
companies
and
are
not
measures
of
performance
calculated
in
accordance
with
GAAP.
We
have
included
information
concerning
Pro
Forma
EBITDA,
Pro
Forma
Adjusted
EBITDA
and
PiC
Adjusted
EBITDA
in
this
presentation
because
we
believe
that
such
information
is
used
by
certain
investors
as
measures
of
a
company’s
historical
performance.
We
believe
these
measures
are
frequently
used
by
securities
analysts,
investors
and
other
interested
parties
in
the
evaluation
of
issuers
of
equity
securities,
many
of
which
present
EBITDA
and
Adjusted
EBITDA
when
reporting
their
results.
Our
presentation
of
Pro
Forma
EBITDA,
Pro
Forma
Adjusted
EBITDA
and
PiC
Adjusted
EBITDA
should
not
be
construed
as
an
inference
that
our
future
results
will
be
unaffected
by
unusual
or
nonrecurring
items.
Use of Non-GAAP Financial Measures
2 |
 Proven and Replicable Growth Strategy
Attractive Industry Trends Coupled with Favorable Legislative Environment
Key Investment Highlights
3
Leading Pure Play Behavioral Healthcare Services Provider
Strong Financial Performance and Steady Cash Flow Generation
Premier Management Team with Track Record of Success
Significant Transformation in Scale, Bed and Payor Mix
Attractive Revenue Diversification and Payor Base |
 Definitive Agreement to Acquire Partnerships in Care (PiC)
PiC is the 2
nd
largest independent (private) behavioral health provider in the
UK
23 inpatient facilities with over 1,200 beds
2013 revenues of $285 million
2013 adjusted EBITDA of $75 million
Purchase price of approximately $660 million
Fully underwritten funding commitment from BofAML
Transaction expected to be significantly accretive
$0.17 to $0.20 per diluted share for 2014
$0.40 to $0.46 per diluted share for 2015
Attractive UK growth opportunities
Favorable industry dynamics
Positioned well to grow organically and through acquisitions
Transaction expected to close July 1, 2014
4 |
 PiC is
a Long-Established Leading Service Provider 5
PiC Standalone Overview
Facility Locations
Established in 1985, PiC has since grown to comprise
1,244 beds in 23 facilities located across the UK
Owned by Cinven since 2005
Market leader in the provision of secure
accommodation for mentally ill patients and a leading
provider of care, in both secure and non-secure
settings. #2 UK private-sector provider with 16%
market share
The primary sources of new patient referrals are the
NHS, legal system, prisons, and other secure facilities
Over 99% of treatment is funded by the NHS, which is
predominantly funded by NHS England and Clinical
Commissioning Groups for services such as brain
injuries and rehab
Owns a portfolio of well maintained flexible mental
health hospitals with outstanding service records, with
over $150 million invested in development CapEx over
the past 7 years
Generated revenue for 2013 of $285
(1)
million and
adjusted EBITDA of $75
(1)
million
(1) Note: assumes £1 = $1.67 |
 Acquisition Rationale
6
Meaningfully
increases
size
and
scale
of
the
business
–
expected
to
increase
revenue
by
37%
to
$1.1
billion
Attractive
platform
for
entry
into
UK
behavioral
health
market
Ample
opportunities
for
growth
-
bed
expansions,
de
novo
opportunities
and
acquisitions
have
been
identified
in
markets
with
pent-up
demand
PiC
has
strong
relationships
with
UK
regulators
Positive
underlying
fundamental
trends
in
the
UK
behavioral
health
industry
Demand
for
independent
acute
care
services
has
grown
significantly
as
a
result
of
reducing
bed
capacity
at
NHS
facilities
and
increased
hospitalization
rates
The
UK
independent
mental
health
market
is
a
£1.1
billion
market
(~8%
of
total
mental
health
spend)
and
is
growing
at
9.2%
per
year,
making
it
one
of
the
fastest
growing
sectors
in
the
UK
Sector
poised
for
consolidation
(largest
four
players
make
up
58%
of
the
market),
with
significant
opportunities
to
bolster
scale
and
local
presence,
a
key
driver
of
competitive
advantage
in
the
UK
behavioral
health
market
Target
has
acquisition
pipeline
in
place
that
has
been
impeded
due
to
capital
constraints
under
current
owners
Significant
shift
in
payor
mix
profile
–
diversifies
revenue
mix
away
from
U.S.
government
payors
PF
49%
US
government
/
27%
UK
government
U.S.
Medicaid
mix
declines
from
mid
45%
to
33%
Growth
and
margin
enhancement
PiC
margins
in
mid
20%
region
–
roughly
500
bps
higher
than
those
of
Acadia
Acquisition
will
be
highly
accretive
to
Acadia
EPS
Limited
integration
risk
PiC
has
long-standing
and
highly
effective
management
team
that
are
expected
to
remain
at
the
Company |
 UK
Behavioral Healthcare Market 7
Source: Laing & Buisson UK Market Report.
UK Mental
Healthcare
Market
Trends
NHS vs.
Independent
Sector
Dynamics
Expenditure on mental healthcare services in the UK is roughly £14.4bn.
>70% of funding for these services is provided by the National Health Service
(NHS), with the remainder funded by local authorities
In total, ~1.3m people currently receive mental healthcare services in the UK,
with the mentally ill population expected to be almost 10mm by 2026
(growing at or greater than the rate of overall population) The flattening
budget and policy focus on mental healthcare has resulted in the identification of certain
mechanisms to ensure sustainability. These include improved operational
efficiency, a focus on outcomes and implementation of the integrated care
agenda (“care pathways”) The secure mental healthcare pathway
includes medium and low secure settings, rehabilitation and community based
care. Individuals are referred into the pathway either from the NHS (77% of referrals), often via acute
hospitals or the criminal justice system (23%)
In response to the sustainability challenge, there is growing focus on increasing
patient velocity along their care pathways
and
commissioning
integrated
pathways,
although
certain
barriers
–
including
the
division
of
mental
health
commissioning
responsibility
between
different
entities
–
exist
to
its
adoption
There is an opportunity for providers to build out services offerings in community
settings, as these are currently underdeveloped and represent a lower cost
setting close to the patient’s home The NHS is the principal provider
of secure mental healthcare services, with approximately 70% share of total beds
in the UK. The independent sector is a material provider of services, with an
overall share of approximately 30%, which rises to over 40% for secure and
rehabilitation services The
NHS
has
reduced
its
overall
capacity
by
approximately
3%
per
year
since
2006
/
2007
NHS capacity is not optimized and it does not have the capital to address specific
local demand patterns The fundamental market dynamics are expected to
broadly strengthen the market position of quality independent sector
providers, especially the increased focus on outcomes, requirement to design new care models and
requirement
for
capacity
optimization
–
all
of
which
the
independent
sector
is
better
placed
to
address
than
the
NHS |
 Leading Pure Play Behavioral Healthcare Services Provider
8
Acadia is a facility-based behavioral healthcare company
established in 2005 to acquire, develop and operate
behavioral healthcare facilities
In February 2011, five members of the former Psychiatric
Solutions, Inc. (“PSI”) senior management team joined
Acadia
Goal to build the pre-eminent behavioral healthcare
company in the US and accelerate Acadia’s growth strategy
M&A strategy has created significant momentum (acquired
~$600 million in revenue over the last 3 years)
Acquired AmiCare and BCA in December 2012
Acquired Greenleaf Center in January 2013
Acquired Delta Medical Center in January 2013
In May 2013, acquired San Juan Capestrano Hospital
(Puerto Rico) and North Tampa Behavioral, under
construction that opened in the fourth quarter of 2013
Acquired The Refuge in August 2013
Acquired Longleaf Behavioral in October 2013
Acquired Cascade Behavioral in December 2013
Acquired Pacific Grove in January 2014
Pro Forma for the acquisitions of San Juan Capestrano
and Cascade, LTM 3/31/14 Revenues and Adj. EBITDA
were $766 million and $156 million, respectively
Licensed Bed Mix
Acadia Overview
Facility Locations
Existing Facilities
Headquarters
AmiCare Facilities
BCA Facilities
4,300 Total Beds at 52 Facilities
Greenleaf
Delta Medical Center
San Juan Capestrano Hospital
Puerto Rico
North Tampa
Cascade
Pacific Grove
Longleaf
The Refuge |
 Premier Management Team with Track Record of Success
9
Industry Leading Management Team
Bruce Shear
Executive Vice
Chairman,
Years in Industry: 36
Brent Turner
President
Years in Industry: 19
Ron Fincher
Chief Operating
Officer
Years in Industry: 30
Steve Davidson
Chief Development
Officer
Years in Industry: 30
Chris Howard
Executive Vice
President,
General Counsel
Years in Industry: 10
Joey Jacobs
Chairman & Chief Executive Officer
Years in Industry: 40
David Duckworth
Chief Financial
Officer
Years in Industry: 10
Division V
Division I
VP Clinical
Services
Division IV
Division III
Division II
PiC |
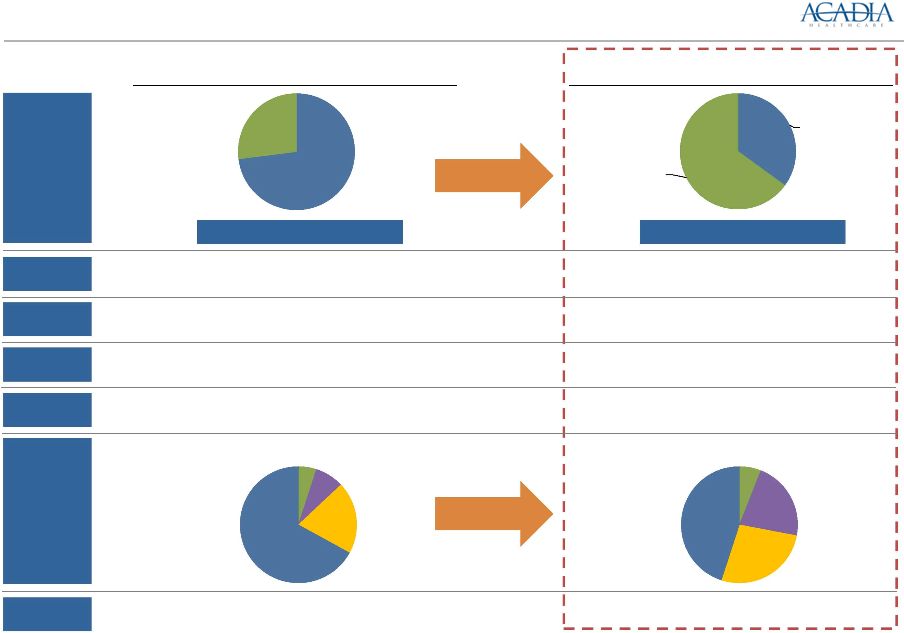 10
Significant Transformation in Scale, Bed and
Payor Mix over the Past Two Years
(1)
Pro forma Acadia, YFCS and PHC.
(2)
Pro forma Acadia, San Juan Capestrano and Cascade.
1,970 Beds
4,300 Beds
Pro Forma FY 2011
(1)
# of
Facilities
29
52
Revenue
($ in mil)
$333
$766
Adj. EBITDA
($ in mil)
$54
$155
Adj. EBITDA
Margin
16.2%
20.3%
# of
States
18
24
Bed
Mix
Payor
Mix
Pro Forma LTM 3/31/14
(2)
RTC /
Other
73%
Acute
27%
RTC/
Other
35%
Acute
65%
Other
5%
Medicare
8%
Comm'l
20%
Medicaid
67%
Other
6%
Medicare
22%
Comm'l
27%
Medicaid
45% |
 Longleaf Hospital located in Alexandria, Louisiana
68-bed acute inpatient psychiatric facility
Closed October 1, 2013
Purchase price of approximately $8.3 million
Cascade Behavioral Hospital located in Tukwila, Washington
63-bed acute inpatient psychiatric hospital
Certificate of need for 135 total beds
Closed December 1, 2013
Purchase price of approximately $20.0 million
Pacific Grove Hospital located in Riverside, California
68-bed acute inpatient psychiatric facility
Closed January 1, 2014
Purchase price of approximately $10.5 million
11
Recent Announcements – Longleaf, Cascade and Pacific Grove |
 Industry Dynamics Highly Favorable Compared to Medical/Surgical
Providers and Other Facility-Based Healthcare Businesses
General Acute Care Hospitals
Acute Hospitalization
Broad clinical focus
Focused on inpatient care with average
length of stay (ALOS) of roughly 5 days
Most intensive level of care offered
24-hour observation and care
–
Daily intervention and oversight by a
psychiatrist
10-day average length of stay
Transition to less-intensive level of care
Residential Treatment
Less intensive treatment in non-hospital
settings
Focused on children and adolescents
Physician-led multi-disciplinary treatment
addressing overall medical, psychiatric,
social and academic needs of the patient
–
Balance of therapies and activities in a
safe, structured setting
Longer length of stay –180 to 270 days
Focus
On average, hospitals have ~200 beds
Heavy competition from outpatient setting
Increasing inpatient occupancy and utilization
Limited competition from outpatient setting
Inpatient
Capabilities
More complex reimbursement system
–
670 Diagnosis Related Groups for
medical/surgical hospitals
–
Medicare reimbursement via a
prospective payment system (PPS)
Simple reimbursement system
–
Per diem based
–
15 Diagnosis Related Groups
–
Medicare PPS payment system implemented January 2005
Reimbursement
Profile
Mid-teens margin
Capex can be 4% -
6% of revenue
20 –
40% margin
Minimal maintenance capital expenditure
requirements: ~2% of revenue
15 –
25% margin
Minimal maintenance capital expenditure
requirements: ~2% of revenue
Facility Level
Profitability
Competitors
Inpatient Behavioral Healthcare
Bad debt expense as high as +10%
–
Higher level of private payors
Low bad debt exposure (~3% of Net Revenue)
–
Diverse and stable payor mix
–
Limited emergency room exposure
–
Preauthorization
12 |
 Attractive Industry Fundamentals
(1)
IBISWorld report –
“Mental Health & Substance Abuse Centers in the US”, May 2011.
(2)
National Institute of Mental Health.
(3)
Based on management beliefs and/or projections.
(4)
IBISWorld report –
“Youth Programs & Miscellaneous Care Facilities in the U.S.”, August
2010. (5)
US Department of Health and Human Services.
Industry Trends Make a Compelling Growth Story
($ in billions)
Mental
Health
and
Substance
Abuse
Facilities
Market
(1)
Youth
Behavioral
Market
(4)
Highly fragmented industry with small establishments
Stable pricing and inpatient ALOS combined with increased
admissions and occupancy trends
Medicare PPS has had a positive impact to freestanding
providers
Significant barriers to entry because of high degree of
specialization
and
regulation
(1)
Large market with attractive trends
–
U.S. Behavioral Healthcare Market:
National expenditures on mental
health and substance abuse treatment are projected to reach $239bn
by
2014,
a
CAGR
of
6.4%
since
2003
(5)
–
Adult Behavioral Healthcare:
Mental health and substance abuse
facilities
market
estimated
to
grow
to
$10.2bn
in
2014
(1)
~26% of Americans aged 18 and older suffer from diagnosable
mental
disorders
(2)
Market is poised for growth due to increased awareness of
mental
health
illnesses
and
treatment
acceptance
(3)
–
Youth Behavioral Healthcare Market:
Child and Adolescent
Behavioral
Healthcare
market
estimated
to
grow
to
$11.0bn
in
2014
(4)
1
in
5
children
and
adolescents
have
a
mental
disorder
(2)
Focus on children services mitigates reimbursement pressure
from
Medicaid
(3)
–
Substance Abuse:
~2.8% of persons 12 or older are dependent on or
abuse
illicit
drugs,
and
~7%
are
dependent
on
or
abuse
alcohol
(1)
13
($ in billions)
$8.6
$8.7
$9.0
$9.4
$9.7
$10.0
$10.2
2008
2009
2010
2011E
2012E
2013E
2014E
$9.6
$9.7
$9.9
$10.1
$10.4
$10.7
$11.0
2008
2009
2010
2011E
2012E
2013E
2014E |
 Favorable Legislative Environment
Enables most people who are now uninsured to get insurance through an insurance
exchange,
resulting
in
healthcare
coverage
for
more
than
90%
of
Americans
(1)
Significantly
expands
options
for
affordable
coverage
through
Medicaid
expansion
(1)
Reform is expected to provide more Americans, including low-income, single,
childless adults, with insurance and bring mental health and substance
abuse coverage on par with coverage for medical and surgical services
Healthcare Exchanges will be subject to the Federal Mental Health Parity Law
resulting in
more
individuals
having
comparable
coverage
for
mental
health
and
physical
health
(2)
(1)
IBISWorld report –
“Mental Health & Substance Abuse Centers in the US”, May 2011.
(2)
Based on management expectations.
The Mental Health Parity and Addiction Equity Act of 2008 provides for equal
coverage between psychiatric or mental health services and physical medical health
services
(1)
–
Forbids employers and insurers from placing stricter limits on mental healthcare
compared to other
health
conditions
for
group
plans
of
51
employees
or
more
(1)
–
Provides incentives and requirements for employers to provide comparable coverage
for mental health and physical health
–
Projected
to
affect
more
than
113
million
individuals
(1)
–
Promotes positive awareness of mental health issues and environment
Difficult
to
cut
reimbursement
for
coverage
that
relates
to
children
(2)
Final mental health parity regulations effective beginning in 2014
14
Mental Health
Parity Legislation
Patient
Protection and
Affordable Care
Act
Healthcare
Reform will Spur
Revenues |
 15
Proven and Replicable Growth Strategy
Significant acquisition growth runway
exists given industry fragmentation and
attractive valuation
Proven strategy to identify, acquire,
integrate and improve facility operations
AmiCare and BCA (Dec. 2012)
Greenleaf Center (Jan. 2013)
Delta Medical Center (Jan. 2013)
San Juan Capestrano Hospital and
North Tampa Behavioral Health
(May 2013)
The Refuge (Aug. 2013)
Longleaf (Oct. 2013)
Cascade (Dec. 2013)
Pacific Grove (Jan. 2014)
Growth supported by positive secular demand trends, market
share gains, stable pricing and inpatient ALOS
Consistent track record of same facility revenue growth
(+10% average over the last four quarters)
Increase occupancy of existing beds and increasing mix of
higher margin services
Improve profitability at underperforming facilities by
addressing capital constraints and improving management
systems
Group purchasing, benefits and risk management savings
Expanding bed count at existing
facilities to meet demand –
significantly
cash flow accretive
In addition, opportunity from conversion
of RTC beds to acute beds
Added 76 beds to existing facilities
during 2011
Added 281 beds during 2012
Added 325 beds, including opening
two newly developed facilities with a
combined 102 licensed beds, in 2013
Added 122 beds during Q1 2014 |
 Financial Review
16 |
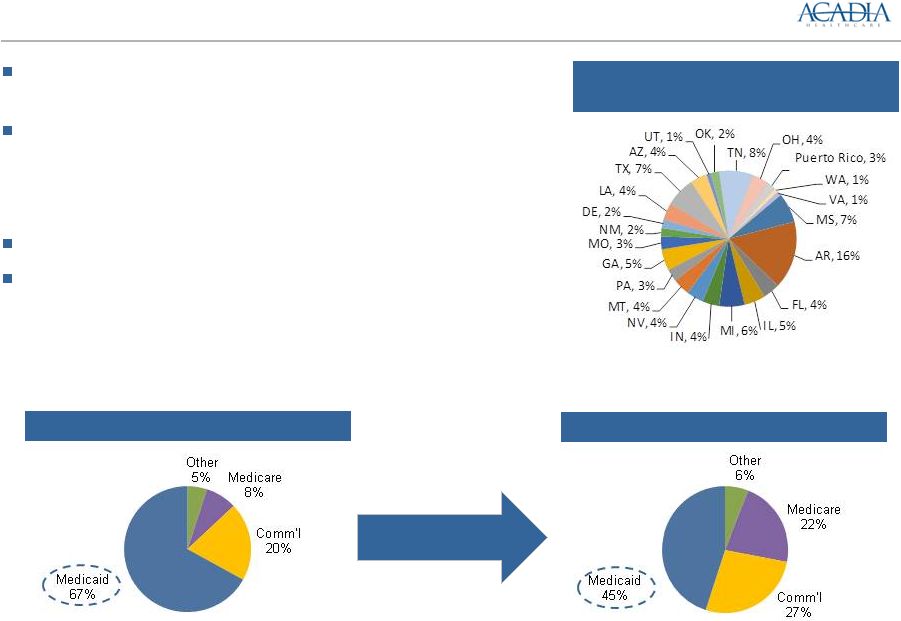 Attractive Revenue Diversification and Payor Base
17
Limited
significant
geographic
concentration
PF LTM 3/31/14 Revenues
(1)
Payor Mix –
PF FY 2011
(2)
(1)
Pro Forma for Acadia, San Juan Capestrano Hospital and Cascade. Medicaid includes 30
state payors and other payment providers including educational departments and state governments.
(2)
Pro Forma Acadia, YFCS and PHC.
Geographic diversification with operations across 52 facilities
in 24 states and Puerto Rico, on a pro forma basis
Receive Medicaid payments from 30 states, the District of
Columbia and Puerto Rico
-
Medicaid reimbursements are primarily for services provided to
children and adolescents
No facility accounts for more than 7% of total facility revenue
Improving mix of services by increasing acute psychiatric
beds
-
Services diversified between adult and youth behavioral, in-patient,
outpatient and general psychiatric facilities, residential treatment
facilities, substance abuse facilities, and other behavioral
healthcare services
Payor Mix –
PF LTM 3/31/14
(1) |
 First
Quarter 2014 Financial Summary Significant expansion of platform
52 facilities and ~4,300 beds in 24 states and Puerto
Rico in Q1 2014 vs. 44 facilities and ~3,500 beds in
21 states in Q1 2013
Room for growth and margin improvement within
existing facilities
26.0% same-facility Adjusted EBITDA margin for the
first quarter ended 3/31/14 compared with the 23.7%
Adjusted EBITDA margin for all facilities
Delivered a strong financial performance in three
months ended 3/31/14 compared to three months
ended 3/31/13
Revenues grew by 25% from $161.2 million
to $201.4 million
Same-facility revenues grew by 10% from $160.6
million to $176.4 million
Adjusted EBITDA grew by 29% from $30.5 million to
$39.3 million
Increasing facility EBITDA margin, delivered 60 bps
of margin expansion from 23.1% to 23.7%
Generated $0.28 diluted EPS
(1)
in three months
ended 3/31/14
Completed acquisition of one facility in California
with approximately 68 licensed beds
Source:
SEC filings and company press release.
Q1 2014 Performance
Revenue
($ millions)
Adjusted Diluted EPS
Adjusted EBITDA
($ millions)
Key Highlights
18
Y-O-Y Growth: 25%
Y-O-Y Growth: 29%
Y-O-Y Growth: 62%
$161.2
$201.4
Q1'13
Q1'14
$30.5
$39.3
Q1'13
Q1'14
$0.21
$0.28
Q1'13
Q1'14 |
 Historical Performance
19
Revenues
($ millions)
Adjusted EBITDA
($ millions)
Adjusted Diluted EPS
2014 guidance for
adjusted diluted EPS
of $1.26 -
$1.29
$216.5
$407.5
$713.4
2011
2012
2013
$35.2
$81.0
$145.3
2011
2012
2013
$0.27
$0.66
$1.07
2011
2012
2013 |
 Proven and Replicable Growth Strategy
Attractive Industry Trends Coupled with Favorable Legislative Environment
Key Investment Highlights
20
Leading Pure Play Behavioral Healthcare Services Provider
Strong Financial Performance and Steady Cash Flow Generation
Premier Management Team with Track Record of Success
Significant Transformation in Scale, Bed and Payor Mix
Attractive Revenue Diversification and Payor Base |
 Appendix
21 |
 Adjusted EBITDA Reconciliation
(1)
Approximately $17.3 million of equity-based compensation was
recognized
in
2011
related
to
equity
units
issued
in
conjunction
with
the acquisition of YFCS
(2)
Includes headcount reduction associated with duplicative functions
and the integration of PHC’s, AmiCare’s and BCA’s corporate
functions into Acadia’s headquarters in Franklin, TN
(3)
Represents (1) the increased revenue that would have resulted from
an increased rate on one of PHC’s contracts that became effective
in March 2011, assuming such increased rate had been effective
throughout the twelve month period ended December 31, 2011.
The increased rate was estimated by multiplying the historical plan
enrollment by the newly-contracted rate, and (2) the increased
revenue of AmiCare facilities for the Arkansas Medicaid rate
increases effective July 1, 2012
(4)
Reflects
integration
costs
incurred
through
12/31/11
for
the
acquisition of YFCS by Acadia
(5)
Represents rent expense incurred prior to the purchase of the real
estate assets of (1) PHC’s Capstone Academy, (2) the six facilities
that were previously leased by Acadia and purchased in 2012 and
(3) BCA’s Stone Crest facility purchased in December 2011
(6)
Includes run-rate effect of the expansion of an existing PHC
contract, normalized operating income for PHC’s Seven Hills
Facility, a legal settlement at PHC, the impact of start up losses for
new programs and facilities opened by PHC, AmiCare and BCA,
reimbursement adjustments, divestiture costs, policy changes,
management fees and other transaction related expenses already
incurred
(7)
In connection with the redemption of $52.5 million of the Company’s
12.875% Senior Notes, Acadia recorded a debt extinguishment
charge of $9.4 million in the first quarter ended March 31, 2013.
Description of Adjustments
22
Pro Forma Adjusted EBITDA Reconciliation
FYE December 31,
2011
2012
Pro Forma Results
Income (Loss) from Continuing Operations
$8.9
$34.3
Interest expense, net
34.6
34.9
Income tax provision (benefit)
16.6
23.2
Depreciation and amortization
11.1
12.4
Other expense, net
0.0
0.6
Pro Forma EBITDA
$71.2
$105.4
Adjustments
(1) Equity-based compensation expense
17.4
2.3
(2) Cost savings/synergies
9.8
6.9
(3) Rate increases
0.7
0.2
(4) Integration and closing costs
0.9
0.0
(6) Other
0.5
9.1
Total Pro Forma Adjusted EBITDA
$105.2
$127.2
$
millions
(5) Rent elimination
4.7
3.3
2013
$44.3
37.9
27.0
17.6
0.0
$126.8
5.2
0.0
0.0
0.0
7.2
$148.6
0.0
(7) Debt extinguishment costs
0.0
0.0
9.4
TTM
3/31/14
$52.7
38.5
31.6
19.1
0.0
$141.9
6.4
0.0
0.0
0.0
7.2
$155.5
0.0
0.0 |
 Adjusted EPS Reconciliation
Description of Adjustments
(1)
Represents the management fees paid by Acadia to its equity sponsor prior to the
termination of the professional services agreement between Acadia and its
equity sponsor on November 1, 2011. (2)
In connection with the redemption of $52.5 million of the Company’s 12.875%
Senior Notes, Acadia recorded a debt extinguishment charge of $9.4 million
in the first quarter ended March 31, 2013. (3)
Represents transaction-related expenses incurred by Acadia related to
acquisitions. (4)
Represents the income tax provision adjusted to reflect the aggregate tax effect of
the adjustments to income (loss) from continuing operations described above
based on effective tax rates. Adjusted EPS Reconciliation
FYE December 31,
$ millions
2011
2012
2013
Q1 2013
Q1 2014
Income (loss) from continuing
operations
$
(33.2)
$
20.5
$
43.3
$
4.1
$
13.0
Provision (benefit) for income taxes
(5.3)
12.3
25.9
2.6
7.8
Income (loss) from continuing operations before income taxes
(38.5)
32.8
69.2
6.7
20.8
Adjustments to income (loss) from continuing operations:
Sponsor management fees (1)
1.3
—
—
—
—
Debt extinguishment costs (2)
—
—
9.4
9.4
—
Transaction-related expenses (3)
41.5
8.1
7.2
1.5
1.6
Income tax provision/benefit reflecting tax effect of
adjustments to income from continuing operations (4)
0.7
(15.3)
(32.2)
(7.0)
(8.4)
Adjusted income (loss) from continuing operations
$
5.0
$
25.6
$
53.6
$
10.6
$
14.0
Weighted-average
shares
outstanding
–
diluted
18,757
38,696
50,261
50,250
50,486
Adjusted income (loss) from continuing operations per diluted
share
$
0.27
$
0.66
$
1.07
$
0.21
$
0.28
23 |
 PiC
Adjusted EBITDA Reconciliation (1)
Includes non-recurring legal and other costs incurred by PiC in the
period presented.
Description of Adjustments
24
Adjusted EBITDA Reconciliation
FYE December
31, 2013
Loss from Continuing Operations
($48.5)
Interest expense, net
103.2
Income tax benefit
(2.9)
Depreciation and amortization
19.2
EBITDA
$71.0
Adjustments
(1) Other
4.3
Adjusted EBITDA
$75.3
$ millions
(1) PiC results have been adjusted to conform to Acadia financial
statement presentation and to convert British pounds to US Dollars at a 1.67 exchange rate. |