Attached files
| file | filename |
|---|---|
| EX-23.1 - EX-23.1 - MARRONE BIO INNOVATIONS INC | d699683dex231.htm |
| EX-5.1 - EX-5.1 - MARRONE BIO INNOVATIONS INC | d699683dex51.htm |
| EX-1.1 - EX-1.1 - MARRONE BIO INNOVATIONS INC | d699683dex11.htm |
Table of Contents
As filed with the Securities and Exchange Commission on June 2, 2014.
Registration No. 333-196058
UNITED STATES
SECURITIES AND EXCHANGE COMMISSION
Washington, D.C. 20549
Amendment No. 1 to
FORM S-1
REGISTRATION STATEMENT
Under
THE SECURITIES ACT OF 1933
Marrone Bio Innovations, Inc.
(Exact name of registrant as specified in its charter)
| Delaware | 2870 | 20-5137161 | ||
| (State or other jurisdiction of incorporation or organization) |
(Primary Standard Industrial Classification Code Number) |
(I.R.S. Employer Identification Number) |
2121 Second St. Suite A-107
Davis, CA 95618
(530) 750-2800
(Address, including zip code, and telephone number, including area code, of registrant’s principal executive offices)
Pamela G. Marrone, Ph.D.
President and Chief Executive Officer
Marrone Bio Innovations, Inc.
2121 Second St. Suite A-107
Davis, CA 95618
(530) 750-2800
(Name, address, including zip code, and telephone number, including area code, of agent for service)
Copies to:
| Charles S. Farman, Esq. John W. Campbell, Esq. Alfredo B. D. Silva, Esq. Morrison & Foerster LLP 425 Market Street San Francisco, CA 94105 Tel: (415) 268-7000 Fax: (415) 268-7522 |
Boris Dolgonos, Esq. Jones Day 222 East 41st Street New York, NY 10017 Tel: (212) 326-3939 Fax: (212) 755-7306 |
Approximate date of commencement of proposed sale to the public: As soon as practicable after the effective date of this registration statement.
If any of the securities being registered on this Form are to be offered on a delayed or continuous basis pursuant to Rule 415 under the Securities Act of 1933 check the following box. ¨
If this Form is filed to register additional securities for an offering pursuant to Rule 462(b) under the Securities Act, please check the following box and list the Securities Act registration statement number of the earlier effective registration statement for the same offering. ¨
If this Form is a post-effective amendment filed pursuant to Rule 462(c) under the Securities Act, check the following box and list the Securities Act registration statement number of the earlier effective registration statement for the same offering. ¨
If this Form is a post-effective amendment filed pursuant to Rule 462(d) under the Securities Act, check the following box and list the Securities Act registration statement number of the earlier effective registration statement for the same offering. ¨
Indicate by check mark whether the registrant is a large accelerated filer, an accelerated filer, a non-accelerated filer, or a smaller reporting company. See the definitions of “large accelerated filer,” “accelerated filer” and “smaller reporting company” in Rule 12b-2 of the Exchange Act.
| Large accelerated filer | ¨ | Accelerated filer | ¨ | |||
| Non-accelerated filer | x (Do not check if a smaller reporting company) | Smaller reporting company | ¨ | |||
CALCULATION OF REGISTRATION FEE
|
| ||||||||
| TITLE OF EACH CLASS OF SECURITIES TO BE |
AMOUNT TO BE |
PROPOSED MAXIMUM AGGREGATE PER SHARE(2) |
PROPOSED MAXIMUM AGGREGATE OFFERING PRICE(2) |
AMOUNT OF REGISTRATION FEE | ||||
| Common stock, par value $0.00001 per share |
4,600,000 |
$8.92 | $41,032,000 | $5,285(3) | ||||
|
| ||||||||
|
| ||||||||
| (1) | Includes 600,000 shares that the underwriters have the option to purchase from the Registrant. |
| (2) | Estimated solely for the purpose of computing the amount of the registration fee pursuant to Rule 457(c) under the Securities Act of 1933, as amended (the “Securities Act”) and based on the average of the high and low sales prices of the Registrant’s common stock on May 23, 2014. |
| (3) | The registrant previously paid $4,508 of this registration fee in connection with the first filing of this Registration Statement. |
The Registrant hereby amends this Registration Statement on such date or dates as may be necessary to delay its effective date until the Registrant shall file a further amendment which specifically states that this Registration Statement shall thereafter become effective in accordance with Section 8(a) of the Securities Act of 1933 or until the Registration Statement shall become effective on such date as the Commission, acting pursuant to said Section 8(a), may determine.
Table of Contents
The information in this preliminary prospectus is not complete and may be changed. We may not sell these securities until the registration statement filed with the Securities and Exchange Commission is effective. This preliminary prospectus is not an offer to sell these securities and is not soliciting an offer to buy these securities in any jurisdiction where the offer or sale is not permitted
SUBJECT TO COMPLETION, DATED JUNE 2, 2014
PRELIMINARY PROSPECTUS
4,000,000 Shares

Marrone Bio Innovations, Inc.
Common Stock
We are offering 3,400,000 shares of our common stock and the selling stockholder identified in this prospectus is offering 600,000 shares of our common stock. We will not receive any proceeds from the sale of the shares by the selling stockholder. Our common stock is listed on The Nasdaq Global Market under the symbol “MBII.” On May 30, 2014, the last reported sale price of our common stock on The Nasdaq Global Market was $10.87 per share.
We are an “emerging growth company” as defined in the Jumpstart Our Business Startups Act and, as such, have elected to comply with certain reduced reporting requirements.
Investing in our common stock involves a high degree of risk. Please read “Risk Factors” beginning on page 15 of this prospectus.
Neither the Securities and Exchange Commission nor any state securities commission has approved or disapproved of these securities or determined if this prospectus is truthful or complete. Any representation to the contrary is a criminal offense.
| PER SHARE | TOTAL | |||||||
| Public Offering Price |
$ | $ | ||||||
| Underwriting Discounts and Commissions (1) |
$ | $ | ||||||
| Proceeds to Marrone, before expenses |
$ | $ | ||||||
| Proceeds to Selling Stockholder, before expenses |
$ | $ | ||||||
| (1) | See the section of this prospectus entitled “Underwriting.” |
Delivery of the shares of common stock is expected to be made on or about , 2014. We have granted the underwriters an option for a period of 30 days to purchase an additional 600,000 shares of our common stock. If the underwriters exercise the option in full, the total underwriting discounts and commissions payable by us will be $ , and the total proceeds to us, before expenses, will be $ .
| Jefferies | Piper Jaffray | |||
| Stifel |
Baird |
Roth Capital Partners |
Prospectus dated , 2014
Table of Contents

Table of Contents
| PAGE | ||||
| 1 | ||||
| 15 | ||||
| 33 | ||||
| 35 | ||||
| 36 | ||||
| 36 | ||||
| 37 | ||||
| 38 | ||||
| MANAGEMENT’S DISCUSSION AND ANALYSIS OF FINANCIAL CONDITION AND RESULTS OF OPERATIONS |
41 | |||
| 69 | ||||
| 93 | ||||
| 100 | ||||
| 108 | ||||
| 111 | ||||
| 114 | ||||
| 118 | ||||
| 120 | ||||
| 124 | ||||
| 130 | ||||
| 130 | ||||
| 130 | ||||
| F-1 | ||||
We and the underwriters have not authorized anyone to provide any information or to make any representations other than those contained in this prospectus or in any free writing prospectuses we have prepared. We and the underwriters take no responsibility for, and can provide no assurance as to the reliability of, any other information that others may give you. This prospectus is an offer to sell only the shares offered hereby, but only under circumstances and in jurisdictions where it is lawful to do so. The information contained in this prospectus is current only as of its date.
Table of Contents
This summary highlights information contained in greater detail elsewhere in this prospectus and does not contain all of the information that you should consider in making your investment decision. Before investing in our common stock, you should carefully read this entire prospectus, including our consolidated financial statements and the related notes included in this prospectus and the information set forth under the headings “Risk Factors” and “Management’s Discussion and Analysis of Financial Condition and Results of Operations.” Unless otherwise indicated in this prospectus, “MBI,” “our company,” “we,” “us” and “our” refer to Marrone Bio Innovations, Inc.
Our Company
We make bio-based pest management and plant health products. Bio-based products are comprised of naturally occurring microorganisms, such as bacteria and fungi, and plant extracts. We target the major markets that use conventional chemical pesticides, including certain agricultural and water markets, where our bio-based products are used as substitutes for, or in programs with, conventional chemical pesticides. We also target new markets for which there are no available conventional chemical pesticides, the use of conventional chemical products may not be desirable or permissible because of health and environmental concerns or the development of pest resistance has reduced the efficacy of conventional chemical pesticides. All of our current products are EPA-approved and registered as “biopesticides.” We believe our current portfolio of products and our pipeline address the growing global demand for effective, efficient and environmentally responsible products to control pests, increase crop yields and reduce crop stress.
Our products currently target two core end markets: crop protection and water treatment. Crop protection products consist of herbicides (for weed control), fungicides (for plant disease control), nematicides (for parasitic roundworm control), insecticides (for insect and mite control) and plant growth regulators and stimulants that growers use to increase crop yields, improve plant health, manage pest resistance and reduce chemical residues. Our products can be used in both conventional and organic crop production. We currently sell our three crop protection product lines, Regalia, for plant disease control and plant health, and Grandevo and Venerate, for insect and mite control, to growers of specialty crops such as grapes, citrus, tomatoes, vegetables, nuts, leafy greens and ornamental plants. We have also had sales of Regalia for large-acre row crops such as corn and soybeans. Water treatment products target invasive water pests across a broad range of applications, including hydroelectric and thermoelectric power generation, industrial applications, drinking water, aquaculture, irrigation and recreation. Our current water treatment product line, Zequanox, which we began selling in the second half of 2012, selectively kills invasive mussels that cause significant infrastructure and ecological damage.
In addition to our current two core end markets, we are also taking steps through strategic collaborations to commercialize products for other non-crop pest management markets. These products can be different formulations of our crop protection products that are specifically targeted for industrial and institutional, turf and ornamental, home and garden and animal health uses such as controlling grubs, cockroaches, flies and mosquitoes in and around schools, parks, golf courses and other public-use areas.
The agricultural industry is increasingly dependent on effective and sustainable pest management practices to maximize yields and quality in a world of increased demand for agricultural products, rising consumer awareness of food production processes and finite land and water resources. We believe that our competitive strengths, including our commercially available products, robust pipeline of novel product candidates, proprietary technology and product development process, commercial relationships and industry experience, position us for rapid growth by providing solutions for these global trends.
1
Table of Contents
Our Technology and Product Development Process
Our proprietary technology comprises a sourcing process for microorganisms and plant extracts, an extensive proprietary microorganism collection, microbial fermentation technology, screening technology and a process to identify and characterize natural compounds with pesticidal activity. Our technology enables us to isolate and screen naturally occurring microorganisms and plant extracts in an efficient manner and to identify those that may have novel, effective and safe pest management or plant health promoting characteristics. We then analyze and characterize the structures of compounds either produced by selected microorganisms or found in plant extracts to identify product candidates for further development and commercialization. As of March 31, 2014, we have screened more than 18,000 microorganisms and 350 plant extracts, and we have identified multiple product candidates that display significant levels of activity against insects, nematodes, weeds, plant diseases and invasive species such as zebra and quagga mussels, aquatic weeds and algae. We also have produced a collection of microorganisms from taxonomic groups that may enhance nutrient uptake in plants, reduce stress and otherwise increase plant growth. Our product candidates come primarily from our own discovery and development as well as in-licensed technology from universities, corporations and governmental entities.
Our proprietary product development process includes several important components. For all of our product candidates, we develop an analytical method to detect the quantity of the active natural product compounds that are produced by the microorganism or that are extracted from plants. For microbial products, we develop unique proprietary fermentation processes that increase the active natural compounds produced by the microorganisms. We also scale-up fermentation volumes to maximize yields consistently in each batch. Similarly, for our plant extract-based products, we develop a manufacturing process that increases the amount of active natural compounds extracted from plant materials. Our deep understanding of natural product chemistry allows us to develop formulations that optimize the efficacy and stability of compounds produced by microorganisms or plants. Products are not released for sale unless the quantity of the compounds meets our desired efficacy specifications. These methods allow us to produce products that are highly effective and of a consistent quality on a commercial scale.
These product formulations are tailored to meet customers’ needs and display enhanced performance characteristics such as effectiveness, shelf life, compatibility with other pesticides and ease of use. Our senior management’s numerous years of experience in the development of commercial products and formulations have resulted in a highly efficient product development process, which allows us to rapidly commercialize new products.
2
Table of Contents
Our Products
The table below summarizes our current portfolio of biopesticide products that are commercially available or are in targeted placement with key customers.
| NAME |
MARKET |
TARGET |
USE |
STAGE | ||||
| Regalia | Crop Protection, Home and Garden, Turf | Plant Disease/ Plant Health |
Protects against fungal and bacterial diseases and enhances yields. | Commercially Available | ||||
| Grandevo | Crop Protection, Home and Garden, Turf | Insects and Mites | Kills a broad range of sucking and chewing insects through feeding. | Commercially Available | ||||
| Zequanox | Water Treatment | Invasive Mussels | Kills invasive mussels that restrict water flow in industrial and power facilities and harm recreational waters. | Commercially Available for In-Pipe; Submitted for EPA Registration for Open Water | ||||
| Venerate | Crop Protection, Home and Garden, Turf, Animal Health | Insects and Mites | Kills sucking and chewing insects on contact. | Commercially Available | ||||
| Opportune | Crop Protection, Home and Garden, Turf | Weeds | Controls weeds pre- and post-emergence. | EPA Approved; Targeted Placement with Key Customers | ||||
In addition to the above products, our pipeline consists of product candidates in various stages of development, including biostimulant and plant health products that do not require EPA registration, products submitted to the EPA for registration, and other promising product candidates under development, which are summarized in the table below, as well as other early-stage discoveries.
| NAME |
MARKET |
TARGET |
USE |
STAGE | ||||
| Haven |
Crop Protection, Turf, Ornamentals | Plant Health | Enhances yields and reduces plant stress. | EPA Exempt; Under Development | ||||
| MBI-506, MBI-507 and MBI-508 | Crop Protection, Home and Garden, Turf | Plant Health | Enhance yields and reduce crop stress. | EPA Exempt; Under Development | ||||
| MBI-304 and MBI-305 | Crop Protection, Home and Garden, Turf | Nematodes | Kill a broad range of nematodes. | EPA Approved; Under Development | ||||
| MBI-011 | Crop Protection, Home and Garden, Turf | Weeds | Controls weeds; “burndown” herbicide (controls weed foliage). | Submitted for EPA Registration; Under Development | ||||
| MBI-302 | Crop Protection, Turf | Nematodes/ Plant Health |
Controls plant-parasitic nematodes and improves plant health. | Submitted for EPA Registration; Under Development | ||||
3
Table of Contents
| NAME |
MARKET |
TARGET |
USE |
STAGE | ||||
| MBI-601 | Crop Protection, Home and Garden, Industrial | Plant Disease/Nematodes/ Insects |
Biofumigant; controls post-harvest and soil-borne pests and diseases. |
Submitted for EPA Registration; Under Development | ||||
| MBI-010 | Crop Protection, Turf, Home and Garden | Weeds |
Controls weeds; non-selective systematic herbicide. | Under Development | ||||
| MBI-110 | Crop Protection, Home and Garden | Plant Disease/Plant Health |
Protects against fungal diseases and improves plant growth. | Under Development | ||||
| MBI-303 | Crop Protection, Turf | Nematodes/Plant Health |
Controls plant-parasitic nematodes and improves plant health. | Under Development | ||||
The Value Proposition of Our Pest Management and Plant Health Products
Our products are highly effective and generally designed to be compatible with existing equipment and infrastructure. This allows them to be used as substitutes for, or in connection with, conventional chemical pesticides and other products, as well as in markets for which there are no available conventional chemical pesticides or the use of conventional chemical products may not be desirable or permissible because of health and environmental concerns. We believe that compared with conventional chemical pesticides, our products:
| n | Are competitive in both price and efficacy; |
| n | Provide viable alternatives where conventional chemical pesticides and genetically modified crops are subject to regulatory restrictions; |
| n | Comply with market-imposed requirements for pest management programs by food processors and retailers; |
| n | Are environmentally friendly; |
| n | Meet stringent organic farming requirements; |
| n | Improve worker productivity by shortening field re-entry times after spraying and allowing spraying up to the time of harvest; |
| n | Are exempt from residue restrictions applicable to conventional chemical pesticides in both the agriculture and water markets; and |
| n | Are less likely to result in the development of pest resistance. |
In addition, our experience has shown that when our products are used in connection with conventional chemical pesticides, they can:
| n | Increase the effectiveness of conventional chemical pesticides while reducing their required application levels; |
| n | Increase levels of pest control and consistency of control; |
| n | Increase crop yields; |
| n | Increase crop quality, including producing crops with higher levels of protein, better taste and color and more attractive flowers; and |
| n | Delay the development of pest resistance to conventional chemical pesticides. |
4
Table of Contents
Our Sales and Distribution Platform
We currently sell our crop protection product lines, Regalia, Grandevo and Venerate, through leading agricultural distributors such as Crop Production Services, Simplot and members of the Integrated Agribusiness Professionals group. These are the same distribution partners that all major agrichemical companies use for delivering solutions to growers across the country.
With respect to sales outside of the United States, we have signed exclusive international distribution agreements for Regalia with FMC (for markets in Latin America), Syngenta (for markets in Africa, Europe and the Middle East) and Engage Agro (for markets in Canada and professional turf and ornamental plants in the United States). We have also entered into initial Memorandums of Understanding for Grandevo and Venerate with DeSangosse (for markets in France), with CBC/Intrachem (for markets in Italy), with Koppert (for indoor crops markets globally except the United States, Canada and France) and with Nufarm (for markets in Australia and New Zealand).
For our water treatment product line, Zequanox, we are in the process of staffing our own sales organization to manage demand creation at the end user level. Zequanox is currently being marketed and sold directly to U.S. power and industrial companies. We are also in discussions with several leaders in water treatment technology and applications regarding potential arrangements to distribute Zequanox in international markets.
In addition, we have signed a technology evaluation and development agreement with Scotts Miracle-Gro under which we have granted Scotts Miracle-Gro first rights to negotiate for exclusive worldwide distribution rights with respect to bio-based pest management and plant health products we jointly develop for the consumer lawn and garden market.
Our Competitive Strengths
Commercially Available Products. We have four commercially available product lines: Regalia, Grandevo, Zequanox and Venerate. We believe these product lines, along with our other EPA-approved and EPA-submitted products and other pipeline of product candidates, provide us the foundation for continuing to build one of the leading portfolios of bio-based pest management products.
Robust Pipeline of Novel Product Candidates. Our pipeline of early-stage discoveries and new product candidates extends across a variety of product types for different end markets, including herbicides, fungicides, nematicides, insecticides, algaecides (for algae control), molluscicides (for mussel and snail control) and plant growth and plant stress regulators. Our product candidates are developed both internally and sourced from third parties.
Rapid and Efficient Development Process. We believe we can develop and commercialize novel and effective products faster and at a lower cost than many other developers of pest management products. For example, we have moved each of Regalia, Grandevo and Zequanox through development, EPA approval and U.S. market launch in approximately four years at a cost of $6.0 million or less. In comparison, a report from Phillips McDougall, an independent market research firm, shows that the average cost for major agrichemical companies to bring a new crop protection product to market is over $250.0 million, and these products have historically taken an average of nearly ten years to move through development, regulatory approval and market launch.
Proprietary Discovery Process. Our discovery process allows us to efficiently discover microorganisms and plant extracts that produce or contain compounds that display a high level of pesticidal activity against various pests. We then use various analytical chemistry techniques to identify and characterize the natural product chemistry of the compounds, which we optimize and patent. Five of our product candidates, one of which is EPA-approved and one of which has been submitted to the EPA, are what we believe to be newly identified microorganism species. We believe that three of our product candidates produce novel compounds that we identified, and four of our product candidates have been found to have, or produce compounds with, a novel
5
Table of Contents
mode of action. Our proprietary discovery process is protected by patents on the microorganisms, their natural product compounds and their uses for pest management, as well as a patent application we have filed on a screening process to identify enzyme-inhibiting herbicides. We also maintain trade secrets related to the discovery, formulation, process development and manufacturing capabilities.
Sourcing and Commercialization Expertise. We use our technical and commercial development expertise to evaluate early-stage discoveries by third parties to determine commercial viability, secure promising technologies through in-licensing and add considerable value to these in-licensed product candidates. Our efficient development process and significant experience in applying natural product chemistry has led universities, corporations and government entities to collaborate with us to develop or commercialize a number of their early-stage discoveries. As with our internally discovered products, early-stage products we source and commercialize are subject to our own patents and trade secrets related to our added value in characterizing, formulating, developing and manufacturing marketable products.
Existing Agreements with Global Market Leaders. We have strategic agreements with global market leaders across agricultural and consumer retail markets. We have signed exclusive international distribution agreements for Regalia with Syngenta in Africa, Europe and the Middle East and with FMC in Latin America. We also have a technology evaluation and development agreement with Scotts Miracle-Gro, which grants it a right of first access to the active ingredients in our full portfolio of bio-based pest management and plant health products for use in its consumer lawn and garden products.
Management Team with Significant Industry Experience. Our management team has deep experience in bio-based pest management products and the broader agriculture industry. Our chief executive officer, chief operating officer and other key employees average over 25 years of experience and include individuals who have led agrichemical sales and marketing organizations, top scientists and industry experts, some of whom have served in leadership roles at large multinational corporations and governmental agencies, commercialized multiple products, brought multiple products through EPA, state and foreign regulatory processes, filed patent applications and received patents, led groundbreaking research studies and published numerous scientific articles.
Our Growth Strategy
Continue to Develop and Commercialize New Products in Both Existing and New Markets. Our goal is to rapidly and efficiently develop, register and commercialize new products each year, with the goal of developing a full suite of pest management and plant health products. For example, while our current crop protection products address plant diseases and insects, we are developing products that can also control nematodes and weeds as well as products for improving fertilizer efficiency and reducing drought and salt stress. We are also currently screening for water treatment products that control algae and aquatic weeds to complement Zequanox, our invasive mussel control product line.
Expand Applications of Our Existing Product Lines. We have identified opportunities to broaden the commercial applications and expand the use of our existing products lines into several key end markets, including large-acre row crop applications, seed treatment, irrigation, aquaculture and animal health. In addition, we recently expanded sales of Regalia in large-acre row crops. We believe these opportunities could help to drive significant growth for our company.
Accelerate Adoption of New Products, Product Applications and Product Lines. Our goal is to provide growers with complete and effective solutions to a broad range of pest management and plant health needs that can be used individually, together and in connection with conventional chemical pesticides to maximize yield and quality. We believe we will be able to leverage relationships with existing distributors as well as growers’ positive experiences using our Regalia and Grandevo product lines to accelerate adoption of new products, product applications and product lines. We will also continue to target early adopters of new pest management and plant health technologies with controlled product launches and to educate growers and water resource
6
Table of Contents
managers about the benefits of bio-based pest management products through on-farm and in-facility demonstrations to accelerate commercial adoption of our products.
Leverage Existing Distribution Arrangements and Develop New Relationships. To expand the availability of our products, we intend to continue to use relationships with conventional chemical pesticide distributors in the United States and leverage the international distribution capabilities under our existing strategic collaboration and distribution agreements. We also continue to form new strategic relationships with other market-leading companies in our target markets and regions to expand the supply of our products globally. For example, we have engaged distributors to help develop Grandevo and Venerate for key countries in Europe and Latin America and sell Regalia in Canada for specialty crops, in the United States for turf and ornamental plants and in parts of the Midwest United States for row crops. We have also engaged a distributor that launched Grandevo in the United States for turf and ornamental plants.
Develop and Expand Manufacturing Capabilities. We currently use third-party manufacturers to produce our products on a commercial scale. These arrangements have historically allowed us to focus our time and direct our capital towards discovering and commercializing new product candidates. We are repurposing a manufacturing facility that we purchased in July 2012 and plan to further expand capacity at this facility. We believe that greater control of our own manufacturing capacity will allow us to scale-up processes and institute process changes more quickly and efficiently while lowering manufacturing costs over time to achieve the desired margins and protecting the proprietary position of our products.
Pursue Strategic Collaborations and Acquisitions. We intend to continue collaborating with chemical manufacturers to develop products that combine our bio-based pest management and plant health products with their technologies, delivering more compelling product solutions to growers. We also may pursue acquisition and in-licensing opportunities to gain access to later-stage products and technologies that we believe would be a good strategic fit for our business and would create additional value for our stockholders.
Industry Overview
Pest management is an important global industry. Most of the markets we currently target or plan to target primarily rely on conventional chemical pesticides, supplemented in certain agricultural markets by the use of genetically modified crops. Conventional chemical pesticides are generally synthetic materials that directly kill or inactivate pests. Phillips McDougall estimates the 2013 agrichemical market at $59.2 billion (including non-crop pesticides), up from 2012 by 10%. Agranova, an independent market research firm, estimated that global agrichemical sales for the crop protection market were $50.0 billion in 2012, which represented an increase of 8.2% from 2011. The market for treatment of fruits and vegetables, the largest current users of bio-based pest management and plant health products, accounted for $16.2 billion of this total. Other agricultural applications, notably crops such as corn, soybeans, rice, cotton and cereals, which we expect will become increasingly important users of bio-based products, accounted for $24.7 billion of the total.
While conventional chemical pesticides are often effective in controlling pests, some of these chemicals are acutely toxic, some are suspected carcinogens and some can have other harmful effects on the environment and other animals. Health and environmental concerns have prompted stricter legislation around the use of conventional chemical pesticides, particularly in Europe, where the use of some highly toxic or endocrine-disrupting chemical pesticides is banned or severely limited and the importation of produce is subject to strict regulatory standards on pesticide residues. In addition, the European Union has passed the Sustainable Use Directive, which requires EU-member countries to reduce the use of conventional chemical pesticides and to use alternative pest management methods, including bio-based pest management products. Over the past two decades, U.S. regulatory agencies have also developed stricter standards and regulations. Furthermore, a growing shift in consumer preference towards organic and sustainable food production has led many large, global food retailers to require their supply chains to implement these practices, including the use of bio-based pest management and fertilizer solutions, water and energy efficiency practices, and localized
7
Table of Contents
food product sourcing. For example, in 2010, Wal-Mart announced its global sustainable agriculture goals to require sustainable best practices throughout its global food supply chain.
Aside from the health and environmental concerns, conventional chemical pesticide users face additional challenges such as pest resistance and reduced worker productivity, as workers may not return to the fields for a certain period of time after treatment. Similar risks and hazards are also prevalent in the water treatment market, as chlorine and other chemicals used to control invasive water pests contaminate and endanger natural waterways. Costs of using conventional chemical pesticides are also increasing due to a number of factors, including raw materials costs such as rising costs of petroleum, stringent regulatory requirements and pest resistance to conventional chemical pesticides, which requires increasing application rates or the use of more expensive substitute products.
As the cost of conventional chemical pesticides increases and the use of conventional chemical pesticides and genetically modified crops meets increased opposition from government agencies and consumers, and the efficacy of bio-based pest management products becomes more widely recognized among growers, bio-based pest management products are gaining popularity and represent a strong growth sector within the market for pest management technologies. Bio-based pest management products include “biopesticides,” which the EPA registers in two major categories: (1) microbial pesticides, which contain a microorganism such as a bacterium or fungus as the active ingredient; and (2) biochemical pesticides, which are naturally occurring substances with a non-toxic mode of action such as insect sex pheromones, certain plant extracts and fatty acids.
We believe many bio-based pest management products perform as well as or better than conventional chemical pesticides. When used in alternation or in spray tank mixtures with conventional chemical pesticides, bio-based pest management products can increase crop yields and quality over chemical-only programs. Agricultural industry reports, as well as our own research, indicate that bio-based pest management products can affect plant physiology and morphology in ways that may improve crop yield and can increase the efficacy of conventional chemical pesticides. In addition, pests rarely develop resistance to bio-based pest management products due to their complex modes of action. Likewise, bio-based pest management products have been shown to extend the product life of conventional chemical pesticides and limit the development of pest resistance, a key issue facing users of conventional chemical pesticides, by eliminating pests that survive conventional chemical pesticide treatments. Most bio-based pest management products are listed for use in organic farming, providing those growers with compelling pest control options to protect yields and quality. Given their generally lower toxicity compared with many conventional chemical pesticides, bio-based pest management products can add flexibility to harvest timing and worker re-entry times and can improve worker safety. Many bio-based pest management products are also exempt from conventional chemical residue tolerances, which are permissible levels of chemical residue at the time of harvest set by governmental agencies. Bio-based pest management products may not be subject to restrictions by food retailers and governmental agencies limiting chemical residues on produce, which enables growers to export to wider markets.
In addition to performance attributes, bio-based pest management products registered with the EPA as biopesticides can offer other advantages over conventional chemical pesticides. From an environmental perspective, biopesticides have low toxicity, posing low risk to most non-target organisms, including humans, other mammals, birds, fish and beneficial insects. Biopesticides are biodegradable, resulting in less risk to surface water and groundwater and generally have low air-polluting volatile organic compounds content. Because biopesticides tend to pose fewer risks than conventional pesticides, the EPA offers a more streamlined registration process for these products, which generally requires significantly less toxicological and environmental data and a lower registration fee. As a result, both the time and money required to bring a new product to market are reduced.
Summary of Risk Factors
Our business is subject to numerous risks, which are described in the section entitled “Risk Factors” immediately following this prospectus summary on page 15. You should carefully consider these risks before
8
Table of Contents
making an investment. In particular, the following considerations, among others, may offset our competitive strengths or have a negative effect on our growth strategy, which could cause a decline in the price of our common stock and result in a loss of all or a portion of your investment:
| n | We have a limited operating history and number of commercialized products, have incurred significant losses to date and anticipate continuing to incur losses in the future, and we may not achieve or maintain profitability. |
| n | Our products are in the early stages of commercialization, and our business may fail if we are not able to successfully generate significant revenues from these products. |
| n | Adverse weather conditions and other natural conditions can reduce acreage planted or incidence of crop disease or pest infestations, which can adversely affect our results of operations. |
| n | If our ongoing or future field trials are unsuccessful, we may be unable to obtain regulatory approval of, or commercialize, our products on a timely basis. |
| n | Our inability to obtain regulatory approvals, or to comply with ongoing and changing regulatory requirements, could delay or prevent sales of the products we are developing and commercializing. |
| n | Customers may not adopt our bio-based pest management and plant health products as quickly as we are projecting. |
| n | The high level of competition in the market for pest management products may result in pricing pressure, reduced margins or the inability of our products to achieve market acceptance. |
| n | Our product sales are expected to be seasonal and subject to weather conditions and other factors beyond our control, which may cause our operating results to fluctuate significantly quarterly and annually. |
| n | We rely on third parties for the production of our products. If these parties do not produce our products at a satisfactory quality, in a timely manner, in sufficient quantities or at an acceptable cost, our development and commercialization efforts could be delayed or otherwise negatively impacted. |
| n | We rely on a single supplier based in China for a key ingredient of Regalia. |
| n | If we are unable to maintain and further establish successful relations with the third-party distributors that are our principal customers, or they do not focus adequate resources on selling our products or are unsuccessful in selling them to end users, sales of our products would decline. |
| n | Our intellectual property is integral to our business. If we are unable to protect our patents and proprietary rights in the United States and foreign countries, our business could be adversely affected. |
Corporate Information
We were originally incorporated in the State of Delaware in June 2006 as Marrone Organic Innovations, Inc. Our principal executive offices are located at 2121 Second St. Suite A-107, Davis, CA 95618. Our telephone number is (530) 750-2800. Our website address is www.marronebioinnovations.com. The information that can be accessed through our website is not part of this prospectus, and investors should not rely on any such information in deciding whether to purchase our common stock.
Emerging Growth Company Status
We are an “emerging growth company,” as defined in the Jumpstart Our Business Startups Act, which we refer to as the JOBS Act. For as long as we are an “emerging growth company,” we may take advantage of certain exemptions from various reporting requirements that are applicable to other public companies that are not “emerging growth companies,” including, but not limited to, not being required to comply with the auditor attestation requirements of Section 404(b) of the Sarbanes-Oxley Act, reduced disclosure obligations regarding executive compensation in our periodic reports and proxy statements and exemptions from the requirements of holding advisory “say-on-pay” votes on executive compensation and shareholder advisory votes on golden parachute compensation.
Under the JOBS Act, we will remain an “emerging growth company” until the earliest of:
| n | the last day of the fiscal year during which we have total annual gross revenues of $1 billion or more; |
9
Table of Contents
| n | the last day of the fiscal year following the fifth anniversary of the completion of the initial public offering in August 2013; |
| n | the date on which we have, during the previous three-year period, issued more than $1 billion in non-convertible debt; and |
| n | the date on which we are deemed to be a “large accelerated filer” under the Securities Exchange Act of 1934, or the Exchange Act (we will qualify as a large accelerated filer as of the first day of the first fiscal year after we have (i) more than $700 million in outstanding common equity held by our non-affiliates and (ii) been public for at least 12 months; the value of our outstanding common equity will be measured each year on the last day of our second fiscal quarter). |
The JOBS Act also provides that an “emerging growth company” can utilize the extended transition period provided in Section 7(a)(2)(B) of the Securities Act of 1933, or the Securities Act, for complying with new or revised accounting standards. However, we have elected to “opt out” of such extended transition period, and, as a result, we will comply with new or revised accounting standards on the relevant dates on which adoption of such standards is required for companies that are not “emerging growth companies.” Section 107 of the JOBS Act provides that our decision to opt out of the extended transition period for complying with new or revised accounting standards is irrevocable.
Trade Names
Except as context otherwise requires, references in this prospectus to our product lines, such as Regalia, refer collectively to all formulations of the respective product line, such as Regalia Maxx or Regalia SC, and all trade names under which our distributors sell such product lines internationally, such as Sakalia.
Our logos, “Grandevo®,” “HavenTM,” “OpportuneTM,” “Regalia®,” “VenerateTM,” “Zequanox®” and other trade names, trademarks or service marks of Marrone Bio Innovations, Inc. appearing in this prospectus are the property of Marrone Bio Innovations, Inc. This prospectus contains additional trade names, trademarks and service marks of other companies. We do not intend our use or display of other companies’ trade names, trademarks or service marks to imply relationships with, or endorsement or sponsorship of us by, these other companies.
10
Table of Contents
The Offering
| Common stock offered by us |
3,400,000 shares |
| Common stock offered by the selling stockholder |
600,000 shares |
| Option to purchase additional shares |
We have granted the underwriters an option for a period of 30 days to purchase up to 600,000 additional shares of our common stock. |
| Common stock to be outstanding after this offering |
23,107,001 shares (or 23,707,001 shares if the underwriters exercise their option to purchase additional shares in full) |
| Use of proceeds |
We intend to use the net proceeds we receive from this offering primarily for working capital required to accelerate growth, capital expenditures and other general corporate purposes. We will not receive any proceeds from the sale of common stock by the selling stockholder in this offering. See “Use of Proceeds.” |
| Risk factors |
See “Risk Factors” and the other information included in this prospectus for a discussion of the factors you should consider carefully before deciding to invest in our common stock. |
| Nasdaq Global Market symbol |
MBII |
The number of shares of our common stock to be outstanding after this offering is based on 19,707,001 shares outstanding as of March 31, 2014, and excludes:
| n | 2,974,054 shares of common stock issuable upon the exercise of options outstanding as of March 31, 2014 with a weighted-average exercise price of $10.95 per share; |
| n | 144,646 shares of common stock issuable upon the exercise of warrants outstanding as of March 31, 2014, with a weighted-average exercise price of $8.40 per share; and |
| n | 1,127,624 shares of common stock that will be available for future grant under our 2013 Stock Incentive Plan as of March 31, 2014, and additional shares of common stock that will be available for future grant under the automatic increase provisions of our 2013 Stock Incentive Plan (see “Executive Compensation—Employee Benefit and Stock Plans—2013 Stock Incentive Plan”). |
Except as otherwise indicated, all information in this prospectus assumes:
| n | no other exercise of options or warrants subsequent to March 31, 2014; and |
| n | no exercise of the underwriters’ option to purchase additional shares of our common stock. |
11
Table of Contents
Summary Financial Data
The following tables summarize the financial data for our business. You should read this summary financial data in connection with “Management’s Discussion and Analysis of Financial Condition and Results of Operations” and our Consolidated Financial Statements and related notes, all included elsewhere in this prospectus.
We have derived the consolidated statements of operations data for each of the fiscal years ended December 31, 2013, 2012 and 2011 from our audited consolidated financial statements and related notes included elsewhere in this prospectus. We have derived the consolidated statements of operations data for the three months ended March 31, 2014 and 2013 and the consolidated balance sheet data as of March 31, 2014 from our unaudited interim condensed consolidated financial statements and related notes included elsewhere in this prospectus. Our historical results are not necessarily indicative of the results that may be expected in the future.
12
Table of Contents
Statements of Operations Data:
| YEAR ENDED DECEMBER 31, | THREE MONTHS ENDED MARCH 31, |
|||||||||||||||||||
| 2013 | 2012 | 2011 | 2014 | 2013 | ||||||||||||||||
| (In thousands, except per share data) | ||||||||||||||||||||
| Revenues: |
||||||||||||||||||||
| Product |
$ | 12,657 | $ | 6,777 | $ | 5,044 | $ | 2,097 | $ | 2,373 | ||||||||||
| License (1) |
193 | 179 | 57 | 45 | 48 | |||||||||||||||
| Related party |
1,693 | 184 | 150 | 648 | 309 | |||||||||||||||
|
|
|
|
|
|
|
|
|
|
|
|||||||||||
| Total revenues |
14,543 | 7,140 | 5,251 | 2,790 | 2,730 | |||||||||||||||
| Cost of product revenues, including cost of product revenues to related parties of $984, $126 and $50 for the years ended December 31, 2013, 2012 and 2011, respectively, and $192 and $194 for the three months ended March 31, 2014 and 2013, respectively |
10,736 | 4,333 | 2,172 | 1,652 | 1,795 | |||||||||||||||
|
|
|
|
|
|
|
|
|
|
|
|||||||||||
| Gross profit |
3,807 | 2,807 | 3,079 | 1,138 | 935 | |||||||||||||||
| Operating expenses: |
||||||||||||||||||||
| Research, development and patent |
17,814 | 12,741 | 9,410 | 4,282 | 3,283 | |||||||||||||||
| Non-cash charge associated with a convertible note |
— | 3,610 | — | — | — | |||||||||||||||
| Selling, general and administrative |
15,018 | 10,294 | 6,793 | 6,330 | 2,847 | |||||||||||||||
|
|
|
|
|
|
|
|
|
|
|
|||||||||||
| Total operating expenses |
32,832 | 26,645 | 16,203 | 10,612 | 6,130 | |||||||||||||||
|
|
|
|
|
|
|
|
|
|
|
|||||||||||
| Loss from operations |
(29,025 | ) | (23,838 | ) | (13,124 | ) | (9,474 | ) | (5,195 | ) | ||||||||||
| Other income (expense): |
||||||||||||||||||||
| Interest income |
49 | 16 | 22 | 10 | 1 | |||||||||||||||
| Interest expense |
(5,997 | ) | (2,466 | ) | (88 | ) | (773 | ) | (1,985 | ) | ||||||||||
| Change in estimated fair value of financial instruments (2) |
6,717 | (12,461 | ) | 1 | — | (3,563 | ) | |||||||||||||
| Gain on extinguishment of debt |
49 | — | — | — | — | |||||||||||||||
| Other (expense) income, net |
(282 | ) | (45 | ) | 9 | (9 | ) | (7 | ) | |||||||||||
|
|
|
|
|
|
|
|
|
|
|
|||||||||||
| Total other income (expense), net |
536 | (14,956 | ) | (56 | ) | (772 | ) | (5,554 | ) | |||||||||||
|
|
|
|
|
|
|
|
|
|
|
|||||||||||
| Loss before income taxes |
(28,489 | ) | (38,794 | ) | (13,180 | ) | (10,246 | ) | (10,749 | ) | ||||||||||
| Income taxes |
— | — | — | — | — | |||||||||||||||
|
|
|
|
|
|
|
|
|
|
|
|||||||||||
| Net loss |
(28,489 | ) | (38,794 | ) | (13,180 | ) | (10,246 | ) | (10,749 | ) | ||||||||||
| Deemed dividend on convertible notes |
(1,378 | ) | (2,039 | ) | — | — | — | |||||||||||||
|
|
|
|
|
|
|
|
|
|
|
|||||||||||
| Net loss attributable to common stockholders |
$ | (29,867 | ) | $ | (40,833 | ) | $ | (13,180 | ) | $ | (10,246 | ) | $ | (10,749 | ) | |||||
|
|
|
|
|
|
|
|
|
|
|
|||||||||||
| Net loss per common share (3): |
||||||||||||||||||||
| Basic |
$ | (3.42 | ) | $ | (32.48 | ) | $ | (10.64 | ) | $ | (0.52 | ) | $ | (8.48 | ) | |||||
|
|
|
|
|
|
|
|
|
|
|
|||||||||||
| Diluted |
$ | (3.94 | ) | $ | (32.48 | ) | $ | (10.64 | ) | $ | (0.52 | ) | $ | (8.48 | ) | |||||
|
|
|
|
|
|
|
|
|
|
|
|||||||||||
| Weighted-average shares outstanding used in computing net loss per common share (3): |
||||||||||||||||||||
| Basic |
8,731 | 1,257 | 1,239 | 19,518 | 1,268 | |||||||||||||||
|
|
|
|
|
|
|
|
|
|
|
|||||||||||
| Diluted |
8,911 | 1,257 | 1,239 | 19,518 | 1,268 | |||||||||||||||
|
|
|
|
|
|
|
|
|
|
|
|||||||||||
13
Table of Contents
| (1) | We receive payments under strategic collaboration and distribution agreements under which we provide third parties with exclusive development, marketing and distribution rights. These payments are initially classified as deferred revenues and are recognized as revenues over the exclusivity period. See Note 2 of our accompanying audited consolidated financial statements for an explanation of the method used to calculate license revenues. |
| (2) | Prior to the completion of the initial public offering, we accounted for the outstanding warrants exercisable into shares of our Series A, Series B and Series C convertible preferred stock and the outstanding warrants exercisable into a variable number of shares of common stock as liability instruments, as the Series A, Series B and Series C convertible preferred stock and the common stock into which these warrants were convertible were contingently redeemable upon the occurrence of certain events or transactions. In addition, convertible notes were accounted for at estimated fair value. The warrant instruments and convertible notes were adjusted to fair value at each reporting period with the change in fair value recorded in the consolidated statements of operations. These charges did not continue after the completion of the initial public offering because the preferred stock warrants were exercised and the convertible notes automatically converted into common stock in accordance with their terms upon the completion of the initial public offering. The common stock warrants were, in accordance with their terms upon the completion of the initial public offering, either automatically exercised for shares of common stock or represent the right to purchase a fixed number of shares. See “Management’s Discussion and Analysis of Financial Condition and Results of Operations—Key Components of Our Results of Operations—Change in Estimated Fair Value of Financial Instruments and Deemed Dividend on Convertible Notes.” |
| (3) | Includes the effect of a 1-for-3.138458 reverse stock split, effective August 1, 2013. |
Balance Sheet Data:
As adjusted consolidated balance sheet data as of March 31, 2014 in the table below gives effect to our receipt of the estimated net proceeds from this offering, at an assumed public offering price of $10.87 per share, which was the last reported sale price of our common stock on the Nasdaq Global Market on May 30, 2014, after deducting the estimated underwriting discounts and commissions and estimated offering expenses payable by us.
| AS OF MARCH 31, 2014 | ||||||||
| ACTUAL | AS ADJUSTED | |||||||
| (In thousands) | ||||||||
| Cash and cash equivalents |
$ | 21,298 | $ | 55,188 | ||||
| Short-term investments |
2,664 | 2,664 | ||||||
| Working capital (1) |
32,571 | 66,461 | ||||||
| Total assets |
63,459 | 97,349 | ||||||
| Debt and capital leases (net of unamortized discount) |
15,174 | 15,174 | ||||||
| Total liabilities |
29,498 | 29,498 | ||||||
| Total stockholders’ equity |
33,961 | 67,852 | ||||||
| (1) | Working capital is defined as total current assets minus total current liabilities. |
14
Table of Contents
Investing in our common stock involves a high degree of risk. You should carefully consider the following risk factors, as well as other information in this prospectus, before deciding whether to invest in shares of our common stock. The occurrence of any of the events described below could harm our business, financial condition, results of operations and growth prospects. In such an event, the trading price of our common stock may decline and you may lose all or part of your investment.
Risks Relating to Our Business and Strategy
We have a limited operating history and number of commercialized products, have incurred significant losses to date and anticipate continuing to incur losses in the future, and we may not achieve or maintain profitability.
We are an early stage company with a limited operating history, and we only recently began commercializing our products. We have incurred operating losses since our inception in June 2006, and we expect to continue to incur operating losses for the foreseeable future. At December 31, 2013 and 2012 and March 31, 2014, we had an accumulated deficit of $105.4 million, $75.6 million and $115.7 million, respectively. For the years ended December 31, 2013, 2012 and 2011 and the three months ended March 31, 2014, we had a net loss attributable to common stockholders of $29.9 million, $40.8 million, $13.2 million and $10.2 million, respectively. As a result, we will need to generate significant revenues to achieve and maintain profitability. If our revenues grow slower than anticipated, or if operating expenses exceed expectations, then we may not be able to achieve profitability in the near future or at all, which may depress our stock price.
Through March 31, 2014, we have derived substantially all of our revenues from sales of Regalia and Grandevo. In addition, we have derived revenues from strategic collaboration and development agreements for the achievement of testing validation, regulatory progress and commercialization events, and from sales of other products. Accordingly, there is only a limited basis upon which to evaluate our business and prospects. Our future success depends, in part, on our ability to market and sell other products, such as Venerate, as well as our ability to increase sales of Regalia, Grandevo and Zequanox. An investor in our stock should consider the challenges, expenses, and difficulties we will face as a company seeking to develop and manufacture new types of products in a relatively established market. We expect to derive future revenues primarily from sales of Regalia, Grandevo, Zequanox, Venerate and other products, but we cannot guarantee the magnitude of such sales, if any. We expect to continue to devote substantial resources to expand our research and development activities, further increase manufacturing capabilities and expand our sales and marketing activities for the further commercialization of Regalia, Grandevo, Zequanox, Venerate and other product candidates. We expect to incur additional losses for the next several years and may never become profitable.
Our products are in the early stages of commercialization, and our business may fail if we are not able to successfully generate significant revenues from these products.
Our future success will depend in part on our ability to commercialize the bio-based pest management and plant health product candidates we are developing. Our initial sales of our latest formulation of Regalia and our initial formulation of Grandevo occurred in the fourth quarter of 2009 and the fourth quarter of 2011, respectively, we began selling Zequanox in the second half of 2012, and we began to sell Venerate, a bioinsecticide, in May 2014. Our ability to generate significant revenues from Zequanox is dependent on our ability to persuade customers to evaluate the costs of our Zequanox products compared to the overall cost of the chlorine treatment process, the primary current alternative to using Zequanox, rather than the cost of purchasing chemicals alone. Sales of Zequanox have also remained lower than our other products due to the length of the treatment cycle, the longer sales cycle (the bidding process with utility companies occurs on a yearly or multi-year basis) and the unique nature of the treatment approach for each customer based on the extent of the infestation and the design of the facility.
Our near-term development and commercialization efforts are focused on our current launch of Venerate (a bioinsecticide), bringing to market Haven (an anti-transpirant) and MBI-507 and MBI-508 (biostimulants), submitting for EPA registration MBI-010 (a bioherbicide) and MBI-110 (a biofungicide), and conducting field trials on MBI-304 and MBI-305 (bionematicides). In addition, we intend to continue development of three products already submitted for EPA registration, MBI-302 (a bionematicides), MBI-011 (a bioherbicide) and MBI-601 (a biofumigant), and we have already taken into field trials several candidates we recently in-licensed from the New Zealand Institute for Plant and Food Research.
15
Table of Contents
Successful development of our product candidates will require significant additional investment, including costs associated with research and development, completing field trials and obtaining regulatory approval, as well as the ability to manufacture our products in large quantities at acceptable costs while also preserving high product quality. Difficulties often encountered in scaling up production include problems involving production yields, quality control and assurance, shortage of qualified personnel, production costs and process controls. In addition, we are subject to inherent risks associated with new products and technologies. These risks include the possibility that any product candidate may:
| n | be found unsafe; |
| n | be ineffective or less effective than anticipated; |
| n | fail to receive necessary regulatory approvals; |
| n | be difficult to competitively price relative to alternative pest management solutions; |
| n | be harmful to consumers, growers, farm workers or the environment; |
| n | be harmful to crops when used in connection with conventional chemical pesticides; |
| n | be difficult or impossible to manufacture on an economically viable scale; |
| n | be subject to supply chain constraints for raw materials; |
| n | fail to be developed and accepted by the market prior to the successful marketing of similar products by competitors; |
| n | be impossible to market because it infringes on the proprietary rights of third parties; or |
| n | be too expensive for commercial use. |
Adverse weather conditions and other natural conditions can reduce acreage planted or incidence of crop disease or pest infestations, which can adversely affect our results of operations.
Production of the crops on which our products are typically applied is vulnerable to extreme weather conditions such as heavy rains, hurricanes, hail, floods, tornadoes, freezing conditions, drought, fires and floods. Weather conditions can be impacted by climate change resulting from global warming, including changes in precipitation patterns and the increased frequency of extreme weather events, or other factors. Unfavorable weather conditions can reduce both acreage planted and incidence (or timing) of certain crop diseases or pest infestations, each of which may reduce demand for our products. For example, in 2013 and 2012, the United States experienced nationwide abnormally low rainfall or drought, reducing the incidence of fungal diseases such as mildews, and these conditions have been present in some of our key markets in the first quarter of 2014 as well. In addition, disruptions that cause delays by growers in harvesting or planting can result in the movement of orders to a future quarter, which would negatively affect the quarter and cause fluctuations in our operating results. For example, late snows and cold temperatures in the Midwestern and Eastern United States in the first quarter of 2014 have delayed planting and pesticide applications. Since Regalia and Grandevo products have different margins, changes in product mix due to these conditions could affect our overall margins.
If our ongoing or future field trials are unsuccessful, we may be unable to obtain regulatory approval of, or commercialize, our products on a timely basis.
The successful completion of multiple field trials in domestic and foreign locations on various crops and water infrastructures is critical to the success of our product development and marketing efforts. If our ongoing or future field trials are unsuccessful or produce inconsistent results or unanticipated adverse side effects on crops or on non-target organisms, or if we are unable to collect reliable data, regulatory approval of our products could be delayed or we may be unable to commercialize our products. In addition, more than one growing or treatment season may be required to collect sufficient data and we may need to collect data from different geographies to prove performance for customer adoption. Although we have conducted successful field trials on a broad range of crops, we cannot be certain that additional field trials conducted on a greater number of acres, or on crops for which we have not yet conducted field trials, will be successful. Moreover, the results of our ongoing and future field trials are subject to a number of conditions beyond our control, including weather-related events such as drought or floods, severe heat or frost, hail, tornadoes and hurricanes. Generally, we pay third parties such as growers, consultants and universities, to conduct field tests on our behalf. Incompatible crop treatment practices or misapplication of our products by these third parties could impair the success of our field trials.
16
Table of Contents
Our inability to obtain regulatory approvals, or to comply with ongoing and changing regulatory requirements, could delay or prevent sales of the products we are developing and commercializing.
The field testing, manufacture, sale and use of pest management products, including Regalia, Grandevo, Zequanox, Venerate and other products we are developing, are extensively regulated by the EPA and state, local and foreign governmental authorities. These regulations substantially increase the time and cost associated with bringing our products to market. If we do not receive the necessary governmental approvals to test, manufacture and market our products, or if regulatory authorities revoke our approvals, do not grant approvals in a timely manner or grant approvals subject to restrictions on their use, we may be unable to sell our products in the United States or other jurisdictions, which would result in our future revenues being less than anticipated.
We have received approval from the EPA for the active ingredients and certain end product formulations for Regalia, Grandevo, Zequanox, Opportune and Venerate. As we introduce new formulations of and applications for our products, we will need to seek EPA approval prior to commercial sale. For any such approval, the EPA may require us to fulfill certain conditions within a specified period of time following initial approval. We are also required to obtain regulatory approval from other state and foreign regulatory authorities before we market our products in their jurisdictions.
Some of these states and foreign countries may apply different criteria than the EPA in their approval processes. Although federal pesticide law preempts separate state and local pesticide registration requirements to some extent, state and local governments retain authority to control pesticide use within their borders.
There can be no assurance that we will be able to obtain regulatory approval for marketing our additional products or new product formulations and applications we are developing. Although the EPA has in place a registration procedure for biopesticides like Regalia and Grandevo that is streamlined in comparison to the registration procedure for conventional chemical pesticides, there can be no assurance that all of our products or product extensions will be eligible for this streamlined procedure or that additional requirements will not be mandated by the EPA that could make the procedure more time consuming and costly for our future products.
Additionally, for California state registration and registration in jurisdictions outside of the United States, all products need to be proven efficacious, which can require costly field trial testing and a favorable result is not assured. Because many of the products that may be sold by us must be registered with one or more government agencies, the registration process can be time consuming and expensive, and there is no guarantee that the product will obtain all needed registrations. We have intentionally obtained registration in some jurisdictions and not in others. California is one of the largest and most important producers of agricultural products in the world. Because of its stringent regulation of pesticides and environmental focus, we also view California as one of the most natural and attractive markets for our products. Given California’s stringent regulations, it is possible that we may have products that have been registered by the EPA, in other states and in foreign countries, but which may not be sold in California. If this were to occur, our business would be harmed.
Even if we obtain all necessary regulatory approvals to market and sell our products, they will be subject to continuing review and extensive regulatory requirements, including periodic re-registrations. The EPA, as well as state and foreign regulatory authorities, could withdraw a previously approved product from the market upon receipt of newly discovered information, including an inability to comply with their regulatory requirements or the occurrence of unanticipated problems with our products, or for other reasons.
Customers may not adopt our bio-based pest management and plant health products as quickly as we are projecting.
Customers in the crop production sector and the water treatment sector are generally cautious in their adoption of new products and technologies. Growers often require on-farm demonstrations of a given pest management or plant health product. Initial purchases of the product tend to be conservative, with the grower testing on a small portion of their overall crop. As the product is proven, growers incorporate the product into their rotational programs and deploy it on a greater percentage of their operations. As a result, large scale adoption can take several growing seasons. Water treatment products must also pass efficacy and ecological toxicity tests. In addition, given the relative novelty of our water treatment products, consumers of those products will continue to require education on their use, which may delay their adoption.
17
Table of Contents
The high level of competition in the market for pest management products may result in pricing pressure, reduced margins or the inability of our products to achieve market acceptance.
The markets for pest management products are intensely competitive, rapidly changing and undergoing consolidation. We may be unable to compete successfully against our current and future competitors, which may result in price reductions, reduced margins and the inability to achieve market acceptance for our products.
Many entities are engaged in developing pest management products. Our competitors include major multinational agrichemical companies such as Arysta, BASF, Bayer, Dow Chemical, DuPont, FMC, Monsanto, Sumitomo Chemical, Syngenta and specialized biopesticide businesses such as AgraQuest (now a part of Bayer), Certis USA (now a part of Mitsui), Novozymes and Valent Biosciences (now a part of Sumitomo). Many of these organizations have longer operating histories, significantly greater resources, greater brand recognition and a larger base of customers than we do. As a result, they may be able to devote greater resources to the manufacture, promotion or sale of their products, receive greater resources and support from independent distributors, initiate or withstand substantial price competition or more readily take advantage of acquisition or other opportunities. Further, many of the large agrichemical companies have a more diversified product offering than we do, which may give these companies an advantage in meeting customers’ needs by enabling them to offer a broader range of pest management solutions.
The market for our bio-based pest management and plant health products is underdeveloped, which may make it difficult to effectively market or price our products.
The market for bio-based pest management products is underdeveloped when compared with conventional chemical pesticides. Certain of our product lines, such as Zequanox, currently have few or no competitors, making it difficult to determine how we should determine their pricing. We may not be able to charge as much for such products as we currently plan. In addition, customers have historically perceived bio-based pest management products as more expensive and less effective than conventional chemical pesticides. To succeed, we will need to continue to change that perception. To the extent that the market for bio-based pest management products does not further develop or customers elect to continue to purchase and rely on conventional chemical pesticides, our market opportunity will be limited.
Public perception of consuming food with microbial residues and public perception of releasing microorganisms into the environment could damage our reputation and adversely impact sales of our microbial products.
We believe maintaining our strong reputation and favorable image with distributors, direct customers and end users will be a key component in our success. Although there has been a long history of safe use of bio-based pest management products based on microorganisms, adverse public reaction to the microbial nature of our products could harm our potential sales. In addition, perceptions that the products we produce and market are not safe could adversely affect us and contribute to the risk we will be subjected to legal action. For example, companies are frequently subject to litigation and negative press related to the release of chemicals into water systems, and our Zequanox water treatment product line may be subject to public scrutiny. Public perception that our products are not safe, whether justified or not, could impair our reputation, involve us in litigation, damage our brand names and have a material adverse effect on our business.
Our product sales are expected to be seasonal and subject to weather conditions and other factors beyond our control, which may cause our operating results to fluctuate significantly quarterly and annually.
Sales of our individual products are generally expected to be seasonal. Weather conditions and natural disasters affect decisions by our distributors, direct customers and end users about the types and amounts of pest management products to purchase and the timing of use of such products. In addition, disruptions that cause delays by growers in harvesting or planting can result in the movement of orders to a future quarter, which would negatively affect the quarter and cause fluctuations in our operating results. For example, we expect that our Regalia, Grandevo and Venerate product lines will be sold and applied to crops in greater quantity in the second and fourth quarters. These seasonal variations may be especially pronounced because sales have been primarily limited to our Regalia and Grandevo product lines in the Northern Hemisphere, and our Venerate product line has only been launched in the Northern Hemisphere. Our Regalia and Grandevo product lines accounted for 97%, 96%, 96% and 87% of our total revenues for the years ended December 31, 2013, 2012 and 2011 and the three months ended March 31, 2014, respectively. In addition, sales of products for treatment of invasive mussels are concentrated during periods of increased mussel growth and feeding activity, which occurs from June through September in the eastern United States, Canada and Europe and from April through October in the southwestern United States. However, planting
18
Table of Contents
and growing seasons, climatic conditions and other variables on which sales of our products are dependent vary from year to year and quarter to quarter. As a result, we have historically experienced substantial fluctuations in quarterly sales.
The level of seasonality in our business overall is difficult to evaluate as a result of our relatively early stage of development, our relatively limited number of commercialized products, our expansion into new geographical territories, the introduction of new products and the timing of introductions of new formulations and products. It is possible that our business may be more seasonal, or experience seasonality in different periods, than anticipated. For example, if sales of Zequanox become a more significant component of our revenue, the separate seasonal sales cycles of that product line could cause further shifts in our quarterly revenue. Other factors may also contribute to the unpredictability of our operating results, including the size and timing of significant distributor transactions, the delay or deferral of use of our products and the fiscal or quarterly budget cycles of our distributors, direct customers and end users. Customers may purchase large quantities of our products in a particular quarter to store and use over long periods of time or time their purchases to manage their inventories, which may cause significant fluctuations in our operating results for a particular quarter or year.
Our expense levels are based in part on our expectations regarding future sales. As a result, any shortfall in sales relative to our expectations could cause significant fluctuations in our operating results from quarter to quarter, which could result in uncertainty surrounding our level of earnings and possibly a decrease in our stock price.
If we are unable to identify new product candidates through our product development process, we may not achieve or maintain profitability.
Our future success will depend in part on our ability to improve our existing products and to utilize our product development process to identify and commercialize natural compounds with pesticidal activity. As of March 31, 2014, we have screened more than 18,000 microorganisms and 350 plant extracts, and we have identified multiple product candidates that display activity against insects, nematodes, weeds, plant diseases and invasive species such as zebra and quagga mussels, aquatic weeds and algae. Only a small number of these candidates are likely to provide viable commercial candidates and an even more limited number, if any, are likely to be commercialized by us. A failure by us to continue identifying natural compounds with pesticidal or plant health promoting activity could make it difficult to grow our business. In addition, we may continue to expand our product offerings through in-licensing of microorganisms and plant extracts. There is no assurance that these attempts will be successful. Licensing of products requires identification of new products or determination of new applications for existing products and a willingness on the product owner to license the product. If we are unable to identify or in-license additional microorganisms, natural product compounds or product candidates, we may be unable to develop new products or generate revenues.
Our results of operations will be affected by the level of royalty payments that we are required to pay to third parties.
We are a party to license agreements that require us to remit royalty payments related to in-licensed microorganisms and plant extracts for certain of our product lines such as Regalia, Grandevo and Zequanox. The amount of royalties that we could owe under these license agreements ranges from 2% to 5% of net product revenues. We cannot precisely predict the amount, if any, of royalties we will owe in the future, and if our calculations of royalty payments are incorrect, we may owe more royalties, which could negatively affect our results of operations. As our product sales increase, we may, from time-to-time, disagree with our third-party collaborators as to the appropriate royalties owed and the resolution of such disputes may be costly and may consume management’s time. Furthermore, we may enter into additional license agreements in the future, which may also include royalty payments.
We rely on third parties for the production of our products. If these parties do not produce our products at a satisfactory quality, in a timely manner, in sufficient quantities or at an acceptable cost, our development and commercialization efforts could be delayed or otherwise negatively impacted.
We do not currently produce our microbial and plant extract-based products other than at a small scale using our own facilities. As such, we rely on third parties for the production of our products. While we are developing our own internal commercial-scale manufacturing capacity, we may from time to time utilize third-party manufacturers for supplemental production capacity of our products. Our reliance on third parties to manufacture our products presents significant risks to us, including the following:
| n | reduced control over delivery schedules, yields and product reliability; |
19
Table of Contents
| n | price increases; |
| n | manufacturing deviations from internal and regulatory specifications; |
| n | the failure of a key manufacturer to perform its obligations to us for technical, market or other reasons; |
| n | challenges presented by introducing our fermentation processes to new manufacturers or deploying them in new facilities; |
| n | difficulties in establishing additional manufacturers if we are presented with the need to transfer our manufacturing process technologies to them; |
| n | misappropriation of our intellectual property; and |
| n | other risks in potentially meeting our product commercialization schedule or satisfying the requirements of our distributors, direct customers and end users. |
We have not entered into any long-term manufacturing or supply agreements for any of our products, and we will need to enter into additional agreements for the commercial development, manufacturing and sale of our products. There can be no assurance that we can do so on favorable terms, if at all.
Our products have been produced in quantities sufficient to meet commercial demand. However, our current dependence upon others for the production of our products, and our anticipated future dependence upon others for the production of a portion of our products, may adversely affect our ability to develop and commercialize any products on a timely and competitive basis. If manufacturing capacity is reduced or eliminated at one or more of our third-party manufacturers’ facilities, we could have difficulties fulfilling our customer orders, and our net revenues and results of operations could decline.
We must accurately forecast demand for our products to obtain adequate and cost-effective capacity from our third-party manufacturers and to purchase certain of the raw materials used in our products at cost-effective rates. Our third-party manufacturers are not required to supply us products until we place and they accept our purchase orders, which generally occurs approximately one month prior to the anticipated product delivery date based on our own rolling forecasts. Our purchase orders may not be accepted and our third-party manufacturers may not be willing to provide us with additional products on a timely basis if they prioritize orders placed by other companies, many of whom are more established than us and order larger volumes of products. In addition, while raw material orders are generally placed one month in advance, because certain of the raw materials used in our products are in short supply or are subject to capacity demands, we place some raw material orders approximately six months in advance to avoid paying higher prices. Accordingly, if we inaccurately forecast demand for our products, we may be unable to meet our customers’ delivery requirements, or we may accumulate excess inventories of products and raw materials.
We may experience significant delays in financing or completing the repurpose of our commercial manufacturing facility for producing some of our bio-based pest management and plant health products, which could result in harm to our business and prospects.
We acquired a manufacturing facility in July 2012, and our business plan contemplates completing an initial repurpose and upgrade of this facility to develop significant internal commercial manufacturing capacity. Phase 1 of the project includes installation of the first of three fermentation tanks, and the construction of a dedicated building to house them. In December 2013, we produced the first test batch of Grandevo at this facility and expect to begin full-scale production of our products using our own manufacturing capacity in the first half of 2014. Phase 1 will also include full-scale production of Regalia, which we successfully produced in small-scale in 2013, and Zequanox. Phase 2, which we may initiate as our business grows, will include increasing the capacity of the facility’s utilities, installing drying capacity and installing larger fermenters that will accommodate production of multiple products at higher volumes. We expect Phase 1 to fulfill our capacity needs through 2015. Our plan includes continuing to retain some contract manufacturers for emergency and risk mitigation. If we are unable to complete the repurpose, upgrade and expansion of this facility in a timely manner, we will need to otherwise secure access to capacity significantly greater than what we have previously used as we commercialize our products.
In order to bring our facility fully on line, we will need to complete design and other plans needed for the repurpose of the facility and secure the requisite permits, licenses and other governmental approvals, and we may not be successful in doing so. If we encounter significant delays, cost overruns, engineering problems, equipment supply constraints or other serious challenges in bringing the facility online, we may be unable to meet our production goals
20
Table of Contents
in the time frame we have planned. We may not be successful in producing the amount and quality of product we anticipate in the facility and our results of operations may suffer as a result. Further, we intend to continue to utilize various third-party contract manufacturers, which will reduce our ability to control product quality and the speed and timing of manufacturing, protect our proprietary position in our products and lower our manufacturing costs.
Failure to achieve expected manufacturing yields for our products could negatively impact our operating results.
Low yields may result from product design, development stage or process technology failures. We do not know whether a yield problem exists until our products are manufactured based on our design. When a yield issue is identified, the product is analyzed and tested to determine the cause. As a result, yield deficiencies may not be identified until well into the production process. We are repurposing our manufacturing facility acquired in July 2012 for high volume production and anticipate further expanding capacity at this facility, and we may experience delays or product yield issues as this facility comes online. In the event we continue to rely on third-party manufacturers, resolution of yield problems requires cooperation among, and communication between us and our manufacturers. We have limited experience producing a number of our products at commercial scale, and we will not succeed if we cannot maintain or decrease our production costs and effectively scale our technology and manufacturing processes.
We rely on a single supplier based in China for a key ingredient of Regalia.
The active ingredient in our Regalia product line is derived from the giant knotweed plant, which we obtain from China. Our single supplier acquires raw knotweed from numerous regional sources and performs an extraction process on this plant, creating a dried extract that is shipped to our third-party manufacturer in the United States. A disruption at our supplier’s manufacturing site or a disruption in trade between the United States and China could negatively impact sales of Regalia. We currently use one supplier and do not have a long-term supply contract with this supplier. Although we have identified additional sources of knotweed, there can be no assurance that we will continue to be able to obtain dried extract from China at a competitive price point.
We have limited experience in marketing and selling our products and will need to expand our sales and marketing infrastructure.
We currently have limited sales and marketing experience and capabilities. As of March 31, 2014, we employed 31 full-time equivalent sales and marketing personnel, 23 of which focus on technical support and demonstration and research field trials. We will need to further develop our sales and marketing capabilities in order to successfully commercialize Zequanox, Opportune, Venerate and other products we are developing, which may involve substantial costs. Our internal sales and marketing staff consists primarily of sales and marketing specialists and field development specialists who are trained to educate growers and independent distributors on the uses and benefits of our products. These specialists require a high level of technical expertise and knowledge regarding the capabilities of our products compared with other pest management products and techniques. There can be no assurance that our specialists and other members of our sales and marketing team will successfully compete against the sales and marketing teams of our current and future competitors, many of which may have more established relationships with distributors and growers. Our inability to recruit, train and retain sales and marketing personnel or their inability to effectively market and sell the products we are developing could impair our ability to gain market acceptance of our products and cause our sales to suffer.
If we are unable to maintain and further establish successful relations with the third-party distributors that are our principal customers, or they do not focus adequate resources on selling our products or are unsuccessful in selling them to end users, sales of our products would decline.
In the United States, we rely on independent distributors of agrichemicals such as Crop Production Services and Wilbur Ellis to distribute and assist us with the marketing and sale of Regalia, Grandevo and other products we are developing. These distributors are our principal customers, and our future revenues growth will depend in large part on our success in establishing and maintaining this sales and distribution channel. If our distributors are unable to sell our products, or receive negative feedback from end users, they may not continue to purchase or market our products. In addition, our products are often combined with other pesticides. If our products are improperly combined with other pesticides they may damage the treated plants, and, even when properly combined, our products may be blamed for damage caused by these other pesticides. Any such issues could damage our brands or reputation.
21
Table of Contents
In addition, there can be no assurance that our distributors will focus adequate resources on selling our products to end users or will be successful in selling them. Many of our potential distributors are in the business of distributing and sometimes manufacturing other, possibly competing, pest management products. As a result, these distributors may perceive our products as a threat to various product lines currently being distributed or manufactured by them. In addition, these distributors may earn higher margins by selling competing products or combinations of competing products. If we are unable to establish or maintain successful relationships with independent distributors, we will need to further develop our own sales and distribution capabilities, which would be expensive and time-consuming and the success of which would be uncertain.
We depend on a limited number of distributors, some of whom are related parties.
Our current revenues are derived from a limited number of key customers, each of which serves as a third-party distributor to our products’ end users. For the year ended December 31, 2013, our top two distributors accounted for 38% of our total revenues, with Crop Production Services and The Tremont Group accounting for 28% and 10% of our total revenues, respectively. The Tremont Group is an affiliate of Les Lyman, who is a member of our board. For the year ended December 31, 2012, our top three distributors accounted for 58% of our total revenues, with Crop Production Services, Engage Agro and Helena Chemical accounting for 33%, 13% and 12% of our total revenues, respectively. For the three months ended March 31, 2014, our top five distributors accounted for 66% of our total revenues, with Crop Production Services, Reister’s, The Tremont Group, Growmark and Helena Chemicals accounting for 17%, 15%, 12%, 11% and 11%, respectively. We expect a limited number of distributors, some of whom may be related parties, to continue to account for a significant portion of our revenues for the foreseeable future. This customer concentration increases the risk of quarterly fluctuations in our revenues and operating results. The loss or reduction of business from one or a combination of our significant distributors could materially adversely affect our revenues, financial condition and results of operations.
We rely on the experience and expertise of our senior management team and other key personnel, and if we are unable to recruit or retain qualified personnel, our development and commercialization efforts may be significantly delayed.
We depend heavily on the principal members of our management, particularly Dr. Pamela G. Marrone, our founder, President and Chief Executive Officer, the loss of whose services might significantly delay or prevent the achievement of our scientific or business objectives. Although we maintain and are the beneficiary of $15.0 million in key person life insurance policies for the life of Dr. Marrone, we do not believe the proceeds would be adequate to compensate us for her loss.
As we expand our operations, we will need to hire additional qualified research and development and management personnel to succeed. The process of hiring, training and successfully integrating qualified personnel into our operation is a lengthy and expensive one. The market for qualified personnel such as experienced fermentation engineers and formulation chemists is very competitive because of the limited number of people available with the necessary technical skills and understanding of our technology and anticipated products. Our failure to hire and retain qualified personnel could impair our ability to meet our research and development and business objectives and adversely affect our results of operations and financial condition.
We also have relationships with scientific collaborators at academic and other institutions, some of whom conduct research at our request or assist us in formulating our research and development strategy. These scientific collaborators are not our employees and may have commitments to, or consulting or advisory contracts with, other entities that may limit their availability to us. We have limited control over the activities of these scientific collaborators and can generally expect these individuals to devote only limited amounts of time to our activities. The inability of any of these persons to devote sufficient time and resources to our programs could harm our business. In addition, these collaborators may have arrangements with other companies to assist those companies in developing technologies that may compete with our products.
Our intellectual property is integral to our business. If we are unable to protect our patents and proprietary rights in the United States and foreign countries, our business could be adversely affected.
Our success depends in part on our ability to obtain and maintain patent and other proprietary rights protection for our technologies and products in the United States and other countries. If we are unable to obtain or maintain these protections, we may not be able to prevent third parties from using our proprietary rights. It is also possible that we
22
Table of Contents
will fail to identify patentable aspects of our research and development output before it is too late to obtain patent protection. As of March 31, 2014, we had 10 issued U.S. patents and 20 issued foreign patents (of which 5 U.S. patents and 10 foreign patents were in-licensed), 36 pending provisional and non-provisional patent applications (of which 2 were in-licensed), and 267 pending foreign patent applications (of which 6 were in-licensed).
The patent position of biotechnology and biochemical companies generally is highly uncertain, involves complex legal and factual questions and has in recent years been the subject of much litigation. As a result, the issuance, scope, validity, enforceability and commercial value of our patent rights are highly uncertain. Our pending and future patent applications may not result in patents being issued which protect our technology or products, in whole or in part, or which effectively prevent others from commercializing competitive technologies and products. Changes in either the patent laws or interpretation of the patent laws in the United States and other countries may diminish the value of our patents or narrow the scope of our patent protection. The laws of some foreign countries do not protect proprietary rights to the same extent as the laws of the United States, and we may encounter significant problems and costs in protecting our proprietary rights in these foreign countries.
Our patents and those patents for which we have license rights may be challenged, narrowed, invalidated or circumvented. In addition, our issued patents may not contain claims sufficiently broad to protect us against third parties with similar technologies or products or provide us with any competitive advantage. We are not certain that our pending patent applications will be issued. Moreover, our competitors could challenge or circumvent our patents or pending patent applications. It is also not possible to patent and protect all knowledge and know-how associated with our products so there may be areas that are not protected such as certain formulations and manufacturing processes. Costly and time-consuming litigation could be necessary to enforce and determine the scope of our proprietary rights, and failure to obtain or maintain trade secret protection could adversely affect our competitive business position.
For certain of our products, we hold co-exclusive licenses to certain of the intellectual property related to these products. Although our products that are derived from intellectual property licensed to us on a co-exclusive basis also include our own proprietary technology, the third parties with whom we share co-exclusive rights may develop products based on the same underlying intellectual property. This could adversely affect the sale of our products.
Intellectual property litigation could cause us to spend substantial resources and could distract our personnel from their normal responsibilities.
Even if resolved in our favor, litigation or other legal proceedings relating to intellectual property claims may cause us to incur significant expenses, and could distract our technical and management personnel from their normal responsibilities. In addition, there could be public announcements of the results of hearings, motions or other interim proceedings or developments. If securities analysts or investors perceive these results to be negative, it could have a substantial adverse effect on the price of our common stock. Such litigation or proceedings could substantially increase our operating losses and reduce the resources available for development, sales, marketing or distribution activities. We may not have sufficient financial or other resources to adequately conduct such litigation or proceedings. Some of our competitors may be able to sustain the costs of such litigation or proceedings more effectively than we can because of their greater financial resources. Uncertainties resulting from the initiation and continuation of patent litigation or other proceedings could have a material adverse effect on our ability to compete in the marketplace.
If we are unable to protect the confidentiality of our trade secrets, our business and competitive position could be harmed.
We have taken measures to protect our trade secrets and know-how, including the use of confidentiality agreements with our employees, consultants, advisors and third-party manufacturers. It is possible that these agreements may be breached and that any remedies for a breach will not make us whole. In addition, some courts inside and outside of the United States are less willing or unwilling to protect trade secrets. We generally control and limit access to, and the distribution of, our product documentation and other proprietary information. Despite our efforts to protect these proprietary rights, our trade secret-protected know-how could fall into the public domain, unauthorized parties may copy aspects of our products and obtain and use information that we regard as proprietary. We also cannot guarantee that other parties will not independently develop our knowhow or otherwise obtain access to our technologies.
23
Table of Contents
Third parties may misappropriate our microbial strains.
Third parties, including contract manufacturers, often have custody or control of our microbial strains. If our microbial strains were stolen, misappropriated or reverse engineered, they could be used by other parties who may be able to reproduce the microbial strains for their own commercial gain. If this were to occur, it would be difficult for us to challenge and prevent this type of use, especially in countries with limited intellectual property protection.
Other companies may claim that we infringe their intellectual property or proprietary rights, which could cause us to incur significant expenses or prevent us from selling our products.
Our success depends in part on our ability to operate without infringing the patents and proprietary rights of third parties. Product development is inherently uncertain in a rapidly evolving technological environment such as ours in which there may be numerous patent applications pending, many of which are confidential when filed, with regard to similar technologies. Patents issued to third parties may contain claims that conflict with our patents and that may place restrictions on the commercial viability of our products and technologies. Third parties could assert infringement claims against us in the future. We may become party to, or threatened with, future adversarial proceedings or litigation regarding intellectual property rights with respect to our products, product candidates and technology. We may not be aware of all such third-party intellectual property rights potentially relevant to our products and product candidates.
Any litigation, adversarial proceeding or proceeding before governmental authorities regarding intellectual property rights, regardless of its outcome, would probably be costly and require significant time and attention of our key management and technical personnel. Litigation, adversarial proceedings or proceedings before governmental authorities could also force us to:
| n | stop or delay using our proprietary screening technology; |
| n | stop or delay selling, manufacturing or using products that incorporate the challenged intellectual property; |
| n | pay damages; and/or |
| n | enter into licensing or royalty agreements which, if available at all, may only be available on unfavorable terms. |
Claims that we have misappropriated the confidential information or trade secrets of third parties could have a similar negative impact on our business.
If we fail to maintain and successfully manage our existing, or enter into new, strategic collaborations and other relationships, we may not be able to expand commercial development and sales of many of our products.
Our ability to enter into, maintain and manage collaborations and other relationships in our markets is fundamental to the success of our business. We currently have entered into various license agreements, research and development agreements, supply agreements and distribution agreements. We currently rely on our third parties for manufacturing and sales or marketing services and intend to continue to do so for the foreseeable future, and we intend to enter into other strategic agreements to produce, market and sell other products we develop. However, we may not be successful in entering into new arrangements with third parties for the production, sale and marketing of other products. Any failure to enter into new strategic arrangements on favorable terms or to maintain or manage our existing strategic arrangements could delay or hinder our ability to develop and commercialize our products and could increase our costs of development and commercialization.
We expect to derive a portion of our revenues from markets outside the United States, including Europe and Latin America, which will subject us to additional business risks.
Our success depends in part on our ability to expand internationally as we obtain regulatory approvals to market and sell our products in foreign countries. For the year ended December 31, 2013, 2012 and 2011 and the three months ended March 31, 2014, international sales comprised 8%, 20%, 7% and 5% of total revenues, respectively, and we expect to increase the relative percentage of international sales in the future. We have been conducting field trials in Europe, Latin America, Africa and elsewhere. International expansion of our operations could impose substantial burdens on our resources, divert management’s attention from domestic operations and otherwise harm our business. Furthermore, international operations are subject to several inherent risks, especially different regulatory requirements and reduced protection of intellectual property rights that could adversely affect our ability
24
Table of Contents
to compete in international markets and have a negative effect on our operating results. Revenues generated outside the United States could also result in increased difficulty in collecting delinquent or unpaid accounts receivables, adverse tax consequences and currency fluctuations.
Our Zequanox product line requires additional development, and during the initial commercialization of Zequanox, we will be relying on successful bidding for government contracts, which could require a longer sales cycle than the private sector.
Our Zequanox product line is principally designed to kill invasive mussels that restrict critical water flow in industrial and power facilities and impinge on access to recreational waters. This product requires additional development to improve ease of application, and because this product will be used in open waters, it may also require additional ecological testing. We expect our near-term sales of Zequanox will continue to be to governmental agencies and regulated industries, which typically take longer to negotiate and approve contracts than the private sector. Further, we currently expect that our governmental sales may be subject to bidding procedures as well as uncertainties surrounding these agencies’ budget approval processes. Therefore, we anticipate that the sales cycle for Zequanox will continue to be longer than that for our pest management products sold into agricultural markets.
We may require additional financing in the future and may not be able to obtain such financing on favorable terms, if at all, which could force us to delay, reduce or eliminate our research and development activities.
We may need to raise more money to continue our operations or to enter into strategic transactions, and we may make significant capital expenditures in connection with scaling up our operations, including, for example, the repurpose of our manufacturing facility. We may seek additional funds from public and private stock offerings, corporate collaborations and licenses, borrowings under lease lines of credit or other sources. Additional capital may not be available on terms acceptable to us, or at all. Any additional equity financing may be dilutive to stockholders, and debt financing, if available, may include restrictive covenants. If we cannot raise more money when needed, we may have to reduce our capital expenditures, scale back our development of new products, reduce our workforce or license to others products that we otherwise would seek to commercialize ourselves. Moreover, our cash used in operations has exceeded cash generated from operations in each period since our inception. We used approximately $34.0 million, $22.4 million, $12.4 million and $9.9 million of net cash used in operating activities for the years ended December 31, 2013, 2012 and 2011 and the three months ended March 31, 2014, respectively. In addition, for the years ended December 31, 2013, 2012 and 2011 and the three months ended March 31, 2014, we incurred expenses of $17.8 million, $12.7 million, $9.4 million and $4.3 million, respectively, for research, development and patent related costs. We expect that our current resources and future operating revenue, together with the net proceeds from this offering, will be sufficient to fund operations for at least the next 24 months. We may attempt to raise additional capital due to market conditions or strategic considerations even if we have sufficient funds for planned operations.
We use hazardous materials in our business and are subject to potential liability under environmental laws. Any claims relating to improper handling, storage or disposal of hazardous materials could be time consuming and costly to resolve.
We are subject to federal, state and local laws and regulations governing the use, manufacture, storage, handling, disposal and release of hazardous materials and certain waste products. Our research and development and manufacturing activities involve the controlled use of hazardous materials and biological waste. Some of these materials may be novel, including bacteria with novel properties and bacteria that produce biologically active compounds. We cannot eliminate the risk of accidental contamination or discharge and any injury resulting from these materials. In addition, although we have not currently identified any environmental liabilities, the manufacturing facility we purchased in July 2012 may have existing environmental liabilities associated with it that may also result in successor liabilities for us, and we will be subject to increased exposure to potential environmental liabilities as we manufacture our products on a larger scale. We may also be held liable for hazardous materials brought onto the premises of our manufacturing facility before we acquired title, without regard for fault for, or knowledge of, the presence of such substances, as well as for hazardous materials that may be discovered after we no longer own the property if we sell it in the future. In the event of an accident, or if any hazardous materials are found within our operations or on the premises of our manufacturing facility in violation of the law at any time, we may be liable for all cleanup costs, fines, penalties and other costs. This liability could exceed our resources, and, if significant losses arise from hazardous substance contamination, our financial viability may be substantially and adversely affected.
25
Table of Contents
In addition, we may have to incur significant costs to comply with future environmental laws and regulations. In addition, we cannot predict the impact of new governmental regulations that might have an adverse effect on the research, development, production and marketing of our products. We may be required to incur significant costs to comply with current or future laws or regulations. Our business may be harmed by the cost of compliance.
Our collaborators may use hazardous materials in connection with our collaborative efforts. To our knowledge, their work is performed in accordance with applicable biosafety regulations. In the event of a lawsuit or investigation, however, we could be held responsible for any injury caused to persons or property by exposure to, or release of, hazardous materials used by these parties. Further, we may be required to indemnify our collaborators against all damages and other liabilities arising out of our development activities or products produced in connection with these collaborations.
Any decline in U.S. agricultural production could have a material adverse effect on the market for pesticides and on our results of operations and financial position.
Conditions in the U.S. agricultural industry significantly impact our operating results. The U.S. agricultural industry can be affected by a number of factors, including weather patterns and field conditions, current and projected grain inventories and prices, domestic and international demand for U.S. agricultural products and U.S. and foreign policies regarding trade in agricultural products. State and federal governmental policies, including farm subsidies and commodity support programs, as well as the prices of fertilizer products and the prices at which produce may be sold, may also directly or indirectly influence the number of acres planted, the mix of crops planted and the use of pesticides for particular agricultural applications. There are various proposals pending before the U.S. Congress to cut or eliminate various agricultural subsidies. If such proposals are implemented, they may adversely impact the U.S. agricultural industry and suppliers to that industry such as us.
Our headquarters and facility and certain manufacturers and suppliers are located in regions that are subject to natural disasters, as well as in some cases geopolitical risks and social upheaval.
Our Davis, California headquarters and facility is located near a known earthquake fault. The impact of a major earthquake or other natural disaster, including floods, on our facilities, infrastructure and overall operations is difficult to predict and any natural disaster could seriously disrupt our entire business process. In addition, Regalia is produced by a third-party manufacturer in Florida in a location that could be impacted by hurricane activity, and certain of our raw materials are sourced in China, which is subject to risks associated with uncertain political, economic and other conditions such as the outbreak of contagious diseases, such as avian flu, swine flu and SARS, and natural disasters. The insurance we maintain may not be adequate to cover our losses resulting from natural disasters or other business interruptions. Although these risks have not materially adversely affected our business, financial condition or results of operations to date, there can be no assurance that such risks will not do so in the future.
Inability to comply with regulations applicable to our facilities and procedures could delay, limit or prevent our research and development or manufacturing activities.
Our research and development and manufacturing facilities and procedures are subject to continual review and periodic inspection. We must spend funds, time and effort in the areas of production, safety and quality control and assurance to ensure full technical compliance with the regulations applicable to these facilities and procedures. If the EPA or another regulatory body determines that we are not in compliance with these regulations, regulatory approval of our products could be delayed or we may be required to limit or cease our research and development or manufacturing activities or pay a monetary fine. If we are required to limit or cease our research and development activities, our ability to develop new products would be impaired. In addition, if we are required to limit or cease our manufacturing activities, our ability to produce our products in commercial quantities would be impaired or prohibited, which would harm our business.
We may be exposed to product liability and remediation claims, which could harm our business.
The use of certain bio-based pest management and plant health products is regulated by various local, state, federal and foreign environmental and public health agencies. These regulations may include requirements that only certified or professional users apply the product or that certain products be used only on certain types of locations, may require users to post notices on properties to which products have been or will be applied, may require notification to individuals in the vicinity that products will be applied in the future or may ban the use of certain ingredients. Even if we are able to comply with all such regulations and obtain all necessary registrations, we cannot
26
Table of Contents
provide assurance that our products will not cause injury to crops, the environment or people under all circumstances. For example, our products may be improperly combined with other pesticides or, even when properly combined, our products may be blamed for damage caused by these other pesticides. The costs of remediation or products liability could materially adversely affect our future quarterly or annual operating results.
We may be held liable for, or incur costs to settle, liability and remediation claims if any products we develop, or any products that use or incorporate any of our technologies, cause injury or are found unsuitable during product testing, manufacturing, marketing, sale or use. These risks exist even with respect to products that have received, or may in the future receive, regulatory approval, registration or clearance for commercial use. We cannot guarantee that we will be able to avoid product liability exposure.
We currently maintain product liability insurance at levels we believe are sufficient and consistent with industry standards for companies at our stage of development. We cannot guarantee that our product liability insurance is adequate and, at any time, it is possible that this insurance coverage may not be available on commercially reasonable terms or at all. A product liability claim could result in liability to us greater than our assets or insurance coverage. Moreover, even if we have adequate insurance coverage, product liability claims or recalls could result in negative publicity or force us to devote significant time and attention to those matters, which could harm our business.
We have identified a material weakness in our internal control over financial reporting, which existed as of December 31, 2013, and has not been adequately remediated as of March 31, 2014. If we fail to properly remediate this or any future weaknesses or deficiencies or maintain proper and effective internal controls, our ability to produce accurate and timely financial statements could be impaired and investors’ views of us could be harmed.
While preparing our financial statements for the three months ended March 31, 2014, we have determined that we have a material weakness in our internal control over financial reporting, which also existed as of December 31, 2013. We discovered that we did not have effective controls to prevent or detect an instance where the product shipped was not the same as the product ordered by a customer. This material weakness did not result in a material error or a restatement of our consolidated financial statements included in this prospectus.
We have developed, and are currently implementing, a plan to remediate this material weakness, which includes, among other things, training our personnel who handle customer shipments to compare product ordered to product selected in the inventory records prior to shipment and comparison of product ordered to product removed from inventory prior to invoicing, which would enhance our ability to prevent the wrong product from being shipped and to detect if the wrong product has been shipped prior to invoicing.
Although we are undertaking steps to address this material weakness, the existence of a material weakness is an indication that there is more than a remote likelihood that a material misstatement of our financial statements will not be prevented or detected in the current or any future period. There can be no assurance that we will be able to fully implement our plans and controls to address this material weakness, or that the plans and controls, if implemented, will be successful in fully remediating this material weakness. In addition, we may in the future identify further material weaknesses in our internal control over financial reporting that we have not discovered to date. If we fail to successfully remediate the identified material weakness, or we identify further material weaknesses in our internal controls, the market’s confidence in our financial statements could decline and the market price of our common stock could be adversely impacted.
Our ability to use our net operating loss carry-forwards to offset future taxable income may be subject to certain limitations.
As of December 31, 2013, we had approximately $77.7 million of federal and $73.5 million of state operating loss carry-forwards available to offset future taxable income, which expire in varying amounts beginning in 2026 for federal and 2016 for state purposes if unused. It is possible that we will not generate taxable income in time to use these loss carry-forwards before their expiration. As of December 31, 2013 and 2012, all deferred tax assets were fully offset by a valuation allowance for financial purposes.
Section 382 of the Internal Revenue Code imposes restrictions on the use of a corporation’s net operating losses, as well as certain recognized built-in losses and other carryforwards, after an “ownership change” occurs. A Section 382 “ownership change” occurs if one or more stockholders or groups of stockholders who own at least 5% of our stock increase their ownership by more than 50 percentage points over their lowest ownership percentage
27
Table of Contents
within a rolling three-year period. The issuance of common stock pursuant to this offering and/or future issuances or sales of our stock (including certain transactions involving our stock that are outside of our control) could result in an ownership change under Section 382. If an “ownership change” occurs, Section 382 would impose an annual limit on the amount of pre-change net operating losses and other losses we can use to reduce our taxable income generally equal to the product of the total value of our outstanding equity immediately prior to the “ownership change” (subject to certain adjustments) and the applicable federal long-term tax-exempt interest rate for the month of the “ownership change.” The applicable rate for ownership changes occurring in the month of May 2014 was 3.36%.
Because U.S. federal net operating losses generally may be carried forward for up to 20 years, the annual limitation may effectively provide a cap on the cumulative amount of pre-ownership change losses, including certain recognized built-in losses that may be utilized. Such pre-ownership change losses in excess of the cap may be lost. In addition, if an ownership change were to occur, it is possible that the limitations imposed on our ability to use pre-ownership change losses and certain recognized built-in losses could cause a net increase in our U.S. federal income tax liability and U.S. federal income taxes to be paid earlier than otherwise would be paid if such limitations were not in effect. Further, if the amount or value of these deferred tax assets is reduced, such reduction would have a negative impact on the book value of our common stock.
We completed a Section 382 analysis as of December 31, 2013 and concluded that approximately $0.5 million in federal net operating losses and approximately $0.2 million in federal research and development credits are expected to expire prior to utilization as a result of our previous ownership changes and corresponding annual limitations. We have not conducted an analysis to determine the amount of state net operating losses that are also expected to expire prior to utilization. Our existing net operating loss carry-forwards or credits may be subject to significant limitations due to events occurring since December 31, 2013, and we have not updated our Section 382 analysis to consider events since December 31, 2013, including the effect of issuing common stock pursuant to this offering. Our inability to use these net operating loss carry-forwards as a result of the Section 382 limitations could harm our financial condition.
Our business is subject to various governmental regulations, and compliance with these regulations may cause us to incur significant expenses. If we fail to maintain compliance with applicable regulations, we may be forced to recall products and cease their manufacture and distribution, which could subject us to civil or criminal penalties.
The complex legal and regulatory environment exposes us to compliance and litigation costs and risks that could materially affect our operations and financial results. These laws and regulations may change, sometimes significantly, as a result of political or economic events. They include environmental laws and regulations, tax laws and regulations, import and export laws and regulations, government contracting laws and regulations, labor and employment laws and regulations, securities and exchange laws and regulations, and other laws such as the Foreign Corrupt Practices Act. In addition, proposed laws and regulations in these and other areas could affect the cost of our business operations. We face the risk of changes in both domestic and foreign laws regarding trade, potential loss of proprietary information due to piracy, misappropriation or foreign laws that may be less protective of our intellectual property rights. Violations of any of these laws and regulations could subject us to criminal or civil enforcement actions, any of which could have a material adverse effect on our business, financial condition or results of operations.
Risks Related to this Offering and Ownership of our Common Stock
The concentration of our capital stock ownership with our executive officers and directors, and their respective affiliates, will limit your ability to influence corporate matters.
As of March 31, 2014, our executive officers and directors and their affiliates beneficially owned or controlled, directly or indirectly, an aggregate of approximately 5.2 million shares, or 25.7%, of our common stock. This concentrated control will limit the ability for other stockholders to influence some corporate matters and could result in some corporate actions that our other stockholders do not view as beneficial such as failure to approve change of control transactions that could offer holders of our common stock a premium over the market value of our company. As a result, the market price of our common stock could be adversely affected.
28
Table of Contents
Our common stock may experience extreme price and volume fluctuations, and you may not be able to resell shares of our common stock at or above the price you paid.
We are an early stage company with a limited operating history and a history of losses. Since shares of our common stock were sold in our initial public offering in August 2013 at a price of $12.00 per share, our stock price has ranged between $8.21 and $20.00 through May 30, 2014. The trading price of our common stock will likely continue to be highly volatile and could be subject to wide fluctuations in price in response to various factors, some of which are beyond our control. These factors include:
| n | our small public float relative to the total number of shares of common stock that are issued and outstanding; |
| n | quarterly variations in our results of operations, those of our competitors or those of our customers; |
| n | announcements of technological innovations, new products or services or new commercial relationships by us or our competitors; |
| n | our ability to develop and market new products on a timely basis; |
| n | disruption to our operations; |
| n | media reports and publications about pest management products; |
| n | announcements concerning our competitors or the pest management industry in general; |
| n | our entry into, modification of or termination of key license, research and development or collaborative agreements; |
| n | new regulatory pronouncements and changes in regulatory guidelines or the status of our regulatory approvals; |
| n | general and industry-specific economic conditions; |
| n | any major change in our board of directors or management; |
| n | commencement of, or our involvement in, litigation; |
| n | changes in financial estimates, including our ability to meet our future net revenues and operating profit or loss projections; and |
| n | changes in earnings estimates or recommendations by securities analysts. |
In the past, securities class action litigation has often been brought against companies that experience volatility in the market price of their securities. Whether or not meritorious, litigation brought against us could result in substantial costs, divert management’s attention and resources and harm our business.
If securities analysts or industry analysts downgrade our shares, publish negative research or reports, or do not publish reports about our business, our share price and trading volume could decline.
The trading market for our common stock is influenced by the research and reports that industry or securities analysts publish about us, our business and our industry. If one or more analysts adversely change their recommendation regarding our shares or our competitors’ stock, our share price would likely decline. If one or more analysts cease coverage of us or fail to regularly publish reports on us, we could lose visibility in the financial markets, which in turn could cause our share price or trading volume to decline.
Substantial future sales of our common stock, or the perception in the public markets that these sales may occur, may depress our stock price.
Sales of substantial amounts of our common stock in the public market after this offering, or the perception that these sales could occur, could adversely affect the price of our common stock and could impair our ability to raise capital through the sale of additional shares. Upon completion of this offering, we will have 23,107,001 shares of common stock outstanding, based on 19,707,001 shares outstanding as of March 31, 2014 and 3,400,000 shares to be sold by us in the offering. All of the shares to be sold in this offering, in addition to all 5,462,500 shares of common stock sold in our initial public offering, will be upon completion of this offering, or are, freely tradable, without restriction under the Securities Act, except for any shares of our common stock that may be held or acquired by our directors, executive officers and other affiliates, as that term is defined in the Securities Act, which will be restricted securities under the Securities Act, but which may be eligible for public sale if they qualify for an exemption from registration under Rule 144 of the Securities Act. In addition, 12,688,840 shares became eligible for sale in the public market
29
Table of Contents
after the expiration of lock-up agreements on January 28, 2014, to the extent they qualify for an exemption from registration under Rule 144 or Rule 701 under the Securities Act, and in September 2013, we filed a registration statement on Form S-8 under the Securities Act covering 3,987,910 shares of our common stock for issuance under our equity incentive plans that may be sold in the public market upon issuance and once vested.
We, the selling stockholder, certain of our shareholders and all of our directors and executive officers have agreed, subject to certain exceptions, not to sell or transfer any common stock, or securities convertible into, exchangeable for, exercisable for, or repayable with common stock, for 90 days (for the selling stockholder, certain shareholders and directors) or 180 days (for executive officers) after the date of this prospectus, without first obtaining written consent of each of Jefferies LLC and Piper Jaffray & Co., representatives of the underwriters. See “Underwriting.” In addition, we have entered into agreements with certain security holders that contain market stand-off provisions imposing restrictions on the ability of such security holders to offer, sell or transfer 762,815 of our shares until or after August 1, 2014.
If our existing stockholders sell substantial amounts of our common stock in the public market, or if the public perceives that such sales could occur, there could be an adverse impact on the market price of our common stock, even if there is no relationship between such sales and the performance of our business. See “Shares Eligible for Future Sale” for a more detailed description of the restrictions on selling shares of our common stock after this offering.
We will have broad discretion in how we use the net proceeds from this offering.
We currently intend to use the net proceeds we receive from this offering for working capital required to accelerate growth, including product development, commercialization and distribution matters, for capital expenditures, including to purchase equipment and accelerate completion of the manufacturing facility we acquired in July 2012, and for general corporate purposes, such as acquiring complementary businesses, products or technologies, as described in the “Use of Proceeds” section of this prospectus. However, we do not have more specific plans for the net proceeds from this offering and will have broad discretion in how we use the net proceeds of this offering. These proceeds could be applied in ways that do not improve our operating results or increase the value of your investment. You may not have the opportunity to influence our decisions on how to use the net proceeds from this offering.
Because we have no plans to pay dividends on our common stock, investors must look solely to stock appreciation for a return on their investment in us.
We have never declared or paid any cash dividends on our capital stock, and we do not anticipate paying any cash dividends on our common stock in the foreseeable future. We currently intend to retain all future earnings to fund the development and growth of our business. Any payment of future dividends will be at the discretion of our board of directors and will depend on, among other things, our earnings, financial condition, capital requirements, level of indebtedness, statutory and contractual restrictions applying to the payment of dividends and other considerations that the board of directors deems relevant. Investors must rely on sales of their common stock after price appreciation, which may never occur, as the only way to realize a return on their investment. Investors seeking cash dividends should not purchase our common stock.
We are an “emerging growth company” and we cannot be certain if the reduced disclosure requirements applicable to emerging growth companies will make our common stock less attractive to investors.
We are an “emerging growth company” as defined in the JOBS Act. For as long as we continue to be an emerging growth company we may choose to take advantage of certain exemptions from various reporting requirements applicable to other public companies but not to emerging public companies, which includes, among other things:
| n | exemption from the auditor attestation requirements under Section 404 of the Sarbanes-Oxley Act of 2002; |
| n | reduced disclosure obligations regarding executive compensation in our periodic reports and proxy statements; |
| n | exemption from the requirements of holding non-binding stockholder votes on executive compensation arrangements; and |
| n | exemption from any rules requiring mandatory audit firm rotation and auditor discussion and analysis and, unless the SEC otherwise determines, any future audit rules that may be adopted by the Public Company Accounting Oversight Board. |
30
Table of Contents
We could be an emerging growth company until the last day of the fiscal year following the fifth anniversary after our initial public offering, or until the earliest of (i) the last day of the fiscal year in which we have annual gross revenues of $1 billion or more, (ii) the date on which we have, during the previous three year period, issued more than $1 billion in non-convertible debt or (iii) the date on which we are deemed to be a large accelerated filer under the federal securities laws. We will qualify as a large accelerated filer as of the first day of the first fiscal year after we have (i) more than $700 million in outstanding common equity held by our non-affiliates and (ii) been public for at least 12 months. The value of our outstanding common equity will be measured each year on the last day of our second fiscal quarter.
Under the JOBS Act, emerging growth companies are also permitted to elect to delay adoption of new or revised accounting standards until companies that are not subject to periodic reporting obligations are required to comply, if such accounting standards apply to non-reporting companies. We have made an irrevocable decision to opt out of this extended transition period for complying with new or revised accounting standards.
Investors may find our common stock less attractive as a result of our reliance on these exemptions, which may promote a less active trading market for our common stock and increase stock price volatility.
We will continue to incur significant increased costs as a result of operating as a public company, and our management will be required to devote substantial time to comply with the laws and regulations affecting public companies, particularly after we are no longer an “emerging growth company.”
As a newly public company, particularly after we cease to qualify as an emerging growth company, we will continue to incur significant legal, accounting and other expenses that we did not incur as a private company, including costs associated with public company reporting and corporate governance requirements, in order to comply with the rules and regulations imposed by the Sarbanes-Oxley Act, as well as rules implemented by the SEC and The Nasdaq Global Market. Our management and other personnel will need to devote a substantial amount of time to these compliance initiatives and our legal and accounting compliance costs will increase. We may need to hire additional staff or consultants in the areas of investor relations, legal and accounting to operate as a public company. We also expect that these new rules and regulations may make it more difficult and expensive for us to obtain director and officer liability insurance, and we may be required to accept reduced policy limits and coverage or incur substantially higher costs to obtain the same or similar coverage. As a result, it may be more difficult for us to attract and retain qualified individuals to serve on our board of directors or as executive officers. We are currently evaluating and monitoring developments with respect to these rules, and we cannot predict or estimate the amount of additional costs we may incur or the timing of such costs.
For example, the Sarbanes-Oxley Act requires, among other things, that we maintain effective internal controls over financial reporting and disclosure controls and procedures. In particular, as a public company, we are required to perform system and process evaluations and testing of our internal control over financial reporting to allow management and our independent registered public accounting firm to report on the effectiveness of our internal controls over financial reporting, as required by Section 404 of the Sarbanes-Oxley Act. As described above, as an emerging growth company, we will not need to comply with the auditor attestation provisions of Section 404 for several years. Our testing, or the subsequent testing by our independent registered public accounting firm, may reveal deficiencies in our internal control over financial reporting that are deemed to be material weaknesses. Our compliance with Section 404 will require that we incur substantial accounting expense and management time on compliance-related issues. Moreover, if we are not able to comply with the requirements of Section 404 in a timely manner, or if we or our independent registered public accounting firm identify deficiencies in our internal control over financial reporting that are deemed to be material weaknesses, we could lose investor confidence in the accuracy and completeness of our financial reports, which could cause our stock price to decline.
When the available exemptions under the JOBS Act, as described above, cease to apply, we expect to incur additional expenses and devote increased management effort toward ensuring compliance with them. We cannot predict or estimate the amount of additional costs we may incur as a result of becoming a public company or the timing of such costs.
31
Table of Contents
Provisions in our charter documents and under Delaware law could discourage a takeover that stockholders may consider favorable.
Provisions in our amended and restated certificate of incorporation and bylaws may have the effect of delaying or preventing a change of control or changes in our management. These provisions include the following:
| n | the right of our board of directors to elect directors to fill a vacancy created by the expansion of our board of directors or the resignation, death or removal of a director, which prevents stockholders from being able to fill vacancies on our board of directors; |
| n | the establishment of a classified board of directors requiring that only a subset of the members of our board of directors be elected at each annual meeting of stockholders; |
| n | the prohibition of cumulative voting in our election of directors, which would otherwise allow less than a majority of stockholders to elect director candidates; |
| n | the requirement that stockholders provide advance notice to nominate individuals for election to our board of directors or to propose matters that can be acted upon at a stockholders’ meeting. These provisions may discourage or deter a potential acquirer from conducting a solicitation of proxies to elect the acquirer’s own slate of directors or otherwise attempting to obtain control of our company; |
| n | the ability of our board of directors to issue, without stockholder approval, shares of undesignated preferred stock with terms set by the board of directors, which rights could be senior to those of our common stock. The ability to authorize undesignated preferred stock makes it possible for our board of directors to issue preferred stock with voting or other rights or preferences that could impede the success of any attempt to acquire us; |
| n | the ability of our board of directors to alter our bylaws without obtaining stockholder approval; |
| n | the inability of our stockholders to call a special meeting of stockholders and to take action by written consent in lieu of a meeting; |
| n | the required approval of the holders of at least two-thirds of the shares entitled to vote at an election of directors to adopt, amend, or repeal our bylaws; |
| n | the required approval of the holders of at least two-thirds of the shares entitled to vote at an election of directors to repeal or adopt any provision of our certificate of incorporation regarding the election of directors; |
| n | the required approval of the holders of at least 80% of such shares to amend or repeal the provisions of our bylaws regarding the election and classification of directors; and |
| n | the required approval of the holders of at least two-thirds of the shares entitled to vote at an election of directors to remove directors without cause. |
As a Delaware corporation, we are also subject to certain Delaware anti-takeover provisions. Under Delaware law, a corporation may not engage in a business combination with any holder of 15% or more of its capital stock unless the holder has held the stock for three years or, among other things, the board of directors has approved the transaction. Our board of directors could rely on Delaware law to prevent or delay an acquisition of us.
32
Table of Contents
SPECIAL NOTE REGARDING FORWARD-LOOKING STATEMENTS
This prospectus, particularly in the sections titled “Prospectus Summary,” “Risk Factors,” “Use of Proceeds,” “Management’s Discussion and Analysis of Financial Condition and Results of Operations” and “Business,” contains forward-looking statements that involve substantial risks and uncertainties. All statements other than statements of historical facts contained in this prospectus, including statements regarding our future financial position, business strategy and plans and objectives of management for future operations, are forward-looking statements. In some cases, you can identify forward-looking statements by terminology such as would,” “could,” “will,” “may,” “expect,” “believe,” “should,” “anticipate,” “outlook,” “if,” “future,” “intend,” “plan,” “estimate,” “predict,” “potential,” “targets,” “seek” or “continue” or the negative of these terms or other similar expressions. The statements we make regarding the following subject matters are forward-looking by their nature:
| n | our plans to target our existing products for new markets and for new uses and applications; |
| n | our plans with respect to growth in sales of new product lines, including Grandevo, Zequanox and Venerate; |
| n | our short- and long-term development and commercialization plans; |
| n | our ability and plans to screen, source, in-license, develop, field test, register and commercialize additional new product candidates and bring new products to market across multiple categories faster and at a lower cost than other developers of pest management products, and in particular products that are allowed for use by organic farmers; |
| n | our expectations regarding registering new products and new formulations and expanded use labels for existing products, including submitting new products to the EPA and U.S. state agencies; |
| n | our belief that challenges facing the use of conventional chemical pesticides will continue to grow; |
| n | our beliefs regarding the growth of markets for, and unmet demand for, biopesticides and biostimulants; |
| n | our beliefs regarding market adoption for our products; |
| n | our intention to maintain existing and develop new, supply, sales and distribution channels and extend market access; |
| n | our anticipation that we will receive future payments under our strategic collaboration and development agreements for the achievement of testing validation, regulatory progress and commercialization events; |
| n | our plans regarding repurposing and expanding capacity at our manufacturing facility, including timing for Phase 1 completion and Phase 2 commencement; |
| n | our plans to collaborate with chemical manufacturers to develop products that combine our bio-based pest management solutions with their technologies; |
| n | our plans to grow our business and expand operations, including plans to hire additional qualified personnel and expectations that we will generate a significant portion of our revenues from international sales of our products and that our revenues stream will be increasingly diversified; |
| n | our intention to continue to devote significant resources toward our proprietary technology and research and development and the potential for pursuing acquisition and collaboration opportunities to gain access to third-party products and technologies; |
| n | our expectations that sales will be seasonal and the impact of continued drought conditions; |
| n | our ability to protect our intellectual property in the United States and abroad; |
| n | our expectations regarding market risk, including interest rate changes, foreign currency fluctuations and commodity price changes; |
| n | our belief in the sufficiency of our cash flows to meet our needs for 24 months following completion of this offering; and |
| n | our future financial and operating results. |
The preceding list is not intended to be an exhaustive list of all of our forward-looking statements. The forward-looking statements are based on our beliefs, assumptions and expectations of future performance, taking into account the information currently available to us. These statements are only predictions based upon our current expectations and projections about future events. There are important factors that could cause our actual results, level of activity, performance or achievements to differ materially from the results, level of activity, performance or
33
Table of Contents
achievements expressed or implied by the forward-looking statements. Other sections of this prospectus may include additional factors that could adversely impact our business and financial performance. Moreover, we operate in a very competitive and rapidly changing environment. New risks emerge from time to time and it is not possible for our management to predict all risks, nor can we assess the impact of all factors on our business or the extent to which any factor, or combination of factors, may cause actual results to differ materially from those contained in any forward-looking statements we may make. Before investing in our common stock, investors should be aware that the occurrence of the events described under the caption “Risk Factors” and elsewhere in this prospectus could have a material adverse effect on our business, results of operations and financial condition.
You should not rely upon forward-looking statements as predictions of future events. Although we believe that the expectations reflected in the forward-looking statements are reasonable, we cannot guarantee that the future results, levels of activity, performance and events and circumstances reflected in the forward-looking statements will be achieved or occur. Except as required by law, we undertake no obligation to update publicly any forward-looking statements for any reason after the date of this prospectus to conform these statements to actual results or to changes in our expectations.
This prospectus contains statistical data that we obtained from industry publications and reports. These publications generally indicate that they have obtained their information from sources believed to be reliable, but do not guarantee the accuracy and completeness of their information. Although we believe the publications are reliable, we have not independently verified their data.
You should read this prospectus and the documents that we reference in this prospectus and have filed as exhibits to the registration statement of which this prospectus is a part with the understanding that our actual future results, levels of activity, performance and achievements may be materially different from what we expect. We qualify all of our forward-looking statements by these cautionary statements.
34
Table of Contents
We estimate that the net proceeds we will receive from this offering will be approximately $33.9 million, after deducting estimated underwriting discounts and commissions and estimated offering expenses payable by us. If the underwriters exercise their option to purchase additional shares in full, we estimate that our net proceeds will be approximately $40.0 million, after deducting estimated underwriting discounts and commissions and estimated offering expenses payable by us. We will not receive any proceeds from the sale of the common stock by the selling stockholder.
We currently intend to use the net proceeds we receive from this offering for working capital required to accelerate the commercial adoption of our existing products, to accelerate the development of our product pipeline and to expand our network of strategic relationships, for capital expenditures, including to purchase equipment to facilitate our research and development efforts and to accelerate completion of the manufacturing facility we acquired in July 2012, and for general corporate purposes, such as acquiring complementary businesses, products or technologies.
We will have broad discretion in the way that we use the net proceeds of this offering. The amounts that we actually spend for the purposes described above may vary significantly and will depend, in part, on the timing and amount of our future revenues, our future expenses and any potential acquisitions that we may propose. Pending any use, as described above, we plan to invest the net proceeds in a variety of capital preservation instruments, including short- and long-term interest-bearing investments, direct or guaranteed obligations of the U.S. government, certificates of deposit and money market funds. We cannot predict whether the proceeds invested will yield a favorable return for us.
35
Table of Contents
Our common stock has been listed on The Nasdaq Global Market under the symbol “MBII” since August 2, 2013. Prior to that time, there was no public market for our stock. The following table sets forth for the indicated periods the high and low intra-day sales prices per share for our common stock on The Nasdaq Global Market.
| HIGH | LOW | |||||||
| Third Quarter 2013 (from August 2, 2013) |
$ | 18.58 | $ | 12.27 | ||||
| Fourth Quarter 2013 |
$ | 20.00 | $ | 13.01 | ||||
| First Quarter 2014 |
$ | 19.64 | $ | 13.05 | ||||
| Second Quarter 2014 (through May 30, 2014) |
$ | 14.03 | $ | 8.21 | ||||
On May 30, 2014, the last trading day prior to the date of this prospectus, the closing price of our common stock was $10.87 per share as reported on The Nasdaq Global Market. As of March 31, 2014, there were 106 stockholders of record of our common stock. Because some of our shares of common stock are held by brokers and other institutions on behalf of stockholders, we are unable to estimate the total number of stockholders represented by these record holders.
We have never declared or paid any cash dividends on our capital stock. We currently anticipate that we will retain all of our future earnings for use in the expansion and operation of our business and do not anticipate paying any cash dividends in the foreseeable future. Any future determination to declare cash dividends will be made at the discretion of our board of directors, subject to applicable law and will depend on our financial condition, results of operations, capital requirements, general business conditions and other factors that our board of directors may deem relevant. In addition, an existing loan agreement restricts our ability to pay dividends on our capital stock in certain cases.
36
Table of Contents
The following table sets forth our capitalization as of March 31, 2014 on an actual basis and on an as adjusted basis, giving effect to the sale by us of 3,400,000 shares of common stock in this offering at an assumed public offering price of $10.87 per share, which was the last reported sale price of our common stock on the Nasdaq Global Market on May 30, 2014, after deducting the estimated underwriting discounts and commissions and estimated offering expenses payable by us.
You should read this table together with “Selected Financial Data”, “Management’s Discussion and Analysis of Financial Condition and Results of Operations” and our consolidated financial statements and the related notes appearing elsewhere in this prospectus.
| AS OF MARCH 31, 2014 | ||||||||
| ACTUAL | AS ADJUSTED | |||||||
| (In thousands, except per share data) |
||||||||
| Cash, cash equivalents and short-term investments |
$ | 23,962 | $ | 57,852 | ||||
|
|
|
|
|
|||||
| Capital leases, including current portion |
2,739 | 2,739 | ||||||
| Debt, including current portion |
12,435 | 12,435 | ||||||
| Stockholders’ equity: |
||||||||
| Preferred stock, $0.00001 par value, 20,000 shares authorized and no shares issued and outstanding, actual and as adjusted |
— | — | ||||||
| Common stock, $0.00001 par value 250,000 shares authorized; 19,707 shares issued and outstanding, actual; 23,107 shares issued and outstanding as adjusted |
— | — | ||||||
| Additional paid in capital |
149,643 | 183,534 | ||||||
| Accumulated deficit |
(115,682 | ) | (115,682 | ) | ||||
|
|
|
|
|
|||||
| Total stockholders’ equity |
33,961 | 67,852 | ||||||
|
|
|
|
|
|||||
| Total capitalization |
$ | 49,135 | $ | 83,026 | ||||
|
|
|
|
|
|||||
The number of shares of our common stock to be outstanding after this offering is based on 19,707,001 shares outstanding as of March 31, 2014, and excludes:
| n | 2,974,054 shares of common stock issuable upon the exercise of options outstanding as of March 31, 2014 with a weighted-average exercise price of $10.95 per share; |
| n | 144,646 shares of common stock issuable upon the exercise of warrants outstanding as of March 31, 2014, with a weighted-average exercise price of $8.40 per share; and |
| n | 1,127,624 shares of common stock that will be available for future grant under our 2013 Stock Incentive Plan as of March 31, 2014, and additional shares of common stock that will be available for future grant under the automatic increase provisions of our 2013 Stock Incentive Plan (see “Executive Compensation—Employee Benefit and Stock Plans—2013 Stock Incentive Plan”). |
37
Table of Contents
We have derived the selected consolidated statements of operations data for each of the fiscal years ended December 31, 2013, 2012 and 2011 and the selected consolidated balance sheet data as of December 31, 2013 and 2012 from our audited consolidated financial statements and related notes included elsewhere in this prospectus. We have derived the selected consolidated statements of operations data for the fiscal year ended December 31, 2010 and the selected consolidated balance sheet data as of December 31, 2011 and 2010 from our audited consolidated financial statements not included in this prospectus. We have derived the consolidated statements of operations data for the three months ended March 31, 2014 and 2013 and the consolidated balance sheet data as of March 31, 2014 from our unaudited interim condensed consolidated financial statements and related notes included elsewhere in this prospectus. Our historical results are not necessarily indicative of the results that may be expected for any future period. The following selected financial data should be read in connection with “Management’s Discussion and Analysis of Financial Condition and Results of Operations” and our consolidated financial statements and related notes included elsewhere in this prospectus.
38
Table of Contents
Statements of Operations Data:
| YEAR ENDED DECEMBER 31, | THREE MONTHS ENDED MARCH 31, |
|||||||||||||||||||||||
| 2013 | 2012 | 2011 | 2010 | 2014 | 2013 | |||||||||||||||||||
| (In thousands, except per share data) | ||||||||||||||||||||||||
| Revenues: |
||||||||||||||||||||||||
| Product |
$ | 12,657 | $ | 6,777 | $ | 5,044 | $ | 3,666 | $ | 2,097 | $ | 2,373 | ||||||||||||
| License (1) |
193 | 179 | 57 | — | 45 | 48 | ||||||||||||||||||
| Related party |
1,693 | 184 | 150 | 31 | 648 | 309 | ||||||||||||||||||
|
|
|
|
|
|
|
|
|
|
|
|
|
|||||||||||||
| Total revenues |
14,543 | 7,140 | 5,251 | 3,697 | 2,790 | 2,730 | ||||||||||||||||||
| Cost of product revenues, including cost of product revenues to related parties of $984, $126, $50 and $10 for the years ended December 31, 2013, 2012, 2011 and 2010, respectively, and $192 and $194 for the three months ended March 31, 2014 and 2013, respectively |
10,736 | 4,333 | 2,172 | 1,738 | 1,652 | 1,795 | ||||||||||||||||||
|
|
|
|
|
|
|
|
|
|
|
|
|
|||||||||||||
| Gross profit |
3,807 | 2,807 | 3,079 | 1,959 | 1,138 | 935 | ||||||||||||||||||
| Operating expenses: |
||||||||||||||||||||||||
| Research, development and patent |
17,814 | 12,741 | 9,410 | 5,563 | 4,282 | 3,283 | ||||||||||||||||||
| Non-cash charge associated with a convertible note |
— | 3,610 | — | — | — | — | ||||||||||||||||||
| Selling, general and administrative |
15,018 | 10,294 | 6,793 | 4,353 | 6,330 | 2,847 | ||||||||||||||||||
|
|
|
|
|
|
|
|
|
|
|
|
|
|||||||||||||
| Total operating expenses |
32,832 | 26,645 | 16,203 | 9,916 | 10,612 | 6,130 | ||||||||||||||||||
|
|
|
|
|
|
|
|
|
|
|
|
|
|||||||||||||
| Loss from operations |
(29,025 | ) | (23,838 | ) | (13,124 | ) | (7,957 | ) | (9,474 | ) | (5,195 | ) | ||||||||||||
| Other income (expense): |
||||||||||||||||||||||||
| Interest income |
49 | 16 | 22 | 22 | 10 | 1 | ||||||||||||||||||
| Interest expense |
(5,997 | ) | (2,466 | ) | (88 | ) | (102 | ) | (773 | ) | (1,985 | ) | ||||||||||||
| Change in estimated fair value of financial instruments (2) |
6,717 | (12,461 | ) | 1 | — | — | (3,563 | ) | ||||||||||||||||
| Gain on extinguishment of debt |
49 | — | — | — | — | — | ||||||||||||||||||
| Other (expense) income, net |
(282 | ) | (45 | ) | 9 | 1 | (9 | ) | (7 | ) | ||||||||||||||
|
|
|
|
|
|
|
|
|
|
|
|
|
|||||||||||||
| Total other income (expense), net |
536 | (14,956 | ) | (56 | ) | (79 | ) | (772 | ) | (5,554 | ) | |||||||||||||
|
|
|
|
|
|
|
|
|
|
|
|
|
|||||||||||||
| Loss before income taxes |
(28,489 | ) | (38,794 | ) | (13,180 | ) | (8,036 | ) | (10,246 | ) | (10,749 | ) | ||||||||||||
| Income taxes |
— | — | — | — | — | — | ||||||||||||||||||
|
|
|
|
|
|
|
|
|
|
|
|
|
|||||||||||||
| Net loss |
(28,489 | ) | (38,794 | ) | (13,180 | ) | (8,036 | ) | (10,246 | ) | (10,749 | ) | ||||||||||||
| Deemed dividend on convertible notes |
(1,378 | ) | (2,039 | ) | — | — | — | — | ||||||||||||||||
|
|
|
|
|
|
|
|
|
|
|
|
|
|||||||||||||
| Net loss attributable to common stockholders |
$ | (29,867 | ) | $ | (40,833 | ) | $ | (13,180 | ) | $ | (8,036 | ) | $ | (10,246 | ) | $ | (10,749 | ) | ||||||
|
|
|
|
|
|
|
|
|
|
|
|
|
|||||||||||||
| Net loss per common share (3): |
||||||||||||||||||||||||
| Basic |
$ | (3.42 | ) | $ | (32.48 | ) | $ | (10.64 | ) | $ | (6.58 | ) | $ | (0.52 | ) | $ | (8.48 | ) | ||||||
|
|
|
|
|
|
|
|
|
|
|
|
|
|||||||||||||
| Diluted |
$ | (3.94 | ) | $ | (32.48 | ) | $ | (10.64 | ) | $ | (6.58 | ) | $ | (0.52 | ) | $ | (8.48 | ) | ||||||
|
|
|
|
|
|
|
|
|
|
|
|
|
|||||||||||||
| Weighted-average shares outstanding used in computing net loss per common share (3): |
||||||||||||||||||||||||
| Basic |
8,731 | 1,257 | 1,239 | 1,221 | 19,518 | 1,268 | ||||||||||||||||||
|
|
|
|
|
|
|
|
|
|
|
|
|
|||||||||||||
| Diluted |
8,911 | 1,257 | 1,239 | 1,221 | 19,518 | 1,268 | ||||||||||||||||||
|
|
|
|
|
|
|
|
|
|
|
|
|
|||||||||||||
39
Table of Contents
| (1) | We receive payments under strategic collaboration and distribution agreements under which we provide third parties with exclusive development, marketing and distribution rights. These payments are initially classified as deferred revenues and are recognized as revenues over the exclusivity period. See Note 2 of our accompanying audited consolidated financial statements for an explanation of the method used to calculate license revenues. |
| (2) | Prior to the completion of the initial public offering, we accounted for the outstanding warrants exercisable into shares of our Series A, Series B and Series C convertible preferred stock and the outstanding warrants exercisable into a variable number of shares of common stock as liability instruments, as the Series A, Series B and Series C convertible preferred stock and the common stock into which these warrants were convertible were contingently redeemable upon the occurrence of certain events or transactions. In addition, convertible notes were accounted for at estimated fair value. The warrant instruments and convertible notes were adjusted to fair value at each reporting period with the change in fair value recorded in the consolidated statements of operations. These charges did not continue after the completion of the initial public offering because the preferred stock warrants were exercised and the convertible notes automatically converted into common stock in accordance with their terms upon the completion of the initial public offering. The common stock warrants were, in accordance with their terms upon the completion of the initial public offering, either automatically exercised for shares of common stock or represent the right to purchase a fixed number of shares. See “Management’s Discussion and Analysis of Financial Condition and Results of Operations—Key Components of Our Results of Operations—Change in Estimated Fair Value of Financial Instruments and Deemed Dividend on Convertible Notes.” |
| (3) | Includes the effect of a 1-for-3.138458 reverse stock split, effective August 1, 2013. |
Balance Sheet Data:
| DECEMBER 31, | MARCH 31, | |||||||||||||||||||
| 2013 | 2012 | 2011 | 2010 | 2014 | ||||||||||||||||
| (In thousands) | ||||||||||||||||||||
| Cash and cash equivalents |
$ | 24,455 | $ | 10,006 | $ | 2,215 | $ | 4,287 | $ | 21,298 | ||||||||||
| Short-term investments |
13,677 | — | 2,000 | — | 2,664 | |||||||||||||||
| Working capital (deficit) (1) |
46,915 | (11,468 | ) | 5,030 | 4,935 | 32,571 | ||||||||||||||
| Total assets |
68,879 | 33,778 | 9,818 | 7,937 | 63,459 | |||||||||||||||
| Debt and capital leases (net of unamortized discount) |
14,972 | 16,740 | 806 | 1,106 | 15,174 | |||||||||||||||
| Convertible notes |
— | 41,860 | — | — | — | |||||||||||||||
| Preferred stock warrant liability |
— | 1,884 | 27 | 28 | — | |||||||||||||||
| Common stock warrant liability |
— | 301 | — | — | — | |||||||||||||||
| Total liabilities |
27,095 | 68,413 | 4,306 | 2,689 | 29,498 | |||||||||||||||
| Convertible preferred stock |
— | 39,612 | 39,612 | 26,452 | — | |||||||||||||||
| Total stockholders’ equity (deficit) |
41,784 | (74,247 | ) | (34,100 | ) | (21,204 | ) | 33,961 | ||||||||||||
| (1) | Working capital (deficit) is defined as total current assets minus total current liabilities. |
40
Table of Contents
MANAGEMENT’S DISCUSSION AND ANALYSIS
OF FINANCIAL CONDITION AND RESULTS OF OPERATIONS
The following discussion and analysis of our financial condition and results of operations should be read together with our consolidated financial statements and the other financial information appearing elsewhere in this prospectus. This discussion contains forward-looking statements that involve risks and uncertainties. Our actual results could differ materially from those anticipated in the forward-looking statements as a result of various factors, including those discussed below and those discussed in the section entitled “Risk Factors” included elsewhere in this prospectus.
Overview
We make bio-based pest management and plant health products. Bio-based products are comprised of naturally occurring microorganisms such as bacteria and fungi, and plant extracts. We target the major markets that use conventional chemical pesticides, including agricultural and water markets, where our bio-based products are used as substitutes for, or in connection with, conventional chemical pesticides. We also target new markets for which there are no available conventional chemical pesticides, the use of conventional chemical pesticides may not be desirable or permissible because of health and environmental concerns or the development of pest resistance has reduced the efficacy of conventional chemical pesticides. Our current portfolio of EPA-approved and registered “biopesticide” products and our pipeline address the growing global demand for effective, efficient and environmentally responsible products.
Our goal is to provide growers with solutions to a broad range of pest management needs by adding new products to our product portfolio, continuing to broaden the commercial applications of our existing product lines, leveraging relationships with existing distributors and growers’ positive experiences with existing product lines, and educating growers with on-farm product demonstrations and controlled product launches with key target customers and other early adopters. We believe this approach enables us to stay ahead of our competition in providing innovative pest management solutions, enhances our sales process at the distributor level and helps us to capture additional value from our products.
The agricultural industry is increasingly dependent on effective and sustainable pest management practices to maximize yields and quality in a world of increased demand for agricultural products, rising consumer awareness of food production processes and finite land and water resources. In addition, our research has shown that the global market for biopesticides is growing substantially faster than the overall market for pesticides. This demand is in part a result of conventional growers acknowledging that there are tangible benefits to adopting bio-based pest management products into integrated pest management (IPM) programs. We believe that our competitive strengths, including our commercially available products, robust pipeline of novel product candidates, proprietary technology and product development process, commercial relationships and industry experience, position us for rapid growth by providing solutions for these global trends.
We currently offer four product lines for commercial sale: Regalia, an initial formulation of which we began selling in the fourth quarter of 2008, Grandevo, an initial formulation of which we began selling in the fourth quarter of 2011, Zequanox, an initial formulation of which we began selling in the second half of 2012 and Venerate, which we began selling in May 2014. We also have one product candidate, Opportune, an herbicide (for weed control), which received EPA approval in April 2012, that we are in the process of developing for commercial application. In addition, we submitted MBI-011, another herbicide, MBI-302, a biological nematicide, and MBI-601, a biofumigant, to the EPA for registration, and we have submitted Haven, an anti-transpirant, to applicable state agencies for registration. A large portion of our sales are currently attributable to conventional growers who use our bio-based pest management products either to replace conventional chemical pesticides or enhance the efficacy of their IPM programs. In addition, a portion of our sales are attributable to organic farmers, who cannot use conventional pesticides and have few alternatives for pest management. We intend to continue to develop and commercialize bio-based pest management and plant health products that are allowed for use by organic farmers.
We sell our crop protection products to leading agrichemical distributors while also working directly with growers to increase existing and generate new product demand. To date, we have marketed our bio-based pest management
41
Table of Contents
and plant health products for agricultural applications to U.S. growers, through distributors and our own sales force, and we have focused primarily on high value specialty crops such as grapes, citrus, tomatoes, leafy greens and ornamental plants. As we continue to demonstrate the efficacy of our bio-based pest management and plant health products on new crops or for new applications, we may either continue to sell our product through our in-house sales force or collaborate with third parties for distribution to select markets. For example, we demonstrated that there is a significant opportunity for selling Regalia as a yield enhancer for large-acre row crop markets such as corn, cotton and soybeans, which we began to sell through third-party distributors in the third quarter of 2013.
We have historically sold a significant majority of our products in the United States, although we have strategically launched Regalia in select international markets. For example, we launched Regalia in the United Kingdom in 2009, Turkey in 2010, Mexico in 2011 and Canada in 2012. We are continuing to form strategic collaborations with major agrichemical companies such as FMC (for markets in Latin America) and Syngenta (for markets in Africa, Europe and the Middle East) to accelerate our entry into certain international markets where these distributors are already selling Regalia, as well as in Asia Pacific markets. In addition to engaging these large-scale international distributors, we intend to form new strategic collaborations with other market-leading companies in our target markets and regions to expand the supply of our products globally, particularly in markets for which our products fall under exemptions from registration. In the longer term, when we launch Grandevo and other products internationally, we expect to generate a significant portion of our revenues from international sales of our products.
We currently market our water treatment product, Zequanox, through our sales and technical workforce to hydroelectric power generation companies, combustion power generation companies and industrial facilities at various geographical sites. We are in discussions with several potential leaders in water treatment technology and applications regarding potential arrangements to sell Zequanox in the United States and international markets to supplement the efforts of our sales force. We are also exploring other options for selling Zequanox including entering into distribution arrangements with third parties to market Zequanox internationally. We may enter into similar arrangements for the distribution of Zequanox for use in certain applications such as treatment of lakes, aqueducts and drinking water facilities in the United States. We believe that Zequanox presents a unique opportunity for generating long-term revenue, as there are limited water treatment options available to date, most of which are time-consuming, costly or subject to high levels of regulation. Our ability to generate significant revenues from Zequanox is dependent on our ability to persuade customers to evaluate the costs of our Zequanox products compared to the overall cost of the chlorine treatment process, the primary current alternative to using Zequanox, rather than the cost of purchasing chemicals alone. Sales of Zequanox have also remained lower than our other products due to the length of the treatment cycle, the longer sales cycle (the bidding process with utility companies occurs on a yearly or multi-year basis) and the unique nature of the treatment approach for each customer based on the extent of the infestation and the design of the facility.
Our biopesticide products cannot be sold in the United States except under an EPA-approved use label. As such, we launch early formulations of our products to targeted customers under EPA-approved use labels, which list a limited number of crops and applications, to gather field data, gain product knowledge and get feedback to our research and development team while the EPA reviews new product formulations and expanded use labels for already approved formulations covering additional crops and applications. Based on these initial product launches, sales and demonstrations in additional regions and other tests and trials, we continue to enhance our products and submit product formulations and expanded use labels to the EPA and other regulatory agencies. For example, we began sales of Regalia SC, an earlier formulation of Regalia, in the Florida fresh tomatoes market in 2008, while a more effective formulation of Regalia with an expanded use label, including listing for use in organic farming, was under review by the EPA. When approved, we launched this new formulation into the Southeast United States in 2009 and nationally in 2010. In 2011, we received EPA approval of a newly expanded Regalia label covering hundreds of crops and various new uses for applications to soil and through irrigation systems. Likewise, in May 2013, we received approval for an improved Grandevo label, which has been approved by 49 states, with a decision pending in Hawaii.
Our total revenues were $14.5 million, $7.1 million, $5.3 million and $2.8 million for the years ended December 31, 2013, 2012 and 2011 and the three months ended March 31, 2014, respectively, and have risen as growers have increasingly adopted our products. In addition, revenue has increased as our products are used on an expanded number of crops. For example, in the third quarter of 2013, we began selling Regalia to distributors in row crop markets. We generate our revenues primarily from product sales, which are principally attributable to sales of
42
Table of Contents
our Regalia and Grandevo product lines. We believe weather conditions such as drought in the Western United States, freezing conditions in the Midwestern United States and heavy rains and flooding in the Southeastern United States may have an impact on purchases of our pest management and plant health products by our distributors, direct customers and end users. We believe that these conditions will shift the timing of some of the purchases for the growing season between quarters, but we do not anticipate an overall impact to annual sales. We anticipate that most of our revenue growth will occur during the second half of 2014 relating to growth in row crop and certain specialty crop markets, new product sales and entry into additional Latin American markets.
Since 2011, we have also recognized license revenues from our strategic collaboration and distribution agreements, which amounted to $0.2 million, $0.2 million, $0.1 million and $45,000 for the years ended December 31, 2013, 2012 and 2011 and the three months ended March 31, 2014. For the year ended December 31, 2013 and the three months ended March 31, 2014, we recognized $0.1 million and $0.3 million, respectively, of related party revenues under these agreements based on the terms of our agreements with Syngenta, an affiliate of one of our 5% stockholders. There were no related party revenues recognized under these agreements for the years ended December 31, 2012 and 2011.
We currently sell our crop protection products through the same leading agricultural distributors used by the major agrichemical companies. Distributors with 10% or more of our total revenues consist of the following:
| CROP PRODUCTION SERVICES |
THE TREMONT GROUP (1), (2) |
ENGAGE AGRO |
HELENA CHEMICALS |
WILBUR ELLIS |
REISTER’S | GROWMARK | ||||||||||||||||||||||
| For the years ended December 31, |
||||||||||||||||||||||||||||
| 2013 |
28 | % | 10 | % | * | * | * | * | * | |||||||||||||||||||
| 2012 |
33 | % | * | 13 | % | 12 | % | * | * | * | ||||||||||||||||||
| 2011 |
39 | % | * | * | 17 | % | 10 | % | * | * | ||||||||||||||||||
| For the three months ended March 31, 2014 |
17 | % | 12 | % | * | 11 | % | * | 15 | % | 11 | % | ||||||||||||||||
| * | Represents less than 10% of total revenues |
| (1) | Represents related party revenues. See Note 18 of our accompanying audited consolidated financial statements for further discussion. |
| (2) | Represents related party revenues. See Note 14 of our accompanying unaudited condensed consolidated financial statements. |
While we expect product sales to a limited number of distributors to continue to be our primary source of revenues, as we continue to develop our pipeline and introduce new products to the marketplace, we anticipate that our revenues stream will be diversified over a broader product portfolio and customer base.
Our cost of product revenues was $10.7 million, $4.3 million, $2.2 million and $1.7 million for the years ended December 31, 2013, 2012 and 2011 and the three months ended March 31, 2014, respectively. Cost of product revenues included $1.0 million, $0.1 million, $0.1 million and $0.2 million of cost of product revenues to related parties for the years ended December 31, 2013, 2012 and 2011 and the three months ended March 31, 2014, respectively. Cost of product revenues consists principally of the cost of raw materials, including inventory costs and third-party services related to procuring, processing, formulating, packaging and shipping our products. We expect our cost of product revenues to increase as we expand sales of Regalia, Grandevo and Zequanox. Our cost of product revenues has increased as a percentage of total revenues primarily due to a change in product mix, with Grandevo representing an increased percentage of total revenues as Grandevo is early in its life cycle. We expect to see a gradual increase in gross margin over the life cycle of each of our products, including Grandevo, as we improve production processes, gain efficiencies and increase product yields.
Our research, development and patent expenses have historically comprised a significant portion of our operating expenses, amounting to $17.8 million, $12.7 million, $9.4 million and $4.3 million for the years ended December 31, 2013, 2012 and 2011 and the three months ended March 31, 2014, respectively. We intend to
43
Table of Contents
continue to devote significant resources toward our proprietary technology and adding to our pipeline of bio-based pest management and plant health products using our proprietary discovery process, sourcing and commercialization expertise and rapid and efficient development process.
Selling, general and administrative expenses incurred to establish and build our market presence and business infrastructure have generally comprised the remainder of our operating expenses, amounting to $15.0 million, $10.3 million, $6.8 million and $6.3 million for the years ended December 31, 2013, 2012 and 2011 and the three months ended March 31, 2014, respectively. We expect that in the future, our selling, general and administrative expenses will increase due to our expanded product portfolio and due to additional costs incurred relating to being a public company.
In addition, for the year ended December 31, 2012, in connection with a convertible note, we incurred a non-recurring, non-cash charge of $3.6 million as operating expenses. We also recognized a net gain in non-cash charges attributable to the change in estimated fair value of financial instruments of $6.7 million for the year ended December 31, 2013 and a net loss of $12.5 million for the year ended December 31, 2012, which were reported in other income (expense). There was no such charge for the three months ended March 31, 2014.
Historically, we have funded our operations from the issuance of shares of common stock, preferred stock, warrants and convertible notes, the issuance of debt and entry into financing arrangements, product sales, payments under strategic collaboration and distribution agreements and government grants, but we have experienced significant losses as we invested heavily in research and development. We expect to incur additional losses related to our investment in the continued development, expansion and marketing of our product portfolio.
Critical Accounting Policies and Estimates
Our consolidated financial statements and the related notes included elsewhere in this prospectus are prepared in accordance with accounting principles generally accepted in the United States. The preparation of these consolidated financial statements requires us to make estimates and assumptions that affect the reported amounts of assets, liabilities, net revenue, costs, and expenses, and any related disclosures. We base our estimates on historical experience and on various other assumptions that we believe to be reasonable under the circumstances. Changes in accounting estimates are reasonably likely to occur from period to period. Accordingly, actual results could differ significantly from the estimates made by our management. We evaluate our estimates and assumptions on an ongoing basis. To the extent that there are material differences between these estimates and our actual results, our future financial statement presentation, financial condition, results of operations and cash flows will be affected.
We believe that the assumptions and estimates associated with revenue recognition, income taxes, inventory valuation, share-based compensation, and financial instruments with characteristics of both liabilities and equity have the greatest potential impact on our consolidated financial statements. Therefore, we consider these to be our critical accounting policies and estimates. For further information on all of our significant accounting policies, see Note 2 of our accompanying audited consolidated financial statements.
Key Components of Our Results of Operations
Product Revenues
Product revenues consist of revenues generated primarily from sales to distributors, net of rebates and cash discounts. Our product revenues through 2012 were primarily derived from sales of Regalia, but now are increasingly impacted by new products such as Grandevo. We elected to discontinue marketing GreenMatch, our first product, an organic herbicide in 2011 to focus on more attractive opportunities and products. We sold our remaining inventory of GreenMatch to a limited number of existing customers and terminated such sales upon the exhaustion of product inventory in July 2012. Product revenues, not including related party revenues, constituted 87%, 95%, 96% and 75% of our total revenues for the years ended December, 2013, 2012 and 2011 and the three months ended March 31, 2014, respectively. Product revenues in the United States, not including related party revenues, constituted 79%, 78%, 90% and 71% of our total revenues for the years ended December 31, 2013, 2012 and 2011 and the three months ended March 31, 2014, respectively.
44
Table of Contents
In 2013, we began to offer extended payment terms in excess of those historically offered to our customers. We believe our competitors and other vendors in the pest management and plant health industry also offer extended payment terms and, in the aggregate, we believe that by expanding the use of extended payment terms, we have provided a competitive response to the market. When we offer terms that are considered to be extended in comparison to our historical terms, we defer recognizing revenue until payment is due. As of December 31, 2013 and March 31, 2014, we recorded current deferred product revenues of $1.0 million and $0.8 million, respectively. As of December 31, 2012, we had no deferred product revenues.
License Revenues
License revenues generally consist of revenues recognized under our strategic collaboration and distribution agreements for exclusive distribution rights, either for Regalia or for our broader pipeline of products, for certain geographic markets or for market segments that we are not addressing directly through our internal sales force. Our strategic collaboration and distribution agreements generally outline overall business plans and include payments we receive at signing and for the achievement of testing validation, regulatory progress and commercialization events. As these activities and payments are associated with exclusive rights that we provide over the term of the strategic collaboration and distribution agreements, revenues related to the payments received are deferred and recognized as revenues over the term of the exclusive period of the respective agreements, which we estimate to be between 5 and 17 years based on the terms of the contract and the covered products and regions. For the years ended December 31, 2013, 2012 and 2011 and the three months ended March 31, 2014, license revenues constituted 1%, 2%, 1% and 2% of total revenues, respectively. As of March 31, 2014, not including agreements with related parties discussed below, we had received an aggregate of $1.4 million in payments under these agreements, and there are up to $1.9 million in payments under these agreements that we could potentially receive if the testing validation, regulatory progress and commercialization events occur.
Related Party Revenues
Related party revenues consist of both product revenues and license revenues. Les Lyman, a member of our board of directors, is the chairman and significant indirect shareholder of The Tremont Group, Inc., which purchases our products for further distribution and resale. In addition, in December 2012, we issued a convertible note to Syngenta Ventures Pte. LTD. (Syngenta), an affiliate of one of our distributors with whom we entered into a commercial agreement with and sell our products to for further distribution and resale. For the years ended December 31, 2013, 2012 and 2011 and the three months ended March 31, 2014, related party revenues constituted 12%, 3%, 3% and 23% of total revenues, respectively. As of March 31, 2014, we had received an aggregate of $1.0 million in payments under our strategic collaboration and distribution agreements with related parties, and there are up to $1.0 million in payments under these agreements that we could potentially receive if the testing validation, regulatory progress and commercialization events occur.
Cost of Product Revenues and Gross Profit
Cost of product revenues consists principally of the cost of raw materials, including inventory costs and third- party services related to procuring, processing, formulating, packaging and shipping our products. Cost of product revenues also may include charges due to inventory adjustments. Gross profit is the difference between total revenues and the cost of product revenues. Gross margin is the gross profit as expressed as a percentage of total revenues.
We have entered into in-license technology agreements with respect to the use and commercialization of our three commercially available product lines, including Regalia, Grandevo and Zequanox, and certain products under development. Under these licensing arrangements, we typically make royalty payments based on net product revenues, with royalty rates varying by product and ranging between 2% and 5% of net sales, subject in certain cases to aggregate dollar caps. These royalty payments are included in cost of product revenues, but they have historically not been significant. In addition, costs associated with license revenues have been included in cost of product revenues, as they have not been significant. The exclusivity and royalty provisions of these agreements are generally tied to the expiration of underlying patents. The patents for Regalia and Zequanox will expire in 2017 and the in-licensed U.S. patent for Grandevo is expected to expire in 2024. There is, however, a pending in-licensed patent application relating to Grandevo, which could expire later than 2024 if issued. After the termination of these provisions, we may continue to produce and sell these products. While third parties thereafter may develop products using the technology under expired patents, we do not believe that they can produce competitive products without
45
Table of Contents
infringing other aspects of our proprietary technology, including pending patent applications related to Regalia, Zequanox and Grandevo, and we therefore do not expect the expiration of the patents or the related exclusivity obligations to have a significant adverse financial or operational impact on our business.
We expect to see increases in gross profit over the life cycle of each of our products because gross margins are expected be increased over time as production processes improve and as we gain efficiencies and increase product yields. While we expect margins to improve on a product-by-product basis, our overall gross margins may vary as we introduce new products. In particular, we are experiencing and expect further near-term downward pressure on overall gross margins as we expand sales of Grandevo, Zequanox and Venerate and when we introduce Opportune, our EPA-approved bioherbicide. Gross profit has been and will continue to be affected by a variety of factors, including product manufacturing yields, changes in product production processes, new product introductions, product mix and average selling prices.
To date, we have relied on third parties for the production of our products. However, we believe reliance on third parties has resulted in lower gross margins for Grandevo, a fermentation-based product. Accordingly, in July 2012, we acquired a manufacturing facility, which we are repurposing for manufacturing operations, and we continue to further expand capacity at this facility. As production shifts from third parties to our own facility, we expect gross margins to improve.
Research, Development and Patent Expenses
Research, development and patent expenses principally consist of personnel costs, including salaries, wages, benefits and share-based compensation, related to our research, development and patent staff in support of product discovery and development activities. Research, development and patent expenses also include costs incurred for laboratory supplies, field trials and toxicology tests, quality control assessment, consultants and facility and related overhead costs. We have received grants and funding for our research from federal governmental entities. We recognize amounts under these grants as an offset to our overall research, development and patent expenses as services under the grant are performed. These grant offsets totaled $0.2 million in each of the years ended December 31, 2012 and 2011, and there were no grants for the year ended December 31, 2013 or the three months ended March 31, 2014.
We expect to increase our investments in research and development by hiring additional research and development staff, increasing the number of third-party field trials and toxicology tests for developing additional products and expanding uses for existing products. As a result, we expect that our research, development and patent expenses will increase in absolute dollars for the foreseeable future. As our sales increase, we expect our research, development and patent expenses to decrease as a percentage of total revenues, although, we could experience quarterly fluctuations.
Non-Cash Charge Associated with a Convertible Note
In December 2012, we issued a $12.5 million convertible note to Syngenta, an affiliate of one of our distributors, and incurred charges of $3.9 million representing the excess of the estimated fair value of the convertible note on the date of issuance compared to the cash received. Because the holder of this convertible note is an affiliate of one of our distributors, we recorded $0.3 million of the charges as a reduction of revenues recognized under our agreements with the affiliated distributor through the date of issuance of the convertible note in December 2012. We recorded the remaining $3.6 million of the charges in operating expenses as a non-recurring non-cash charge associated with a convertible note (See Note 9 of the accompanying audited consolidated financial statements for further discussion).
Selling, General and Administrative Expenses
Selling, general and administrative expenses consist primarily of personnel costs, including salaries, wages, benefits and share-based compensation, related to our executive, sales, marketing, finance and human resources personnel, as well as professional fees, including legal and accounting fees, and other selling costs incurred related to business development and to building product and brand awareness. We create brand awareness through programs such as speaking at industry events, trade show displays and hosting local-level grower and distributor meetings. In addition, we dedicate significant resources to technical marketing literature, targeted advertising in print and online media, webinars and radio advertising. Costs related to these activities, including travel, are included in selling expenses. Our administrative expenses have increased in recent periods primarily as a result of becoming a public company.
46
Table of Contents
We expect our selling expenses to increase in the near term, both in absolute dollars and as a percent of total revenues, particularly as we market and sell new products or product formulations to the marketplace. In the long term, we expect our selling, general and administrative expenses to decline as a percent of total revenues. We expect our overall selling, general and administrative expenses to increase in absolute dollars in order to drive product sales, and we will incur additional expenses associated with operating as a public company. Such increases may include increased insurance premiums, investor relations expenses, legal and accounting fees associated with the expansion of our business and corporate governance, financial reporting expenses, expenses related to Sarbanes-Oxley and other regulatory compliance obligations. We expect to hire additional personnel, particularly in the area of general and administrative activities to support the growth of the business.
Interest Expense
We recognize interest expense on notes payable, convertible notes and other debt obligations. During 2012, we entered into a $0.5 million term loan, issued $24.1 million in convertible notes and $17.5 million in promissory notes, including a $10.0 million promissory note paid off prior to its maturity date. In October 2012, we issued a $2.5 million convertible note, and we incurred $0.2 million of interest expense for the year ended December 31, 2012 as a result of the excess in the $2.7 million estimated fair value of the convertible note on the date of issuance compared to the cash received. During 2013, we issued $6.5 million in convertible notes and $4.95 million in promissory notes, including the partial conversion of $1.25 million of a convertible note into a promissory note. Accordingly, our interest expense increased both in absolute terms and as a percentage of total revenues. In May 2013, we issued a $3.0 million convertible note, and we incurred $1.2 million of interest expense for the year ended December 31, 2013 as a result of the excess in the $4.2 million estimated fair value of the convertible note on the date of issuance compared to the cash received. Immediately following the completion of the IPO in August 2013, the convertible notes converted into shares of our common stock. Accordingly, we ceased to incur the interest expense associated with these convertible notes. In addition, in connection with the repayment of the April 2012 Senior Secured Promissory Note, we wrote-off the unamortized debt discount totaling $0.8 million and incurred an early termination fee of $0.3 million, which were recorded to interest expense during the year ended December 31, 2013.
We have also acquired equipment under capital leases which results in interest expense over the lease term. We increased our capital lease obligations to $2.5 million as of December 31, 2013 from $0.4 million as of December 31, 2012, and our capital lease obligations were $2.7 million as of March 31, 2014.
Interest Income
Interest income consists primarily of interest earned on investments and cash balances. Our interest income will vary each reporting period depending on our average investment and cash balances during the period and market interest rates.
Change in Estimated Fair Value of Financial Instruments and Deemed Dividend on Convertible Notes
In August 2013, we closed an initial public offering (the “IPO”), at which time all shares of our outstanding convertible preferred stock and all of our outstanding convertible notes automatically converted into shares of common stock, and all outstanding warrants to purchase convertible preferred stock and certain warrants to purchase common stock were exercised for shares of common stock.
Until the effective date of the IPO, we accounted for the outstanding warrants exercisable into shares of our Series A, Series B and Series C convertible preferred stock as liability instruments, as the Series A, Series B and Series C convertible preferred stock into which these warrants were contingently convertible upon the occurrence of certain events or transactions. We also accounted for the outstanding warrants exercisable into a variable number of common shares at a fixed monetary amount as liability instruments. Our convertible notes were recorded at estimated fair value on a recurring basis as the predominant settlement feature of the convertible notes was to settle a fixed monetary amount in a variable number of shares. We adjusted the warrants and the convertible notes to fair value at each reporting period and on the effective date of the IPO with the change in estimated fair value recorded in the consolidated statements of operations.
Based on our operating performance (including the closing of several debt financings and the IPO) and changes in the probability and timing of, and estimated proceeds from, the completion of a Qualified IPO or an Acquisition
47
Table of Contents
between reporting dates or the issuance dates of the warrants, we recognized a net gain due to the change in the estimated fair value of financial instruments related to the warrants of $0.4 million for the year ended December 31, 2013 and a net loss of $1.6 million for the year ended December 31, 2012.
We issued $24.1 million in convertible notes during the year ended December 31, 2012. During the year ended December 31, 2013, we issued $6.5 million in convertible notes and converted $1.25 million of a convertible note into a promissory note. Based on our operating performance and changes in the probability and timing of, and estimated proceeds from, the completion of a Qualified IPO or an Acquisition between the reporting dates, or the issuance dates of these notes, we recognized a net gain due to the change in estimated fair value of financial instruments of $6.3 million for the year ended December 31, 2013 and a net loss of $10.9 million for the year ended December 31, 2012, relating to convertible notes. In addition to the ongoing adjustments to the estimated fair value of our convertible notes, we also recognized a one-time deemed dividend in connection with the issuance of certain convertible notes to preferred stockholders because we estimated the fair value of the convertible notes as of the issuance dates to be greater than the cash proceeds received. Accordingly, we determined that the excess of the estimated fair value of the convertible notes on the dates of issuance over cash proceeds to us represents a deemed dividend to preferred stockholders, and $1.4 million and $2.0 million was reflected in the net loss attributable to common stockholders for the years ended December 31, 2013 and 2012, respectively.
As a result of the automatic exercise of all Series A and Series B convertible preferred stock warrants and certain common stock warrants for shares of common stock, the automatic conversion of all convertible notes into common stock in accordance with their terms, and the exercise of all Series C convertible preferred stock warrants for shares of common stock in connection with our IPO in August 2013, there will not be any further adjustments to these warrants and convertible notes. In addition, upon completion of the IPO, the exercise price and number of shares to be issued upon exercise of the remaining outstanding common stock warrants became known. Accordingly, after the IPO, the fair value of the outstanding common stock warrant liability on the date of the IPO was reclassified to equity and will no longer be adjusted to its estimated fair value on each reporting date.
Income Tax Provision
Since our inception, we have been subject to income taxes principally in the United States. We anticipate that as we further expand our sales into foreign countries, we will become subject to taxation based on the foreign statutory rates and our effective tax rate could fluctuate accordingly.
Income taxes are computed using the asset and liability method, under which deferred tax assets and liabilities are determined based on the difference between the financial statement and tax bases of assets and liabilities using enacted tax rates in effect for the year in which the differences are expected to affect taxable income. Valuation allowances are established when necessary to reduce deferred tax assets to the amount expected to be realized. As of December 31, 2013, based on the available information, it is more likely than not that our deferred tax assets will not be realized, and accordingly we have taken a full valuation allowance against all of our United States deferred tax assets.
As of December 31, 2013, we had net operating loss carry-forwards for federal income tax reporting purposes of $77.7 million, which begin to expire in 2026, and state net operating loss carry-forwards of $73.5 million, which begin to expire in 2016. Additionally, as of December 31, 2013, we had federal research and development tax credit carry-forwards of $1.4 million, which begin to expire in 2026, and state research and development tax credit carry-forwards of $1.3 million, which have no expiration date.
Federal and state laws impose substantial restrictions on the utilization of net operating loss and tax credit carry-forwards in the event of an “ownership change,” as defined in Section 382 of the U.S. Internal Revenue Code of 1986, as amended. We completed a Section 382 analysis as of December 31, 2013 and concluded that approximately $0.5 million in federal net operating losses and approximately $0.2 million in federal research and development credits are expected to expire prior to utilization as a result of our previous ownership changes and corresponding annual limitations. Our inability to use these net operating loss carry-forwards as a result of the Section 382 limitations could harm our financial condition.
48
Table of Contents
Results of Operations
The following table sets forth certain statements of operations data as a percentage of total revenues:
| YEAR ENDED DECEMBER 31, | THREE MONTHS ENDED MARCH 31, |
|||||||||||||||||||
| 2013 | 2012 | 2011 | 2014 | 2013 | ||||||||||||||||
| Revenues: |
||||||||||||||||||||
| Product |
87 | % | 95 | % | 96 | % | 75% | 87% | ||||||||||||
| License |
1 | 2 | 1 | 2 | 2 | |||||||||||||||
| Related party |
12 | 3 | 3 | 23 | 11 | |||||||||||||||
|
|
|
|
|
|
|
|
|
|
|
|||||||||||
| Total revenues |
100 | 100 | 100 | 100 | 100 | |||||||||||||||
| Cost of product revenues (1) |
74 | 61 | 41 | 59 | 66 | |||||||||||||||
|
|
|
|
|
|
|
|
|
|
|
|||||||||||
| Gross profit |
26 | 39 | 59 | 41 | 34 | |||||||||||||||
| Operating expenses: |
||||||||||||||||||||
| Research, development and patent |
122 | 178 | 179 | 153 | 120 | |||||||||||||||
| Non-cash charge associated with a convertible note |
— | 51 | — | — | — | |||||||||||||||
| Selling, general and administrative |
103 | 144 | 129 | 227 | 104 | |||||||||||||||
|
|
|
|
|
|
|
|
|
|
|
|||||||||||
| Total operating expenses |
225 | 373 | 308 | 380 | 224 | |||||||||||||||
|
|
|
|
|
|
|
|
|
|
|
|||||||||||
| Loss from operations |
(199 | ) | (334 | ) | (249 | ) | (339 | ) | (190 | ) | ||||||||||
| Other income (expense): |
||||||||||||||||||||
| Interest income |
— | — | — | — | — | |||||||||||||||
| Interest expense |
(40 | ) | (34 | ) | (2 | ) | (28 | ) | (73 | ) | ||||||||||
| Change in estimated fair value of financial instruments |
46 | (175 | ) | — | — | (131 | ) | |||||||||||||
| Gain on extinguishment of debt |
— | — | — | — | — | |||||||||||||||
| Other (expense) income, net |
(2 | ) | — | — | — | — | ||||||||||||||
|
|
|
|
|
|
|
|
|
|
|
|||||||||||
| Total other income (expense), net |
4 | (209 | ) | (2 | ) | (28 | ) | (204 | ) | |||||||||||
|
|
|
|
|
|
|
|
|
|
|
|||||||||||
| Income taxes |
— | — | — | — | — | |||||||||||||||
|
|
|
|
|
|
|
|
|
|
|
|||||||||||
| Net loss |
(195 | )% | (543 | )% | (251 | )% | (367 | )% | (394 | )% | ||||||||||
|
|
|
|
|
|
|
|
|
|
|
|||||||||||
| (1) | Includes 7%, 2% and 1% in cost of product revenues to related parties for the years ended December 31, 2013, 2012 and 2011, respectively. See Note 18 of our accompanying audited consolidated financial statements. Includes 7% in cost of product revenues to related parties for each of the three months ended March 31, 2014 and 2013. See Note 14 of our accompanying unaudited condensed consolidated financial statements. |
Comparison of Three Months Ended March 31, 2014 and 2013
Product Revenues
| THREE MONTHS ENDED MARCH 31, |
||||||||
| 2014 | 2013 | |||||||
| (Dollars in thousands) |
||||||||
| Product revenues |
$ | 2,097 | $ | 2,373 | ||||
| % of total revenues |
75 | % | 87 | % | ||||
Product revenues decreased by approximately $0.3 million, or 12%, which we believe was primarily due to changes in our customers’ timing of orders as fluctuations in the timing of pest control and plant health product sales orders are not uncommon given seasonality in the agricultural industry and the impact that weather may have on the timing of the application of our products.
49
Table of Contents
License Revenues
| THREE MONTHS ENDED MARCH 31, |
||||||||
| 2014 | 2013 | |||||||
| (Dollars in thousands) |
||||||||
| License revenues |
$ | 45 | $ | 48 | ||||
| % of total revenues |
2 | % | 2 | % | ||||
License revenues related to certain strategic collaboration and distribution agreements decreased by 6% but do not comprise a significant portion of our total revenues.
Related Party Revenues
| THREE MONTHS ENDED MARCH 31, |
||||||||
| 2014 | 2013 | |||||||
| (Dollars in thousands) |
||||||||
| Related party revenues |
$ | 648 | $ | 309 | ||||
| % of total revenues |
23 | % | 11 | % | ||||
For the three months ended March 31, 2014 and 2013, related party revenues totaled $0.6 million and $0.3 million, respectively, of which $0.3 million and $0.3 million, respectively, was related to product revenues and $0.3 million and $33,000, respectively, was related to license revenues. Related party revenues increased by approximately $0.3 million, or 110%, as a result of approximately $0.3 million that was recognized during the three months ended March 31, 2014 upon the termination of one of our agreements with Syngenta, an affiliate of one of our 5% stockholders.
Cost of Product Revenues and Gross Profit
| THREE MONTHS ENDED MARCH 31, |
||||||||
| 2014 | 2013 | |||||||
| (Dollars in thousands) |
||||||||
| Cost of product revenues |
$ | 1,652 | $ | 1,795 | ||||
| % of total revenues |
59 | % | 66 | % | ||||
| Gross Profit |
$ | 1,138 | $ | 935 | ||||
| % of total revenues |
41 | % | 34 | % | ||||
Our cost of product revenues decreased by $0.1 million, or 8%, and our gross margins increased from 34% to 41%. Cost of product revenues decreased and gross margin increased primarily due to a change in product mix, with Regalia representing an increased percentage of total sales, which has a higher margin than Grandevo. In addition, as discussed above, there was an increase in related party revenues as a result of $0.3 million that was recognized during the three months ended March 31, 2014 upon the termination of one of our agreements with Syngenta for which there was no corresponding cost of product revenues.
50
Table of Contents
Research, Development and Patent Expenses
| THREE MONTHS ENDED MARCH 31, |
||||||||
| 2014 | 2013 | |||||||
| (Dollars in thousands) |
||||||||
| Research, development and patent expenses |
$ | 4,282 | $ | 3,283 | ||||
| % of total revenues |
153 | % | 120 | % | ||||
Research, development and patent expenses increased by approximately $1.0 million, or 30%, due to an increase of $0.1 million in direct research and development testing costs, $0.7 million in employee related expenses driven by increased headcount, which includes an increase in share-based compensation of $0.2 million, $0.1 million in fixed expenses primarily related to depreciation and $0.1 million in supplies, outside services and general costs.
Selling, General and Administrative Expenses
| THREE MONTHS ENDED MARCH 31, |
||||||||
| 2014 | 2013 | |||||||
| (Dollars in thousands) |
||||||||
| Selling, general and administrative expenses |
$ | 6,330 | $ | 2,847 | ||||
| % of total revenues |
227 | % | 104 | % | ||||
Selling, general and administrative expenses increased by approximately $3.5 million, or 122%, due to an increase of $2.3 million in employee related expenses driven by increased headcount, which includes an increase in share-based compensation of $1.0 million, $0.3 million in fixed expenses primarily related to depreciation, $0.6 million in outside services, $0.1 million in travel and $0.2 million in supplies and general costs.
Other Income (Expense), Net
| THREE MONTHS ENDED MARCH 31, |
||||||||
| 2014 | 2013 | |||||||
| (Dollars in thousands) |
||||||||
| Interest income |
$ | 10 | $ | 1 | ||||
| Interest expense |
(773 | ) | (1,985 | ) | ||||
| Change in estimated fair value of financial instruments |
— | (3,563 | ) | |||||
| Other expense, net |
(9 | ) | (7 | ) | ||||
|
|
|
|
|
|||||
| Total other expense, net |
$ | (772 | ) | $ | (5,554 | ) | ||
|
|
|
|
|
|||||
Interest expense decreased due to the conversion of convertible notes into shares of our common stock immediately following the completion of the IPO in August 2013. Accordingly, we ceased to incur the interest expense associated with these convertible notes. This was partially offset by an increase in interest expense as we issued promissory notes in the amount of $4.95 million in April 2013.
The change in the estimated fair value of financial instruments was associated with outstanding warrants and convertible notes issued in 2012 and 2013. Upon the closing of the IPO, all shares of our outstanding convertible preferred stock and convertible notes automatically converted into shares of common stock and outstanding warrants
51
Table of Contents
to purchase convertible preferred stock and certain warrants to purchase common stock were exercised for shares of common stock. Accordingly, we ceased to incur the interest expense and change in estimated fair value of financial instruments associated with the convertible preferred stock and convertible notes.
Comparison of the Years Ended December 31, 2013, 2012 and 2011
Product Revenues
| YEAR ENDED DECEMBER 31, | ||||||||||||
| 2013 | 2012 | 2011 | ||||||||||
| (Dollars in thousands) | ||||||||||||
| Product revenues |
$ | 12,657 | $ | 6,777 | $ | 5,044 | ||||||
| % of total revenues |
87 | % | 95 | % | 96 | % | ||||||
Product revenues increased by approximately $5.9 million, or 87%, in 2013 compared to 2012 and $1.7 million, or 34%, in 2012 compared to 2011. Product revenues increased in 2013 compared to 2012 due to increased acceptance of our products, with Grandevo representing an increased percentage of total sales as we launched the most popular formulation of Grandevo in the summer of 2012. In addition, revenue has increased as our products are used on an expanded number of crops, such as row crops.
Product revenues increased in 2012 compared to 2011 as a result of a $1.8 million increase in Regalia and Grandevo sales, including $0.9 million related to an increase in international sales. Grandevo was introduced in 2011, and the year ended December 31, 2012 represented the first full year of sales of this product. The increased revenues due to sales of Regalia and Grandevo were partially offset by a $0.1 million decrease in sales of our GreenMatch product, which we elected to discontinue marketing in mid-2011 to focus on more attractive opportunities and products.
License Revenues
| YEAR ENDED DECEMBER 31, | ||||||||||||
| 2013 | 2012 | 2011 | ||||||||||
| (Dollars in thousands) | ||||||||||||
| License revenues |
$ | 193 | $ | 179 | $ | 57 | ||||||
| % of total revenues |
1 | % | 2 | % | 1 | % | ||||||
License revenues related to certain strategic collaboration and distribution agreements increased by 8% in 2013 compared to 2012 and 214% in 2012 compared to 2011 but do not comprise a significant portion of our total revenues.
Related Party Revenues
| YEAR ENDED DECEMBER 31, | ||||||||||||
| 2013 | 2012 | 2011 | ||||||||||
| (Dollars in thousands) | ||||||||||||
| Related party revenues |
$ | 1,693 | $ | 184 | $ | 150 | ||||||
| % of total revenues |
12 | % | 3 | % | 3 | % | ||||||
Related party revenues increased by approximately $1.5 million, or 820%, in 2013 compared to 2012 and $0.1 million, or 23%, in 2012 compared to 2011. Related party revenues increased in 2013 compared to 2012 and in 2012 compared to 2011 due to increased product sales to The Tremont Group, Inc. as they increased sales of our product to a larger number of end users as a result of increased acceptance of our products.
52
Table of Contents
Cost of Product Revenues and Gross Profit
| YEAR ENDED DECEMBER 31, | ||||||||||||
| 2013 | 2012 | 2011 | ||||||||||
| (Dollars in thousands) | ||||||||||||
| Costs of product revenues |
$ | 10,736 | $ | 4,333 | $ | 2,172 | ||||||
| % of total revenues |
74 | % | 61 | % | 41 | % | ||||||
| Gross profit |
$ | 3,807 | $ | 2,807 | $ | 3,079 | ||||||
| % of total revenues (gross margin) |
26 | % | 39 | % | 59 | % | ||||||
Our cost of product revenues increased by $6.4 million, or 148%, in 2013 compared to 2012 and $2.2 million, or 99%, in 2012 as compared to 2011. Our gross margins decreased from 39% to 26% in 2013 compared to 2012 and from 59% to 39% in 2012 compared to 2011. Cost of product revenues increased and gross margin decreased in 2013 compared to 2012, in each case, primarily due to a change in product mix, with Grandevo representing an increased percentage of total sales as we launched the most popular formulation of Grandevo in the summer of 2012 along with increased product acceptance leading to an overall increase in sales and cost of product revenues. Since Grandevo is early in its life cycle, our gross margins have been negatively affected. However, we expect to see a gradual increase in gross margin over the life cycle of each of our products, including Grandevo, as we improve production processes, gain efficiencies and increase product yields. Cost of product revenues and gross margin were also negatively impacted by a $0.2 million write-down of the carrying value of Zequanox inventory to net realizable value, a $0.2 million write-off of inventory primarily due to abnormal scrap and the identification of inventory that was not suitable for sale, a $0.2 million write-down of the carrying value of deferred cost of product revenues to net realizable value and an increase in the discounts offered on product sales.
Cost of product revenues increased in 2012 compared to 2011 due to a $0.9 million charge in 2012 due to an inventory write-off of an early formulation of our Zequanox line of products that was not suitable for sale, and a $1.4 million increase in product costs consisting of $0.4 million and $0.6 million associated with higher revenues from Regalia and Grandevo, respectively, $0.3 million associated with increased royalties and purchase incentives and $0.1 million of other product costs, primarily associated with Zequanox. These higher costs were offset by a $0.1 million decrease in GreenMatch product costs.
Research, Development and Patent Expenses
| YEAR ENDED DECEMBER 31, | ||||||||||||
| 2013 | 2012 | 2011 | ||||||||||
| (Dollars in thousands) | ||||||||||||
| Research, development and patent expenses |
$ | 17,814 | $ | 12,741 | $ | 9,410 | ||||||
| % of total revenues |
122 | % | 178 | % | 179 | % | ||||||
Research, development and patent expense increased by $5.1 million, or 40%, in 2013 compared to 2012 and $3.3 million, or 35%, in 2012 compared to 2011. Research, development and patent expense increased in 2013 compared to 2012 primarily due to an increase of $2.4 million in employee-related expenses, which consisted primarily of salaries, wages and share-based compensation, $1.5 million in direct testing costs, $0.4 million in outside services, $0.3 million in depreciation, a reduction of $0.2 million in grants received, and $0.3 million in travel and general costs.
Research, development and patent expense increased in 2012 compared to 2011 due to an increase of approximately $1.3 million in direct testing costs, $1.1 million in employee-related expenses driven by increased headcount, $0.2 million in supplies and materials, $0.2 million in fixed expenses primarily related to rent and depreciation, $0.2 million in outside consulting services and $0.3 million in travel expenses and general costs. Our direct testing costs in fiscal year 2012 were primarily driven by testing of Regalia and Zequanox for foreign markets.
53
Table of Contents
Non-Cash Charge Associated with a Convertible Note
| YEAR ENDED DECEMBER 31, | ||||||||||||
| 2013 | 2012 | 2011 | ||||||||||
| (Dollars in thousands) | ||||||||||||
| Non-cash charge associated with a convertible note |
$ | — | $ | 3,610 | $ | — | ||||||
| % of total revenues |
— | % | 51 | % | — | % | ||||||
This charge was associated with the issuance of a convertible note during 2012 for which the estimated fair value at the date of issuance was greater than the proceeds received from the convertible note. Because the holder of this convertible note was one of our preferred stockholders and was an affiliate of one of our distributors as of the date of issuance, we recorded $0.3 million of the expense as a reduction to the revenues associated with the affiliated distributor from inception through the date of issuance, and the remaining $3.6 million was recorded in operating expenses as a non-recurring non-cash charge associated with a convertible note.
Selling, General and Administrative Expenses
| YEAR ENDED DECEMBER 31, | ||||||||||||
| 2013 | 2012 | 2011 | ||||||||||
| (Dollars in thousands) | ||||||||||||
| Selling, general and administrative expenses |
$ | 15,018 | $ | 10,294 | $ | 6,793 | ||||||
| % of total revenues |
103 | % | 144 | % | 129 | % | ||||||
Selling, general and administrative expense increased by $4.7 million, or 46%, in 2013 compared to 2012 and $3.5 million, or 52%, in 2012 compared to 2011. Selling, general and administrative expense increased in 2013 compared to 2012 primarily due to an increase of $2.3 million in employee-related expenses, driven by increased headcount, which primarily related to salaries, wages and share-based compensation and $0.4 million relating to a transition agreement with our Chief Financial Officer, $1.4 million was attributable to outside services such as consulting, audit and tax fees, as well as other professional services, $0.2 million in travel expenses and $0.4 million in other costs including rent, depreciation, supplies and materials.
Of the increase in 2012 compared to 2011, $2.0 million was employee-related driven by increased headcount, $1.1 million was attributable to marketing and professional services and overhead costs and $0.4 million was travel-related.
Other Income (Expense), Net
| YEAR ENDED DECEMBER 31, | ||||||||||||
| 2013 | 2012 | 2011 | ||||||||||
| (Dollars in thousands) | ||||||||||||
| Interest income |
$ | 49 | $ | 16 | $ | 22 | ||||||
| Interest expense |
(5,997 | ) | (2,466 | ) | (88 | ) | ||||||
| Change in estimated fair value of financial instruments |
6,717 | (12,461 | ) | 1 | ||||||||
| Gain on extinguishment of debt |
49 | — | — | |||||||||
| Other (expense) income, net |
(282 | ) | (45 | ) | 9 | |||||||
|
|
|
|
|
|
|
|||||||
| Total other income (expense), net |
$ | 536 | $ | (14,956 | ) | $ | (56 | ) | ||||
|
|
|
|
|
|
|
|||||||
Interest income, consisting primarily of interest on cash and short-term investments, was largely unchanged. In regards to the increase in interest expense, in May 2013, we issued a $3.0 million convertible note, and we incurred $1.2 million of interest expense for the year ended December 31, 2013 as a result of the excess in the $4.2 million estimated fair value of the convertible note on the date of issuance compared to the cash received. Immediately
54
Table of Contents
following the completion of the IPO in August 2013, the convertible notes converted into shares of our common stock. Accordingly, we will cease to incur the interest expense associated with these convertible notes. In addition, in connection with the repayment of the April 2012 Senior Secured Promissory Note, we wrote-off the unamortized debt discount totaling $0.8 million and incurred an early termination fee of $0.3 million, which were recorded to interest expense during the year ended December 31, 2013. The remainder of the change in interest expense was due to increased borrowings under notes payable, convertible notes and capital lease agreements.
The change in the estimated fair value of financial instruments was associated with outstanding warrants and convertible notes issued in 2012 and 2013. We issued $30.6 million in convertible notes, warrants to purchase 0.2 million shares of Series C convertible preferred stock and warrants for the issuance of a variable number of shares of common stock based on a fixed monetary amount during that time. This was offset by the decrease in convertible notes of $1.25 million in May 2013 in connection with the conversion of a portion of a convertible note in exchange for a promissory note. Upon the closing of the IPO, all shares of our outstanding convertible preferred stock and convertible notes automatically converted into shares of common stock and outstanding warrants to purchase convertible preferred stock and certain warrants to purchase common stock were exercised for shares of common stock. Accordingly, we will cease to incur the interest expense and change in estimated fair value of financial instruments associated with the convertible preferred stock and convertible notes. See the notes to our accompanying audited consolidated financial statements for further discussion.
Other expense for the year ended December 31, 2013 primarily reflects a loss on disposal of fixed assets in the amount of $0.2 million. The remainder of other expense related to foreign currency transaction expenses incurred during the year.
Seasonality and Quarterly Results
Our sales of individual products are generally expected to be seasonal. For example, we expect that our Regalia, Grandevo and Venerate product lines will be sold and applied to crops in greater quantity in the second and fourth quarters. These seasonal variations may be especially pronounced because sales have been primarily limited to our Regalia and Grandevo product lines in the Northern Hemisphere. In addition, in May 2014, we began to sell Venerate, a bioinsecticide, in the Northern Hemisphere. As we expand the registration and commercialization of our product lines into the Southern Hemisphere, where seasonality of sales should be counter cyclical to the Northern Hemisphere, we expect worldwide sales volatility to decrease over time. In addition, we expect that our sales of Zequanox will be seasonal. Invasive zebra and quagga mussels typically feed and reproduce at water temperatures above 59°F. Treatments to kill these mussels are therefore most effective from June through September in the Eastern United States, Canada and Europe and from April through October in the Southwestern United States.
Planting and growing seasons, climatic conditions and other variables on which sales of our products are dependent vary from year to year and quarter to quarter. As a result, we have historically experienced substantial fluctuations in quarterly sales. In particular, weather conditions and natural disasters such as heavy rains, hurricanes, hail, floods, tornadoes, freezing conditions, drought or fire, affect decisions by our distributors, direct customers and end users about the types and amounts of pest management and plant health products to purchase and the timing of use of such products. For example, in 2013 and 2012, the United States experienced nationwide abnormally low rainfall or drought, reducing the incidence of fungal diseases such as mildews, and these conditions have been present in some of our key markets in the first quarter of 2014 as well. On the other hand, drought may increase the incidence of pest insect infestations, and therefore we believe sales of insecticides, including Grandevo and Venerate, may increase during times of drought. In addition, disruptions that cause delays by growers in harvesting or planting can result in the movement of orders to a future quarter, which would negatively affect the quarter and cause fluctuations in our operating results. For example, late snows and cold temperatures in the Midwestern and Eastern United States in the first quarter of 2014 have delayed planting and pesticide applications. Since Regalia and Grandevo products have different margins, changes in product mix due to these conditions could affect our overall margins.
The level of seasonality in our business overall is difficult to evaluate as a result of our relatively early stage of development, our relatively limited number of commercialized products, our expansion into new geographical
55
Table of Contents
territories, the introduction of new products and the timing of introductions of new formulations and products. It is possible that our business may be more seasonal, or experience seasonality in different periods, than anticipated. For example, if sales of Zequanox become a more significant component of our revenue, the separate seasonal sales cycles could cause further shifts in our quarterly revenue. Other factors may also contribute to the unpredictability of our operating results, including the size and timing of significant distributor transactions, the delay or deferral of use of our products and the fiscal or quarterly budget cycles of our distributors, direct customers and end users. Customers may purchase large quantities of our products in a particular quarter to store locally and use quickly when weather permits growers to get into the fields and also to use over longer periods of time as conditions may change rapidly thus customers may time their purchases to manage their inventories, which may cause significant fluctuations in our operating results for a particular quarter or year.
The following tables set forth our unaudited quarterly consolidated statements of operations data in dollars and as a percentage of total revenues for the first quarter of fiscal year 2014 and for each of the four quarters covering fiscal years 2013 and 2012. We have prepared the quarterly consolidated statements of operations data on a basis consistent with the audited consolidated financial statements included elsewhere in this prospectus. In the opinion of management, the financial information reflects all adjustments, consisting only of normal recurring adjustments, which we consider necessary for a fair presentation of this data. This information should be read in connection with the accompanying audited consolidated financial statements and related notes. The results of historical periods are not necessarily indicative of the results of operations for any future period.
Fiscal Year 2012:
| MARCH 31, 2012 |
JUNE 30, 2012 |
SEPTEMBER 30, 2012 |
DECEMBER 31, 2012 |
|||||||||||||
| (In thousands) | ||||||||||||||||
| Revenues: |
||||||||||||||||
| Product |
$ | 1,808 | $ | 1,385 | $ | 662 | $ | 2,922 | ||||||||
| License |
43 | 44 | 43 | 49 | ||||||||||||
| Related party |
148 | 80 | 33 | (77 | ) | |||||||||||
|
|
|
|
|
|
|
|
|
|||||||||
| Total revenues |
1,999 | 1,509 | 738 | 2,894 | ||||||||||||
| Cost of product revenues (1) |
860 | 684 | 521 | 2,268 | ||||||||||||
|
|
|
|
|
|
|
|
|
|||||||||
| Gross profit |
1,139 | 825 | 217 | 626 | ||||||||||||
| Operating expenses: |
||||||||||||||||
| Research, development and patent |
2,733 | 2,415 | 3,350 | 4,243 | ||||||||||||
| Non-cash charge associated with a convertible note |
— | — | — | 3,610 | ||||||||||||
| Selling, general and administrative |
2,322 | 2,166 | 2,617 | 3,189 | ||||||||||||
|
|
|
|
|
|
|
|
|
|||||||||
| Total operating expenses |
5,055 | 4,581 | 5,967 | 11,042 | ||||||||||||
|
|
|
|
|
|
|
|
|
|||||||||
| Loss from operations |
(3,916 | ) | (3,756 | ) | (5,750 | ) | (10,416 | ) | ||||||||
| Other income (expense): |
||||||||||||||||
| Interest income |
2 | 4 | 10 | — | ||||||||||||
| Interest expense |
(56 | ) | (601 | ) | (593 | ) | (1,216 | ) | ||||||||
| Change in estimated fair value of financial instruments |
(15 | ) | 435 | (7,473 | ) | (5,408 | ) | |||||||||
| Other (expense) income, net |
1 | 6 | 4 | (56 | ) | |||||||||||
|
|
|
|
|
|
|
|
|
|||||||||
| Total other expense, net |
(68 | ) | (156 | ) | (8,052 | ) | (6,680 | ) | ||||||||
|
|
|
|
|
|
|
|
|
|||||||||
| Income taxes |
— | — | — | — | ||||||||||||
|
|
|
|
|
|
|
|
|
|||||||||
| Net loss |
$ | (3,984 | ) | $ | (3,912 | ) | $ | (13,802 | ) | $ | (17,096 | ) | ||||
|
|
|
|
|
|
|
|
|
|||||||||
56
Table of Contents
| MARCH 31, 2012 |
JUNE 30, 2012 |
SEPTEMBER 30, 2012 |
DECEMBER 31, 2012 |
|||||||||||||
| Revenues: |
||||||||||||||||
| Product |
91 | % | 92 | % | 90 | % | 101 | % | ||||||||
| License |
2 | 3 | 6 | 2 | ||||||||||||
| Related party |
7 | 5 | 4 | (3 | ) | |||||||||||
|
|
|
|
|
|
|
|
|
|||||||||
| Total revenues |
100 | 100 | 100 | 100 | ||||||||||||
| Cost of product revenues (2) |
43 | 45 | 71 | 78 | ||||||||||||
|
|
|
|
|
|
|
|
|
|||||||||
| Gross profit |
57 | 55 | 29 | 22 | ||||||||||||
| Operating expenses: |
||||||||||||||||
| Research, development and patent |
137 | 160 | 454 | 147 | ||||||||||||
| Non-cash charge associated with a convertible note |
— | — | — | 125 | ||||||||||||
| Selling, general and administrative |
116 | 143 | 355 | 110 | ||||||||||||
|
|
|
|
|
|
|
|
|
|||||||||
| Total operating expenses |
253 | 303 | 809 | 382 | ||||||||||||
|
|
|
|
|
|
|
|
|
|||||||||
| Loss from operations |
(196 | ) | (248 | ) | (780 | ) | (360 | ) | ||||||||
| Other income (expense): |
||||||||||||||||
| Interest income |
— | — | 1 | — | ||||||||||||
| Interest expense |
(3 | ) | (40 | ) | (80 | ) | (42 | ) | ||||||||
| Change in estimated fair value of financial instruments |
— | 29 | (1,013 | ) | (187 | ) | ||||||||||
| Other (expense) income, net |
— | — | 1 | (2 | ) | |||||||||||
|
|
|
|
|
|
|
|
|
|||||||||
| Total other expense, net |
(3 | ) | (11 | ) | (1,091 | ) | (231 | ) | ||||||||
|
|
|
|
|
|
|
|
|
|||||||||
| Income taxes |
— | — | — | — | ||||||||||||
|
|
|
|
|
|
|
|
|
|||||||||
| Net loss |
(199 | )% | (259 | )% | (1,871 | )% | (591 | )% | ||||||||
|
|
|
|
|
|
|
|
|
|||||||||
| (1) | Includes less than $0.1 million in cost of product revenues to related parties for each of the quarters ended March 31, 2012, June 30, 2012 and December 31, 2012. See Note 18 of our accompanying audited consolidated financial statements for further discussion. |
| (2) | Includes 4%, 1% and 2% in cost of product revenues to related parties for the quarters ended March 31, 2012, June 30, 2012 and December 31, 2012, respectively. See Note 18 of our accompanying audited consolidated financial statements for further discussion. |
57
Table of Contents
Fiscal Year 2013 and First Quarter of Fiscal Year 2014:
| MARCH 31, 2013 |
JUNE 30, 2013 |
SEPTEMBER 30, 2013 |
DECEMBER 31, 2013 |
MARCH 31, 2014 |
||||||||||||||||
| (In thousands) | ||||||||||||||||||||
| Revenues: |
||||||||||||||||||||
| Product |
$ | 2,373 | $ | 4,152 | $ | 1,149 | $ | 4,983 | $ | 2,097 | ||||||||||
| License |
48 | 48 | 48 | 49 | 45 | |||||||||||||||
| Related party |
309 | 300 | 149 | 935 | 648 | |||||||||||||||
|
|
|
|
|
|
|
|
|
|
|
|||||||||||
| Total revenues |
2,730 | 4,500 | 1,346 | 5,967 | 2,790 | |||||||||||||||
| Cost of product revenues (1) |
1,795 | 3,398 | 1,077 | 4,466 | 1,652 | |||||||||||||||
|
|
|
|
|
|
|
|
|
|
|
|||||||||||
| Gross profit |
935 | 1,102 | 269 | 1,501 | 1,138 | |||||||||||||||
| Operating expenses: |
||||||||||||||||||||
| Research, development and patent |
3,283 | 3,941 | 4,454 | 6,136 | 4,282 | |||||||||||||||
| Selling, general and administrative |
2,847 | 3,107 | 4,493 | 4,571 | 6,330 | |||||||||||||||
|
|
|
|
|
|
|
|
|
|
|
|||||||||||
| Total operating expenses |
6,130 | 7,048 | 8,947 | 10,707 | 10,612 | |||||||||||||||
|
|
|
|
|
|
|
|
|
|
|
|||||||||||
| Loss from operations |
(5,195 | ) | (5,946 | ) | (8,678 | ) | (9,206 | ) | (9,474 | ) | ||||||||||
| Other income (expense): |
||||||||||||||||||||
| Interest income |
1 | — | 24 | 24 | 10 | |||||||||||||||
| Interest expense |
(1,985 | ) | (2,285 | ) | (1,119 | ) | (608 | ) | (773 | ) | ||||||||||
| Change in estimated fair value of financial instruments |
(3,563 | ) | 6,550 | 3,730 | — | — | ||||||||||||||
| Gain on extinguishment of debt |
— | 49 | — | — | — | |||||||||||||||
| Other (expense) income, net |
(7 | ) | (7 | ) | (67 | ) | (201 | ) | (9 | ) | ||||||||||
|
|
|
|
|
|
|
|
|
|
|
|||||||||||
| Total other income (expense), net |
(5,554 | ) | 4,307 | 2,568 | (785 | ) | (772 | ) | ||||||||||||
|
|
|
|
|
|
|
|
|
|
|
|||||||||||
| Income taxes |
— | — | — | — | — | |||||||||||||||
|
|
|
|
|
|
|
|
|
|
|
|||||||||||
| Net loss |
$ | (10,749 | ) | $ | (1,639 | ) | $ | (6,110 | ) | $ | (9,991 | ) | $ | (10,246 | ) | |||||
|
|
|
|
|
|
|
|
|
|
|
|||||||||||
58
Table of Contents
| MARCH 31, 2013 |
JUNE 30, 2013 |
SEPTEMBER 30, 2013 |
DECEMBER 31, 2013 |
MARCH 31, 2014 |
||||||||||||||||
| Revenues: |
||||||||||||||||||||
| Product |
87 | % | 92 | % | 85 | % | 84 | % | 75 | % | ||||||||||
| License |
2 | 1 | 4 | 1 | 2 | |||||||||||||||
| Related party |
11 | 7 | 11 | 15 | 23 | |||||||||||||||
|
|
|
|
|
|
|
|
|
|
|
|||||||||||
| Total revenues |
100 | 100 | 100 | 100 | 100 | |||||||||||||||
| Cost of product revenues (2) |
66 | 76 | 80 | 75 | 59 | |||||||||||||||
|
|
|
|
|
|
|
|
|
|
|
|||||||||||
| Gross profit |
34 | 24 | 20 | 25 | 41 | |||||||||||||||
| Operating expenses: |
||||||||||||||||||||
| Research, development and patent |
120 | 87 | 331 | 103 | 153 | |||||||||||||||
| Selling, general and administrative |
104 | 69 | 334 | 77 | 227 | |||||||||||||||
|
|
|
|
|
|
|
|
|
|
|
|||||||||||
| Total operating expenses |
224 | 156 | 665 | 180 | 380 | |||||||||||||||
|
|
|
|
|
|
|
|
|
|
|
|||||||||||
| Loss from operations |
(190 | ) | (132 | ) | (645 | ) | (155 | ) | (339 | ) | ||||||||||
| Other income (expense): |
||||||||||||||||||||
| Interest income |
— | — | 2 | — | — | |||||||||||||||
| Interest expense |
(73 | ) | (50 | ) | (83 | ) | (10 | ) | (28 | ) | ||||||||||
| Change in estimated fair value of financial instruments |
(131 | ) | 145 | 277 | — | — | ||||||||||||||
| Gain on extinguishment of debt |
— | 1 | — | — | — | |||||||||||||||
| Other (expense) income, net |
— | — | (5 | ) | (3 | ) | — | |||||||||||||
|
|
|
|
|
|
|
|
|
|
|
|||||||||||
| Total other income (expense), net |
(204 | ) | 96 | 191 | (13 | ) | (28 | ) | ||||||||||||
|
|
|
|
|
|
|
|
|
|
|
|||||||||||
| Income taxes |
— | — | — | — | — | |||||||||||||||
|
|
|
|
|
|
|
|
|
|
|
|||||||||||
| Net loss |
(394 | )% | (36 | )% | (454 | )% | (168 | )% | (367 | )% | ||||||||||
|
|
|
|
|
|
|
|
|
|
|
|||||||||||
| (1) | Includes $0.2 million, $0.2 million, $0.1 million, $0.6 million and $0.2 million in cost of product revenues to related parties for the quarters ended March 31, 2013, June 30, 2013, September 30, 2013, December 31, 2013 and March 31, 2014 respectively. See Note 18 of our accompanying audited consolidated financial statements for further discussion. |
| (2) | Includes 7%, 4%, 4%, 10% and 7% in cost of product revenues to related parties for the quarters ended March 31, 2013, June 30, 2013, September 30, 2013, December 31, 2013 and March 31, 2014, respectively. See Note 18 of our accompanying audited consolidated financial statements for further discussion. |
Liquidity and Capital Resources
From our inception until the closing of our IPO in August 2013, our operations have been financed primarily by net proceeds from the private placements of convertible preferred stock, convertible notes, promissory notes, term loans, as well as proceeds from the sale of our products and payments under strategic collaboration and distribution agreements and government grants.
In the IPO, we issued 5.5 million shares of our common stock (inclusive of 0.7 million shares of common stock sold upon the exercise of the underwriters’ option to purchase additional shares). The public offering price of the shares sold in the offering was $12.00 per share. The total gross proceeds from the offering to us were $65.6 million, and after deducting underwriting discounts and commissions and offering expenses payable by us, the aggregate net proceeds received totaled approximately $56.1 million. As of March 31, 2014, our cash, cash equivalents and short-term investments totaled $24.0 million. We used a portion of the net proceeds from the IPO, as well as cash available prior to the IPO, to expand capacity at the manufacturing facility we acquired in July 2012 and for other capital expenditures, including purchasing equipment to facilitate our research and development efforts, working capital and other general corporate purposes. As discussed under “Use of Proceeds,” these resources, together with the net proceeds from this offering, may also be used for a variety of additional purposes, including to further expand our product development and marketing efforts and to accelerate the completion of our manufacturing facility. In addition, we expect to receive a $10.0 million loan, to be used to expand capacity at our manufacturing facility, subject to receipt of a USDA guarantee for the financing and completion of related bank documentation. We believe
59
Table of Contents
our current cash and cash equivalents and short-term investments, along with cash from revenues, anticipated borrowings and the net proceeds from this offering, will be sufficient to satisfy our liquidity requirements for the next 24 months. However, we may seek additional funding through debt or equity financings for the foregoing and other purposes, which may not be available to us when needed or on acceptable terms, and we may need to raise capital that may not be available on favorable or acceptable terms, if at all. If we cannot raise money when needed, we may have to reduce or slow sales of product development activities or reduce capital investments.
Since our inception, we have incurred significant net losses, and, as of March 31, 2014, we had an accumulated deficit of $115.7 million, and we expect to incur additional losses related to the continued development and expansion of our business. Our liquidity may be negatively impacted as a result of slower than expected adoption of our products and higher than anticipated costs incurred in connection with repurposing our manufacturing facility acquired in July 2012. We have certain strategic collaboration and distribution agreements under which we receive payments for the achievement of testing validation, regulatory progress and commercialization events. As of March 31, 2014, we had received an aggregate of $2.4 million in payments under these agreements, of which $1.0 million were received from a related party, and there are up to $2.9 million in payments under these agreements that we could potentially receive if the testing validation, regulatory progress and commercialization events occur, of which $1.0 million could potentially be received from a related party.
For the years ended December 31, 2013, 2012 and 2011 and the three months ended March 31, 2014, we used $4.0 million, $2.8 million, $0.4 million, and $5.0 million respectively, in cash to fund capital expenditures. In July 2012, we acquired a manufacturing facility, including associated land, property and equipment, located in Bangor, Michigan, for approximately $1.5 million. Our business plan contemplates developing significant internal commercial manufacturing capacity using this facility. Repurposing and expansion of the facility will be completed in multiple phases with an anticipated total capital expenditure of $32.0 million. Phase 1 of the project includes installation of the first of three fermentation tanks, and the construction of a dedicated building to house them. In December 2013, we produced the first test batch of Grandevo at this facility and expect to begin full-scale production of our products using our own manufacturing capacity in 2014. Future phases will include production of our Regalia biofungicide and Zequanox, as well as increasing the capacity of the facility’s utilities, installing drying capacity and installing larger fermenters that will accommodate production of multiple products at higher volumes.
We had the following debt arrangements in place as of March 31, 2014, in each case as discussed below (dollars in thousands):
| DESCRIPTION |
STATED ANNUAL INTEREST RATE |
PRINCIPAL AMOUNT BALANCE (INCLUDING ACCRUED INTEREST) |
PAYMENT/MATURITY | |||||||
| Promissory Note (1) |
7.00 | % | $ | 88 | Monthly/November 2014 | |||||
| Term Loan (1) |
7.00 | % | $ | 279 | Monthly/April 2016 | |||||
| Promissory Notes (2) |
12.00 | % | $ | 12,450 | Monthly (4)/October 2015 | |||||
| Credit Facility (3) |
10.00 | % | $ | — | June 2014 | |||||
| (1) | See “—Five Star Bank.” |
| (2) | See “—October 2012 and April 2013 Junior Secured Promissory Notes.” |
| (3) | See “—June 2013 Credit Facility.” |
| (4) | Monthly payments are interest only until maturity. |
Five Star Bank
We have entered into two promissory notes with Five Star Bank. In May 2008, we entered into a promissory note that we fully repaid in May 2013, and in March 2009, we entered into a promissory note that we repay at a rate of approximately $13,000 per month through maturity in November 2014. In addition, in March 2012, we entered into a term loan agreement with Five Star Bank, which replaced our existing revolving line of credit with the bank. Under the term loan agreement, we are obligated to repay the loan at a rate of approximately $12,000 per month through maturity.
60
Table of Contents
Under the terms of the promissory notes and the term loan agreement, all of our outstanding debt to Five Star Bank is secured by all of our inventory, chattel paper, accounts receivable, equipment and general intangibles (excluding certain financed equipment and any intellectual property). Among other things, a payment default with respect to each of the promissory notes and the term loan, as well as other events such as a default under other loans or agreements that would materially affect us, constitute events of default. Upon an event of default, Five Star Bank may declare the entire unpaid principal and interest immediately due and payable.
October 2012 and April 2013 Junior Secured Promissory Notes
In October 2012, we completed the sale of promissory notes in the aggregate principal amount of $7.5 million to 12 lenders in a private placement. In addition, in April 2013, we completed the sale of an additional $4.95 million of promissory notes to 10 investors in a private placement under an amendment to the note purchase agreement in exchange for $3.7 million in cash and $1.25 million in cancellation of indebtedness under the October 2012 Subordinated Convertible Note, an outstanding convertible note. Maturity, currently October 2015, may be extended in one year increments for a period of no more than two years. In the event the maturity date is extended, the interest rate increases to 13% in the first year of the extension and the note matures in October 2016, and if extended for an additional year thereafter, the interest rate increases to 14% in the second year of extension and the note matures in October 2017. These promissory notes are secured by a security interest in all of our present and future accounts receivable, chattel paper, commercial tort claims, goods, inventory, equipment, personal property, instruments, investment properties, documents, letter of credit rights, deposit accounts, general intangibles, records, real property, appurtenances and fixtures, tenant improvements and intellectual property, which consists in part of our patents, copyrights and other intangibles.
June 2013 Credit Facility
On June 14, 2013, we entered into a credit facility agreement with a group of lenders. Under the credit agreement, the lenders have committed to permit us to draw an aggregate of up to $5.0 million, and, subject to our obtaining additional commitments from lenders, such amount may be increased to up to $7.0 million. The credit facility expires on June 30, 2014. During the term of the credit facility, we may request from the lenders up to four advances, with each advance equal to one-quarter of each lender’s aggregate commitment amount. We would issue promissory notes in the principal amount of each such advance that would accrue interest at a rate of 10% per annum. We are not obligated to pay principal or interest on the promissory notes until their maturity on June 30, 2014, at which point all principal and unpaid interest would become due. In addition, we may not prepay any of such promissory notes prior to their maturity date without consent of at least a majority in interest of the aggregate principal amount of the promissory notes then outstanding under the credit facility. In addition, in connection with our entry into the credit facility agreement, we agreed to pay each lender a fee of 2% of such lender’s commitment amount, and we issued to each lender a warrant to purchase a variable number of common shares, with warrant coverage equal to a number of shares determined by multiplying such lender’s commitment amount by 10% and dividing such product by 70% of the initial public offering price per share, and with the exercise price for the warrants equal to 70% of the initial public offering price per share. Upon the closing of our IPO in August 2013, the number of shares subject to the warrants and their exercise prices became fixed.
As of March 31, 2014, we have not drawn on the credit facility, and accordingly have issued no promissory notes and have no outstanding indebtedness thereunder. In August 2013, the board of directors resolved not to call for any advances under the credit facility.
61
Table of Contents
Revolving Line of Credit
In April 2014, we entered into an agreement with a bank for a revolving line of credit, which allows us to borrow up to $5.0 million with an interest rate of 1.5%. The line of credit is payable in full upon the bank’s demand, if no demand is made, it is payable in full in April 2015. Interest is payable monthly beginning in May 2014. In accordance with the terms of the agreement, we deposited $5.0 million into a restricted deposit account with the bank as collateral.
The following table sets forth a summary of our cash flows for the periods indicated:
| YEAR ENDED DECEMBER 31, | THREE MONTHS ENDED MARCH 31, 2014 |
|||||||||||||||
| 2013 | 2012 | 2011 | ||||||||||||||
| (In thousands) | ||||||||||||||||
| Net cash used in operating activities |
$ | (34,005 | ) | $ | (22,425 | ) | $ | (12,425 | ) | $ | (9,882 | ) | ||||
| Net cash provided by (used in) investing activities |
(17,679 | ) | (757 | ) | (2,423 | ) | 5,960 | |||||||||
| Net cash provided by financing activities |
66,133 | 30,973 | 12,776 | 765 | ||||||||||||
|
|
|
|
|
|
|
|
|
|||||||||
| Net increase (decrease) in cash and cash equivalents |
$ | 14,449 | $ | 7,791 | $ | (2,072 | ) | $ | (3,157 | ) | ||||||
|
|
|
|
|
|
|
|
|
|||||||||
Cash Flows from Operating Activities
Net cash used in operating activities of $34.0 million during the twelve months ended December 31, 2013 primarily resulted from our net loss of $28.5 million, which included a gain of $6.7 million in connection with a change in the fair value of financial instruments and $4.3 million in non-cash interest expense, $2.3 million in share-based compensation expense, $1.0 million in depreciation and amortization expense and $0.2 million in loss on disposal of equipment. In addition, net cash used in operating activities resulted from increases in accounts receivable of $3.4 million, accounts receivable due from related parties of $0.8 million, inventory of $6.8 million and a decrease in deferred revenue from related parties of $0.1 million. This was offset by a decrease in prepaid expenses and other assets of $1.0 million, an increase of $1.7 million in accounts payable, $1.0 million in accrued and other liabilities, and $0.8 million in deferred revenue.
Net cash used in operating activities of $22.4 million during the twelve months ended December 31, 2012 primarily resulted from our net loss of $38.8 million, which included non-cash charges of $12.5 million in connection with a change in fair value of financial instruments, $3.9 million in connection with the issuance of a convertible note, $1.2 million of non-cash interest expense, $0.7 million in share-based compensation and $0.6 million in depreciation and amortization. In addition, net cash used in operating activities resulted from net changes in operating assets and liabilities of $2.5 million, primarily due to increases in inventory of $1.6 million, $2.5 million in accounts receivable, $0.1 million in accounts receivable from related parties and $2.1 million in prepaid expenses and other assets, offset by an increase of $0.3 million in deferred revenue, $0.9 million in deferred revenue from related parties and $2.6 million in accounts payable, accrued liabilities and other liabilities.
Net cash used in operating activities of $12.4 million during the twelve months ended December 31, 2011 primarily resulted from our net loss of $13.2 million, an increase in inventory of $1.7 million, an increase in accounts receivable from related parties of $0.1 million and net increases in prepaid expenses and other assets of $0.6 million. This was offset by $0.5 million in depreciation and amortization expense, $0.3 million in share-based compensation expense, an increase of $0.8 million in deferred revenue, an increase of $0.8 million in accrued and other liabilities, an increase of $0.4 million in accounts payable and a decrease $0.4 million in accounts receivable.
Net cash used in operating activities of $9.9 million during the three months ended March 31, 2014 primarily resulted from our net loss of $10.2 million, increases in accounts receivable of $1.0 million, accounts receivable from related parties of $0.3 million, inventories of $1.2 million and prepaid expenses and other assets of $0.2 million, and decreases in accrued and other liabilities of $1.3 million, deferred revenue of $0.2 million and deferred revenue from related parties of $0.3 million. This was offset by $0.5 million in depreciation and amortization expense, $1.5 million in share-based compensation expense, $0.2 million in non-cash interest expense and an increase in accounts payable of $2.7 million.
62
Table of Contents
Cash Flows from Investing Activities
Net cash used in investing activities of $17.7 million during the twelve months ended December 31, 2013 primarily resulted from $4.0 million used for the purchase of property, plant and equipment, primarily associated with a manufacturing plant and its subsequent improvement and $17.5 million in cash for the purchase of short-term investments, offset by $3.8 million in cash provided by maturities of short-term investments.
Net cash used in investing activities was $0.8 million during the twelve months ended December 31, 2012, consisting of approximately $2.8 million used for purchase of property, plant and equipment, primarily associated with a manufacturing plant and its subsequent improvement, offset by $2.0 million provided from the maturity of a short-term investment.
Net cash used in investing activities was $2.4 million during the twelve months ended December 31, 2011. Of these amounts, we used $0.4 million for the purchase of property and equipment to support growth in our operations and $2.0 million in cash for the purchase of short-term investments.
Net cash provided by investing activities of $6.0 million during the three months ended March 31, 2014 consisted primarily of maturities of short-term investments in the amount of $11.1 million, offset by $5.0 million used for the purchase of property, plant and equipment, primarily associated with a manufacturing plant and its subsequent improvement.
Cash Flows from Financing Activities
Net cash provided by financing activities of $66.1 million during the twelve months ended December 31, 2013 consisted primarily of $56.1 million in proceeds from the initial public offering, net of offering costs and underwriter commissions, $6.5 million from the issuance of convertible notes, $3.7 million from the issuance of debt, net of financing costs, $9.1 million from the release of restricted cash, $2.9 million in proceeds from secured borrowing and $0.3 million in proceeds from the exercise of stock options. This was offset by $9.6 million in payments on our debt and capital leases and $2.9 million in reductions of secured borrowing.
Net cash provided by financing activities of $31.0 million during the twelve months ended December 31, 2012 consisted primarily of $24.1 million from the issuance of convertible notes, $17.4 million from the issuance of debt, net of financing costs and $0.5 million in draws on our line of credit, partially offset by $9.1 million transferred from cash to restricted cash as part of our obligations under a debt agreement to repay a then-outstanding note payable and $1.9 million in payments on our line of credit, debt and capital lease obligations.
Net cash provided by financing activities of $12.8 million during the twelve months ended December 31, 2011 consisted primarily of $13.2 million from the issuance of preferred stock and $0.5 million in draws on our line of credit, partially offset by $0.9 million in payments on our line of credit, debt and capital lease obligations.
Net cash provided by financing activities of $0.8 million during the three months ended March 31, 2014 consisted primarily of $0.9 million from the exercise of stock options and warrants. This was offset by $0.1 million in payments on our debt and capital leases.
Contractual Obligations
The following is a summary of our contractual obligations as of March 31, 2014:
| TOTAL | 2014 | 2015-2016 | 2017-2018 | 2019 AND BEYOND |
||||||||||||||||
| (In thousands) | ||||||||||||||||||||
| Operating lease obligations |
$ | 3,764 | $ | 845 | $ | 1,487 | $ | 1,225 | $ | 207 | ||||||||||
| Debt and capital leases |
15,558 | 1,434 | 14,124 | — | — | |||||||||||||||
| Interest payments relating to debt and capital leases |
2,462 | 1,261 | 1,201 | — | — | |||||||||||||||
|
|
|
|
|
|
|
|
|
|
|
|||||||||||
| Total |
$ | 21,784 | $ | 3,540 | $ | 16,812 | $ | 1,225 | $ | 207 | ||||||||||
|
|
|
|
|
|
|
|
|
|
|
|||||||||||
63
Table of Contents
Operating leases consist of contractual obligations from agreements for non-cancelable office space and leases used to finance the acquisition of equipment. Debt and capital equipment leases and the interest payments relating thereto include promissory notes and capital lease obligations.
In September 2013, we entered into a lease agreement, which was amended in April 2014, for a new 27,303 square foot office and laboratory facility located in Davis, California. The initial term of the lease is for a period of 60 months commencing on the later of the date of substantial completion of initial improvements to the leased property, or August 2014. The monthly base rent is $44,000 for the first 12 months with a 3% increase each year thereafter. We will have the option to extend the lease term twice for a period of five years each. Upon moving into the new office facility, we will vacate the office facility that we currently occupy. The lease expires between February 2015 and October 2016 with respect to various portions of the premises of the 24,500 square foot office facility that we currently occupy. The cost per square foot of the lease agreement for the new office facility is less than the cost per square foot of the lease for the current office facility. We expect to enter into agreements to sublease the portions of the current office facility that remain under the lease agreement at the time that we vacate the premises. We believe that the expenses associated with the lease for the new office facility will be lower than if we remain in the current office facility.
Concurrent with this amendment in April 2014, we entered into a lease agreement with an affiliate of the landlord to lease 17,438 square feet of office and laboratory space in the same building complex. The initial term of the lease is for a period of 60 months commencing on the date of substantial completion of initial improvements. If the premises are not delivered by September 1, 2014, we can terminate the lease at any time prior to January 1, 2015. The premises are not expected to be delivered until the latter half of 2014. The monthly base rent is $28,000 with a 3% increase each year thereafter.
Since March 31, 2014, we have not added any additional leases that would qualify as operating leases.
Inflation
We believe that inflation has not had a material impact on our results of operations for the years ended December 31, 2013, 2012 and 2011 and for the three months ended March 31, 2014.
Off-Balance Sheet Arrangements
We have not been involved in any material off-balance sheet arrangements.
Recently Issued Accounting Pronouncements
There have been no new accounting pronouncements issued during the three months ended March 31, 2014 that are of significance, or potential significance, to us.
Critical Accounting Policies and Estimates
Inventories
Inventories are stated at the lower of cost or market (net of realizable value or replacement cost) and include the cost of material and external labor and manufacturing costs. Cost is determined on the first-in, first-out basis. We provide for inventory reserves when conditions indicate that the selling price may be less than cost due to physical deterioration, obsolescence, changes in price levels, or other factors. Additionally, we provide reserves for excess and slow-moving inventory to its estimated net realizable value. The reserves are based upon estimates about future demand from our customers and distributors and market conditions.
Fair Value of Financial Instruments
Fair value is defined as an exit price that would be received from the sale of an asset or paid to transfer a liability in an orderly transaction between market participants on the measurement date. A three-tier fair value hierarchy has been established, which prioritizes the inputs used in measuring fair value as follows: Level 1, observable inputs such as quoted prices in active markets; Level 2, inputs other than the quoted prices in active markets that are observable either directly or indirectly; and Level 3, unobservable inputs in which there is little or no market data, which requires that we develop our own assumptions. This hierarchy requires the use of observable data, when available, and minimizes the use of unobservable inputs when determining fair value.
64
Table of Contents
Until the effective date of the IPO, we accounted for the outstanding warrants exercisable into shares of our Series A, Series B and Series C convertible preferred stock as liability instruments, as these warrants were convertible into Series A, Series B and Series C convertible preferred stock upon the occurrence of certain events or transactions. We also accounted for the outstanding warrants exercisable into a variable number of shares of common stock at a fixed monetary amount as liability instruments. Our convertible notes were recorded at estimated fair value on a recurring basis as the predominant settlement feature of the convertible notes was to settle a fixed monetary amount in a variable number of shares. We adjusted the warrants and the convertible notes to estimated fair value at each reporting period and on the effective date of the IPO with the change in estimated fair value recorded in the consolidated statements of operations.
For the year ended December 31, 2011, we estimated the fair value of our financial instruments, including outstanding warrants, utilizing the option pricing method, which we refer to as the “option method.” The option method treats each class of equity securities as if it were an option to purchase common stock, with an exercise price based on the value of the enterprise and based further on the liquidation preference and rights of the relevant class of equity. While this method relies on certain key assumptions, it is best used when the range of possible future outcomes and the corresponding time frames are highly uncertain.
Starting with fiscal year 2012, due to our closing several debt financings and an initial public offering becoming more probable as we began investing significant time and resources into the initial public offering process, we changed our valuation methodology to estimate the fair value of our financial instruments, including our outstanding warrants and convertible notes, from the option method to the probability weighted expected return method, which we refer to as the “expected return method.” The expected return method analyzes the returns afforded to common equity holders under multiple possible future scenarios. Under the expected return method, share value is based upon the probability-weighted present value of expected future net cash flows (distributions to shareholders) under each of the possible scenarios, giving consideration to the rights and preferences of each share class. This method is most appropriate when the long-term outlook for an enterprise is largely known and multiple possible future scenarios can be reasonably estimated. As the expected return method estimated the fair value of our warrants and convertible notes using unobservable inputs, they were both considered to be Level 3 fair value measurements. Changes in the probability weights and discount rates used in the expected return method valuation model and the estimated time to a liquidity event may have a significant impact on the estimated fair value of the preferred and common stock warrant liabilities and the convertible notes.
As a result of the automatic exercise of all Series A and Series B convertible preferred stock warrants and certain common stock warrants for shares of common stock, the automatic conversion of all convertible notes into common stock in accordance with their terms, and the exercise of all Series C convertible preferred stock warrants for shares of common stock in connection with our IPO in August 2013, there will not be any further adjustments to these warrants and convertible notes. In addition, upon completion of the IPO, the exercise price and number of shares to be issued upon exercise of the remaining outstanding common stock warrants became known. Accordingly, after the IPO, the fair value of the common stock warrant liability on the date of the IPO was reclassified to equity and will no longer be adjusted to its estimated fair value on each reporting date.
Revenue Recognition
We recognize revenues when persuasive evidence of an arrangement exists, delivery and transfer of title has occurred or services have been rendered, the price is fixed or determinable and collectability is reasonably assured, unless contractual obligations, acceptance provisions or other contingencies exist. If such obligations or provisions exist, revenue is recognized after such obligations or provisions are fulfilled or expire.
Product revenues consist of revenues generated from sales to distributors and from sales of our products to direct customers, net of rebates and cash discounts. For sales of products made to distributors, we consider a number of factors in determining whether revenue is recognized upon transfer of title to the distributor, or when payment is received. These factors include, but are not limited to, whether the payment terms offered to the distributor in comparison to our historical terms are considered to be longer than normal payment terms, the distributor history of adhering to the terms of its contractual arrangements with us, whether we have a pattern of granting concessions for the benefit of the distributor, and whether there are other conditions that may indicate that the sale to the distributor is not substantive. When we offer payment terms that are considered to be extended in comparison to our
65
Table of Contents
historical terms, we consider the arrangement not to be fixed or determinable, and accordingly, revenue is deferred until payment is due. The costs associated with such deferral are also deferred and classified in prepaid expenses and other current assets in the consolidated balance sheet. We currently recognize revenue primarily on the sell-in method with its distributors. Distributors generally do not have price protection or return rights.
We offer certain product rebates, which are recorded as reductions to product revenues. An accrued liability for these product rebates is recorded at the time the revenues are recorded.
We recognize license revenues pursuant to strategic collaboration and distribution agreements under which we receive fees for the achievement of testing validation, regulatory progress and commercialization events. As these activities and payments are associated with exclusive rights that we provide in connection with strategic collaboration and distribution agreements over the term of the agreements, revenues related to the payments received are deferred and recognized as revenues over the term of the exclusive period of the respective agreement. For the years ended December 31, 2012 and 2011, we received payments under these agreements totaling $1.5 million and $0.8 million, respectively. For the year ended December 31, 2012, $1.0 million of the payments received under these agreements were from a related party. No payments were received under these agreements during the year ended December 31, 2013 or for the three months ended March 31, 2014. For the years ended December 31, 2013, 2012 and 2011 and the three months ended March 31, 2014, we recognized $0.2 million, $0.2 million, $0.1 million and $45,000, respectively, as license revenues, excluding related party revenues, in the accompanying consolidated statements of operations. For the year ended December 31, 2013 and the three months ended March 31, 2014, we recognized $0.1 million and $0.3 million, respectively, of related party license revenues based on the terms of our agreements with Syngenta, an affiliate of one of our 5% stockholders. There were no related party license revenues recognized for the years ended December 31, 2012 and 2011. At March 31, 2014, we recorded current and non-current deferred revenues of $0.2 million and $1.1 million, respectively, related to payments received under these agreements, of which $31,000 and $0.4 million, respectively, related to deferred revenues from related parties based on the terms of our agreements with Syngenta. At December 31, 2013, we recorded current and non-current deferred revenues of $0.3 million and $1.4 million, respectively, related to payments received under these agreements, of which $0.1 million and $0.6 million, respectively, related to deferred revenues from related parties based on the terms of our commercial agreement with Syngenta. At December 31, 2012, we recorded current and non-current deferred revenues of $0.3 million and $1.7 million respectively, related to payments received under these agreements, of which $0.1 million and $0.8 million, respectively, related to deferred revenues from related parties based on the terms of our commercial agreement with Syngenta.
Share-Based Compensation
We recognize share-based compensation expense for all stock options made to employees and directors based on estimated fair values.
We estimate the fair value of stock options on the date of grant using an option-pricing model. The value of the portion of the stock options that is ultimately expected to vest is recognized as expense over the requisite service periods using the straight-line method. Forfeitures are estimated at the time of grant and revised, if necessary, in subsequent periods if actual forfeitures differ from those estimates.
66
Table of Contents
For purposes of determining our historical share-based compensation expense, we used the Black-Scholes-Merton (“BSM”) option-pricing model to calculate the estimated fair value of stock options on the measurement date (generally, the grant date). This model requires inputs for the expected life of the stock option, estimated volatility factor, risk-free interest rate and expected dividend yield. Our estimates of forfeiture rates also affect the amount of aggregate compensation expense. Prior to our initial public offering, our board of directors considered numerous objective and subjective factors to determine the fair value of our common stock at each meeting at which stock options were granted and approved. These inputs are subjective and generally require significant judgment. For the years ended December 31, 2013, 2012 and 2011 and the three months ended March 31, 2014, we calculated the fair value of stock options granted using the following assumptions:
| YEAR ENDED DECEMBER 31, | THREE MONTHS ENDED MARCH 31, 2014 |
|||||||||||||||
| 2013 | 2012 | 2011 | ||||||||||||||
| Expected life (years) |
5.29-7.71 | 5.00-6.08 | 5.00-6.28 | 6.08 | ||||||||||||
| Estimated volatility factor |
0.70-0.75 | 0.72-0.76 | 0.70 | 0.70-0.71 | ||||||||||||
| Risk-free interest rate |
1.27%-2.11 | % | 0.74%-1.16 | % | 0.86%-2.40 | % | 1.81%-2.05 | % | ||||||||
| Expected dividend yield |
— | — | — | — | ||||||||||||
Expected Life—Our expected life represents the period that our share-based payment awards are expected to be outstanding. We use the “simplified method” in accordance with Staff Accounting Bulletin (SAB) No. 107, Share-Based Payment, and SAB No. 110, Simplified Method for Plain Vanilla Share Options, to develop the expected term of options determined to be “plain vanilla.” Under this approach, the expected term is presumed to be the midpoint between the vesting date and the contractual end of the option grant. For stock options granted with an exercise price not equal to the determined fair market value, we estimate the expected life based on historical data and management’s expectations about exercises and post-vesting termination behavior.
Estimated Volatility Factor—We calculate volatility based upon the trading history and calculated volatility of the common stock of comparable agricultural biotechnology companies in determining an estimated volatility factor.
Risk-Free Interest Rate—We base the risk-free interest rate on the implied yield currently available on U.S. Treasury constant-maturity securities with the same or substantially equivalent remaining term.
Expected Dividend Yield—We have not declared dividends nor do we expect to in the foreseeable future. Therefore, a zero value was assumed for the expected dividend yield.
Estimated Forfeitures—When estimating forfeitures, we consider voluntary and involuntary termination behavior and actual option forfeitures.
If in the future we determine that other methods are more reasonable, or other methods for calculating these assumptions are prescribed by authoritative guidance, the fair value calculated for our stock options could change significantly. Higher volatility and longer expected lives result in an increase to share-based compensation expense determined at the grant date. Share-based compensation expense affects our research, development and patent expense and selling, general and administrative expense.
The BSM option-pricing model was developed for use in estimating the fair value of traded options that have no vesting restrictions and are fully transferable, characteristics not present in our stock options. Existing valuation models, including the BSM option-pricing model, may not provide reliable measures of the fair values of our stock options. Consequently, there is a risk that our estimates of the fair values of the stock options on the grant dates may bear little resemblance to the actual values realized upon exercise. Stock options may expire or otherwise result in zero intrinsic value as compared to the fair values originally estimated on the grant date and reported in the consolidated financial statements. Alternatively, value may be realized from these instruments that is significantly higher than the fair values originally estimated on the grant date and reported in the consolidated financial statements.
67
Table of Contents
Income Taxes
We use the asset and liability method of accounting for income taxes. Deferred tax assets and liabilities are recognized for the estimated future tax consequences attributable to the differences between the financial statement carrying amounts of existing assets and liabilities and their respective tax bases. Deferred tax assets and liabilities are measured using enacted tax rates expected to apply to taxable income in the years in which those temporary differences are expected to be recovered or settled. To the extent deferred tax assets cannot be recognized under the preceding criteria, we establish valuation allowances as necessary to reduce deferred tax assets to the amounts expected to be realized. As of December 31, 2013 and 2012, all deferred tax assets were fully offset by a valuation allowance. Realization of deferred tax assets is dependent upon future federal, state and foreign taxable income. Our judgments regarding deferred tax assets may change as we expand into international jurisdictions, due to future market conditions, changes in U.S. or international tax laws and other factors. These changes, if any, may require possible material adjustments to these deferred tax assets, resulting in a reduction in net income or an increase in net loss in the period when such determinations are made.
We recognize liabilities for uncertain tax positions based upon a two-step process. To the extent a tax position does not meet a more-likely-than-not level of certainty; no benefit is recognized in the consolidated financial statements. If a position meets the more-likely-than-not level of certainty, it is recognized in the consolidated financial statements at the largest amount that has a greater than 50% likelihood of being realized upon ultimate settlement. Our policy is to analyze our tax positions taken with respect to all applicable income tax issues for all open tax years (in each respective jurisdiction). As of December 31, 2013 and 2012, we have concluded that no uncertain tax positions were required to be recognized in our consolidated financial statements. It is our practice to recognize interest and penalties related to income tax matters in income tax expense. No amounts were recognized for interest and penalties during the years ended December 31, 2013, 2012 and 2011.
68
Table of Contents
We make bio-based pest management and plant health products. Bio-based products are comprised of naturally occurring microorganisms, such as bacteria and fungi, and plant extracts. We target the major markets that use conventional chemical pesticides, including certain agricultural and water markets, where our bio-based products are used as substitutes for, or in programs with, conventional chemical pesticides. We also target new markets for which there are no available conventional chemical pesticides, the use of conventional chemical products may not be desirable or permissible because of health and environmental concerns or the development of pest resistance has reduced the efficacy of conventional chemical pesticides. All of our current products are EPA-approved and registered as “biopesticides.” We believe our current portfolio of products and our pipeline address the growing global demand for effective, efficient and environmentally responsible products to control pests, increase crop yields and reduce crop stress.
Our products currently target two core end markets: crop protection and water treatment. Crop protection products consist of herbicides (for weed control), fungicides (for plant disease control), nematicides (for parasitic roundworm control), insecticides (for insect and mite control) and plant growth regulators and stimulants that growers use to increase crop yields, improve plant health, manage pest resistance and reduce chemical residues. Our products can be used in both conventional and organic crop production. We currently sell our three crop protection product lines, Regalia, for plant disease control and plant health, and Grandevo and Venerate, for insect and mite control, to growers of specialty crops such as grapes, citrus, tomatoes, vegetables, nuts, leafy greens and ornamental plants. We have also had sales of Regalia for large-acre row crops such as corn and soybeans. Water treatment products target invasive water pests across a broad range of applications, including hydroelectric and thermoelectric power generation, industrial applications, drinking water, aquaculture, irrigation and recreation. Our current water treatment product line, Zequanox, which we began selling in the second half of 2012, selectively kills invasive mussels that cause significant infrastructure and ecological damage.
In addition to our current two core end markets, we are also taking steps through strategic collaborations to commercialize products for other non-crop pest management markets. These products can be different formulations of our crop protection products that are specifically targeted for industrial and institutional, turf and ornamental, home and garden and animal health uses such as controlling grubs, cockroaches, flies and mosquitoes in and around schools, parks, golf courses and other public-use areas.
The agricultural industry is increasingly dependent on effective and sustainable pest management practices to maximize yields and quality in a world of increased demand for agricultural products, rising consumer awareness of food production processes and finite land and water resources. We believe that our competitive strengths, including our commercially available products, robust pipeline of novel product candidates, proprietary technology and product development process, commercial relationships and industry experience, position us for rapid growth by providing solutions for these global trends.
Industry Overview
Pest management is an important global industry. Most of the markets we currently target or plan to target primarily rely on conventional chemical pesticides, supplemented in certain agricultural markets by the use of genetically modified crops. Conventional chemical pesticides are generally synthetic materials that directly kill or inactivate pests. Phillips McDougall estimates the 2013 agrichemical market at $59.2 billion (including non-crop pesticides), up from 2012 by 10%. Agranova estimated that global agrichemical sales for the crop protection market were $50.0 billion in 2012, which represented an increase of 8.2% from 2011. The market for treatment of fruits and vegetables, the largest current users of bio-based pest management and plant health products, accounted for $16.2 billion of this total. Other agricultural applications, notably crops such as corn, soybeans, rice, cotton and cereals, which we expect will become increasingly important users of bio-based products, accounted for $24.7 billion of the total.
Demand for effective and environmentally responsible bio-based products for crop protection and water treatment continues to increase. The global market for biopesticides, which control pests by non-toxic mechanisms such as attracting pests to traps or interfering with their ability to digest food, was valued at $1.6 billion for 2009 and is expected to reach $3.3 billion by 2014, with a 15.6% compound annual growth projected during that period, according to BCC Research, an independent market research firm. Markets and Markets, an independent market
69
Table of Contents
research firm, estimates the global biopesticide market at $1.3 billion in 2011 and growing at 15.8% compound annual growth from 2012 to 2017. In comparison, global agrichemical sales were projected at a 5.5% compound annual growth during the period from 2011 through 2016, according to AgroPages, an independent market research firm. We believe these trends will continue as the benefits of using bio-based pest management and plant health products become more widely known.
Crop Protection
Conventional Production. Growers are constantly challenged to supply the escalating global demand for food, while reducing the negative impact of crop protection practices on consumers, farm workers and the environment. The dominant technologies for crop protection are conventional chemical pesticides and genetically modified crops. Major agrichemical companies have invested billions of dollars to develop genetically modified crops that resist pests or have high tolerance to conventional chemical pesticides. The market for genetically modified crops was estimated at $12.0 billion in 2011 and is predicted to grow 5% annually through 2015, according to Phillips McDougall. In addition, according to the International Service for the Acquisition of Agri-biotech Applications, a third-party not-for-profit organization, in 2013, 175 million hectares (433 million acres) were planted with genetically modified crops. Soybean, cotton and corn plantings have made the greatest inroads, accounting for 79%, 70% and 32%, respectively, of genetically modified seeds planted globally.
Conventional chemical pesticides and genetically modified crops have historically been effective in controlling pests. However, there are increasing challenges facing the use of conventional chemical pesticides such as pest resistance and environmental, consumer and worker safety concerns. Governmental agencies are further pressuring growers by restricting or banning certain forms of conventional chemical pesticide usage, particularly in the European Union, as some conventional chemical pesticide products are being phased out. At the same time, a number of supermarket chains and food processors, key purchasers of specialty fruits, nuts and vegetables, are imposing synthetic chemical residue restrictions, limiting options available to growers close to harvest. Consumers, scientists and environmental groups have also voiced concerns about the unintended effects of genetically modified crops, including pest resistance and contamination of non-genetically modified crops. In response to consumer and environmental group concerns and restrictions by importing countries, several large-scale food purchasers have demanded that their contracted growers supply them only non-genetically modified crops.
These factors are significant market drivers for conventional producers, and their impact is continuing to grow. An increasing number of growers are implementing integrated pest management (IPM) programs that, among other things, combine bio-based pest management products and crop cultivating practices and techniques such as crop rotation, with conventional chemical pesticides and genetically modified crops. Bio-based pest management products are becoming a larger component of IPM programs due in part to the challenges associated with conventional chemical pesticides and genetically modified crops.
Organic Production. Certified organic crops such as food, cotton and ornamental plants, are produced without the use of synthetic chemicals, genetic modification or any other bioengineering or adulteration. As such, organic growers are limited in the number of alternatives for pest management. The U.S. Department of Agriculture, or the USDA, approved national production and labeling standards for organic food marketed in the United States in late 2000. These standards have contributed to the growth of organic food consumption in the United States, and other countries have implemented similar programs. The global market for organic food and beverages is projected to grow to $105.0 billion by 2015, a 67% increase from 2011, according to the United Nations Environment Program. We believe this growth is primarily driven by concerns about food safety and the adverse environmental effects of conventional chemical pesticides and genetically modified crops. Large food processors and agricultural businesses such as Dole, General Mills, Gerber, H.J. Heinz and Kellogg have developed products aimed at organic food consumers. Major supermarket chains in the United States such as Krogers, Safeway and Wal-Mart and in Europe such as Marks & Spencer, Sainsbury and Tesco offer a wide selection of organic food products.
Water Treatment
Global demand for water treatment products was estimated to be $48 billion in 2012, according to The Freedonia Group, an independent market research firm, and the global market for specialty biocide chemicals for water treatment was projected to be $5.2 billion in 2013, according to BCC Research. Invasive and native pest species are increasingly a concern in diverse applications such as hydroelectric and thermoelectric power generation, industrial applications, drinking water, aquaculture, irrigation and recreation. However, discharge of water treatment chemicals
70
Table of Contents
to target these pests is highly regulated, and in many cases, such as with management of open waters and sensitive environmental habitats, use of conventional chemicals is prohibited.
One particular area of concern has been the damage caused by invasive zebra and quagga mussels, which clog pipes, disrupt ecosystems, encrust infrastructure and blanket beaches with razor-sharp shells. These species initially infested the Great Lakes region and have spread across the United States. Industry reports estimate that these mussels cause approximately $1.0 billion in damage and associated control costs annually in parts of the United States alone. There are limited treatment options available, many of which are toxic to aquatic flora and fauna. To date, most treatment options have been focused either on manual removal of the mussels, which is time consuming and costly, or conventional chemical treatments, which potentially jeopardize the environment and are thus controlled tightly by regulatory agencies.
The water treatment market also includes products to control algae, aquatic weeds and unwanted microorganisms. For example, one of the most effective and popular methods for controlling algae and unwanted microorganisms is chlorination. One of the major concerns in using chlorination in surface water supplies is that chlorine combines with various organic compounds to form by-products, some of which are considered possible carcinogens.
Other Target Markets
Although conventional chemical pesticides have traditionally serviced the industrial and institutional, professional turf and ornamental, home and garden and animal health markets, governmental regulations are restricting their use, and reports indicate that end users increasingly value environmentally friendly products; with some households willing to forego pest control treatments entirely if alternatives to conventional chemical pesticides are not available.
Industrial and Institutional. Significant amounts are spent annually worldwide on conventional chemical pesticide products to control pests such as cockroaches, flies and mosquitoes in the institutional market, including in and around schools, parks, golf courses and other public-use areas.
Professional Turf and Ornamental. Manufacturer sales of pesticides for use on turf and ornamental plants in the United States rose by 4.9% to $737.0 million in 2012, continuing a 3.1% sales growth trend for 2011, according to Specialty Products Consultants, an independent market research firm. Insecticides and pre-emergence herbicides were the fastest growing product category within this market. Historically, nearly half of sales for this market have been fungicides, herbicides, insecticides and plant growth regulators for use in golf courses.
Home and Garden. U.S. demand for home and garden pesticides is projected to be $1.7 billion in 2013, according to The Freedonia Group. The number of U.S. households that use only all-natural or organic fertilizer, insect controls and weed controls increased from an estimated 5 million households in 2004 to 12 million in 2008, according to the National Gardening Association. We believe this trend reflects the increasing importance people attribute today to maintaining lawns and gardens in an environmentally friendly way.
Animal Health. Homes with pets and producers of livestock such as cattle, swine and poultry use pest management products to control fleas, ticks and other pests and parasites.
Benefits of Bio-Based Pest Management and Plant Health Products
While conventional chemical pesticides are often effective in controlling pests, some of these chemicals are acutely toxic, some are suspected carcinogens and some can have other harmful effects on the environment and other animals. Health and environmental concerns have prompted stricter legislation around the use of conventional chemical pesticides, particularly in Europe, where the use of some highly toxic or endocrine-disrupting chemical pesticides is banned or severely limited and the importation of produce is subject to strict regulatory standards on pesticide residues. In addition, the European Union has passed the Sustainable Use Directive, which requires EU-member countries to reduce the use of conventional chemical pesticides and to use alternative pest management methods, including bio-based pest management products. Over the past two decades, U.S. regulatory agencies have also developed stricter standards and regulations. Furthermore, a growing shift in consumer preference towards organic and sustainable food production has led many large, global food retailers to require their supply chains to implement these practices, including the use of bio-based pest management and fertilizer solutions, water and energy efficiency practices, and localized food product sourcing. For example, in 2010, Wal-Mart announced its global sustainable agriculture goals to require sustainable best practices throughout its global food supply chain.
71
Table of Contents
Aside from the health and environmental concerns, conventional chemical pesticide users face additional challenges such as pest resistance and reduced worker productivity, as workers may not return to the fields for a certain period of time after treatment. Similar risks and hazards are also prevalent in the water treatment market, as chlorine and other chemicals used to control invasive water pests contaminate and endanger natural waterways. Costs of using conventional chemical pesticides are also increasing due to a number of factors, including raw materials costs such as rising costs of petroleum, stringent regulatory requirements and pest resistance to conventional chemical pesticides, which requires increasing application rates or the use of more expensive substitute products.
As the cost of conventional chemical pesticides increases and the use of conventional chemical pesticides and genetically modified crops meets increased opposition from government agencies and consumers, and the efficacy of bio-based pest management products becomes more widely recognized among growers, bio-based pest management products are gaining popularity and represent a strong growth sector within the market for pest management technologies. Growers are increasingly incorporating bio-based pest management products into IPM programs, and bio-based pest management products help create the type of sustainable agriculture programs that growers and food companies increasingly emphasize.
Bio-based pest management products include biopesticides, as well as minerals such as copper and sulfur. The EPA registers biopesticides in two major categories: (i) microbial pesticides, which contain a microorganism such as a bacterium or fungus as the active ingredient and (ii) biochemical pesticides, which are naturally occurring substances such as insect sex pheromones, certain plant extracts and fatty acids. Biostimulants, which are not registered by the EPA absent additional pest control usages, are microorganisms or natural substances derived from microorganisms or plants that can reduce plant stress or stimulate plant physiology to increase yield.
We believe many bio-based pest management products perform as well as or better than conventional chemical pesticides. When used in alternation or in spray tank mixtures with conventional chemical pesticides, bio-based pest management products can increase crop yields and quality over chemical-only programs. Agricultural industry reports, as well as our own research, indicate that bio-based pest management products can affect plant physiology and morphology in ways that may improve crop yield and can increase the efficacy of conventional chemical pesticides. In addition, pests rarely develop resistance to bio-based pest management products due to their complex modes of action. Likewise, bio-based pest management products have been shown to extend the product life of conventional chemical pesticides and limit the development of pest resistance, a key issue facing users of conventional chemical pesticides, by eliminating pests that survive conventional chemical pesticide treatments. Most bio-based pest management products are listed for use in organic farming, providing those growers with compelling pest control options to protect yields and quality. Given their generally lower toxicity compared with many conventional chemical pesticides, bio-based pest management products can add flexibility to harvest timing and worker re-entry times and can improve worker safety. Many bio-based pest management products are also exempt from conventional chemical residue tolerances, which are permissible levels of chemical residue at the time of harvest set by governmental agencies. Bio-based pest management products may not be subject to restrictions by food retailers and governmental agencies limiting chemical residues on produce, which enables growers to export to wider markets.
In addition to performance attributes, bio-based pest management products registered with the EPA as biopesticides can offer other advantages over conventional chemical pesticides. From an environmental perspective, biopesticides have low toxicity, posing low risk to most non-target organisms, including humans, other mammals, birds, fish and beneficial insects. Biopesticides are biodegradable, resulting in less risk to surface water and groundwater and generally have low air-polluting volatile organic compounds content. Because biopesticides tend to pose fewer risks than conventional pesticides, the EPA offers a more streamlined registration process for these products, which generally requires significantly less toxicological and environmental data and a lower registration fee. As a result, both the time and money required to bring a new product to market are reduced.
72
Table of Contents
Our Solution
Our technology platform produces bio-based pest management and plant health products that are highly effective and generally designed to be compatible with existing pest control equipment and infrastructure. This allows them to be used as substitutes for, or in connection with, conventional chemical pesticides, as well as in markets for which there are no available conventional chemical pesticides or the use of conventional chemical products may not be desirable or permissible because of health and environmental concerns. We believe that compared with conventional chemical pesticides, our products:
| n | are competitive in both price and efficacy; |
| n | provide viable alternatives where conventional chemical pesticides and genetically modified crops are subject to regulatory restrictions; |
| n | comply with market-imposed requirements for pest management programs by food processors and retailers; |
| n | are environmentally friendly; |
| n | meet stringent organic farming requirements; |
| n | improve worker productivity by shortening field re-entry times after spraying and allowing spraying up to the time of harvest; |
| n | are exempt from residue restrictions applicable to conventional chemical pesticides in both the agriculture and water markets; and |
| n | are less likely to result in the development of pest resistance. |
In addition, our experience has shown that when our products are used in connection with conventional chemical pesticides, they can:
| n | increase the effectiveness of conventional chemical pesticides while reducing their required application levels; |
| n | increase levels of pest control and consistency of control; |
| n | increase crop yields; |
| n | increase crop quality, including producing crops with higher levels of protein, better taste and color and more attractive flowers; and |
| n | delay the development of pest resistance to conventional chemical pesticides. |
We believe that the benefits of our products will encourage sustained adoption by end users. For example, we have seen that growers that have used our products on a trial basis in one year have generally continued to use our products in higher levels in subsequent years.
Our Competitive Strengths
Commercially Available Products
We have four commercially available product lines: Regalia, Grandevo, Venerate and Zequanox. We believe these product lines, along with our other EPA-approved and EPA-submitted products and other pipeline of product candidates, provide us the foundation for continuing to build one of the leading portfolios of bio-based pest management products. In connection with our progress in solving the issues facing growers of conventional and organic crops, our products aimed at solving pest issues for water treatment provide us with access to several distinct multibillion dollar markets subject to different market forces, diversifying our revenues portfolio.
Robust Pipeline of Novel Product Candidates
Our pipeline of early-stage discoveries and new product candidates extends across a variety of product types for different end markets, including herbicides, fungicides, nematicides, insecticides, algaecides (for algae control), molluscicides (for mussel and snail control) and plant growth and plant stress regulators. Our product candidates are developed both internally and sourced from third parties. Our research and development process enables us to discover, source and develop multiple products in parallel, which keeps our pipeline robust. For example, we received EPA approval for Opportune, an herbicidal biopesticide, or “bioherbicide,” in April 2012 and are conducting a targeted placement with growers, and we received EPA approval for Venerate, an insecticidal biopesticide, or “bioinsecticide,” in February 2014 and we began to sell in May 2014. MBI-011, a weed-
73
Table of Contents
controlling bioherbicide, and MBI-302, a biological nematicide, have been submitted for EPA registration. These products are still undergoing commercialization, and we have additional product candidates at various other stages of development. In addition, while we expect individual product sales to remain seasonal and impacted by weather as a result of certain of our products being targeted to specific pests and geographic areas, as we develop and commercialize additional product candidates we believe these effects will have a reduced impact on our overall operating results. For example, during periods of hot, dry weather, sales of biofungicides such as Regalia, may decline, but we expect that our revenues may be offset by increased sales of bioinsecticides such as Grandevo and Venerate.
Rapid and Efficient Development Process
We believe we can develop and commercialize novel and effective products faster and at a lower cost than many other developers of pest management products. For example, we have moved each of Regalia, Grandevo, Venerate and Zequanox through development, EPA approval and U.S. market launch in approximately four years at a cost of $6.0 million or less. In comparison, a report from Phillips McDougall shows that the average cost for major agrichemical companies to bring a new crop protection product to market is over $250.0 million, and these products have historically taken an average of nearly ten years to move through development, regulatory approval and market launch.
Proprietary Discovery Process
Our discovery process allows us to efficiently discover microorganisms and plant extracts that produce or contain compounds that display a high level of pesticidal activity against various pests. After we identify pesticidal activity, we subject the microorganisms and plant extracts to tests to determine effects on plant growth, nutrient uptake and drought and salt stress. We then use various analytical chemistry techniques to identify and characterize the natural product chemistry of the compounds, which we optimize and patent. Our research has shown that on average, major agrichemical companies synthesize approximately 108 thousand chemicals to yield each candidate for crop protection product development. In contrast, with 25 candidates identified for product development, we have identified more than one potential bio-based pest management product for every thousand microorganisms or plant extracts in our database. Five of our product candidates, one of which is EPA-approved and one of which has been submitted to the EPA, are what we believe to be newly identified microorganism species. We believe that three of our product candidates produce novel compounds that we identified, and four of our product candidates have been found to have, or produce compounds with, a novel mode of action. Our proprietary discovery process is protected by patents on the microorganisms, their natural product compounds and their uses for pest management, as well as a patent application we have filed on a screening process to identify enzyme-inhibiting herbicides. We also maintain trade secrets related to the discovery, formulation, process development and manufacturing capabilities. By conducting our own discovery as well as working with outside collaborators, we are able to access the broadest range of products for commercialization, giving us an advantage over other natural bio-based pest management companies.
Sourcing and Commercialization Expertise
We use our technical and commercial development expertise to evaluate early-stage discoveries by third parties to determine commercial viability, secure promising technologies through in-licensing and add considerable value to these in-licensed product candidates. Our efficient development process and significant experience in applying natural product chemistry has led universities, corporations and government entities to collaborate with us to develop or commercialize a number of their early-stage discoveries. As with our internally discovered products, early-stage products we source and commercialize are subject to our own patents and trade secrets related to our added value in characterizing, formulating, developing and manufacturing marketable products. For example, we developed an analytical method to measure and characterize the major compounds in the extract we licensed to produce Regalia, and we enhanced these compounds several times in new formulations, providing Regalia with a broader spectrum of activity and better efficacy than the original licensed product.
Existing Agreements with Global Market Leaders
The markets for pest management products are intensely competitive. This has presented a significant challenge for biopesticide companies looking to enter these markets, which are typically dominated by major multinational agrichemical companies with significant resources, brand recognition and established customer bases. To help address this challenge, we have entered into strategic agreements with global market leaders across agricultural and consumer retail markets. For example, we have signed exclusive international distribution agreements for Regalia with Syngenta in Africa, Europe and the Middle East and with FMC in Latin America. We also have a technology
74
Table of Contents
evaluation and development agreement with Scotts Miracle-Gro, which grants it a right of first access to the active ingredients in our full portfolio of bio-based pest management and plant health products for use in its consumer lawn and garden products. We believe we will be able to further leverage these distribution channels to gain robust geographic market penetration, particularly in the highly competitive European and Latin American markets, with modest sales and marketing expenditures.
Management Team with Significant Industry Experience
Our management team has deep experience in bio-based pest management products and the broader agriculture industry. Our chief executive officer, chief operating officer and other key employees average over 25 years of experience and include individuals who have led agrichemical sales and marketing organizations, top scientists and industry experts, some of whom have served in leadership roles at large multinational corporations and governmental agencies, commercialized multiple products, brought multiple products through EPA, state and foreign regulatory processes, filed patent applications and received patents, led groundbreaking research studies and published numerous scientific articles. In addition, we have recently hired a new chief financial officer, who brings over 30 years of financial management experience spanning a variety of industries, including over 12 years of service as several public companies’ chief financial officer, as well as a new general counsel and chief compliance officer with over 25 years of experience in domestic and international operations.
Our Growth Strategy
Continue to Develop and Commercialize New Products in Both Existing and New Markets
Our goal is to rapidly and efficiently develop, register and commercialize new products each year, with the goal of developing a full suite of pest management and plant health products. For example, while our current crop protection products address plant diseases and insects, we are developing products that can also control nematodes and weeds as well as products for improving fertilizer efficiency and reducing drought and salt stress. We are also currently screening for water treatment products that control algae and aquatic weeds to complement Zequanox, our invasive mussel control product line.
Expand Applications of Our Existing Product Lines
Biopesticide products, including our bio-based pest management and plant health products, are generally initially approved for use in a limited number of applications. However, we have identified opportunities to broaden the commercial applications and expand the use of our existing products lines into several key end markets, including large-acre row crop applications, seed treatment, irrigation, aquaculture and animal health. In addition, we recently expanded sales of Regalia in large-acre row crops. We believe these opportunities could help to drive significant growth for our company.
Accelerate Adoption of New Products, Product Applications and Product Lines
Our goal is to provide growers with complete and effective solutions to a broad range of pest management and plant health needs that can be used individually, together and in connection with conventional chemical pesticides to maximize yield and quality. We believe we will be able to leverage relationships with existing distributors as well as growers’ positive experiences using our Regalia and Grandevo product lines to accelerate adoption of new products, product applications and product lines. We will also continue to target early adopters of new pest management and plant health technologies with controlled product launches and to educate growers and water resource managers about the benefits of bio-based pest management products through on-farm and in-facility demonstrations to accelerate commercial adoption of our products. We believe that these strategies and the strength of our products have led to an adoption rate for Grandevo for use in U.S. specialty crops that would outpace that of leading chemical insecticides.
Leverage Existing Distribution Arrangements and Develop New Relationships
To expand the availability of our products, we intend to continue to use relationships with conventional chemical pesticide distributors in the United States and leverage the international distribution capabilities under our existing strategic collaboration and distribution agreements. We also continue to form new strategic relationships with other market-leading companies in our target markets and regions to expand the supply of our products globally. For example, we have engaged distributors to help develop Grandevo and Venerate for key countries in Europe and Latin America and sell Regalia in Canada for specialty crops, in the United States for turf and ornamental plants and in parts of the Midwest United States for row crops. We have also engaged a distributor that launched Grandevo in the United States for turf and ornamental plants.
75
Table of Contents
Develop and Expand Manufacturing Capabilities
We currently use third-party manufacturers to produce our products on a commercial scale. These arrangements have historically allowed us to focus our time and direct our capital towards discovering and commercializing new product candidates. We are repurposing a manufacturing facility that we purchased in July 2012 and plan to further expand capacity at this facility. Phase 1 of the project, which we anticipate will be completed in 2014, includes installation of the first of three fermentation tanks, and the construction of a dedicated building to house them. Phase 2 will include increasing the capacity of the facility’s utilities, installing drying capacity and installing larger fermenters that will accommodate production of multiple products at higher volumes. We believe that greater control of our own manufacturing capacity will allow us to scale-up processes and institute process changes more quickly and efficiently while lowering manufacturing costs over time to achieve the desired margins and protecting the proprietary position of our products.
Pursue Strategic Collaborations and Acquisitions
We intend to continue collaborating with chemical manufacturers to develop products that combine our bio-based pest management and plant health products with their technologies, delivering more compelling product solutions to growers. We also may pursue acquisition and in-licensing opportunities to gain access to later-stage products and technologies that we believe would be a good strategic fit for our business and would create additional value for our stockholders.
Our Products
We produce both microorganism-based and plant extract-based products. Our technology platform enables us to develop bio-based pest management and plant health products that offer customers an attractive value proposition when compared against conventional chemical pesticide and genetically modified crop alternatives alone. We are focused on producing bio-based products that we sell into the crop protection, water treatment and other target markets. We believe that we should be able to continue to develop products in our product pipeline in a manner consistent with our historical experience. We have historically been able to move our products through development, EPA approval and U.S. market launch in four years or less and at a cost of under $6.0 million. We currently believe that we can obtain similar results for the majority of our other product candidates, such as MBI-011, MBI-302, MBI-601, MBI-010, MBI-110 and MBI-303, but we cannot assure that this will be true for each product and that we will not encounter unexpected delays or cost overruns.
Regalia
| n | Biofungicide |
| n | Crop Protection, Home and Garden, Turf: Targets Plant Disease, Improves Plant Health, Increases Yields |
| n | Commercially Available |
Regalia, a plant extract-based fungicidal biopesticide, or “biofungicide,” is EPA-registered for crop and non-crop uses and approved for use on foliage and roots in all states in the United States, including California and Florida, where the majority of the specialty crops are grown. It is also approved for sale in Ecuador (flowers), Mexico (vegetables and grapes), Turkey (covered vegetables), Canada (tomatoes, grapes, strawberries, cucurbits, ornamental plants and wheat), Panama (cane, tobacco, rice, coffee, avocado, dried beans, cucurbits, citrus and papaya), Peru (grapes), and El Salvador, Guatemala and Honduras (potatoes, tomatoes, peppers, tobacco, cucurbits, beans, avocados, citrus, papayas and strawberries). University researchers have extensively tested the product against several important plant diseases, especially against mildews. We have also conducted hundreds of trials in the United States and abroad, including four years of crop trials in Europe. The data show that Regalia is an effective addition to a disease management program against a broad range of diseases and can increase yields in crops such as strawberries, tomatoes, potatoes, soybeans and corn.
Regalia is made from an extract of the giant knotweed plant and acts by turning on a plant’s “immune system,” a process called induced systemic resistance. Regalia also enhances the efficacy of major conventional chemical fungicides, and we have filed a patent application on this synergism. Regalia is also effective for seed treatment of soybean, corn and cotton, for which we have filed a patent application, and we have received a patent on the effects on root growth and yield when Regalia is applied to the seed or as a root stimulant. For example, in field tests and in actual grower use, Regalia has shown significant yield increases on strawberries, tomatoes, potatoes, soybeans and corn, with less irrigation required for strawberries treated with Regalia.
76
Table of Contents
We obtained an exclusive license relating to the technology used in our Regalia product line while Regalia was in the process development and formulation stage of product development. In addition to developing the supply chain to commercially market the product, using our natural product chemistry expertise, we developed an analytical method to measure and characterize the major compounds in the plant extract, and we enhanced these compounds several times in new formulations, providing Regalia with a broader spectrum of activity and better efficacy than the original licensed product. In addition, we improved the physical properties of our Regalia formulations and developed four formulations that meet organic farming standards. We have filed several patent applications with respect to these innovations. In addition, we have received a U.S. patent for modulating plant growth by treating roots of plants with Regalia (or other compounds or extracts of knotweed), and transplanting the plants into soil.
We launched Regalia SC, an earlier formulation of Regalia, into the Florida fresh tomatoes market in December 2008. This formulation had a limited label with a few crops and uses on the label and it was not compliant for organic listing. In 2009, we began sales of Regalia in the United Kingdom and Ecuador, and we received a revised, broader label with hundreds of crops for a new organic formulation, which we subsequently launched into the Florida vegetables and Arizona leafy greens markets. In January 2010, we received state approval in California and immediately launched Regalia into the leafy greens and walnuts markets. Key markets include vegetables in the southeast, citrus in Florida, leafy greens and vegetables in California and Arizona, walnuts and stone fruit in California and pome fruit and grapes in California and the Pacific Northwest. In December 2011 and August 2012, we received EPA approval and California regulatory approval, respectively, for an expanded label that includes new soil applications, instructions for yield improvement in corn and soybeans and additional crops and target pathogens. We submitted Regalia for registration in the European Union, which according to our research has recently been the largest fungicide market in the world, and in Brazil, and we received completeness checks with respect to such submissions in March 2012 and May 2012, respectively. We received regulatory approval for Regalia in South Africa in June 2013, new product registrations in El Salvador, Guatemala and Honduras in December 2013, and new product registration in Peru in March 2014.
Grandevo
| n | Bioinsecticide |
| n | Crop Protection, Home and Garden, Turf, Animal Health: Targets Insects and Mites |
| n | Commercially Available |
Grandevo is based on a new species of microorganism, Chromobacterium subtsugae, which was discovered by a scientist at the USDA in Beltsville, Maryland, and which we have licensed and commercialized. Grandevo is a powerful feeding inhibitor: insects and mites become agitated when encountering it and will not feed and starve, or, if they do ingest it, die from disruption to their digestive system. Grandevo also has repellent effects on and reduces egg hatching and reproduction of target insects and mites. Grandevo is particularly effective against chewing insects (such as caterpillars and beetles) and sucking insects (such as stinkbugs and mealybugs, as well as thrips and psyllids, which are respectively known as “corn lice” and “plant lice”). Field trials are in progress to further characterize Grandevo’s efficacy. Trials to date and reports from grower use have shown instances of commercial levels of efficacy as good as the leading conventional chemical pesticides on a range of chewing and sucking insect and mite pests, including two invasive species of psyllid affecting citrus and potato crops, and indicate that the length of control is as long as three weeks, matching leading conventional chemical pesticides. Grandevo has also shown significant control of other pests such as plant-feeding fly larvae, mosquitoes, white grubs in turf grass, “leafmining” caterpillar larvae and other leaf-eating caterpillars.
We obtained a co-exclusive license for the bacterial strain used in our Grandevo product line while Grandevo was undergoing primary screening as a potential product candidate. At the time we entered into this agreement, the licensor had produced no toxicology or field efficacy data; all of these data were subsequently created by us. In addition, since licensing the microorganism, we completed the testing and development necessary to produce and commercialize an EPA-approved product and have filed our own patent applications with respect to the microorganism, including its genome, as well as the chemistry produced by the microorganism upon which Grandevo is based, including a novel compound produced by the bacteria, synergistic combinations with conventional chemical pesticides, product formulations containing the bacterial strain and novel insecticidal and nematicidal uses.
77
Table of Contents
We launched a liquid formulation of Grandevo on a targeted basis under a limited label into the Florida citrus crop market in 2011. Commencing in the summer of 2012, we launched a dry formulation of Grandevo in markets across the United States where state registrations have been approved, targeting key markets, including citrus, tomatoes, peppers, strawberries, potatoes, leafy greens and other fruits and vegetables. This dry formulation has improved shelf life and efficacy, can be used on more crops and pests than the original liquid formulation, was approved by the EPA in May 2012 and has been registered in 49 of 50 states (Hawaii pending) as well as Puerto Rico. In May 2013, we received EPA approval for a revised label reflecting Grandevo’s safety for bees. In addition, we submitted the registration dossier for Grandevo to Mexico and Canada and also received permission to field test Grandevo in Brazil and South Africa allowing us to prepare the dossiers for submission in those countries. We expect to submit the Grandevo dossier for registration in Europe in 2014.
Zequanox
| n | Biomolluscicide |
| n | Water Treatment: Targets Invasive Mussels |
| n | Commercially Available |
Zequanox is a biopesticide targeted at mussels, or “biomolluscicide,” derived from a common microbe found in soil and water bodies, Pseudomonas fluorescens, which we licensed from the University of the State of New York and subsequently developed and commercialized. Zequanox is an environmentally friendly bio-based pest management product that is designed to kill over 75% of invasive mussels in treated pipe systems without causing collateral ecological damage. In July 2012, we conducted an open water trial in Deep Quarry Lake, Illinois, where the Zequanox treatment killed more than 90% of the invasive mussels on the lake bed. This level of control in open water treatments was repeated in 2013. The application to register Zequanox for open water treatments was submitted to the EPA in 2013.
At recommended application rates, Zequanox is not toxic to other aquatic life, including ducks, fish, crustaceans and other bivalve species such as native clams or mussels.
Invasive zebra mussels and quagga mussels are having a billion-dollar impact on the North American economy and major negative impacts on freshwater ecosystems. Introduced into North America from Eastern Europe in the 1980s, these mussels damage freshwater ecosystems and clog the intake pipes of industrial facilities that draw water from infested lakes and rivers. Power plants and other water-dependent facilities currently use non-selective, polluting chemicals to reduce densities of fouling mussels. For open water habitats such as rivers and lakes, because there is no cost-effective and environmentally friendly solution, invasive mussels continue to spread, causing economic damage to industry, recreational users and waterfront property and substantial ecological harm.
We believe Zequanox has significant benefits over conventional chemical pesticide treatments, which can be toxic to beneficial species and pollute waterways. Zequanox is safe to workers, less labor intensive and requires shorter treatment times compared with conventional chemical pesticides. Zequanox can be used by power plants and raw water treatment facilities as an alternative to conventional chemical treatments such as chlorine, or as a complement to those products.
We entered into a license agreement with The University of the State of New York pursuant to which we were granted an exclusive license under the University’s rights relating to the bacterial strain used in our Zequanox product line while the product’s natural product chemistry was still under investigation. Since then, we have developed dry powder formulations, significantly improved the fermentation process for higher cell yield, allowing us to increase manufacturing scale, and we have filed patent applications relating to natural product compounds in the Zequanox cells we have identified and product formulations we have developed.
We collaborated with the U.S. Bureau of Reclamation and Ontario Power Generation in Canada, two organizations seeking ways to treat issues they continuously face with mussel damage in their hydroelectric plants, to test early and improved versions of Zequanox we developed. In 2011 and 2012, we successfully treated the cooling water of a hydroelectric facility managed by the U.S. Bureau of Reclamation on the lower Colorado River and achieved a commercial level of mussel control. In 2013, we initiated a juvenile mussel preventive treatment program at the Hoover Dam along the Colorado River, which showed that Zequanox can prevent more than 85% of mussels from
78
Table of Contents
setting in pipes. In 2012, we achieved a commercial level of control in two cooling water treatments of an Ontario Power Generation facility along the Niagara River, and in 2012 and 2013 we generated revenues for treating an Oklahoma Gas & Electric facility. In addition, we have received $1.1 million in grants from the National Science Foundation for work needed to commercialize the bacterial strain in Zequanox, which is currently being marketed and sold directly to U.S. power and industrial companies.
Venerate
| n | Bioinsecticide |
| n | Crop Protection, Home and Garden, Turf, Animal Health: Targets Insects and Mites |
| n | Commercially Available |
Venerate is based on a microbial fermentation of a new bacterial species we isolated using our proprietary discovery process. We have identified compounds produced by the microorganism in Venerate that kill a broad range of chewing and sucking insects and mites, as well as flies and plant parasitic nematodes, on contact, which is complementary to the anti-feeding effects of Grandevo. Venerate was approved by the EPA in February 2014 and we began to sell in May 2014. We submitted Venerate for the Canadian Pest Management Regulatory Agency registration in August 2010 and submitted the registration dossier for Venerate to Mexico in April 2014. We have conducted field trials on several crops and insects and mites, many of which show efficacy as good as leading conventional chemical pesticides. We have filed patent applications on the microorganism and the natural product compounds that demonstrate insecticidal and nematicidal activity, as well as product formulations containing the microorganism.
Opportune
| n | Bioherbicide |
| n | Crop Protection, Home and Garden, Turf: Targets Weeds |
| n | EPA Approved; Targeted Placement with Key Customers |
Opportune is based on a Streptomyces species. Opportune demonstrates a novel mode of herbicidal action, producing a compound, thaxtomin, which disrupts the production of cellulose in certain plants, killing weeds before they emerge and selectively killing broad-leaved weeds after they have emerged. This product, in its initial testing, has been shown not to be harmful to crops such as rice, wheat, corn, sorghum and turf. It controls sedges and broadleaf weeds in rice, for which there are few solutions, either for conventional or organic growers. Based on field trials, we believe that Opportune provides longer duration of weed control than other bioherbicides. Opportune has also demonstrated synergistic activity with several conventional chemical pesticides, resulting in better weed control than either Opportune or the conventional chemical pesticides when used alone.
We entered into an agreement with DuPont and Instituto Biomar for ownership of certain technology related to our Opportune product line. At the time we entered into this agreement, DuPont and Instituto Biomar had produced no toxicology and minimal efficacy data; all of these data were subsequently created by us. We have conducted field trials on rice, wheat, turf and other crops, improved the fermentation process and developed a commercial formulation, and in July 2013, we were granted a U.S. patent with respect to synergistic and other uses of the product. We received EPA approval for Opportune in April 2012, California Department of Pesticide Regulation approval in September 2013 and Canadian Pest Management Regulatory registration in February 2014. We continue to conduct development work to reduce the cost of goods to allow us to launch more broadly in the market.
Haven (MBI-505)
| n | Anti-transpirant |
| n | Crop Protection, Turf, Ornamentals: Enhances Crop Yields and Plant Health |
| n | Submitted for State Registration; Under Development |
Haven (MBI-505), a plant health product that helps prevent plants from drying out, or “anti-transpirant,” is based on a technology of naturally-derived, plant-based compounds that we licensed from Kao Corporation for use in the United States. The licensed patents are directed to methods of promoting plant growth and increasing biomass and crop yield. We have been actively developing new formulations and conducting field trials with product candidates that promote plant growth by reducing plant water loss, allowing crops to thrive better in sun-stressed environments.
79
Table of Contents
We believe that products based on this technology will utilize a unique mode of action, which will be the first of this mode of action to reach the market. We have submitted Haven to certain states that require registrations. The EPA does not require that we submit Haven for approval as a biopesticide and some states exempt registration as well. We expect to release Haven to the market in 2014.
MBI-506
| n | Plant Health |
| n | Crop Protection, Turf: Enhances Crop Yields and Reduces Drought Stress |
| n | EPA Exempt; Under Development |
MBI-506 is based on a new species of bacteria that acts as an endophyte, meaning it lives within plants for part of its life cycle. We have licensed technology related to this microorganism from Brookhaven National Laboratory, and we have verified its ability to colonize inside and on plants’ roots. MBI-506 preserves and increases yields, particularly when the crop is under drought stress, and also has the ability to aid in plant phosphate uptake.
MBI-304 and MBI-305
| n | Bionematicides |
| n | Crop Protection, Turf: Targets Nematodes |
| n | EPA Approved; Under Development |
MBI-304 and MBI-305 are nematicidal biopesticides, or “bionematicides,” which we are developing based on the microorganisms used in Grandevo and Venerate, respectively. These nematicides are active against a broad range of nematodes, and in field trials they have been as effective or better than the leading conventional chemical nematicide against soybean cyst nematodes. Usage for MBI-304 and MBI-305 as nematicides was approved by the EPA in connection with its approval of labels for Grandevo and Venerate in 2012 and 2014, respectively. We have received a patent on the use of the bacterial strain in MBI-304 for use as a nematicide, and we have filed a patent application for use of the bacterial strain in MBI-305 for use as a nematicide.
MBI-011
| n | Bioherbicide |
| n | Crop Protection, Home and Garden, Turf: Targets Weeds |
| n | Submitted for EPA Registration; Under Development |
MBI-011 is based on an herbicidal compound, sarmentine, extracted from a Chinese pepper plant we screened using our proprietary discovery process. MBI-011 kills a broad range of weeds and acts as a “burndown” herbicide (controls weed foliage). In June 2013, we received a patent with respect to the use of sarmentine as an herbicide and weed killer and have filed a patent application disclosing and claiming a synergistic composition with Opportune. We submitted MBI-011 to the EPA in December 2012.
MBI-302
| n | Bionematicide |
| n | Crop Protection, Turf: Targets Nematodes |
| n | Submitted for EPA Registration; Under Development |
We isolated MBI-302, a bionematicide, using our proprietary discovery process. MBI-302 is based on a new species of bacteria that produces natural fermentation products, some of which are novel. MBI-302 kills juvenile root knot and sting nematodes, serious global pests of many crops, and reduce the number of eggs produced by the female nematodes. We have filed a patent application on the bacterial strains and the compounds produced by the bacteria in this products, and the EPA accepted MBI-302 for review in January 2014.
MBI-601
| n | Biofumigant |
| n | Crop Protection, Home and Garden, Industrial: Targets Plant Disease, Nematodes and Insects |
| n | Submitted for EPA Registration; Under Development |
80
Table of Contents
MBI-601, a biopesticide that produces gaseous natural compounds, or “biofumigant,” is based on a novel and proprietary genus of fungus, Muscodor, which was discovered by a scientist at Montana State University. We obtained a co-exclusive license for several strains and species of this fungus, which produces a suite of gaseous natural product compounds that have been shown to kill certain species of harmful fungi and bacteria that cause plant diseases and to kill nematodes and some insect species. We believe that MBI-601 may be used for agricultural and industrial applications, including post-harvest control of fruit and flower decay and pre-planting control of plant diseases and nematodes, as a viable alternative to methyl bromide and other conventional chemical fumigants, which are subject to significant regulatory restrictions and for which few effective, non-toxic alternatives are available. We submitted this product to the EPA in April 2014.
MBI-010
| n | Bioherbicide |
| n | Crop Protection, Home and Garden, Turf: Targets Weeds |
| n | Under Development |
MBI-010 is based on the same species of bacteria that we isolated to produce Venerate using our proprietary discovery process that identifies herbicides that inhibit a certain plant enzyme. MBI-010 produces several herbicidal compounds, some of which are novel, that are rapidly taken up by germinating seeds and by the roots of seedling and mature weeds. MBI-010 has demonstrated effectiveness against a range of weeds, including weeds resistant to leading conventional chemical herbicides either after or before the weeds’ emergence. MBI-010 has also demonstrated a novel mode of action, in which it is transmitted systemically through the vascular structure of a weed. We have filed a patent application with respect to the MBI-010 formulation uses, and its associated natural product compounds as an herbicide. We also filed a patent application on the process we used to discover MBI-010 and other bioherbicides. We expect to submit MBI-010 to the EPA in 2014.
MBI-110 and MBI-507
| n | Biofungicide and Plant Health |
| n | Crop Protection, Home and Garden: Targets Plant Disease, Improves Plant Health |
| n | Under Development |
MBI-110 and MBI-507 are based on microbial fermentations of a newly identified Bacillus strain we isolated using our proprietary screening platform. MBI-110 is being developed as a biofungicide, targeting difficult to control plant diseases such as gray mold and downy mildews (such as potato late blight). We have identified compounds, some of which are novel, produced by the microorganism in MBI-110 that control a broad range of plant diseases. This product has demonstrated increased efficacy in disease control when used synergistically with Regalia, and as a result, we expect to market this product both separately and in combination with Regalia. We expect to submit MBI-110 product to the EPA in 2014. MBI-507 is being developed separately as a plant health product and plant and root growth biostimulant using a different process, which focuses on living bacterial spores rather than their compounds. This product has been shown to increase plant growth in the absence of plant disease, including in a field trial as a seed treatment and as a transplant dip. We expect to launch a targeted release of MBI-507 in 2014.
MBI-303 and MBI-508
| n | Bionematicide and Plant Health |
| n | Crop Protection, Turf: Targets Nematodes and Plant Health |
| n | Under Development |
MBI-303 and MBI-508 are based on a novel strain of a known species of bacteria that we identified using our proprietary screening platform. The strain produces natural fermentation products that we discovered have nematicidal properties, which will be used in our MBI-303 bionematicide product, and we are developing MBI-508 as a plant health product, as the strain has also been shown to improve plant growth in absence of the pest nematodes.
Other Candidates
We have also discovered several microorganisms with algaecidal activity and over 25 additional fungicide, herbicide, insecticide and nematicide candidates using our proprietary screening platform. We also have produced a collection
81
Table of Contents
of microorganisms from taxonomic groups that research suggests may enhance nutrient uptake in plants, reduce stress and otherwise increase plant growth such as MBI-506, a plant yield and drought tolerance enhancer. We have also recently in-licensed several candidates from the New Zealand Institute for Plant and Food Research, some of which we have already taken into field trials.
Our Technology and Product Development Process
Our proprietary technology comprises a sourcing process for microorganisms and plant extracts, an extensive proprietary microorganism collection, microbial fermentation technology, screening technology and a process to identify and characterize natural compounds with pesticidal activity. Our technology enables us to isolate and screen naturally occurring microorganisms and plant extracts in an efficient manner and to identify those that may have novel, effective and safe pest management or plant health promoting characteristics. We then analyze and characterize the structures of compounds either produced by selected microorganisms or found in plant extracts to identify product candidates for further development and commercialization. As of March 31, 2014, we have screened more than 18,000 microorganisms and 350 plant extracts, and we have identified multiple product candidates that display significant levels of activity against insects, nematodes, weeds, plant diseases and invasive species such as zebra and quagga mussels, aquatic weeds and algae. We also have produced a collection of microorganisms from taxonomic groups that may enhance nutrient uptake in plants, reduce stress and otherwise increase plant growth. Our product candidates come primarily from our own discovery and development as well as in-licensed technology from universities, corporations and governmental entities.
Our proprietary product development process includes several important components. For all of our product candidates, we develop an analytical method to detect the quantity of the active natural product compounds that are produced by the microorganism or that are extracted from plants. For microbial products, we develop unique proprietary fermentation processes that increase the active natural compounds produced by the microorganisms. We also scale-up fermentation volumes to maximize yields consistently in each batch. Similarly, for our plant extract-based products, we develop a manufacturing process that increases the amount of active natural compounds extracted from plant materials. Our deep understanding of natural product chemistry allows us to develop formulations that optimize the efficacy and stability of compounds produced by microorganisms or plants. Products are not released for sale unless the quantity of the compounds meets our desired efficacy specifications. These methods allow us to produce products that are highly effective and of a consistent quality on a commercial scale.
These product formulations are tailored to meet customers’ needs and display enhanced performance characteristics such as effectiveness, shelf life, compatibility with other pesticides and ease of use. Our senior management’s numerous years of experience in the development of commercial products and formulations have resulted in a highly efficient product development process, which allows us to rapidly commercialize new products.
82
Table of Contents
Our discovery and development process is illustrated in the following diagram:
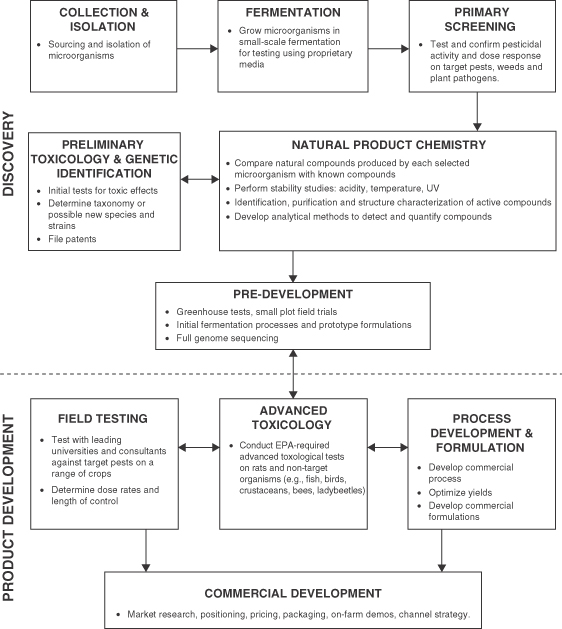
Discovery
We have found over 25 candidates for commercial development from our proprietary discovery process, including Venerate, a new bacterial species and bioinsecticide, MBI-011, a burndown bioherbicide, MBI-010, a systemic bioherbicide, MBI-302 and MBI-303, bionematicides, MBI-110, a biofungicide, and MBI-507, for plant health, as well as several bioalgaecides, additional biofungicides, bioherbicides and bionematicides and plant growth enhancers. Key aspects of our discovery process include:
Collection and isolation. Using our years of experience, we target selected habitats and niches of high biodiversity to collect soil, compost, insects, flowers, or other biological matter from which we isolate our proprietary microorganisms on proprietary media. We capture information in a microorganism database such as taxonomic groups, geographical locations, types of samples, niches and habitats where collected and biological activity. We also isolate microorganisms that improve the efficiency of plants to uptake nitrogen and phosphorous. In addition to
83
Table of Contents
isolating our own microorganisms, which make up approximately 90% of our collection, we have collaborations with three companies plus the Scripps Institution of Oceanography to diversify our sourcing of microorganisms.
Fermentation. For our microbial products, before testing the selected microorganisms for activity against pests, we ferment them to produce sufficient quantities for testing. We grow the selected microorganisms in proprietary media, which maximizes their pesticidal properties. In addition, we use proprietary fermentation processes that are designed to replicate those that would be required for large- scale fermentation and commercial production, avoiding the time and expense of an unsuccessful scale-up.
Primary screening. We use automated, miniaturized biological assays to test the selected microorganism’s or plant extract’s effectiveness against several weed, insect and nematode pests and plant pathogens and algae. We compare those results to conventional chemical pesticide standards. When a microorganism shows a high level of pesticidal activity, we conduct further tests to determine the spectrum of activity, mode of action, stability and activity on plants. We also test for the microorganisms’ ability to reduce plant stress and promote growth.
Novel and proprietary screening methods for weeds and nematodes. We have proprietary assays based on specific enzymes that find systemic herbicidal compounds from microorganisms, one of which is subject of a pending patent application covering identification of compounds that act systemically through plants’ vascular systems. We have developed a rapid, efficient method to find microorganisms that produce compounds with a high level of activity against plant parasitic nematodes.
Natural product chemistry. Using high-performance liquid chromatography (HPLC) with diode array detection technology, liquid chromatography-mass spectroscopy (LCMS), gas chromatography-mass spectroscopy (GC-MS) and nuclear magnetic resonance (NMR), we compare the natural product compounds produced by each of the selected microorganisms with known compounds. This allows us to eliminate those microorganisms that produce known toxins and to select those that we believe are novel and safe. From the selected microorganisms, we identify and characterize the natural product compounds responsible for their pesticidal activity by using HPLC, LCMS, GC-MS and NMR equipment. We then develop analytical methods to measure the quantity of these compounds in individual fermentation batches, determine the quantities needed to maximize efficacy and to insure consistent levels of these compounds from batch to batch.
Genetic identification. After confirming pesticidal activity during our primary screen, we perform the initial genetic identification of the microorganisms. Further characterization of the genome of our early stage candidates is contracted with one of several genome sequencing service companies. This characterization allows us to determine novelty compared to discoveries from others, the relatedness to human or animal pathogens, genes for compounds that are not expressed in fermentation or detected by our chemists, and information about the possible mode of action on the target pest. We also file additional patent applications based on the results of these genetic identification processes.
Product Development
We believe that by maintaining a strong reputation in the industry, many opportunities come to us for development in addition to our own discoveries from our in-house efforts. Once we discover or are brought an opportunity, we make a preliminary assessment of the commercial potential of a natural product determined through laboratory, greenhouse and initial field tests. We then select product candidates we have discovered in-house or in-licensed for further development. Key aspects of our product development include:
Development of the manufacturing process that maximizes the active natural product compounds. For our microbial biopesticide products, we develop proprietary processes that increase the yield of both the microorganism and the active natural product compounds produced by the microorganism during fermentation. Similarly, for our plant extract-based products, we develop proprietary processes that increase the amount of active natural compounds extracted from plant materials. This process development allows us to produce products that have superior performance. For our microbial products, we then scale-up these proprietary processes in progressively larger fermentation tanks. We develop quality control methods based on the active natural product compounds rather than just the microorganisms or plant extracts. This approach results in a more consistent and effective product.
84
Table of Contents
Formulation. We are able to develop proprietary water-soluble powder, liquid and granule formulations that allow us to tailor our products to customers’ needs. This allows us to develop product formulations with enhanced performance characteristics such as effectiveness, value, shelf life, suitability for organic agriculture, water solubility, rain resistance, compatibility with other pesticides and ease of use. Formulation is critical to ensuring a bio-based pest management and plant health product’s performance. Our understanding of the natural product chemistry allows us to develop formulations that maximize the effectiveness and stability of the compounds produced by the microorganisms or plants.
Field testing. We conduct numerous field trials for each product candidate that we develop. These field trials are conducted in small plots on commercial farms or research stations by our own field development specialists as well as private and public researchers to determine large-scale effectiveness, use rates, spray timing and crop safety. We conduct crop protection product field trials globally in both hemispheres to accelerate the results of our field trials and provide alternate season learning opportunities. As the crop protection product candidate nears commercialization, we conduct demonstration trials on the farm. These trials are conducted with distributors, influential growers and food processors on larger acreages. For Zequanox, we have been working with large power and industrial customers both in the United States and Canada to obtain field trial data to help with product commercialization efforts and to obtain efficacy data.
Sales, Marketing and Distribution
In the United States, we sell our products through our own internal sales force, which consists of 10 direct employees focused on managing distributor relationships and creating pull-through demand at the end user level, or grower for our products. Our sales force spans across all major regions in the United States, including, California, Pacific Northwest, Southeast, Northeast, Mid-Atlantic, and Midwest. We currently sell our crop protection product lines, Regalia, Grandevo and Venerate, through leading agricultural distributors such as Crop Production Services, Simplot and members of the Integrated Agribusiness Professionals group. These are the same distribution partners that all major agrichemical companies use for delivering solutions to growers across the country. For our water treatment product line, Zequanox, we are in the process of staffing our own sales organization to manage demand creation at the end user level. Zequanox is currently being marketed and sold directly to U.S. power and industrial companies.
With respect to sales outside of the United States, we have signed exclusive international distribution agreements for Regalia with FMC (for markets in Latin America), Syngenta (for markets in Africa, Europe and the Middle East) and Engage Agro (for markets in Canada and professional turf and ornamental plants in the United States). We have also entered into initial Memorandums of Understanding for Grandevo and Venerate with DeSangosse (for markets in France), with CBC/Intrachem (for markets in Italy) with Koppert (for indoor crops markets globally except the United States, Canada and France) and with Nufarm (for markets in Australia and New Zealand). We are also in discussions with several leaders in water treatment technology and applications regarding potential arrangements to distribute Zequanox in international markets.
In addition, we have signed a technology evaluation and development agreement with Scotts Miracle-Gro under which we have granted Scotts Miracle-Gro first rights to negotiate for exclusive worldwide distribution rights with respect to bio-based pest management and plant health products we jointly develop for the consumer lawn and garden market.
We derived approximately 97%, 96%,96% and 87% of our revenues from Regalia and Grandevo for the years ended December 31, 2013, 2012 and 2011 and the three months ended March 31, 2014, respectively. In addition, we currently rely, and expect to continue to rely, on a limited number of distributors for a significant portion of our revenues since we sell through highly concentrated, traditional distribution channels. We currently sell our crop protection products through the same leading agricultural distributors used by the major agrichemical companies. For the year ended December 31, 2013, our top two distributors accounted for 38% of our total revenues, with Crop Production Services and The Tremont Group accounting for 28% and 10% of our total revenues, respectively. For the three months ended March 31, 2014, our top five distributors accounted for 66% of our total revenues, with Crop Production Services, Reister’s, The Tremont Group, Growmark and Helena Chemicals accounting for 17%, 15%, 12%, 11% and 11%, respectively. The Tremont Group is an affiliate of Les Lyman, who is one of our directors.
85
Table of Contents
While the biopesticide industry has been growing, customers in the crop production sector and the water treatment sector are generally cautious in their adoption of new products and technologies and may perceive bio-based pest management products as less effective than conventional chemical pesticides. Growers often require on-farm demonstrations of a given pest management or plant health product, and given the relative novelty of our water treatment products, consumers of those products will continue to require education on their use. We anticipate adding additional sales and marketing personnel in the United States and in international territories, and we are implementing the following strategies to accelerate adoption rates and promote sales of our bio-based pest management and plant health products:
Target early adopters of new pest management technologies. For crop protection products, we target large commercial growers in the United States, who generally set industry standards through early adoption of new pest management technologies. We plan to continue to recruit leading growers and their consultants to participate in field trials, enabling them to become familiar with our bio-based pest management and plant health products and to experience their benefits firsthand. For Zequanox, we have developed strategic relationships with early adopters in the power generation business to do efficacy demonstrations while perfecting the formulations and application of the product.
Educate growers and water resource managers about the benefits of our bio-based pest management products. We will continue to perform on-farm and in-facility demonstrations and provide field data packages to support and validate our products claims. We will also continue to participate in trade shows and conferences to educate growers, their licensed pest control advisors and water resource managers about the benefits of our bio-based pest management products. We have provided a free application for mobile phones users to assist in calculating tank mix quantities as well as a webinar, and an online course on bio-based pest management products, which can be taken by growers for continuing education credit to maintain crop protection product applicator licenses. We intend to continue and expand our efforts to work with utilities, which we believe will create increased demand for Zequanox in adjacent market spaces beyond the current power and industrial treatment opportunities we are currently targeting.
Enhance distribution relationships. We will continue using established agrichemical distribution channels to distribute Regalia, Grandevo and our future crop protection products. We intend to provide distributors with a portfolio of products that we believe will offer attractive profit margins and growth potential. In addition, we will continue to provide distributors access to innovative alternative pest management solutions, which we believe will provide them additional value that chemical pesticides do not provide.
Develop and leverage relationships with key industry influencers. We will continue to develop relationships early in the product development process with influential members within our target markets, including large innovative growers, technical experts at leading agricultural universities, licensed pest control advisors, wineries, food processors, produce packers, retailers and power facilities. We believe that educating industry influencers about the benefits of Regalia, Grandevo, Zequanox and our future products increases the likelihood that they will recommend our products to our distributors and end users.
Focus our own sales and marketing on the United States and Canada, while signing strategic agreements for international markets, turf, ornamental plants and consumer retail. Because of the concentration of large growers and large power and industrial customers in the United States and Canada, we can access these customers through our own sales force. For international markets for Zequanox, we intend to develop strategic partnerships with large water companies. For Regalia, we have signed distribution agreements with leading agrichemical companies and regional distributors. For Grandevo, Venerate and future products, distribution agreements will be developed with regional and national distributors or large multinationals on a case-by-case basis, depending on their expertise in the regions. We have engaged distributors that are selling Regalia in Canada for specialty crops, in the United States for turf and ornamental plants, and in parts of the Midwest United States for row crops. We have also engaged a distributor that is selling Grandevo in the United States for turf and ornamental plants. We have an exclusive relationship with Scotts Miracle-Gro for the consumer retail market.
Strategic Collaborations and Relationships
We will continue to pursue strategic collaborations and relationships with agrichemical, water treatment and industrial and consumer retail companies to support the development and commercialization of bio-based pest
86
Table of Contents
management and plant health product candidates identified through our proprietary technology platform and those which we obtain through in-licensing efforts. We collaborate with chemical manufacturers to develop products that combine our bio-based pest management products with their technologies to deliver more compelling products to growers. We also use relationships with conventional chemical pesticide distributors to expand the availability of our products. The terms of the strategic collaborations and relationships we undertake depend on the nature and stage of development of the particular product candidate. We believe these strategic collaborations and relationships can allow us to maximize the potential value and reinforce the credibility of our proprietary technology platform, as well as enhance our market presence and revenues growth.
We have entered into the following key strategic collaboration and distribution agreements:
Syngenta. In February 2011, we entered into a commercial agreement with Syngenta Crop Protection AG, referred to as Syngenta, whereby we have designated Syngenta as our exclusive distributor for Regalia in specialty crop markets in Europe, Africa and the Middle East. Syngenta’s exclusive rights under this agreement will terminate with respect to each country identified on the earlier to occur of five years after the date of Syngenta’s first sale of Regalia under the agreement in such country or 15 years after the date of the first registration of Regalia completed in these regions. In addition to buying Regalia products from us, under this agreement, Syngenta will pay us upon achievement of testing validation, regulatory progress and commercialization events, and Syngenta is committed to making upfront investments to prepare the platform for launching Regalia and other development- and marketing-related costs.
FMC. In August 2011, we entered into an exclusive development and distribution agreement with FMC Corporation, referred to as FMC, whereby we have designated FMC as our exclusive distributor for Regalia in specialty crop and large-acre row crop markets in certain Latin American countries. This agreement expires 10 years from the date of the first registration to be completed in Argentina, Brazil or Colombia. FMC remitted an initial payment to us upon signing the agreement, and, in addition to buying Regalia products from us, FMC will pay us additional amounts upon the achievement of regulatory progress events.
Scotts Miracle-Gro. In September 2011, we entered into a technology evaluation and master development agreement with The Scotts Company LLC, a subsidiary of The Scotts Miracle-Gro Company and referred to as Scotts Miracle-Gro, a world-leading marketer of branded consumer lawn and garden products. Under the agreement, we have granted Scotts Miracle-Gro a right of first refusal to evaluate, develop and serve as our exclusive distributor for existing and future pipeline products for consumer markets until 2016, and we will enter into separate supply and license agreements with Scotts Miracle-Gro for each of our technologies that they elect to commercialize. Scotts Miracle-Gro made payments to us in 2011, and we anticipate receiving future payments to maintain exclusivity and for the achievement of a commercialization event under this agreement.
As of March 31, 2014, we had received an aggregate of $2.4 million in payments under our strategic collaboration and distribution agreements, of which $1.0 million were received from a related party, and there were $2.9 million in payments under these agreements that we could potentially receive if the testing validation, regulatory progress and commercialization events occur, of which $1.0 million could potentially be received from a related party.
Manufacturing
The active ingredient in our Regalia product line is derived from the giant knotweed plant, which we obtain from China. We have scaled production of Regalia using a single supplier to acquire raw knotweed from numerous regional sources and perform an extraction process on this plant and create a dried extract that is shipped to our third-party manufacturers in the United States for production and packaging to our product specifications. We do not maintain a long-term supply contract with this supplier. While there can be no assurance that we will continue to be able to obtain dried giant knotweed plant extract from our supplier in China at a competitive price point, we estimate that our current supply of the ingredient will be sufficient to manufacture product to meet the next 12 months’ demand. Should we elect or be required to do so, we do not believe that we would have substantial difficulty in finding an alternative supplier as we have identified and have received knotweed from a number of new possible suppliers.
For Grandevo, Zequanox and Venerate, we are currently using third-party manufacturers for fermentation production, downstream processing and formulation of liquids, freeze dried and spray-dried powders. In order to control product quality and the speed and timing of manufacturing for these products and new fermentation-based products we may
87
Table of Contents
introduce to market, we acquired a manufacturing facility, formerly used as a biodiesel plant, in July 2012. Repurposing and expansion of the facility will be completed in multiple phases with an anticipated total capital expenditure of $32.0 million. Phase 1 of the project, which we expect to complete in 2014, includes installation of the first of three fermentation tanks, and the construction of a dedicated building to house them. In December 2013, we produced the first test batch of Grandevo at this facility and expect to begin full-scale production of our products using our own manufacturing capacity in 2014. Phase 1 will also include full-scale production of Regalia, which we successfully produced in small-scale in 2013 and commercial scale in April 2014, and Zequanox. Phase 2, which we may initiate as our business grows, will include increasing the capacity of the facility’s utilities, installing drying capacity and installing larger fermenters that will accommodate production of multiple products at higher volumes.
While we intend to produce the majority of our products using our own manufacturing capacity, we expect to continue to utilize third-party manufactures for supplemental production capacity to meet excess seasonal demand.
We believe that greater control of our own manufacturing capacity will allow us to scale-up processes and institute process changes more quickly and efficiently while lowering manufacturing costs over time to achieve the desired margins and protecting the proprietary position of our products.
Research and Development
As of December 31, 2013, we had 80 full-time equivalent employees dedicated to research and development and patent related activities, 15 of whom hold Ph.D. degrees, plus 23 sales and field development personnel who focus on technical support and demonstration and research field trials. Our research and development team has technical expertise in microbiology, natural product and analytical chemistry, biochemistry, fermentation, entomology, nematology, weed science, plant physiology, plant pathology and aquatic sciences. Our research and development activities are principally conducted at our Davis, California facility as well as by our field development specialists on crops and mussel-infested facilities in their respective regions. We have made, and will continue to make, substantial investments in research and development. Our research and development expenses, including patent expenses, were $17.8 million, $12.7 million, $9.4 million and $4.3 million in fiscal years 2013, 2012 and 2011 and the three months ended March 31, 2014, respectively.
Intellectual Property Rights
We rely on patents and other proprietary right protections, including trade secrets and proprietary know-how, to preserve our competitive position. As of March 31, 2014, we had 10 issued U.S. patents and 20 issued foreign patents (of which 5 U.S. patents and 10 foreign patents were in-licensed), 36 pending provisional and non-provisional patent applications (of which 2 were in-licensed), and 267 pending foreign patent applications (of which 6 were in-licensed) relating to microorganisms and natural product compounds, uses and related technologies. As of March 31, 2014, we had received 11 U.S. trademark registrations and had 9 trademark applications pending in the United States. As of March 31, 2014, we also had received 19 trademark registrations and had 31 trademark applications pending in various other countries.
When we find a microbial product in our screen that kills or inhibits one or more pests or pathogens in at least three replicated tests and identify the microorganism and its associated chemistry, we file a patent application claiming any one or more of the following:
| n | the microorganism, its DNA products, as well as mutations and other derivatives; |
| n | the use of the microorganism for pest management; |
| n | novel natural product compounds, their analogs and unique mixtures of compounds produced by the microorganism; |
| n | the new use of known natural product compounds for pest management; |
| n | formulations of the microorganism or compounds; and |
| n | synergistic mixtures of the microorganism or compounds with conventional chemical or other pesticides. |
We have also entered into in-license and research and development agreements with respect to the use and commercialization of our three commercially available product lines and certain products under development,
88
Table of Contents
including Regalia, Grandevo and Zequanox. Under these licensing arrangements, we are obligated to pay royalty fees between 2% and 5% of net sales of these products, subject in certain cases to aggregate dollar caps. The exclusivity and royalty provisions of these agreements are generally tied to the expiration of underlying patents. The patents acquired for Regalia and in-licensed for Zequanox will expire in 2017, although we have filed separate patent applications with respect to both product lines and have been issued a U.S. patent with respect to Regalia. In addition, the in-licensed U.S. patent for Grandevo is expected to expire in 2024, but there is a pending in-licensed patent application relating to Grandevo that could expire later than 2024, if issued, and we have also filed separate patent applications for Grandevo. While third parties thereafter may develop products using the technology under the expired patents, we do not believe that they can produce competitive products without infringing other aspects of our proprietary technology, and we therefore do not expect the expiration of the patents or the related exclusivity obligations to have a significant adverse financial or operational impact on our business.
Regalia. We entered into an exclusive license agreement with a company co-founded by Dr. Hans von Amsberg, a former employee of German chemical producer BASF, in May 2007 for U.S. and limited international use of a U.S. patent and technology used in our Regalia product line. We have also filed patent applications with respect to new formulations of Regalia, synergistic combinations with biopesticides and conventional chemical pesticides and new uses for soil and roots, and we received a U.S. patent for the use of Regalia on roots in February 2014.
Grandevo. We entered into a co-exclusive license agreement with the USDA in November 2007 for the use in the United States of a U.S.-issued patent and a U.S. patent application relating to the Chromobacterium subtsugae bacteria used in our Grandevo product line. We have filed patent applications on the compounds produced in the bacterial cells, gene sequences, new uses for the Chromobacterium subtsugae bacteria and for new uses and new formulations of our Grandevo product line, and we received a U.S. patent for one of the Grandevo compounds in May 2014. While a second company has licensed the USDA’s patent with respect to the Chromobacterium subtsugae bacteria and could develop products based on the same underlying intellectual property, we have not provided this company access to the proprietary technology we have developed relating to Grandevo.
Zequanox. We entered into a license agreement with The University of the State of New York in December 2009 pursuant to which we were granted an exclusive license under the University’s rights for the worldwide use of a U.S.-issued patent and a Canadian-issued patent relating to the Pseudomonas fluorescens bacteria used in our Zequanox product line. We have filed patent applications on the natural, mussel-killing compounds in the bacteria, as well as applications relating to various Zequanox formulations.
In addition to these license agreements, we have also entered into a number of collaborative research and commercialization agreements with The New Zealand Institute for Plant & Food Research Limited (“The New Zealand Institute”), Kao Corporation, and Valagro S.p.A (“Valagro”). The agreement with The New Zealand Institute covers six microorganisms and two plant extracts, some of which are novel species or have novel modes of action, and the agreement with Kao Corporation grants us a license of certain intellectual property rights for a plant health active. We have in-licensed these product candidates for the expected development and commercialization of biopesticides and plant health products within crop protection, home and garden, turf, ornamental and forestry markets. Under the agreement with Valagro, we will provide each other access to certain intellectual property, active ingredients, and formulations for potential agricultural products, and evaluate the performance of combinations of these technologies for commercial use.
Regulatory Considerations
Our activities are subject to extensive federal, state, local and foreign governmental regulations. These regulations may prevent us or our collaborators from developing or commercializing products in a timely manner or under technically or commercially feasible conditions and may impose expenses, delays and other impediments to our product development and registration efforts. In the United States, the EPA regulates our bio-based pest management products under the Federal Insecticide, Fungicide and Rodenticide Act, the Federal Food, Drug and Cosmetics Act and the Food Quality Protection Act. In addition, some of our plant health products are regulated as fertilizers in each of the fifty states. In 2004, the United States Congress passed the Pesticide Registration Improvement Renewal Act, which was reauthorized in 2007 and 2012, a result of efforts from an industry coalition of pesticide companies and environmental groups, to codify pesticide approval times in return for user fees. This law
89
Table of Contents
facilitates faster approval times for biopesticides, with EPA approvals typically received within 16 to 24 months, compared with 36 months or longer for conventional chemical pesticides. Registration processes for state and foreign governments vary between jurisdictions and can take up to 12 months for state governments such as California and New York and up to 36 months for foreign governments. Because registration processes for California and foreign governments can be concurrent with EPA registrations, we generally expect to complete federal, state and foreign registration between two and three years after our initial EPA submission, except in Europe, where the process may take longer.
To register a crop protection product with the EPA, companies must demonstrate the product is safe to mammals, non-target organisms, endangered species and the environment. To demonstrate the bio-based pest management product’s safety, required studies must be conducted that evaluate mammalian toxicology, toxicological effects to non-target organisms in the environment (ecotoxicological exposures) and physical and chemical properties of the product. The registration dossier is subject to both scientific and administrative reviews by EPA scientists and management before registration approval. The scientific review involves thorough evaluation of submitted data and completion of risk assessments for human dietary and ecotoxicological exposures. Upon completion of this process, the registration package, including the proposed label, is sent to the Office of General Council for legal review. The final step in the registration process is administrative sign-off by the EPA director of the Biopesticides and Pollution Prevention Division.
In addition to EPA approval, we are required to obtain regulatory approval from the appropriate state regulatory authority in individual states and foreign regulatory authorities before we can market or sell any pest management product in those jurisdictions. California and foreign jurisdictions also require us to submit product efficacy data, which the EPA historically has not required, but may request.
While these regulations substantially increase the time and cost associated with bringing our products to market, we believe that our management team’s significant experience in bringing our and other companies’ technologies through EPA, state and foreign regulatory approval, efficient development process, and ability to leverage our strategic collaborations to assist with registrations, particularly in Europe and Latin America, will enable us to overcome these challenges.
Our plant health products that are not used to control pests are not considered to be “biopesticides” by the EPA, and, therefore, we do not need to submit applications for EPA registration for such products. While we must still submit state registrations for these products, the regulatory process is nevertheless significantly accelerated compared to that for biopesticides.
Regalia. The EPA granted approval for the Regalia SC formulation in August 2008, for the Regalia Maxx 5% formulation in May 2009, for the Regalia 20% formulation in January 2010 and for a “ready to use” consumer formulation in January 2010. Regalia is currently registered in all U.S. states. We have also registered Regalia in South Africa, Ecuador, Mexico, Turkey, Panama, El Salvador, Guatemala, Honduras, Peru and Canada, and we have submitted an Annex 1 registration dossier to the European Union. Our Regalia dossier for the European Union has been declared complete, and the registration package is under review by regulatory authorities in the United Kingdom, which will serve as lead for conducting the Annex 1 listing of Regalia for the European Union. In addition to obtaining the Annex 1 listing, we must obtain Annex 3 authorization approval from each country in which we plan to market and sell products. The Regalia dossier is also under review by Brazil.
Grandevo . In August 2011 and May 2012, the EPA granted approval for the Grandevo insecticide “technical grade active ingredient” and a dry flowable formulation, respectively. This dry flowable formulation is registered in 49 of 50 states (Hawaii pending) as well as Puerto Rico and the District of Columbia. In May 2013, we received EPA approval for a revised label reflecting Grandevo’s safety for bees. In addition, we submitted the registration dossier for Grandevo to Mexico and also received permission to field test Grandevo in Brazil, Australia and South Africa allowing us to prepare the dossiers for submission in those countries. We expect to submit dossiers for Grandevo registration in Europe and Canada in 2014.
Zequanox. In August 2010, the EPA granted the U.S. Bureau of Reclamation a Section 18 emergency use for Zequanox for three western states for use in pipe treatments in power facilities. Under this emergency use, we were allowed to sell various formulations of Zequanox. In July 2011, the EPA granted a conditional approval of the
90
Table of Contents
“technical grade active ingredient” in an early formulation of Zequanox, which allows us to market this product line once commercial production processes were concluded. We submitted the registration for open water uses to the EPA in May 2013. A spray dried powder formulation, which is improved over the “end product” approved in July 2011, was approved in March 2012, and this formulation is now commercially available. We have also received approval for Zequanox use in hydroelectric plants in Canada.
Venerate. In February 2014, the EPA granted approval for Venerate. Venerate is currently registered in more than 37 states, with several key states registered before the end of April 2014, and Florida registration achieved in May 2014. In May 2014, we submitted Venerate registration dossiers in Canada and Mexico. Key regulatory efficacy trials to support Venerate Annex 1 listing in Europe have been completed, which will enable us to submit a dossier for Venerate in Europe in 2014.
As with any pesticide, our pest management products will continue to be subject to review by the EPA and state regulatory agencies. The EPA has the authority to revoke the registration or impose limitations on the use of any of our pest management products if we do not comply with the regulatory requirements, if unexpected problems occur with a product or the EPA receives other newly discovered adverse information. See Part I, Item 1A, “Risk Factors—Risks Relating to Our Business and Strategy—Our inability to obtain regulatory approvals, or to comply with ongoing and changing regulatory requirements, could delay or prevent sales of the products we are developing and commercializing.” Our research and development activities are also subject to federal, state and local worker safety, air pollution, water pollution and solid and hazardous waste regulatory programs and periodic inspection. We believe that our facilities are in substantial compliance with all applicable environmental regulatory requirements.
Competition
For pest management products, performance and value are critical competitive factors. To compete against manufacturers of conventional chemical pesticides and genetically modified crops, we need to demonstrate the advantages of our products over these more established pest management products. Many large agrichemical companies are developing and have introduced new conventional chemical pesticides and genetically modified products that they believe are safer and more environmentally friendly than older conventional chemical products.
The pest management market is very competitive and is dominated by multinational chemical and life sciences companies such as Arysta, BASF, Bayer, Dow Chemical, DuPont, FMC, Monsanto, Sumitomo Chemical and Syngenta. Universities, research institutes and government agencies may also conduct research, seek patent protection and, through collaborations, develop competitive pest management products. Other companies, including bio-specialized biopesticide businesses such as AgraQuest (now a part of Bayer), Certis USA (now a part of Mitsui), Novozymes and Valent Biosciences (now a part of Sumitomo) may prove to be significant competitors in the bio-based pest management and plant health market.
In many instances, agrichemical companies have substantially greater financial, technical, development, distribution and sales and marketing resources than we do. Moreover, these companies may have greater name recognition than we do and may offer discounts as a competitive tactic. There can be no assurance that our competitors will not succeed in developing pest management products that are more effective or less expensive than ours or that would render our products obsolete or less competitive. Our success will depend in large part on our ability to maintain a competitive position with our technologies and products.
Employees
As of March 31, 2014, we had 154 full-time equivalent employees, of whom 23 hold Ph.D. degrees. Approximately 80 employees are engaged in research and development and patent related activities, 31 in sales and marketing (including 23 sales and field development personnel who focus on technical support and demonstration and research field trials) and 43 in management, operations, accounting/finance and administration. None of our employees are represented by a labor union
Facilities
Our corporate headquarters are located at 2121 Second St. Suite A-107 in Davis, California, in a facility consisting of approximately 24,500 square feet of office and laboratory space under a lease, as amended, that expires with respect to various portions of the covered premises from time to time between February 2014 and October 2016 and
91
Table of Contents
which we intend to continue to rent with respect to all portions on a month to month basis until we move into the new office and laboratory facility. This facility accommodates our research, development, sales, marketing, operations, finance and administrative activities.
In September 2013, we entered into a lease agreement, which was amended in April 2014, for a new 27,303 square foot office and laboratory facility located in Davis, California. The initial term of the lease is for a period of 60 months commencing on the later of the date of substantial completion of initial improvements to the leased property, or August 2014. Concurrent with this amendment in April 2014, we entered into a lease agreement with an affiliate of the landlord to lease 17,438 square feet of office and laboratory space in the same building complex. The initial term of the lease is for a period of 60 months commencing on the date of substantial completion of initial improvements. If the premises are not delivered by September 1, 2014, we can terminate the lease at any time prior to January 1, 2015.
We also purchased an 11,400 square-foot manufacturing facility in Bangor, Michigan, in July 2012, which we are repurposing to accommodate large-scale manufacturing of our products. We also lease approximately 3,000 square feet of greenhouse space located at 21538 C.R.99 in Woodland, California. We believe that our leased facilities and our manufacturing facility are adequate to meet our needs.
Legal Proceedings
From time to time we may be involved in litigation that we believe is of the type common to companies engaged in our line of business, including intellectual property and employment issues. As of the date of this prospectus, we are not involved in any pending legal proceedings.
92
Table of Contents
Executive Officers and Directors
The following table sets forth certain information about our executive officers, directors and key employees as of May 30, 2014:
| NAME |
AGE | POSITION | ||||
| Board of Directors: |
||||||
| Pamela G. Marrone, Ph.D. |
57 | President, Chief Executive Officer and Director | ||||
| Elin Miller (3) |
54 | Chair of the Board | ||||
| Pamela Contag, Ph.D. (1) |
57 | Director | ||||
| Timothy Fogarty (2) |
53 | Director | ||||
| Les Lyman (3) |
67 | Director | ||||
| Richard Rominger (1),(3) |
86 | Director | ||||
| Shaugn Stanley (2),(3) |
54 | Director | ||||
| Other Executive Officers and Key Employees: |
||||||
| James B. Boyd |
61 | Vice President, Chief Financial Officer and Secretary | ||||
| Hector Absi |
45 | Chief Operating Officer | ||||
| Linda Moore. |
67 | General Counsel and Chief Compliance Officer | ||||
| Keith Pitts |
50 | Vice President of Regulatory and Government Affairs | ||||
| Alison Stewart, Ph.D. |
56 | Chief Technology Officer and Senior Vice President of Research & Development | ||||
| (1) | Member of the Compensation Committee. |
| (2) | Member of the Audit Committee. |
| (3) | Member of the Nominating and Corporate Governance Committee. |
Board of Directors
Pamela G. Marrone, Ph.D. is our founder and has served as our President and Chief Executive Officer and has been a member of our board of directors since our inception in 2006. Prior to founding the Company, in 1995 Dr. Marrone founded AgraQuest, Inc. (acquired by Bayer), where she served as Chief Executive Officer until May 2004 and as President or Chairman from such time until March 2006, and where she led teams that discovered and commercialized several bio-based pest management products. She served as founding President and business unit head for Entotech, Inc., a biopesticide subsidiary of Denmark-based Novo Nordisk A/S (acquired by Abbott Laboratories), from 1990 to 1995, and held various positions at the Monsanto Company from 1983 until 1990, where she led the Insect Biology Group, which was involved in pioneering projects in transgenic crops, natural products and microbial pesticides. Dr. Marrone is an author of over a dozen invited publications, is in demand as a speaker and has served on the boards and advisory councils of numerous professional and academic organizations. In 2013, Dr. Marrone was named the Sacramento region’s “Executive of the Year” by the Sacramento Business Journal and “Cleantech Innovator of the Year” by the Sacramento Area Regional Technology Alliance. Dr. Marrone earned a B.S. in Entomology from Cornell University and a Ph.D. in Entomology from North Carolina State University. We believe Dr. Marrone’s qualifications to sit on our board of directors include the fact that, as our founder, Dr. Marrone is uniquely familiar with the business, structure, culture and history of our company and that she also brings to the board of directors considerable expertise based on her management and technical and commercialization experience in the biopesticide industry.
Elin D. Miller has served on our board of directors since 2011 and was appointed the Chair of our board in 2013. Ms. Miller is the Principal of Elin Miller Consulting, LLC and she also currently serves on the board of directors of Vestaron Corporation, a venture-backed agricultural biotechnology firm. Appointed by the President of the United States, Ms. Miller assumed regional management of the U.S. Environmental Protection Agency (EPA) in the Pacific Northwest from 2006 to 2009. Prior to serving at the EPA, Ms. Miller led Arysta Lifescience Corporation as President and Chief Executive Officer of North America and Australasia from 2004 to 2006. Ms. Miller also served
93
Table of Contents
in various positions at Dow Agroscienses/Dow Chemical from 1996 to 2004, including Vice President of Pest Management, Vice President of Asia Pacific, and Global Vice President of Public Affairs. Ms. Miller’s career also includes directing the California Department of Conservation and serving as Chief Deputy Director of the Department of Pesticide Regulation at the California Environmental Protection Agency. Ms. Miller earned a B.S. in Agronomy and Plant Protection from the University of Arizona and is a graduate of INSEAD’s Advanced Management Program. We believe Ms. Miller’s qualifications to sit on our board of directors include her years of regulatory experience and her perspective gained in management of companies in the life sciences, pesticide and agricultural industries.
Pamela Contag, Ph.D. has served on our board of directors since October 2013. Dr. Contag has served as the Chief Executive Officer of Cygnet Bio Inc., a private company active in the discovery and adaptation of natural products to applications in healthcare, energy, and food, since its founding in 2009. From 1995 to 2006 she was Founder, President and Chief Executive Officer of Xenogen, which she took public. Dr. Contag also founded Cobalt Technologies in 2006, where she served as Chief Executive Officer until 2009. Dr. Contag has been named one of the “Top 25 Women in Small Business” by Fortune magazine, and in 2010, she was honored with Astia’s “Cleantech Innovator of the Year” award for her contributions at Cygnet. Dr. Contag has held board positions in the public, private, and not-for-profit sectors and also consults in biotechnology for academics and industry. She is widely published in the field of microbiology and optical imaging, and has over 35 patents in biotechnology. Dr. Contag received her Ph.D. in Microbiology and Immunology at the University of Minnesota Medical School and completed postdoctoral work at Stanford University School of Medicine, specializing in Host-Pathogen Interactions. We believe Dr. Contag’s qualifications to sit on our board of directors include her experience as a biotechnology entrepreneur, her experience as a chief executive officer in taking a company public and her keen understanding of new technology.
Timothy Fogarty has served on our board of directors since 2010. As the Chief Financial Officer and a Partner of The Contrarian Group, Inc., a private equity fund where he has worked since May 2006, Mr. Fogarty is also currently on the boards of TeachTown, Amanzi and Bellwether Marine Acquisition Corporation. From December 2003 to March 2006, Mr. Fogarty worked for Cypress Reinsurance, a startup Bermuda reinsurer, as President and Chief Operating Officer. Mr. Fogarty is a Certified Public Accountant in good standing in California and earned a B.S. in Accounting from California State Polytechnic University, Pomona. We believe Mr. Fogarty’s qualifications to sit on our board of directors include his extensive experience in investment management and accounting and his perspective gained as a board member of various early-stage companies.
Les Lyman has served on our board of directors since October 2013. Mr. Lyman is the Chairman of each of The Lyman Group, Inc. and The Tremont Group, Inc., independent agricultural retail companies with 15 locations in northern California. Under his leadership, the organizations have grown to become among the largest independent agricultural retailers in the nation. The organizations were honored with the Agricultural Retailers Associations’ 2011 Retailer of the Year Award and were awarded the Environmental Respect Award in 1996 and 2010 for excellence in environmental stewardship. Mr. Lyman has also directed the founding of Blue Creek Sustainable LLC, MVP Consolidated, FS3, Inland Terminal, and Mar Vista Resources. He is currently Chairman of the Board of Integrated Agribusiness Professionals, and a past board member of the Western Agricultural Chemicals Association, California Fertilizer Association, and the Agricultural Retailers Association. Mr. Lyman holds a degree in Agricultural Business Management from California Polytechnic State University, San Luis Obispo. We believe Mr. Lyman’s qualifications to sit on our board of directors include his experience with acquisitions, his extensive experience in building and leading agricultural retail businesses and his overall understanding of the agricultural market, competitors in the market and growers’ needs.
Richard Rominger has served on our board since our inception in 2006 and was Chair of our board from 2008 to 2013. Mr. Rominger is a fourth generation Yolo County, California farmer and is active in farm organizations and cooperatives. Mr. Rominger served as Director (Secretary) of the California Department of Food and Agriculture from 1977 to 1982 and was the Deputy Secretary at the U. S. Department of Agriculture in Washington, DC from 1993 to 2001. Mr. Rominger has served as a production agriculture advisor at University of California, Davis, University of California, Riverside, California State University, Fresno and California Polytechnic State University, San Luis Obispo. He continues to serve on the advisory committee of the Agricultural Sustainability Institute at University of California, Davis and as a special advisor to the Chancellor at University of California, Davis. He is a member of the University of California
94
Table of Contents
President’s Advisory Commission on Agriculture and Natural Resources and the California Roundtable on Agriculture and the Environment and serves on the board of directors of Oryzatech, Inc., a plant based building material company. Mr. Rominger earned a B.S. in Plant Science from University of California, Davis and graduated summa cum laude. We believe Mr. Rominger’s qualifications to sit on our board of directors include his years of government experience and his perspective gained as a leader in keeping American agriculture healthy and sustainable.
Shaugn Stanley has served on our board of directors since 2012. Mr. Stanley currently serves as Senior Managing Director at Stifel Financial Inc., which in 2010 purchased Thomas Weisel Partners, an investment firm that Mr. Stanley co-founded in 1998 and at which Mr. Stanley served in a number of senior positions, including Chief Financial Officer, Chief Administrative Officer and Director of Private Client Services. Prior to that, from 1997 to 1998, Mr. Stanley served as Chief Financial Officer for Montgomery Securities and in various executive financial roles at Fidelity Investments Brokerage Group from 1991 to 1997. Mr. Stanley earned a B.B.A. in Accounting from Stephen F. Austin State University and is a Certified Public Accountant. We believe Mr. Stanley’s qualifications to sit on our board of directors include his extensive experience in financial services and his expertise and experience in corporate accounting and financial reporting processes.
Executive Officers and Key Employees
James B. Boyd was appointed as our Vice President and Chief Financial Officer effective February 26, 2014, and Secretary effective March 25, 2014. Mr. Boyd previously served as Chief Financial Officer of Quantenna Communications from September 2012 through September 2013. From December 2010 to September 2012 he served as Chief Financial Officer for Link-A-Media Devices and from June 2007 to November 2010 he served as Chief Financial Officer and Senior Vice President of Silicon Storage Technology. From July 2000 to June 2007, Mr. Boyd served as Chief Financial Officer and Senior Vice President of ESS Technology. Mr. Boyd earned a M.B.A. in Finance from the University of Wisconsin and a J.D. from Golden Gate University.
Hector Absi has served as our Chief Operating Officer since January 2014. He previously served as our Senior Vice President of Commercial Operations from October 2012 to January 2014. From 2005 to 2012, Mr. Absi served as Vice President of Global Sales and Director of Sales and Marketing for Suterra, a leading provider of environmentally friendly products for agricultural crop protection and commercial pest control, where he was responsible for leading Suterra’s global and U.S. sales organizations. Prior to his position at Suterra, from 1993 to 2005, Mr. Absi served in various sales executive roles at Monsanto. Mr. Absi holds a B.S. in Mechanical Engineering from Valparaiso University and a M.B.A. from Washington University.
Linda Moore joined us as General Counsel and Chief Compliance Officer in March 2014. Ms. Moore previously served as General Counsel and Chief Compliance Officer for Merix Corp., Phoenix Technologies, and Jabil Circuit, in addition to being co-founder and principal of The Moore Group. Ms. Moore brings extensive experience in the areas of intellectual property, securities regulations and compliance, corporate governance, labor relations, and litigation management. Ms. Moore also has managed international tax, labor, and facilities issues with expatriate and extended assignments in Europe, Asia and Latin America. Ms. Moore earned her J.D. at Michigan State University School of Law.
Keith Pitts has served as our Vice President of Regulatory and Government Affairs since July 2008. Previously, from January 2001 to June 2007, Mr. Pitts served as Director of Public Policy at the Pew Initiative on Food and Biotechnology, a non-partisan research and policy organization based in Washington, D.C. From 1986 to 2001, Mr. Pitts worked in senior legislative, administrative, regulatory and public policy roles in both the U.S. Department of Agriculture and the House Committee on Agriculture. Mr. Pitts earned a B.A. in Chemistry from the University of North Carolina.
Alison Stewart, Ph.D., and Professor Emeritus of Lincoln University, New Zealand, has served as our Senior Vice President of Research & Development and Chief Technology Officer since January 2014. She previously served as our Chief Science Officer from April 2013 to January 2014. From 2012 to 2013, Dr. Stewart served as a Distinguished Professor of Plant Pathology in the Bio-Protection Research Centre of Lincoln University, New Zealand, where her work concentrated on beneficial strains of Trichoderma that resulted in four commercial products. In addition, for eight years, Dr. Stewart served as the Director of the Centre, assisting scientists in moving technology discovered in New Zealand out into commercial enterprises to enhance New Zealand agriculture and farmers’ livelihoods. Dr. Stewart is an author of approximately 200 peer-reviewed journal publications and a
95
Table of Contents
contributor to more than 300 other client reports, conference presentations, industry workshops and other significant research outputs. In addition, Dr. Stewart has served as Deputy Chair of the Board of Plant & Food Research in New Zealand, a board member of the Waite Research Institute in Adelaide, Australia, Vice President of the Australasian Plant Pathology Society and of the New Zealand Plant Protection Society, a senior editor of Australasian Plant Pathology and an editor of Phytopathologia Mediterranea.
Board of Directors
Our board of directors currently consists of seven members.
In accordance with our amended and restated certificate of incorporation and amended and restated bylaws, our board of directors has been divided into three classes with staggered three-year terms. At each annual general meeting of stockholders, the successors to directors whose terms then expire will be elected to serve from the time of election and qualification until the third annual meeting following election. Our directors are divided among three classes as follows:
| n | The Class I directors are Dr. Pamela G. Marrone and Les Lyman, and their terms will expire at the annual general meeting of stockholders to be held in 2017; |
| n | The Class II directors are Timothy Fogarty, Richard Rominger and Shaugn Stanley, and their terms will expire at the annual general meeting of stockholders to be held in 2015; and |
| n | The Class III directors are Elin Miller and Dr. Pamela Contag, and their terms will expire at the annual general meeting of stockholders to be held in 2016. |
Director Independence
The rules of The Nasdaq Global Market generally require that a majority of the members of a listed company’s board of directors be independent. In addition, the listing rules generally require that, subject to specified exceptions, each member of a listed company’s audit, compensation, and governance committees be independent. Audit committee members must also satisfy the independence criteria set forth in Rule 10A-3 under the Securities Exchange Act of 1934, as amended (Exchange Act). In order to be considered independent for purposes of Rule 10A-3, a member of an audit committee of a listed company may not, other than in his or her capacity as a member of the audit committee, the board of directors, or any other board committee: accept, directly or indirectly, any consulting, advisory, or other compensatory fee from the listed company or any of its subsidiaries; or be an affiliated person of the listed company or any of its subsidiaries.
Our board of directors has undertaken a review of its composition, the composition of its committees and the independence of each director and considered whether any director has a material relationship with us that could compromise his or her ability to exercise independent judgment in carrying out his or her responsibilities. Our board of directors has also reviewed whether the directors that comprise our audit committee and compensation committee satisfy the independence standards for those committees established by the applicable rules of the SEC and The Nasdaq Global Market. In making this determination, our board of directors has considered the relationships that each of these non-employee directors has with our company and all other facts and circumstances our board of directors deem relevant in determining their independence, including the beneficial ownership of our capital stock held by each non-employee director. Based on this determination, the board of directors determined that each of its non-employee members was independent except for Les Lyman.
Board Committees
Our board of directors has established an audit committee, a compensation committee and a nominating and corporate governance committee, each of which have the composition and responsibilities described below.
Audit Committee
Our audit committee is comprised of Mr. Fogarty and Mr. Stanley, each of whom is a non-employee member of our board of directors. Mr. Stanley is our audit committee chair and is our audit committee financial expert, as currently defined under the SEC rules. Our board of directors has determined that each of Mr. Fogarty and Mr. Stanley is independent within the meaning of the applicable SEC rules and the listing standards of Nasdaq.
96
Table of Contents
Our audit committee oversees our corporate accounting and financial reporting process. Among other matters, the audit committee evaluates the independent registered public accounting firm’s qualifications, independence and performance; determines the engagement of the independent registered public accounting firm; reviews and approves the scope of the annual audit and the audit fee; discusses with management and the independent registered public accounting firm the results of the annual audit and the review of our quarterly consolidated financial statements; approves the retention of the independent registered public accounting firm to perform any proposed permissible non-audit services; monitors the rotation of partners of the independent registered public accounting firm on our engagement team as required by law; reviews our critical accounting policies and estimates; and will annually review the audit committee charter and the committee’s performance. The audit committee operates under a written charter adopted by the board that satisfies the applicable standards of The Nasdaq Global Market.
Compensation Committee
Our compensation committee is comprised of Ms. Contag and Mr. Rominger, each of whom is a non-employee member of our board of directors. Mr. Bhatia is our compensation committee chair. Our board of directors has determined that each of Ms. Contag and Mr. Rominger is independent within the meaning of the applicable SEC rules and the listing standards of The Nasdaq Global Market.
Our compensation committee reviews and recommends policies relating to the compensation and benefits of our officers and employees. The compensation committee reviews and approves corporate goals and objectives relevant to the compensation of our chief executive officer and other executive officers, evaluates the performance of these officers in light of those goals and objectives and sets the compensation of these officers based on such evaluations. The compensation committee will administer the issuance of stock options and other awards under our stock plans. The compensation committee will review and evaluate, at least annually, the performance of the compensation committee and its members. The compensation committee operates under a written charter adopted by the board that satisfies the applicable standards of The Nasdaq Global Market.
Nominating and Corporate Governance Committee
Our nominating and corporate governance committee is comprised of Mr. Lyman, Ms. Miller, Mr. Rominger and Mr. Stanley, each of whom is a non-employee member of our board of directors. Ms. Miller is our nominating and corporate governance committee chair. Our board of directors has determined that each of Ms. Miller, Mr. Rominger and Mr. Stanley is independent within the meaning of the applicable SEC rules and the listing standards of Nasdaq. The board determined that Mr. Lyman should serve on the nominating and corporate governance committee for up to two years as permitted under the listing standards of The Nasdaq Global Market due to exceptional circumstances.
Our nominating and corporate governance committee is responsible for making recommendations regarding candidates for directorships and the size and the composition of our board of directors. In addition, the nominating and corporate governance committee is responsible for overseeing our corporate governance principles and making recommendations concerning governance matters. The nominating and corporate governance committee operates under a written charter adopted by the board that satisfies the applicable standards of The Nasdaq Global Market.
Compensation Committee Interlocks and Insider Participation
None of our executive officers currently serves or in the past year has served as a member of the board of directors or compensation committee of any other entity that has one or more executive officers serving on our board of directors.
Director Compensation
Directors who are employees of ours do not receive any compensation for their service on our board of directors. Our board of directors has adopted the following compensation policy that is applicable to all of our non-employee directors:
| n | Initial Equity Grants. Each non-employee director who joins the board will receive an option to purchase 16,000 shares of our common stock. |
| n | Annual Retainers. Each non-employee director will receive an annual retainer for service on the board valued at $50,000, consisting, at each director’s option, of up to $25,000 in cash and the remainder in options, in addition to annual retainers for service as chair of our board of directors, or committees of our board of directors, valued as follows, consisting in each case, at each director’s option, of up to 50% in |
97
Table of Contents
| cash and the remainder in options. Each director who is an affiliate of an investor holding more than 5% of our outstanding shares of common stock will receive the entire value of their eligible retainers in options. |
| Annual retainer fee for services on the board of directors |
$ | 50,000 | ||
| Additional annual retainer fees for service as chair of: |
||||
| Board of Directors |
$ | 15,000 | ||
| Audit Committee |
$ | 10,000 | ||
| Compensation Committee |
$ | 7,500 | ||
| Nominating and Corporate Governance Committee |
$ | 7,500 |
Director Compensation Table
| NAME |
FEES EARNED OR PAID IN CASH ($) |
OPTION AWARDS ($) (2),(3) |
TOTAL ($) |
|||||||||
| Elin Miller |
37,188 | 69,327 | (4) | 106,515 | ||||||||
| Ranjeet Bhatia (1) |
— | 60,757 | (5) | 60,757 | ||||||||
| Pamela Contag, Ph.D. |
14,500 | 205,807 | (6) | 220,307 | ||||||||
| Timothy Fogarty |
— | 60,757 | (7) | 60,757 | ||||||||
| Lawrence A. Hough (1) |
— | 69,871 | (8) | 69,871 | ||||||||
| Joseph Hudson (1) |
— | 60,757 | (9) | 60,757 | ||||||||
| Les Lyman |
14,500 | 205,807 | (10) | 220,307 | ||||||||
| Richard Rominger |
18,750 | 55,657 | (11) | 74,407 | ||||||||
| Shaugn Stanley |
22,500 | 61,733 | (12) | 84,233 | ||||||||
| (1) | Mr. Bhatia, Mr. Hough and Mr. Hudson served as directors for our fiscal year ended December 31, 2013, but their terms as directors expired on May 29, 2014 in connection with our annual meeting of stockholders. |
| (2) | This column reflects the aggregate grant date fair value of option awards granted to our directors estimated pursuant to FASB ASC 718, Compensation—Share based compensation (ASC 718). Valuation assumptions are described under Note 2 of our accompanying audited consolidated financial statements. |
| (3) | The following table sets forth the aggregate number of option awards held by each non-employee director as of December 31, 2013: |
| NAME |
AGGREGATE NUMBER OF OPTION AWARDS |
|||
| Elin Miller |
21,397 | |||
| Ranjeet Bhatia |
7,520 | |||
| Pamela Contag, Ph.D. |
18,480 | |||
| Timothy Fogarty |
7,520 | |||
| Lawrence A. Hough |
8,648 | |||
| Joseph Hudson |
7,520 | |||
| Les Lyman |
18,480 | |||
| Richard Rominger |
23,542 | |||
| Shaugn Stanley |
20,457 | |||
| (4) | On August 1, 2013, we granted Ms. Miller an option to purchase 3,200 shares of our common stock with a per share exercise price of $12.00. One-quarter of the total shares subject to her option vest one year from her vesting commencement date of August 1, 2013, and 1/48th of the total shares subject to her option vest monthly thereafter for 36 months, such that all of the shares subject to the option will be fully vested upon the fourth anniversary of her vesting commencement date. On August 28, 2013, we granted Ms. Miller an option to purchase 5,452 shares of our common stock with a per share exercise price of $13.01 as she elected to receive 50% of her annual retainer fee in stock options. All of the shares subject to the option will fully vest upon the date of the 2014 annual meeting of the stockholders. |
98
Table of Contents
| (5) | On August 28, 2013, we granted Mr. Bhatia an option to purchase 7,520 shares of our common stock with a per share exercise price of $13.01 as he received 100% of his annual retainer fee in stock options. All of the shares subject to the option will fully vest upon the date of the 2014 annual meeting of the stockholders. |
| (6) | On October 16, 2013, we granted Ms. Contag an option to purchase 16,000 shares of our common stock with a per share exercise price of $17.76 upon joining the board. One-third of the total shares subject to her option vest on the date of each of the 2014, 2015 and 2016 annual meetings of the stockholders, such that all of the shares subject to the option will be fully vested upon the date of the 2016 annual meeting of the stockholders. On October 16, 2013, we also granted Ms. Contag an option to purchase 2,480 shares of our common stock with a per share exercise price of $17.76 as she elected to receive 50% of her annual retainer fee in stock options. All of the shares subject to the option will fully vest upon the date of the 2014 annual meeting of the stockholders. |
| (7) | On August 28, 2013, we granted Mr. Fogarty an option to purchase 7,520 shares of our common stock with a per share exercise price of $13.01 as he received 100% of his annual retainer fee in stock options. All of the shares subject to the option will fully vest upon the date of the 2014 annual meeting of the stockholders. |
| (8) | On August 28, 2013, we granted Mr. Hough an option to purchase 8,648 shares of our common stock with a per share exercise price of $13.01 as he received 100% of his annual retainer fee in stock options. All of the shares subject to the option will fully vest upon the date of the 2014 annual meeting of the stockholders. |
| (9) | On August 28, 2013, we granted Mr. Hudson an option to purchase 7,520 shares of our common stock with a per share exercise price of $13.01 as he received 100% of his annual retainer fee in stock options. All of the shares subject to the option will fully vest upon the date of the 2014 annual meeting of the stockholders. |
| (10) | On October 16, 2013, we granted Mr. Lyman an option to purchase 16,000 shares of our common stock with a per share exercise price of $17.76 upon joining the board. One-third of the total shares subject to his option vest on the date of each of the 2014, 2015 and 2016 annual meetings of the stockholders, such that all of the shares subject to the option will be fully vested upon the date of the 2016 annual meeting of the stockholders. On October 16, 2013, we also granted Mr. Lyman an option to purchase 2,480 shares of our common stock with a per share exercise price of $17.76 as he elected to receive 50% of his annual retainer fee in stock options. All of the shares subject to the option will fully vest upon the date of the 2014 annual meeting of the stockholders. |
| (11) | On August 1, 2013, we granted Mr. Rominger an option to purchase 3,200 shares of our common stock with a per share exercise price of $12.00. One-quarter of the total shares subject to his option vest one year from his vesting commencement date of August 1, 2013, and 1/48th of the total shares subject to his option vest monthly thereafter for 36 months, such that all of the shares subject to the option will be fully vested upon the fourth anniversary of his vesting commencement date. On August 28, 2013, we granted Mr. Rominger an option to purchase 3,760 shares of our common stock with a per share exercise price of $13.01 as he elected to receive 50% of his annual retainer fee in stock options. All of the shares subject to the option will fully vest upon the date of the 2014 annual meeting of the stockholders. |
| (12) | On August 1, 2013, we granted Mr. Stanley an option to purchase 3,200 shares of our common stock with a per share exercise price of $12.00. One-quarter of the total shares subject to his option vest one year from his vesting commencement date of August 1, 2013, and 1/48th of the total shares subject to his option vest monthly thereafter for 36 months, such that all of the shares subject to the option will be fully vested upon the fourth anniversary of his vesting commencement date. On August 28, 2013, we granted Mr. Stanley an option to purchase 4,512 shares of our common stock with a per share exercise price of $13.01 as he elected to receive 50% of his annual retainer fee in stock options. All of the shares subject to the option will fully vest upon the date of the 2014 annual meeting of the stockholders. |
Consideration and Determination of Executive and Director Compensation
Because compensation decisions for executive officers are made by our entire board of directors, Dr. Pamela G. Marrone, our President and Chief Executive Officer, participates in the determination of compensation policy, including by making recommendations and participating in the voting with respect to the compensation of executive officers, other than with respect to her own compensation.
Code of Ethics
We have adopted a Code of Business Conduct and Ethics applicable to all officers, directors and employees, which is available on our website (investors.marronebio.com) under “Corporate Governance.” We intend to satisfy the disclosure requirement under Item 5.05 of Form 8-K regarding amendment to, or waiver from, a provision of our Code of Business Conduct and Ethics by posting such information on our website at the address and location specified above.
99
Table of Contents
We refer to our chief executive officer and our two other most highly compensated executive officers discussed below as our “named executive officers.” Our named executive officers for fiscal year 2013 were as follows:
| n | Pamela G. Marrone, Ph. D., President and Chief Executive Officer (Principal Executive Officer) |
| n | Donald J. Glidewell, Former Chief Financial Officer (Former Principal Financial Officer) |
| n | Hector Absi, Senior Vice President of Commercial Operations |
Summary Compensation Table
The following table presents information regarding compensation earned by or awards to our named executive officers during fiscal years 2013, 2012 and 2011.
| NAME |
YEAR | SALARY ($) |
BONUS ($) |
OPTION AWARDS ($) (1) |
NON-EQUITY INCENTIVE PLAN COMPENSATION ($) |
ALL OTHER COMPENSATION ($) (2) |
TOTAL ($) |
|||||||||||||||||||||
| Pamela G. Marrone, Ph.D |
2013 | 250,000 | 25,835 | (4) | 1,014,461 | 60,023 | 11,206 | 1,361,525 | ||||||||||||||||||||
| 2012 | 250,000 | — | 452,144 | 75,375 | 11,804 | 789,323 | ||||||||||||||||||||||
| 2011 | 220,833 | — | 66,146 | 34,642 | (3) | 10,307 | 331,928 | |||||||||||||||||||||
| Donald J. Glidewell |
2013 | 209,583 | — | 5,032 | 50,320 | 8,086 | 273,021 | |||||||||||||||||||||
| 2012 | 175,000 | — | 335,067 | 38,763 | 7,320 | 556,150 | ||||||||||||||||||||||
| 2011 | 116,641 | — | 87,155 | 14,930 | 2,856 | 221,582 | ||||||||||||||||||||||
| Hector Absi |
2013 | 213,542 | 25,000 | (4) | 395,739 | 49,668 | 29,006 | 712,955 | ||||||||||||||||||||
| 2012 | 52,038 | 10,000 | (5) | 323,750 | 11,527 | 7,458 | 404,773 | |||||||||||||||||||||
| (1) | This column reflects the aggregate grant date fair value of option awards granted to our named executive officers estimated pursuant to FASB ASC 718, Compensation—Share based compensation (ASC 718). Valuation assumptions are described in Note 2 of our accompanying audited consolidated financial statements. |
| (2) | This column includes our 401(k) retirement savings plan matching, payment of life insurance premiums, long-term disability and other insurance-related reimbursements. In addition, Mr. Absi’s other compensation includes the rent for his primary residence paid by the Company. |
| (3) | Dr. Marrone elected to defer $4,167 of her non-equity incentive plan compensation related to 2011. |
| (4) | Represents a discretionary bonus. |
| (5) | Represents a signing bonus. |
Non-Equity Incentive Awards
We structure our annual non-equity incentive awards to reward named executive officers for the successful performance of our company as a whole and of each participating named executive officer as an individual. For the 2013 fiscal year, our compensation committee established a bonus plan available to all of our executive officers and other key employees. The bonus plan provides for a target cash award of up to 30% of the named executive officer’s salary, with 75% of the target award based upon the achievement of company-wide goals, and 25% of the target award based upon the achievement of individual goals. The progress of the goals is tracked by the compensation committee on a quarterly basis. Each company-wide goal and individual goal received a weighting, such that a named executive officer would receive a portion of the target non-equity incentive award for each goal achieved. The company-wide goals were based on our forecasts and plans for fiscal year 2013 and took into account factors, including net revenues objectives, based on anticipated timing and volume of new customer activity, and product development events such as completion of development work and EPA submissions for new products, processing international registrations and introduction of products into new markets. Based upon these factors, the compensation committee determined that 73% of the company-wide goals were achieved in 2013. Therefore, the executive officers were entitled to 55% of their target bonuses based on upon the company-wide goals component.
100
Table of Contents
In addition to the company-wide goals, 25% of each named executive officer’s 2013 bonus target was comprised of achievement of individual goals. The 2013 individual goals for each named executive officer were based on the following factors:
Pamela G. Marrone, Ph.D., President and Chief Executive Officer
Dr. Marrone was evaluated on the basis of the overall performance of our company, including the success of the IPO and the extent to which we were successful in achieving net revenues goals, developing strategic collaborations, product development, commercialization targets, geographical expansion, organizational development and growth. The board determined that Dr. Marrone achieved 100% of her individual goals (representing 25% of her aggregate bonus target) for an aggregate non-equity incentive award equal to 80% of her bonus target (with 55% of this award based on the achievement of 73% of the company-wide goals).
Donald J. Glidewell, Former Chief Financial Officer
Under the terms of the transition agreement with Mr. Glidewell, Mr. Glidewell was entitled to receive 100% of his individual goals (representing 25% of his aggregate bonus target) for an aggregate non-equity incentive award equal to 80% of his bonus target (with 55% of this award based on the achievement of 73% of the company-wide goals).
Hector Absi, Senior Vice President of Commercial Operations
Mr. Absi was evaluated on the achievement of certain revenues and business development goals. He was determined to have achieved 90% of his individual goals (representing 23% of his aggregate bonus target) for an aggregate non-equity incentive award equal to 78% of his bonus target (with 55% of this award based on the achievement of 73% of the company-wide goals).
The non-equity incentive award can either be paid out or deferred to a future payout time at the discretion of the board of directors. Payments are not guaranteed and are subject to approval by the board of directors. In addition, the determination of goal achievement (full or partial) is made by the compensation committee and approved by the board of directors.
Outstanding Equity Awards at the End of Fiscal Year 2013
The following table provides information regarding unexercised stock options held by each of the named executive officers as of the end of fiscal year 2013.
| NAME |
GRANT DATE | SECURITIES UNDERLYING UNEXERCISED OPTIONS EXERCISABLE(#) (1) |
SECURITIES UNDERLYING UNEXERCISED OPTIONS UNEXERCISABLE (#) |
OPTION EXERCISE PRICE ($) |
OPTION EXPIRATION DATE |
|||||||||||||||
| Pamela G. Marrone, Ph.D. |
5/1/2007 | 53,378 | (2) | — | 0.47 | 5/1/2017 | ||||||||||||||
| 10/22/2008 | 47,794 | (3) | — | 1.19 | 10/22/2018 | |||||||||||||||
| 1/28/2009 | 9,559 | (4) | — | 1.19 | 1/28/2019 | |||||||||||||||
| 1/11/2010 | 4,779 | (5) | — | 1.19 | 1/11/2020 | |||||||||||||||
| 1/24/2011 | 19,092 | (6) | — | 1.19 | 1/24/2021 | |||||||||||||||
| 1/24/2011 | 31,863 | (7) | — | 1.19 | 1/24/2021 | |||||||||||||||
| 12/15/2011 | 13,276 | (8) | 18,587 | 1.41 | 12/15/2021 | |||||||||||||||
| 2/20/2012 | 15,390 | (9) | — | 3.11 | 2/20/2022 | |||||||||||||||
| 10/29/2012 | 18,587 | (10) | 45,138 | 12.08 | 10/29/2022 | |||||||||||||||
| 8/1/2013 | — | (11) | 1,911 | 12.00 | 8/1/2023 | |||||||||||||||
| 9/27/2013 | — | (12) | 84,000 | 18.01 | 9/27/2023 | |||||||||||||||
| 11/6/2013 | — | (13) | 482 | 16.77 | 11/6/2023 | |||||||||||||||
| Donald J. Glidewell |
4/27/2011 | 95,588 | (14) | — | 1.19 | 4/27/2021 | ||||||||||||||
| 12/15/2011 | 6,638 | (8) | 9,293 | 1.41 | 12/15/2021 | |||||||||||||||
| 2/20/2012 | 10,706 | (9) | — | 3.11 | 2/20/2022 | |||||||||||||||
| 5/11/2012 | 20,582 | (15) | 11,281 | 6.28 | 5/11/2022 | |||||||||||||||
| 10/29/2012 | 9,294 | (10) | 22,569 | 12.08 | 10/18/2022 | |||||||||||||||
| 8/1/2013 | — | (11) | 637 | 12.00 | 8/1/2023 | |||||||||||||||
| Hector Absi |
9/28/2012 | 24,894 | (16) | 54,763 | 6.28 | 9/28/2022 | ||||||||||||||
| 8/1/2013 | — | (11) | 159 | 12.00 | 8/1/2023 | |||||||||||||||
| 9/27/2013 | — | (12) | 33,333 | 18.01 | 9/27/2023 | |||||||||||||||
101
Table of Contents
| (1) | Options granted under the Marrone Bio Innovations, Inc. Stock Option Plan, which we refer to as the 2006 Plan, are immediately exercisable in full, regardless of vesting. Any unvested shares issued upon the exercise of these options are subject to a right of repurchase. |
| (2) | The option vested with respect to one-quarter of the total shares subject to the option on the first anniversary of the vesting commencement date of May 1, 2007, and with respect to 1/48th of the total shares subject to the option monthly thereafter for 36 months, such that all the shares were fully vested upon the fourth anniversary of the option’s vesting commencement date. |
| (3) | The option vested with respect to one-quarter of the total shares subject to the option on the first anniversary of the vesting commencement date of November 1, 2008, and with respect to 1/48th of the total shares subject to the option monthly thereafter for 36 months, such that all the shares were fully vested upon the fourth anniversary of the option’s vesting commencement date. |
| (4) | The option vested with respect to one-quarter of the total shares subject to the option on the first anniversary of the vesting commencement date of January 1, 2009, and with respect to 1/48th of the total shares subject to the option monthly thereafter for 36 months, such that all the shares were fully vested upon the fourth anniversary of the option’s vesting commencement date. |
| (5) | The option vested with respect to 100% of the total shares subject to the option on the vesting commencement date of January 1, 2010. |
| (6) | The options vested with respect to 100% of the total shares subject to the option on the vesting commencement date of January 1, 2011. |
| (7) | Includes 8,625 shares underlying exercisable options that are unvested. The options vest with respect to one-quarter of the total shares subject to the option on the first anniversary of the vesting commencement date of January 1, 2011, and with respect to 1/48th of the total shares subject to the options monthly thereafter for 36 months, such that all the shares will be fully vested upon the fourth anniversary of the options’ vesting commencement date. |
| (8) | The options vest with respect to 1/60th of the total shares subject to the options one month after the vesting commencement date of November 1, 2011, and with respect to 1/60th of the total shares subject to the options monthly thereafter for 59 months, such that all the shares will be fully vested upon the fifth anniversary of the options’ vesting commencement date. |
| (9) | The options vested with respect to 100% of the total shares subject to the options on the vesting commencement date of February 20, 2012. |
| (10) | The options vest with respect to one-quarter of the total shares subject to the options on October 18, 2013, and with respect to 1/48th of the total shares subject to the options monthly thereafter for 36 months, such that all the shares will be fully vested upon the fourth anniversary of the options’ vesting commencement date. |
| (11) | The options vest with respect to one-quarter of the total shares subject to the options on August 1, 2014, and with respect to 1/48th of the total shares subject to the options monthly thereafter for 36 months, such that all the shares will be fully vested upon the fourth anniversary of the options’ vesting commencement date. |
| (12) | The options vest with respect to one-quarter of the total shares subject to the options on September 27, 2014, and with respect to 1/48th of the total shares subject to the options monthly thereafter for 36 months, such that all the shares will be fully vested upon the fourth anniversary of the options’ vesting commencement date. |
| (13) | The option vests with respect to one-quarter of the total shares subject to the option on October 1, 2014, and with respect to 1/48th of the total shares subject to the option monthly thereafter for 36 months, such that all the shares will be fully vested upon the fourth anniversary of the option’s vesting commencement date. |
| (14) | Includes 33,842 shares underlying exercisable options that are unvested. The option vests with respect to one-quarter of the total shares subject to the option on the first anniversary of the vesting commencement date of May 1, 2011, and with respect to 1/48th of the total shares subject to the option monthly thereafter for 36 months, such that all the shares will be fully vested upon the fourth anniversary of the option’s vesting commencement date. |
| (15) | The option vests with respect to one-quarter of the total shares subject to the option on May 1, 2013, and with respect to 1/48th of the total shares subject to the option monthly thereafter for 36 months, such that all the shares will be fully vested upon the fourth anniversary of the option’s vesting commencement date. |
| (16) | The option vests with respect to one-quarter of the total shares subject to the option on September 28, 2013, and with respect to 1/48th of the total shares subject to the option monthly thereafter for 36 months, such that all the shares will be fully vested upon the fourth anniversary of the option’s vesting commencement date. |
Option Exercises and Stock Vested
No options were exercised by named executive officers in fiscal year 2013.
Employment Agreements
We have entered into employment offer letters with each of our named executive officers described below, and employee proprietary information and inventions assignment agreements, under which each of our named executive officers has agreed not to disclose our confidential information or induce us to use proprietary information or trade secrets of others at any time.
Pamela G. Marrone, Ph.D.
Effective as of June 29, 2006, we entered into an offer letter with Dr. Pamela G. Marrone, our President and Chief Executive Officer. Under the offer letter, Dr. Marrone is entitled to an annual base salary, which was $250,000, for 2013, and was increased to $300,000 for 2014 in connection with our initial public offering. Dr. Marrone is eligible for our benefit programs on the same terms as our other executives. In addition, in accordance with the terms of the offer letter, our board of directors granted Dr. Marrone a restricted stock award of 97,424 shares, which completely vested on June 29, 2010, and an option to purchase 53,378 shares of our common stock on May 1, 2007, which completely vested on May 1, 2011.
102
Table of Contents
The letter agreement provides that either party may terminate the employment arrangement for any reason or no reason, but four weeks’ notice is requested if the agreement is terminated by Dr. Marrone. In addition, the agreement provides that if we actively or constructively terminate Dr. Marrone’s employment without cause (whether or not in connection with a change of control), Dr. Marrone will be eligible to receive:
| n | an amount equal to twelve months of her then-current annual base salary payable in the form of salary continuation; and |
| n | medical and dental coverage, plus disability and life insurance premiums, for a period of twelve months following her termination. |
James B. Boyd
Effective as of February 26, 2014, we entered into an offer letter with James B. Boyd, our successor Vice President and Chief Financial Officer. Under the offer letter, Mr. Boyd is entitled to an annual base salary of $240,000, and is eligible for our benefit programs, vacation benefits, medical benefits and 401(k) plan participation. In addition, in satisfaction of obligations to Mr. Boyd in the offer letter with respect to option awards, our board of directors granted Mr. Boyd an option to purchase 190,000 shares of our common stock on February 13, 2014, which vests, subject to continued employment on each vesting date, with respect to one-quarter of the total shares subject to the option on the first anniversary of the option’s vesting commencement date of February 26, 2014 and with respect to 1/48th of the total shares subject to the option monthly thereafter for 36 months, such that all shares subject to the option will be fully vested on the fourth anniversary of such option’s vesting commencement date.
The offer letter also provided for a $10,000 signing bonus upon Mr. Boyd’s acceptance, relocation expenses of $20,000 and three months temporary housing. If Mr. Boyd fails to complete 12 months of service with us, he has agreed to repay a pro rata portion of his signing bonus and the relocation expenses that we paid on his behalf. The letter agreement provides that either party may terminate the employment arrangement for any reason or no reason, but four weeks’ notice is requested if Mr. Boyd terminates his employment. In addition, the agreement provides that if we actively or constructively terminate Mr. Boyd’s employment without cause (whether or not in connection with a change of control), Mr. Boyd will be eligible to receive:
| n | an amount equal to six months of his then-current annual base salary payable in the form of salary continuation; and |
| n | medical and dental coverage, plus disability and life insurance premiums, for a period of six months following his termination. |
Donald J. Glidewell
On November 7, 2013, we announced that Mr. Glidewell had decided to retire from the Company, and we accepted his resignation on March 25, 2014. To facilitate the transition, Mr. Glidewell had agreed to remain as our Chief Financial Officer for up to five months while we searched for a successor Chief Financial Officer, and we entered into a transition agreement with Mr. Glidewell that provides, among other things, for continued vesting of his outstanding equity awards through his retirement date and that upon his separation from the Company, Mr. Glidewell is eligible to receive:
| n | an amount equal to six months of his then-current annual base salary payable monthly for a period of six months from his retirement date in the form of salary continuation; |
| n | medical and dental coverage, plus disability and life insurance premiums, for a period of six months following his retirement; and |
| n | full acceleration of vesting of his outstanding equity awards that are unvested as of his retirement date. |
Hector Absi
Effective as of August 7, 2012, we entered into an offer letter with Hector Absi, our Chief Operating Officer. Under the offer letter, Mr. Absi is entitled to an annual base salary, which was $225,000 for 2013, and was increased to $235,000 for 2014 in connection with Mr. Absi’s promotion to Chief Operating Officer. Mr. Absi is eligible for our benefit programs, including our non-equity incentive program, vacation benefits, medical benefits and 401(k) plan participation, and was granted an option for the right to purchase 79,657 shares of our common stock on September 28, 2012, each of which vests, subject to continued employment on each vesting date, with respect to
103
Table of Contents
one-quarter of the total shares subject to the option on the first anniversary of the option’s vesting commencement date of September 28, 2012 and with respect to 1/48th of the total shares subject to the option monthly thereafter for 36 months, such that all shares subject to the option will be fully vested on the fourth anniversary of such option’s vesting commencement date.
The letter agreement provides that either party may terminate the employment arrangement for any reason or no reason, but four weeks’ notice is requested if Mr. Absi terminates his employment. The offer letter also provided for a $10,000 signing bonus upon Mr. Absi’s acceptance and relocation expenses of $2,000 per month for a period of 24 months starting in September 2012. Both the signing bonus and the relocation expenses are recoupable in part if Mr. Absi terminates his employment prior to the second anniversary of his commencement of employment with us.
Compensation Risk Management
We have considered the risk associated with our compensation policies and practices for all employees, and we believe we have designed our compensation policies and practices in a manner that does not create incentives that could lead to excessive risk taking that would have a material adverse effect on our Company.
Employee Benefit and Stock Plans
Marrone Bio Innovations, Inc. Stock Option Plan
We established the Marrone Bio Innovations, Inc. Stock Option Plan, which we refer to as the 2006 Plan, effective as of July 26, 2006. We ceased granting options under our 2006 Plan after, and the 2006 Plan terminated upon, the adoption of our 2011 Plan on July 19, 2011. Our 2006 Plan provided for the grant of incentive stock options, within the meaning of Section 422 of the Internal Revenue Code of 1986, as amended (the “Code”), to our employees and any parent and subsidiary corporations’ employees, and for the grant of non-qualified stock options to our employees, outside directors and consultants and our parent and subsidiary corporations’ employees and consultants.
Administration. Our board of directors administered our 2006 Plan. The administrator’s powers include the power to: determine the fair market value of our common stock; select the individuals to whom options may be granted; determine the number of shares of stock covered by each option; approve forms of award agreement; determine the terms and conditions of options granted to employees and consultants (e.g., the exercise price, the times when options may be exercised (which may be based on performance criteria), any vesting acceleration or waiver of forfeiture restrictions, and any restriction or limitation regarding any option or the underlying shares of stock); reduce the exercise price of any option granted to employees and consultants to the then current fair market value of our common stock if such fair market value has declined since the date of grant; prescribe, amend and rescind rules and regulations relating to our 2006 Plan; modify or amend each option; institute an option exchange program; and make all other determinations deemed necessary or advisable for administering our 2006 Plan.
Transferability of Options. Our 2006 Plan allows for the transfer of options only (i) by will; and (ii) by the laws of descent and distribution. Only the recipient of an option may exercise such option during his or her lifetime.
Certain Adjustments. In the event of certain changes in our capitalization our board of directors will make adjustments to one or more of (i) the number of shares that are covered by outstanding options; (ii) the exercise price of outstanding options, and (iii) the numerical share limits contained in our 2006 Plan. In the event of our complete liquidation or dissolution, recipients must be notified at least ten (10) days prior to the proposed transaction and may exercise all vested and unvested options until ten (10) days prior to such transaction; all outstanding options will terminate immediately prior to the consummation of such transaction.
Corporate Transactions. Our 2006 Plan provides that in the event of a corporate transaction, as defined in our 2006 Plan, each outstanding option will become immediately vested. In the event of a corporate transaction involving a merger or sale of assets, options will be exercisable for a period of fifteen (15) days from the date that notice of the transaction is provided; the option will then terminate upon the expiration of that period.
104
Table of Contents
2011 Stock Plan
We established our 2011 Stock Plan, which we refer to as the 2011 Plan, effective as of July 19, 2011. Our 2011 Plan provided for the grant of incentive stock options, within the meaning of Section 422 of the Code, to our employees and any parent and subsidiary corporations’ employees, and for the grant of non-qualified stock options and stock purchase rights to our employees, directors and consultants and any parent and subsidiary corporations’ employees, directors and consultants. We ceased granting options under our 2011 Plan after, and the 2011 Plan terminated upon, the adoption of our 2013 Plan on August 1, 2013.
Administration. Our board of directors administered our 2011 Plan. The administrator’s powers include the power to: determine the persons to whom, and the times at which, awards shall be granted and the number of shares of our common stock subject to each award; determine the fair market value of our common stock; determine the terms, conditions and restrictions applicable to each award (e.g. the exercise price, the method of payment, the method for satisfaction of any tax withholding obligation, the timing, terms and conditions of the exercisability and vesting of the award, the time of the expiration of the award, and the effect of the recipient’s termination of service); approve forms of award agreement; amend, modify, extend, cancel or renew any award or waive any restrictions or conditions applicable to any award; accelerate, continue, extend or defer the exercisability of any award; prescribe, amend or rescind rules guidelines and policies relating to the 2011 Plan; and make all other determinations and take such other actions with respect to the 2011 Plan or any award as it deems advisable and that is consistent with applicable law, regulations and rules.
Stock Options. Our 2011 Plan allowed for the grant of incentive stock options that qualify under Section 422 of the Code only to our employees and employees of any parent or subsidiary of ours. Non-qualified stock options could be granted to our employees, directors, and consultants and those of any parent or subsidiary of ours. The exercise price of all options granted under our 2011 Plan was required to be at least equal to the fair market value of our common stock on the date of grant. The term of an option may not exceed ten (10) years, except that with respect to any employee who owns more than ten percent (10%) of the voting power of all classes of our outstanding stock or the outstanding stock of any parent or subsidiary corporation as of the grant date (i) the term of an incentive stock option must not exceed five (5) years; and (ii) the exercise price of an incentive stock option must equal at least one hundred ten percent (110%) of the fair market value of our common stock on the grant date.
After the continuous service of an employee, director or consultant terminates, he or she may exercise his or her option, to the extent vested, for the period of time specified in the award agreement. If his or her continuous service terminates for cause, however, the option shall immediately terminate. An option may not be exercised later than the expiration of its term.
Stock Purchase Rights. Our 2011 Plan allowed for the grant of stock purchase rights. Stock purchase rights are rights to purchase our common stock for at least one hundred percent (100%) of the fair market value of our common stock and which are exercisable for thirty (30) days from the date of grant. The purchase price of a stock purchase right may be paid in cash or in the form of services rendered. The board of directors may subject a stock purchase right to vesting conditions.
Transferability of Awards. Our 2011 Plan allowed for the transfer of awards only (i) by will; (ii) by the laws of descent and distribution and (iii) for non-qualified stock options, to the extent authorized by the board of directors. Only the recipient of an award may exercise such award during his or her lifetime except that non-qualified stock options may be transferred to certain trusts and certain family members.
Certain Adjustments. In the event of certain changes in our capitalization, to prevent diminution or enlargement of the benefits or potential benefits available under the 2011 Plan, the board of directors will make adjustments to one or more of (i) the number and class of shares subject to the 2011 Plan and that are covered by outstanding awards; (ii) the exercise price of outstanding awards and (iii) the incentive stock option share limit contained in the 2011 Plan.
Changes in Control. Our 2011 Plan provides that in the event of a change in control, as defined in the 2011 Plan, the board of directors, in its discretion may provide that (i) the vesting and exercisability of any outstanding awards shall accelerate; or (ii) that each outstanding award (including, at the board of directors’ discretion, unvested awards) shall be cashed out; payment due with respect to unvested awards would then be payable in accordance
105
Table of Contents
with the existing vesting schedule. Further, the successor corporation may assume or substitute an equivalent award for each outstanding award; if the successor corporation does not do so, awards held by recipients who have not terminated employment with us will vest in full as of the change in control.
2013 Stock Incentive Plan
In August 2013, our board of directors adopted the 2013 Stock Incentive Plan (the “2013 Plan”). The 2013 Plan serves as the successor to our 2011 Plan. Our 2013 Plan provides for the grant of incentive stock options, within the meaning of Section 422 of the Code, to our employees and any parent and subsidiary corporations’ employees, and for the grant of non-qualified stock options, stock appreciation rights, restricted stock, restricted stock units and dividend equivalent rights to our employees, directors and consultants and our parent and subsidiary corporations’ employees, directors and consultants.
Shares. We initially authorized a total of 1,600,000 shares of our common stock for issuance pursuant to the 2013 Plan, plus the number of shares of common stock reserved for issuance pursuant to future grants under the 2011 Plan upon the adoption of the 2013 Plan. In addition, the number of shares authorized for issuance pursuant to the 2013 Plan will be increased by any additional shares that would otherwise return to the 2011 Plan after the date of adoption of the 2013 Plan as a result of the forfeiture, termination or expiration of awards previously granted under the 2011 Plan. Further, our 2013 Plan provides for annual increases in the number of shares available for issuance thereunder equal to the least of (i) 3.5% of the number of shares of the Company’s common stock outstanding on the last day of the immediately preceding fiscal year or (ii) a lesser number of shares determined by the administrator. Based on and subject to the foregoing, as of March 31, 2014, including such annual increase, 2,660,006 shares of our common stock, plus any additional shares which are subject to options granted under our 2006 Plan or 2011 Plan but are forfeited or otherwise terminate or expire subsequent to March 31, 2014, were authorized for issuance pursuant to the 2013 Plan. In addition, as of March 31, 2014, under the 2013 Plan, 1,532,382 shares of common stock were issuable upon the exercise of outstanding options granted and 1,127,624 additional shares of common stock were reserved for issuance pursuant to future grants.
Administration. Our board of directors or a committee of our board of directors administers our 2013 Plan. In the case of awards intended to qualify as “performance based compensation” within the meaning of Section 162(m) of the Code, the committee consists of two (2) or more “outside directors” within the meaning of Section 162(m) of the Code. The administrator has the power to determine and interpret the terms and conditions of the awards, including the employees, directors and consultants who will receive awards, the exercise price, the number of shares subject to each such award, the vesting schedule and exercisability of the awards, the restrictions on transferability of awards and the form of consideration payable upon exercise. The administrator also has the authority to institute an exchange program whereby the exercise prices of outstanding awards may be reduced or outstanding awards may be surrendered or cancelled in exchange for other awards of the same type (which may have higher or lower exercise prices) or awards of a different type.
Stock Options. Our 2013 Plan allows for the grant of incentive stock options that qualify under Section 422 of the Code only to our employees and employees of any parent or subsidiary of ours. Non-qualified stock options may be granted to our employees, directors and consultants and those of any parent or subsidiary of ours. The exercise price of all options granted under our 2013 Plan must at least be equal to the fair market value of our common stock on the date of grant. The term of an incentive stock option may not exceed ten (10) years, except that with respect to any employee who owns more than ten percent (10%) of the voting power of all classes of our outstanding stock or any parent or subsidiary corporation as of the grant date, the term must not exceed five (5) years and the exercise price must equal at least one hundred ten percent (110%) of the fair market value on the grant date.
After the continuous service of an employee, director or consultant terminates, he or she may exercise his or her option, to the extent vested, for the period of time specified in the option agreement. However, an option may not be exercised later than the expiration of its term.
Stock Appreciation Rights. Our 2013 Plan allows for the grant of stock appreciation rights. Stock appreciation rights allow the recipient to receive the appreciation in the fair market value of our common stock between the date of grant and the exercise date. The administrator will determine the terms of stock appreciation rights, including when such rights become exercisable and whether to pay the increased appreciation in cash or with shares of our common stock, or a combination thereof, except that the base appreciation amount for the cash or shares to be issued pursuant to the exercise of a stock appreciation right will be no less than one hundred percent (100%) of the fair
106
Table of Contents
market value per share on the date of grant. After the continuous service of an employee, director or consultant terminates, he or she may exercise his or her stock appreciation right, to the extent vested, only to the extent provided in the stock appreciation right agreement.
Restricted Stock Awards. Our 2013 Plan allows for the grant of restricted stock. Restricted stock awards are shares of our common stock that vest in accordance with terms and conditions established by the administrator. The administrator will determine the number of shares of restricted stock granted to any employee, director or consultant. The administrator may impose whatever conditions on vesting it determines to be appropriate. For example, the administrator may set restrictions based on the achievement of specific performance goals. Shares of restricted stock that do not vest are subject to our right of repurchase or forfeiture.
Restricted Stock Units. Our 2013 Plan allows for the grant of restricted stock units. Restricted stock units are awards that will result in payment to a recipient at the end of a specified period only if the vesting criteria established by the administrator are achieved or the award otherwise vests. The administrator may impose whatever conditions to vesting, restrictions and conditions to payment it determines to be appropriate. The administrator may set restrictions based on the achievement of specific performance goals or on the continuation of service or employment. Payments of earned restricted stock units may be made, in the administrator’s discretion, in cash, with shares of our common stock or other securities, or a combination thereof.
Dividend Equivalent Rights. Our 2013 Plan allows for the grant of dividend equivalent rights. Dividend equivalent rights are awards that entitle the recipients to compensation measured by the dividends we pay with respect to our common stock.
Transferability of Awards. Our 2013 Plan allows for the transfer of awards under the 2013 Plan only (i) by will; (ii) by the laws of descent and distribution and (iii) for awards other than incentive stock options, to the extent authorized by the administrator. Only the recipient of an incentive stock option may exercise such award during his or her lifetime.
Certain Adjustments. In the event of certain changes in our capitalization, to prevent diminution or enlargement of the benefits or potential benefits available under the 2013 Plan, the administrator will make adjustments to one or more of the number or class of shares that are covered by outstanding awards, the exercise or purchase price of outstanding awards, the numerical share limits contained in the 2013 Plan and any other terms that the administrator determines require adjustment. In the event of our complete liquidation or dissolution, all outstanding awards will terminate immediately upon the consummation of such transaction.
Corporate Transactions and Changes in Control. Our 2013 Plan provides that in the event of a corporate transaction, as defined in the 2013 Plan, each outstanding award will terminate upon the consummation of the corporate transaction to the extent that such awards are not assumed by the acquiring or succeeding corporation. Prior to or upon the consummation of a corporate transaction or a change in control, as defined in the 2013 Plan, an outstanding award may vest, in whole or in part, to the extent provided in the award agreement or as determined by the administrator in its discretion. The administrator may condition the vesting of an award upon the subsequent termination of the recipient’s service or employment within a specified period of time following the consummation of a corporate transaction or change in control. The administrator will not be required to treat all awards similarly in the event of a corporate transaction or change in control.
Plan Amendments and Termination. Our 2013 Plan will automatically terminate ten (10) years following the date it becomes effective, unless we terminate it sooner. In addition, our board of directors has the authority to amend, suspend or terminate the 2013 Plan provided such action does not impair the rights under any outstanding award unless mutually agreed to in writing by the recipient and us.
401(k) Plan
We maintain a 401(k) retirement savings plan. Each participant who is a U.S. employee may contribute to the 401(k) plan, through payroll deductions, up to a statutorily prescribed annual limit imposed by the Internal Revenue Service (which limit was $17,500 in 2013). All amounts contributed by employee participants and earnings on these contributions are fully vested at all times and are not taxable to participants until withdrawn. Employee participants may elect to invest their contributions in various established funds. We may make contributions to the accounts of plan participants.
107
Table of Contents
PRINCIPAL AND SELLING STOCKHOLDERS
The following table sets forth information regarding beneficial ownership of our securities as of March 31, 2014 and as adjusted to reflect the shares of common stock to be issued and sold in this offering assuming no exercise of the underwriters’ option to purchase additional shares, by:
| n | each person or group known by us to be the beneficial owner of more than 5% of our common stock; |
| n | each of our named or current executive officers; |
| n | each of our directors; |
| n | all current executive officers and directors as a group; and |
| n | Syngenta Ventures Pte. LTD., the selling stockholder. |
We have determined beneficial ownership in accordance with SEC rules. The information does not necessarily indicate beneficial ownership for any other purpose. Under these rules, the number of shares of common stock deemed outstanding includes shares issuable upon exercise of options held by the respective person or group that may be exercised or converted within 60 days after March 31, 2014. For purposes of calculating each person’s or group’s percentage ownership, stock options and warrants exercisable within 60 days after March 31, 2014 are included for that person or group but not the stock options of any other person or group.
Applicable percentage ownership prior to this offering is based on 19,707,001 shares of common stock outstanding at March 31, 2014. In computing the number of shares of common stock beneficially owned by a person and the percentage ownership of that person, we deemed to be outstanding all shares of common stock subject to options and warrants exercisable within 60 days of March 31, 2014. We did not deem these shares outstanding, however, for the purpose of computing the percentage ownership of any other person. For purposes of the table below, we have assumed that 23,107,001 shares of common stock will be outstanding upon completion of this offering, based on (i) 19,707,001 shares outstanding as of March 31, 2014 and (ii) 3,400,000 shares that will be sold by us in the offering.
108
Table of Contents
Unless otherwise indicated and subject to applicable community property laws, to our knowledge, each stockholder named in the following table possesses sole voting and investment power over the shares listed. Unless otherwise noted below, the address of each person listed on the table is c/o Marrone Bio Innovations, Inc., 2121 Second St. Suite A-107, Davis, CA 95618.
| SHARES BENEFICIALLY OWNED PRIOR TO THIS OFFERING |
NUMBER OF SHARES BEING OFFERED |
SHARES BENEFICIALLY OWNED AFTER THIS OFFERING |
||||||||||||||||||
| NAME AND ADDRESS OF BENEFICIAL OWNER |
SHARES
(#) |
SHARES
(%) |
SHARES (#) |
SHARES (%) |
||||||||||||||||
| 5% Stockholders: |
||||||||||||||||||||
| Gilder, Gagnon, Howe & Co. LLC (1) |
3,088,323 | 15.7 | — | 3,088,323 | 13.4 | |||||||||||||||
| 3 Columbus Circle, 26th Floor |
||||||||||||||||||||
| New York, NY 10019 |
||||||||||||||||||||
| Syngenta Ventures Pte. LTD. (2) |
1,671,270 | 8.5 | 600,000 | 1,071,270 | 4.6 | |||||||||||||||
| 1, Harbourfront Avenue |
||||||||||||||||||||
| 098632 Singapore |
||||||||||||||||||||
| PRIMECAP Management Company (3) |
1,501,983 | 7.6 | — | 1,501,983 | 6.5 | |||||||||||||||
| 225 South Lake Avenue #400 |
||||||||||||||||||||
| Pasadena, CA 91101 |
||||||||||||||||||||
| Stuart Mill Venture Partners, L.P. (4) |
1,347,317 | 6.8 | — | 1,347,317 | 5.8 | |||||||||||||||
| 252 North Washington Street |
||||||||||||||||||||
| Falls Church, VA 22046 |
||||||||||||||||||||
| Entities affiliated with Saffron Hill Ventures (5) |
1,287,983 | 6.5 | — | 1,287,983 | 5.6 | |||||||||||||||
| 130 Wood Street |
||||||||||||||||||||
| London EC2V 6DL |
||||||||||||||||||||
| United Kingdom |
||||||||||||||||||||
| CGI Opportunity Fund II, L.P. (6) |
1,272,466 | 6.5 | — | 1,272,466 | 5.5 | |||||||||||||||
| 5 San Joaquin Plaza, Suite 330 |
||||||||||||||||||||
| Newport Beach, CA 92660 |
||||||||||||||||||||
| Entities affiliated with Waddell & Reed Financial, Inc. (7) |
1,029,000 | 5.2 | — | 1,029,000 | 4.5 | |||||||||||||||
| 6300 Lamar Avenue |
||||||||||||||||||||
| Overland Park, KS 66202 |
||||||||||||||||||||
| Directors and Named Executive Officers: |
||||||||||||||||||||
| Pamela G. Marrone, Ph.D. (8) |
993,464 | 5.0 | — | 993,464 | 4.3 | |||||||||||||||
| Elin Miller (9) |
18,197 | * | — | 18,197 | * | |||||||||||||||
| Pamela Contag, Ph.D. (10) |
7,814 | * | — | 7,814 | * | |||||||||||||||
| Timothy Fogarty (11) |
8,710 | * | — | 8,710 | * | |||||||||||||||
| Les Lyman (12) |
8,814 | * | — | 8,814 | * | |||||||||||||||
| Richard Rominger (13) |
116,677 | * | — | 116,677 | * | |||||||||||||||
| Shaugn Stanley (14) |
10,885 | * | — | 10,885 | * | |||||||||||||||
| James B. Boyd (15) |
— | — | — | — | — | |||||||||||||||
| Donald J. Glidewell (16) |
52,698 | * | — | 52,698 | * | |||||||||||||||
| Hector Absi (17) |
5,285 | * | — | 5,285 | * | |||||||||||||||
| All current directors and executive officers as a group (12 persons) (18) |
1,255,276 | 6.2 | — | 1,255,276 | 5.3 | |||||||||||||||
| * | Represents beneficial ownership of less than 1% of our outstanding common stock. |
| (1) | As reported in the Schedule 13G filed April 8, 2014, the securities reported on herein include 2,476,222 shares held in customer accounts over which partners and/or employees of Gilder, Gagnon, Howe & Co. LLC (“Gilder”) have discretionary authority to dispose of or direct the disposition of the shares, 68,185 shares held in the account of the profit sharing plan of Gilder, and 543,916 shares held in accounts owned by the partners of Gilder and their families. |
| (2) | Syngenta AG, the ultimate parent of Syngenta Ventures Pte. LTD., is a public company traded on both the SIX Swiss Exchange and the NYSE. Represents shares of common stock owned as of May 29, 2014. The selling stockholder is not an affiliate of a broker dealer. |
109
Table of Contents
| (3) | PRIMECAP Management Company is an independent investment management company. |
| (4) | Includes warrants to purchase 8,929 shares of common stock held by Stuart Mill Venture Partners, L.P. Walter Lubsen Jr., Jeffrey Salinger and Jana Hernandes are the Managing Partners and Lawrence Hough is the Managing Director of Stuart Mill Partners, LLC, the general partner of Stuart Mill Venture Partners, L.P., and therefore may be deemed to share voting control and investment power over the securities held by Stuart Mill Venture Partners, L.P. |
| (5) | Includes 191,782 shares of common stock held by Saffron Hill Ventures L.P., 1,096,201 shares of common stock held by Saffron Hill Ventures 2, L.P. Shawn Luetchens and Ranjeet Bhatia are Directors of Saffron Hill MGP Ltd and Saffron Hill MGP2 Ltd, the General Partners of Saffron Hill Ventures L.P. and Saffron Hill Ventures 2, L.P., respectively, and therefore may be deemed to share voting control and investment power over the securities held by Saffron Hill Ventures L.P. and Saffron Hill Ventures 2, L.P. |
| (6) | Peter V. Ueberroth and Joseph Ueberroth are Partners of CGI Opportunity Gen Par II, LLC, the sole General Partner of CGI Opportunity Fund II, L.P. and therefore may be deemed to share voting control and investment power over the securities held by CGI Opportunity Fund II, L.P. See also Note 11 to this section. |
| (7) | As reported in the Schedule 13G filed February 7, 2014, the securities reported on herein are beneficially owned by one or more open-end investment companies or other managed accounts which are advised or sub-advised by Ivy Investment Management Company (“IICO”), the direct holder of 475,300 shares and an investment advisory subsidiary of Waddell & Reed Financial, Inc. (“WDR”) or Waddell & Reed Investment Management Company (“WRIMCO”), the direct holder of 553,700 shares and an investment advisory subsidiary of Waddell & Reed, Inc. (“WRI”). WRI is a broker-dealer and underwriting subsidiary of Waddell & Reed Financial Services, Inc., a parent holding company (“WRFSI”). In turn, WRFSI is a subsidiary of WDR, a publicly traded company. The investment advisory contracts grant IICO and WRIMCO all investment and/or voting power over securities owned by such advisory clients. The investment sub-advisory contracts grant IICO and WRIMCO investment power over securities owned by such sub-advisory clients and, in most cases, voting power. Any investment restriction of a sub-advisory contract does not restrict investment discretion or power in a material manner. Therefore, IICO and/or WRIMCO may be deemed the beneficial owner of the securities covered by this statement under Rule 13d-3 of the Securities Exchange Act of 1934. |
| (8) | Includes 710,875 shares of common stock held by Dr. Marrone, 223,013 shares of common stock issuable to Dr. Marrone upon the exercise of outstanding options exercisable within 60 days, 6,442 shares of common stock held by Florence H. Marrone TOD Pamela G. Marrone and 53,134 shares of common stock held by Dr. Marrone and Michael Rogers. Does not include 140,823 shares of common stock issuable to Dr. Marrone upon the exercise of outstanding options not exercisable within 60 days. |
| (9) | Includes 18,197 shares of common stock issuable upon the exercise of outstanding options exercisable within 60 days. Does not include 3,200 shares of common stock issuable upon the exercise of outstanding options not exercisable within 60 days. |
| (10) | Includes 7,814 shares of common stock issuable to Ms. Contag upon the exercise of outstanding options exercisable within 60 days. Does not include 10,666 shares of common stock issuable upon the exercise of outstanding options not exercisable within 60 days. |
| (11) | Includes 1,190 shares of common stock held by Timothy and Patricia Fogarty 2011 Trust, Dated August 1, 2011. Timothy Fogarty is a Partner of the Contrarian Group, an affiliate of CGI Opportunity Fund II, L.P. but does not hold voting control or investment power over the securities held by CGI Opportunity Fund II, L.P. Includes 7,520 shares of common stock issuable upon the exercise of outstanding options exercisable within 60 days. See also Note 6 to this section. |
| (12) | Includes 1,000 shares of common stock held by Leslie F. Lyman as custodian for Jackson WH Lyman UCAUTMA and 7,814 shares of common stock issuable upon the exercise of outstanding options exercisable within 60 days. Does not include 10,666 shares of common stock issuable upon the exercise of outstanding options not exercisable within 60 days. |
| (13) | Includes 99,522 shares of common stock held by The Richard and Mary Rominger Community Trust and 17,155 shares of common stock usable to Mr. Rominger upon the exercise of outstanding options exercisable within 60 days. Does not include 6,387 shares of common stock issuable upon the exercise of outstanding options not exercisable within 60 days. |
| (14) | Includes 10,885 shares of common stock issuable upon the exercise of outstanding options exercisable within 60 days. Does not include 9,572 shares of common stock issuable upon the exercise of outstanding options not exercisable within 60 days. |
| (15) | Mr. Boyd joined us on February 13, 2014. Does not include 190,000 shares of common stock issuable upon the exercise of outstanding options not exercisable within 60 days. |
| (16) | Mr. Glidewell retired effective March 25, 2014. Includes 52,698 shares of common stock issuable upon the exercise of outstanding options exercisable within 60 days. |
| (17) | Includes 5,285 shares of common stock issuable upon the exercise of outstanding options exercisable within 60 days. Does not include 181,614 shares of common stock issuable upon the exercise of outstanding options not exercisable within 60 days. |
| (18) | Includes 872,163 shares of common stock, and 383,113 shares of common stock issuable upon the exercise of outstanding options held by current directors and executive officers exercisable within 60 days. Does not include 1,010,315 shares of common stock issuable upon the exercise of outstanding options held by current directors and executive officers not exercisable within 60 days. Does not include shares or options held by Mr. Glidewell, who retired on March 25, 2014. See also Notes 6, 15 and 16 to this section. |
110
Table of Contents
CERTAIN RELATIONSHIPS AND RELATED PARTY TRANSACTIONS
We describe below the transactions and series of similar transactions, since December 31, 2011, to which we were a participant or will be a participant, in which:
| n | the amounts involved exceeded or will exceed $120,000; and |
| n | any of our directors, executive officers, holders of more than 5% of our capital stock (which we refer to as 5% stockholders) or any member of their immediate family had or will have a direct or indirect material interest, other than compensation arrangements with directors and executive officers, which are described where required under the section titled “Executive Compensation.” |
June 2013 Credit Facility
In June 2013, we entered into a credit facility agreement with a group of lenders under which such lenders have committed to permit us to draw, in exchange for promissory notes that accrue interest at a rate of 10% per annum, an aggregate of up to $5,000,000. In addition, in connection with our entry into the credit facility agreement, we have agreed to pay each lender a fee of 2% of such lender’s commitment amount, and we issued warrants to purchase a variable number of shares of common stock to the lenders, which represent the right to purchase an aggregate of up to 59,521 shares of common stock with an exercise price of $8.40 per share, 70% of the initial public offering price of $12.00 per share. See “Management’s Discussion and Analysis of Financial Condition and Results of Operations—June 2013 Credit Facility.”
The table below sets forth, for each lender under the credit facility agreement that is a director, executive officer or 5% stockholder, and their respective affiliates, the aggregate principal amount committed under the credit facility agreement, the fee paid to such lender in respect of such commitment, and the number of shares of common stock into which the warrants issuable to such lender are convertible.
| NAME |
AGGREGATE COMMITMENT AMOUNT ($) |
CREDIT FEE ($) |
WARRANT SHARES ISSUABLE |
|||||||||
| One Earth Capital, LLC (1) |
750,000 | 15,000 | 8,929 | |||||||||
| Saffron Hill Ventures 2, L.P. (2) |
2,000,000 | 40,000 | 23,809 | |||||||||
| Stuart Mill Venture Partners, L.P. (3) |
750,000 | 15,000 | 8,929 | |||||||||
| Timothy and Patricia Fogarty 2011 Trust, Dated August 1, 2011 (4) |
100,000 | 2,000 | 1,190 | |||||||||
| Lawrence Hough (5) |
160,000 | 3,200 | 1,905 | |||||||||
| (1) | One Earth Capital, LLC is an affiliate of Joseph Hudson, who was a member of our board of directors at the time of the investment and until his term as a director expired on May 29, 2014 in connection with our annual meeting of stockholders. |
| (2) | Saffron Hill Ventures 2, L.P., is a 5% stockholder whose representative, Ranjeet Bhatia, was a member of our board of directors until his term as a director expired on May 29, 2014 in connection with our annual meeting of stockholders. |
| (3) | Stuart Mill Venture Partners, L.P., is a 5% stockholder whose representative, Lawrence Hough, was a member of our board of directors until his term as a director expired on May 29, 2014 in connection with our annual meeting of stockholders. See also Note 5 to this section. |
| (4) | Timothy Fogarty was elected to our board of directors as a representative of CGI Opportunity Fund II, L.P., and its related affiliates. |
| (5) | Lawrence Hough was elected to our board of directors as a representative of Stuart Mill Venture Partners, L.P. See also Note 3 to this section. |
Issuance of Syngenta Convertible Note
In December 2012, we issued and sold to Syngenta Ventures Pte. LTD a convertible note in the aggregate principal amount of $12,500,000 under a convertible note purchase agreement. The convertible note accrued interest at a rate of 10.00% per annum and would have matured on October 16, 2015, unless extended, but the convertible note and all principal and accrued interest automatically converted into 1,589,368 shares of common stock in connection with our initial public offering in accordance with their terms.
Issuance of Insider Convertible Notes
From March through October 2012, we issued and sold in a series of closings convertible notes in the aggregate principal amount of approximately $9,100,000 under a convertible note purchase agreement. The convertible notes all accrued interest at a rate of 10.0% per annum and would have matured on September 30, 2013, but the
111
Table of Contents
convertible notes and all principal and accrued interest automatically converted into an aggregate of 1,216,580 shares of our common stock upon completion of our initial public offering.
The table below sets forth, for each purchaser of the convertible notes that is a director, executive officer or 5% stockholder, and their respective affiliates, the aggregate principal amount and purchase price of convertible notes purchased and the number of shares of common stock into which such convertible notes converted upon the completion of our initial public offering.
| NAME |
AGGREGATE PRINCIPAL AND AGGREGATE PURCHASE PRICE OF CONVERTIBLE NOTES ($) |
SHARES OF COMMON STOCK ISSUED |
||||||
| CGI Opportunity Fund II, L.P. (1) |
1,000,000 | 136,718 | ||||||
| One Earth Capital, LLC (2) |
1,000,000 | 136,643 | ||||||
| Saffron Hill Ventures 2, L.P. (3) |
1,474,960 | 201,599 | ||||||
| Stuart Mill Venture Partners, L.P. (4) |
1,500,000 | 205,021 | ||||||
| Syngenta Ventures Pte. LTD. (5) |
500,000 | 68,266 | ||||||
| Entities affiliated with CPV Partners GP, LLC (6) |
790,000 | 107,830 | ||||||
| Ranjeet Bhatia (7) |
150,000 | 20,502 | ||||||
| Dr. Pamela G. Marrone (8) |
30,049 | 4,105 | ||||||
| (1) | CGI Opportunity Fund II, L.P. is a 5% stockholder whose representative, Tim Fogarty, is a member of our board of directors. |
| (2) | One Earth Capital, LLC is an affiliate of Joseph Hudson, who was a member of our board of directors at the time of the investment and until his term as a director expired on May 29, 2014 in connection with our annual meeting of stockholders. |
| (3) | Saffron Hill Ventures 2, L.P. is a 5% stockholder whose representative, Ranjeet Bhatia, was a member of our board of directors until his term as a director expired on May 29, 2014 in connection with our annual meeting of stockholders. See also note 8 to this section. |
| (4) | Stuart Mill Venture Partners, L.P. is a 5% stockholder whose representative, Lawrence Hough, was a member of our board of directors until his term as a director expired on May 29, 2014 in connection with our annual meeting of stockholders. |
| (5) | Syngenta Ventures Pte. LTD. is a 5% stockholder. |
| (6) | CPV Partners GP, LLC is a 5% stockholder. |
| (7) | Ranjeet Bhatia was a member of our board of directors as a representative of Saffron Hill Ventures 2, L.P. See also note 4 to this section. |
| (8) | Pamela G. Marrone is our Chief Executive Officer, a member of our board of directors and a 5% stockholder. The convertible notes purchased by Pamela G. Marrone and Michael J. Rogers and those purchased by Florence H. Marrone TOD Pamela G. Marrone are aggregated with those purchased by Pamela G. Marrone for purposes above. |
Syngenta
In February 2011, we entered into an agreement with Syngenta Crop Protection AG, an affiliate of a 5% stockholder, whereby we have designated Syngenta as our exclusive distributor for Regalia in specialty crop markets in Europe, Africa and the Middle East. In addition, we entered into a related testing arrangement with Syngenta in February 2012, which was terminated during the three months ended March 31, 2014. During the year ended December 31, 2013, we recorded revenue of $116,000 relating to sales of product to Syngenta and $131,000 relating to license revenue recognized based on the terms of our agreements with Syngenta. During the three months ended March 31, 2014, we recorded revenue of $328,000 relating to license revenue recognized based on the terms of our agreements with Syngenta, of which $292,000 was recognized upon termination of the testing arrangement. As of December 31, 2013 and March 31, 2014, we had no outstanding accounts receivable due from Syngenta. For a description of the agreement, see “Business—Strategic Collaborations and Relationships.”
The Lyman/Tremont Groups
Les Lyman, a member of our board of directors, is the chairman and significant indirect shareholder of The Tremont Group, Inc. During the year ended December 31, 2013 and the three months ended March 31, 2014, The Tremont Group, Inc. purchased $1,446,000 and $320,000, respectively, of our products for further distribution and resale. As of December 31, 2013 and March 31, 2014 we had outstanding accounts receivable due from The Tremont Group, Inc. of $903,000 and $1,230,000, respectively. Although we anticipate sales of our products to The Tremont Group, Inc. to continue through 2014, we cannot estimate the amount of those sales.
112
Table of Contents
Executive Compensation and Employment Arrangements
Please see “Executive Compensation” for information on compensation arrangements with our executive officers and agreements with, and offer letters to, our executive officers containing compensation and termination provisions, among others.
Director and Officer Indemnification and Insurance
We have entered into indemnification agreements with certain of our directors and executive officers, and we purchase directors’ and officers’ liability insurance. The indemnification agreements and our amended and restated certificate of incorporation and bylaws require us to indemnify our directors and officers to the fullest extent permitted by Delaware law. See “Description of Capital Stock—Limitations of Liability and Indemnification Matters.”
Policies and Procedures Regarding Related Party Transactions
Our board of directors reviews related party transactions for potential conflict of interest issues. Our board of directors has adopted a written related person transaction policy to set forth the policies and procedures for the review and approval or ratification of related person transactions. This policy covers any transaction, arrangement or relationship, or any series of similar transactions, arrangements or relationships in which we were or are to be a participant, the amount involved exceeds $120,000 and a related person had or will have a direct or indirect material interest, including, without limitation, purchases of goods or services by or from the related person or entities in which the related person has a material interest, indebtedness, guarantees of indebtedness or employment by us or a related person.
Director Independence
For a discussion of the independence of our directors, please see “Management—Director Independence” above.
113
Table of Contents
General
The following is a summary of the rights of our common stock and preferred stock and of certain provisions of our restated certificate of incorporation and bylaws. For more detailed information, please see our restated certificate of incorporation and bylaws, which are filed as exhibits to the registration statement of which this prospectus is a part.
Our certificate of incorporation provides for one class of common stock. In addition, our certificate of incorporation authorizes shares of undesignated preferred stock, the rights, preferences and privileges of which may be designated from time to time by our board of directors.
Our authorized capital stock consists of 270,000,000 shares, all with a par value of $0.00001 per share, of which:
| n | 250,000,000 shares are designated as common stock; and |
| n | 20,000,000 shares are designated as preferred stock. |
As of March 31, 2014 we had outstanding 19,707,001 shares of common stock, held by 106 stockholders of record. As of March 31, 2014 we also had outstanding options to acquire 2,974,054 shares of our common stock with a weighted average exercise price of $10.95 per share held by current and former employees, directors and consultants. In addition, as of March 31, 2014 there were warrants outstanding for the purchase of an aggregate of 144,646 shares of common stock with a weighted average exercise price of $8.40 per share.
Common Stock
Voting Rights
Under our amended and restated certificate of incorporation, each share of common stock entitles the holder to one vote with respect to each matter presented to our stockholders on which the holders of common stock are entitled to vote. Subject to any rights that may be applicable to any then outstanding preferred stock, our common stock votes as a single class on all matters relating to the election and removal of directors on our board of directors and as provided by law. Holders of our common stock do not have cumulative voting rights. Except in respect of matters relating to the election and removal of directors on our board of directors and as otherwise provided in our amended and restated certificate of incorporation or required by law, all matters to be voted on by our stockholders must be approved by a majority of the shares present in person or by proxy at the meeting and entitled to vote on the subject matter. In the case of election of directors, all matters to be voted on by our stockholders must be approved by a plurality of the votes entitled to be cast by all shares of common stock.
Dividends
Subject to preferences that may apply to any shares of preferred stock outstanding at the time, the holders of our common stock will be entitled to share equally, identically and ratably in any dividends that our board of directors may determine to issue from time to time.
Liquidation Rights
In the event of any voluntary or involuntary liquidation, dissolution or winding up of our affairs, holders of our common stock would be entitled to share ratably in our assets that are legally available for distribution to stockholders after payment of our debts and other liabilities. If we have any preferred stock outstanding at such time, holders of the preferred stock may be entitled to distribution and/or liquidation preferences. In either such case, we must pay the applicable distribution to the holders of our preferred stock before we may pay distributions to the holders of our common stock.
Other Rights
Our stockholders have no preemptive, conversion or other rights to subscribe for additional shares. All outstanding shares are, and all shares offered by this prospectus will be, when sold, validly issued, fully paid and nonassessable. The rights, preferences and privileges of the holders of our common stock will be subject to, and may be adversely affected by, the rights of the holders of shares of any series of our preferred stock that we may designate and issue in the future.
Preferred Stock
Though we currently have no plans to issue any shares of preferred stock, our board of directors have the authority, without further action by our stockholders, to designate and issue up to 20,000,000 shares of preferred stock in one
114
Table of Contents
or more series. Our board of directors may also designate the rights, preferences and privileges of the holders of each such series of preferred stock, any or all of which may be greater than or senior to those granted to the holders of common stock. Though the actual effect of any such issuance on the rights of the holders of common stock will not be known until our board of directors determines the specific rights of the holders of preferred stock, the potential effects of such an issuance include:
| n | diluting the voting power of the holders of common stock; |
| n | reducing the likelihood that holders of common stock will receive dividend payments; |
| n | reducing the likelihood that holders of common stock will receive payments in the event of our liquidation, dissolution, or winding up; and |
| n | delaying, deterring or preventing a change-in-control or other corporate takeover. |
Anti-Takeover Provisions
Certificate of Incorporation and Bylaws
Our amended and restated certificate of incorporation provides for our board of directors to be divided into three classes with staggered three-year terms. Only one class of directors will be elected at each annual meeting of our stockholders, with the other classes continuing for the remainder of their respective three-year terms. Because our stockholders do not have cumulative voting rights, our stockholders holding a majority of the shares of common stock outstanding will be able to elect all of our directors. Our amended and restated certificate of incorporation and amended and restated bylaws provide that all stockholder actions must be effected at a duly called meeting of stockholders and not by a consent in writing, and that only our board of directors, chairman of the board, chief executive officer or president (in the absence of a chief executive officer) may call a special meeting of stockholders.
Our amended and restated certificate of incorporation and amended and restated bylaws require a 66 2/3% stockholder vote for the removal of a director without cause or the rescission, alteration, amendment or repeal of the bylaws by stockholders, and our amended and restated bylaws require an 80% stockholder vote to amend the provisions of our bylaws relating to the election and classification of directors. The combination of the classification of our board of directors, the lack of cumulative voting and the 66 2/3% and 80% stockholder voting requirements will make it more difficult for our existing stockholders to replace our board of directors as well as for another party to obtain control of us by replacing our board of directors. Since our board of directors has the power to retain and discharge our officers, these provisions could also make it more difficult for existing stockholders or another party to effect a change in management. In addition, the authorization of undesignated preferred stock makes it possible for our board of directors to issue preferred stock with voting or other rights or preferences that could impede the success of any attempt to change our control.
These provisions may have the effect of deterring hostile takeovers or delaying changes in our control or management. These provisions are intended to enhance the likelihood of continued stability in the composition of our board of directors and its policies and to discourage certain types of transactions that may involve an actual or threatened acquisition of us. These provisions are designed to reduce our vulnerability to an unsolicited acquisition proposal. The provisions also are intended to discourage certain tactics that may be used in proxy fights. However, such provisions could have the effect of discouraging others from making tender offers for our shares and, as a consequence, they also may inhibit fluctuations in the market price of our stock that could result from actual or rumored takeover attempts.
Section 203 of the Delaware General Corporation Law
We are subject to Section 203 of the Delaware General Corporation Law, which prohibits a Delaware corporation from engaging in any business combination with any interested stockholder for a period of three years after the date that such stockholder became an interested stockholder, with the following exceptions:
| n | before such date, the board of directors of the corporation approved either the business combination or the transaction that resulted in the stockholder becoming an interested stockholder; |
| n | upon completion of the transaction that resulted in the stockholder becoming an interested stockholder, the interested stockholder owned at least 85% of the voting stock of the corporation outstanding at the time the |
115
Table of Contents
| transaction began, excluding for purposes of determining the voting stock outstanding (but not the outstanding voting stock owned by the interested stockholder) those shares owned (i) by persons who are directors and also officers and (ii) employee stock plans in which employee participants do not have the right to determine confidentially whether shares held subject to the plan will be tendered in a tender or exchange offer; or |
| n | on or after such date, the business combination is approved by the board of directors and authorized at an annual or special meeting of the stockholders, and not by written consent, by the affirmative vote of at least 66 2/3% of the outstanding voting stock that is not owned by the interested stockholder. |
In general, Section 203 defines business combination to include the following:
| n | any merger or consolidation involving the corporation and the interested stockholder; |
| n | any sale, transfer, pledge or other disposition of 10% or more of the assets of the corporation involving the interested stockholder; |
| n | subject to certain exceptions, any transaction that results in the issuance or transfer by the corporation of any stock of the corporation to the interested stockholder; |
| n | any transaction involving the corporation that has the effect of increasing the proportionate share of the stock or any class or series of the corporation beneficially owned by the interested stockholder; or |
| n | the receipt by the interested stockholder of the benefit of any loans, advances, guarantees, pledges or other financial benefits by or through the corporation. |
In general, Section 203 defines an “interested stockholder” as an entity or person who, together with the person’s affiliates and associates, beneficially owns, or within three years prior to the time of determination of interested stockholder status did own, 15% or more of the outstanding voting stock of the corporation.
Limitations of Liability and Indemnification Matters
We have adopted provisions in our certificate of incorporation that limit or eliminate the liability of our directors for monetary damages for breach of their fiduciary duties, except for liability that cannot be eliminated under the Delaware General Corporation Law. Accordingly, our directors will not be personally liable for monetary damages for breach of their fiduciary duties as directors, except with respect to the following:
| n | any breach of their duty of loyalty to us or our stockholders; |
| n | acts or omissions not in good faith or that involve intentional misconduct or a knowing violation of law; |
| n | unlawful payments of dividends or unlawful stock repurchases or redemptions as provided in Section 174 of the Delaware General Corporation Law; or |
| n | any transaction from which the director derived an improper personal benefit. |
This limitation of liability does not apply to liabilities arising under the federal securities laws and does not affect the availability of equitable remedies such as injunctive relief or rescission. If Delaware law is amended to authorize the further elimination or limiting of director liability, then the liability of our directors will be eliminated or limited to the fullest extent permitted by Delaware law as so amended.
Our certificate of incorporation and our bylaws also provide that we shall indemnify our directors and executive officers and shall indemnify our other officers and employees and other agents to the fullest extent permitted by law. We believe that indemnification under our bylaws covers at least negligence and gross negligence on the part of indemnified parties. Our bylaws also permit us to secure insurance on behalf of any officer, director, employee or other agent for any liability arising out of his or her actions in this capacity, regardless of whether our bylaws would permit indemnification.
We have entered and intend to continue to enter into separate indemnification agreements with certain of our directors and executive officers that are, in some cases, broader than the specific indemnification provisions provided by Delaware law and our charter documents, and may provide additional procedural protection. These agreements will require us, among other things, to:
| n | indemnify officers and directors against certain liabilities that may arise because of their status as officers and directors; |
116
Table of Contents
| n | advance expenses, as incurred, to officers and directors in connection with a legal proceeding subject to limited exceptions; and |
| n | cover officers and directors under any general or directors’ and officers’ liability insurance policy maintained by us. |
We believe that these provisions and agreements are necessary to attract and retain qualified persons as directors and executive officers. Insofar as indemnification for liabilities arising under the Securities Act may be permitted to directors, officers or persons controlling our company pursuant to the foregoing provisions, the opinion of the Securities and Exchange Commission is that such indemnification is against public policy as expressed in the Securities Act and is therefore unenforceable.
In addition, we maintain standard policies of insurance under which coverage is provided to our directors and officers against loss arising from claims made by reason of breach of duty or other wrongful act, and to us with respect to payments which may be made by us to such directors and officers pursuant to the above indemnification provisions or otherwise as a matter of law. We also make available standard life insurance and accidental death and disability insurance policies to our employees.
Transfer Agent and Registrar
The transfer agent and registrar for our common stock is American Stock Transfer & Trust Company, LLC.
Exchange Listing
Our common stock is listed on The Nasdaq Global Market under the symbol “MBII.”
117
Table of Contents
SHARES ELIGIBLE FOR FUTURE SALE
Future sales of our common stock in the public market, including shares issued upon exercise of outstanding or options, or the availability of such shares for sale in the public market, could adversely affect the trading price of our common stock. Sales of our common stock in the public market after such restrictions lapse, or the perception that those sales may occur, could adversely affect the trading price of our common stock at such time and our ability to raise equity capital in the future.
Upon the completion of this offering, a total of 23,107,001 shares of our common stock will be outstanding, based on (i) 19,707,001 shares of common stock outstanding as of March 31, 2014 and (ii) 3,400,000 shares to be sold by us in this offering. Of these shares, all 4,000,000 shares of common stock sold in this offering by us and the selling stockholder, in addition to all 5,462,500 shares of common stock sold in our initial public offering, will be freely tradable in the public market, unless these shares are held by our affiliates, as that term is defined in Rule 144 under the Securities Act, and as a result generally may be sold in the public market only in compliance with Rule 144 under the Securities Act. The remaining shares of common stock will be deemed restricted securities as that term is defined in Rule 144 under the Securities Act. These restricted securities are eligible for public sale only if they are registered under the Securities Act or if they qualify for an exemption from registration under Rule 144 or Rule 701 under the Securities Act, which are summarized below.
In addition, lock-up agreements expired with respect to 12,688,840 shares of our common stock on January 28, 2014, and such shares generally may be sold in the public market if in compliance with Rule 144 or Rule 701 under the Securities Act. Also, in September 2013, we filed a registration statement on Form S-8 under the Securities Act covering 3,987,910 shares of our common stock for issuance under our equity incentive plans that may be sold in the public market upon issuance and once vested.
Subject to the lock-up agreements described below, and assuming compliance with the provisions of Rules 144 and 701 under the Securities Act, upon completion of this offering our outstanding securities will be available for sale in the public market as follows:
| DATE |
NUMBER OF SHARES |
|||
| On the date of this prospectus |
16,483,234 | |||
| 90 days (subject to extension) after the date of this prospectus |
5,112,321 | |||
| At various times between August 1, 2014 and February 1, 2015 |
1,511,446 | |||
Rule 144
In general, under Rule 144 under the Securities Act, as in effect on the date of this prospectus, a person who is one of our affiliates and has beneficially owned shares of our common stock for at least six months would be entitled to sell within any three-month period a number of shares that does not exceed the greater of:
| n | one percent of the number of shares of common stock then outstanding, which will equal approximately shares immediately after the completion of this offering; or |
| n | the average weekly trading volume of our common stock on The Nasdaq Global Market during the four calendar weeks preceding the filing of a notice on Form 144 with respect to the sale. |
Sales under Rule 144 by our affiliates or persons selling shares on behalf of our affiliates are also subject to a certain manner of sale provisions and notice requirements and to the availability of current public information about us.
In general, under Rule 144 under the Securities Act, as in effect on the date of this prospectus, a person who is not deemed to have been one of our affiliates at any time during the three months preceding a sale, and who has beneficially owned the shares proposed to be sold for at least six months, including the holding period of any prior owner other than an affiliate, is entitled to sell the shares without complying with the manner of sale, volume
118
Table of Contents
limitation or notice provisions of Rule 144, and will be subject only to the public information requirements of Rule 144. If such person has beneficially owned the shares proposed to be sold for at least one year, including the holding period of any prior owner other than our affiliates, then such person is entitled to sell such shares without complying with any of the requirements of Rule 144.
Rule 701
In general, under Rule 701, certain of our current or former employees, directors, officers, consultants or advisors who acquired unregistered shares from us in connection with a compensatory stock or option plan or other written agreement before the effective date of our registration statement on Form S-8 under the Securities Act are eligible to resell such shares in reliance upon Rule 144. If such a person is an affiliate, the sale may be made under Rule 144 without compliance with its one-year minimum holding period, but subject to the other Rule 144 restrictions.
As of March 31, 2014, 86,058 shares of our outstanding common stock had been issued in reliance on Rule 701 as a result of exercises of stock options and stock awards.
Lock-Up Agreements and Market Stand-Off Agreements
We, the selling stockholder, certain of our shareholders and all of our directors and executive officers have agreed that, subject to specified exceptions, without the prior written consent of each of Jefferies LLC and Piper Jaffray & Co. on behalf of the underwriters, during the period from the date of this prospectus and ending on the date 90 days (for the selling stockholder, certain shareholders and directors) or 180 days (for executive officers) after the date of this prospectus (as such period may be extended under certain circumstances), we and they will not, among other things:
| n | offer, pledge, sell, contract to sell, grant any option to purchase, make any short sale or otherwise dispose of any shares of common stock, options or warrants to purchase shares of our common stock or any securities convertible into or exercisable or exchangeable for shares of our common stock; or |
| n | in our case, file any registration statement with the SEC relating to the offering of any shares of common stock or any securities convertible into or exercisable or exchangeable for common stock; or |
| n | in the case of our directors and officers, make any demand for exercise of any rights with respect to the registration of any securities. |
This agreement is subject to certain exceptions. If the selling stockholder does not participate in this offering, this agreement will apply to a portion of its shares. See “Underwriting” below for additional information.
In addition to the restrictions contained in the lock-up agreements described above, we have entered into agreements with certain security holders that contain market stand-off provisions imposing restrictions on the ability of such security holders to offer, sell or transfer approximately 762,815 of our equity securities until or after August 1, 2014.
119
Table of Contents
MATERIAL U.S. FEDERAL TAX CONSEQUENCES TO NON-U.S. HOLDERS
The following is a summary of the material U.S. federal income tax consequences applicable to non-U.S. holders (as defined below) with respect to the ownership and disposition of shares of our common stock, but does not purport to be a complete analysis of all potential tax considerations related thereto. This summary is based on current provisions of the Internal Revenue Code of 1986, as amended (the “Code”), final, temporary or proposed Treasury regulations promulgated thereunder, administrative rulings and judicial opinions, all of which are subject to change, possibly with retroactive effect. We have not sought any ruling from the U.S. Internal Revenue Service (the “IRS”), with respect to the statements made and the conclusions reached in the following summary, and there can be no assurance that the IRS will agree with such statements and conclusions.
This summary is limited to non-U.S. holders who purchase our common stock issued pursuant to this offering and who hold shares of our common stock as capital assets within the meaning of Section 1221 of the Code (generally, for investment purposes).
This discussion does not address all aspects of U.S. federal income taxation that may be important to a particular non-U.S. holder in light of that non-U.S. holder’s individual circumstances, or any aspects of U.S. federal estate or gift tax laws, U.S. alternative minimum tax, the Medicare surtax on net investment income, or tax considerations arising under the laws of any non-U.S., state or local jurisdiction. This discussion also does not address tax considerations applicable to a non-U.S. holder subject to special treatment under the U.S. federal income tax laws, including without limitation:
| n | banks, insurance companies or other financial institutions; |
| n | brokers; |
| n | partnerships or other pass-through entities, or investors therein; |
| n | tax-exempt organizations; |
| n | tax-qualified retirement plans; |
| n | dealers in securities or currencies; |
| n | traders in securities that elect to use a mark-to-market method of accounting for their securities holdings; |
| n | U.S. expatriates and certain former citizens or long-term residents of the United States; |
| n | investors subject to the alternative minimum tax; |
| n | controlled foreign corporations; |
| n | passive foreign investment companies; |
| n | persons that own, or have owned, actually or constructively, more than 5% of our common stock (except to the extent specifically set forth below); and |
| n | persons that will hold common stock as a position in a hedging transaction, straddle, conversion or other integrated transaction for tax purposes. |
Accordingly, we urge prospective investors to consult with their own tax advisors regarding the U.S. federal, state, local and non-U.S. income and other tax considerations of acquiring, holding and disposing of shares of our common stock.
If a partnership (or entity classified as a partnership for U.S. federal income tax purposes) is a beneficial owner of our common stock, the tax treatment of a partner in the partnership (or member in such other entity) will generally depend upon the status of the partner and the activities of the partnership. Any partner in a collaboration holding shares of our common stock should consult its own tax advisors.
PROSPECTIVE INVESTORS ARE URGED TO CONSULT THEIR TAX ADVISORS WITH RESPECT TO THE APPLICATION OF THE U.S. FEDERAL INCOME TAX LAWS TO THEIR PARTICULAR SITUATIONS AS WELL AS ANY TAX CONSEQUENCES OF THE PURCHASE, OWNERSHIP AND DISPOSITION OF OUR COMMON STOCK ARISING UNDER THE U.S. FEDERAL ESTATE OR GIFT TAX RULES, THE MEDICARE SURTAX ON NET INVESTMENT INCOME, THE U.S. ALTERNATIVE MINIMUM TAX RULES, OR UNDER THE LAWS OF ANY STATE, LOCAL, NON-U.S. OR OTHER TAXING JURISDICTION OR UNDER ANY APPLICABLE TAX TREATY.
120
Table of Contents
Definition of Non-U.S. Holder
In general, a “non-U.S. holder” is any beneficial owner of our common stock that is not a U.S. person. A “U.S. person” is any of the following:
| n | an individual citizen or resident of the United States; |
| n | a corporation created or organized in or under the laws of the United States, any state thereof or the District of Columbia (or entity treated as such for U.S. federal income tax purposes); |
| n | an estate, the income of which is includible in gross income for U.S. federal income tax purposes regardless of its source; or |
| n | a trust if (a) a court within the United States is able to exercise primary supervision over the administration of the trust and one or more U.S. persons have the authority to control all substantial decisions of the trust or (b) it has a valid election in effect under applicable Treasury regulations to be treated as a U.S. person. |
Distributions on Our Common Stock
As described in the section titled “Dividend Policy,” we currently do not anticipate paying dividends on our common stock in the foreseeable future. If, however, we make cash or other property distributions on our common stock, other than certain pro rata distributions of common stock, such distributions will constitute dividends for U.S. federal income tax purposes to the extent paid from our current earnings and profits for that taxable year or accumulated earnings and profits, as determined under U.S. federal income tax principles. Amounts not treated as dividends for U.S. federal income tax purposes will constitute a return of capital and will first be applied against and reduce a holder’s adjusted tax basis in our common stock, but not below zero. Any excess will be treated as gain realized on the sale or other disposition of our common stock and will be treated as described under the section titled “—Gain on Sale or Other Taxable Disposition of Our Common Stock” below.
Dividends on our common stock generally will be subject to United States withholding tax at a gross rate of 30%, subject to any exemption or lower rate specified by an applicable income tax treaty, except to the extent that the dividends are “effectively connected dividends,” as described below. We may withhold up to 30% of the gross amount of the entire distribution even if greater than the amount constituting a dividend, as described above, to the extent provided for in the Treasury Regulations. If tax is withheld on the amount of a distribution in excess of the amount constituting a dividend, then a refund of any such excess amounts may be obtained if a claim for refund is timely filed with the IRS.
If a non-U.S. holder holds our common stock in connection with the conduct of a trade or business in the United States, and dividends paid on our common stock are effectively connected with such holder’s U.S. trade or business (and, if required by an applicable income tax treaty, are attributable to a permanent establishment or fixed base maintained by the non-U.S. holder in the United States), the non-U.S. holder will be exempt from the aforementioned U.S. federal withholding tax. To claim the exemption, the non-U.S. holder must furnish to us or our paying agent a properly executed IRS Form W-8ECI (or applicable successor form).
Such effectively connected dividends generally will be subject to U.S. federal income tax on a net income basis at the regular graduated U.S. federal income tax rates in the same manner as if such holder were a resident of the United States. A non-U.S. holder that is a non-U.S. corporation also may be subject to an additional branch profits tax equal to 30% (or such lower rate specified by an applicable income tax treaty) of a portion of its effectively connected earnings and profits for the taxable year. Non-U.S. holders should consult any applicable income tax treaties that may provide for different rules.
A non-U.S. holder that claims a reduction or exemption from withholding because of an applicable income tax treaty generally will be required to satisfy applicable certification (generally, IRS Form W-8BEN or W-8BEN-E, as applicable) and other requirements prior to the distribution date. Non-U.S. holders that do not timely provide us or our paying agent with the required certification may obtain a refund of any excess amounts withheld by timely filing an appropriate claim for refund with the IRS. Non-U.S. holders should consult their tax advisors regarding their entitlement to benefits under a relevant income tax treaty or applicability of other exemptions from withholding. A non-U.S. holder that is eligible for a reduced rate of United States withholding tax pursuant to an income tax treaty may obtain a refund of any excess amounts withheld by filing an appropriate claim for refund with the IRS.
121
Table of Contents
Gain on Sale or Other Taxable Disposition of Our Common Stock
Subject to the discussion below regarding backup withholding and the discussion below regarding FACTA, a non-U.S. holder generally will not be subject to U.S. federal income tax on any gain realized upon the sale or other taxable disposition of our common stock unless:
| n | the gain is effectively connected with a trade or business carried on by the non-U.S. holder in the United States and, if required by an applicable income tax treaty, the gain is attributable to a permanent establishment or fixed base of the non-U.S. holder maintained in the United States; |
| n | the non-U.S. holder is an individual present in the United States for 183 days or more in the taxable year of disposition and certain other requirements are met; or |
| n | we are or have been a U.S. real property holding corporation, or a USRPHC, for U.S. federal income tax purposes at any time within the shorter of the five-year period preceding the disposition and the non-U.S. holder’s holding period for our common stock, unless our common stock continues to be regularly traded on an established securities market and the non-U.S. holder does not actually or constructively hold more than 5% of such regularly traded common stock at any time within the shorter of the five-year period preceding the disposition or the non-U.S. holder’s holding period for our common stock. The determination of whether we are a USRPHC depends on the fair market value of our U.S. real property interests relative to the fair market value of our other trade or business assets and our foreign real property interests. |
We believe we currently are not, and we do not anticipate becoming, a USRPHC for U.S. federal income tax purposes.
Gain described in the first bullet point above will be subject to U.S. federal income tax on a net income basis at regular graduated U.S. federal income tax rates generally in the same manner as if such holder were a resident of the United States. A non-U.S. holder that is a non-U.S. corporation also may be subject to an additional branch profits tax equal to 30% (or such lower rate specified by an applicable income tax treaty) of a portion of its effectively connected earnings and profits for the taxable year. Non-U.S. holders should consult any applicable income tax treaties that may provide for different rules.
Gain described in the second bullet point above will be subject to U.S. federal income tax at a flat 30% rate (or such lower rate specified by an applicable income tax treaty) but may be offset by U.S. source capital losses (even though the individual is not considered a resident of the United States), provided that the non-U.S. holder has timely filed U.S. federal income tax returns with respect to such losses. Non-U.S. holders should consult any applicable income tax treaties that may provide for different rules.
Backup Withholding and Information Reporting
Generally, we must report annually to the IRS and to each non-U.S. holder the amount of dividends paid to, and the tax withheld with respect to, each non-U.S. holder. This information also may be made available under a specific treaty or agreement with the tax authorities in the country in which the non-U.S. holder resides or is established. Backup withholding, currently at a 28% rate, generally will not apply to distributions to a non-U.S. holder of our common stock provided the non-U.S. holder furnishes to us or our paying agent the required certification as to its non-U.S. status such as by providing a valid IRS Form W-8BEN (or W-8BEN-E, as applicable) or IRS Form W-8ECI (or other applicable form), or certain other requirements are met. Notwithstanding the foregoing, backup withholding may apply if either we or our paying agent has actual knowledge, or reason to know, that the holder is a U.S. person that is not an exempt recipient.
Information reporting and, depending on the circumstances, backup withholding will apply to the proceeds of a sale of our common stock within the United States or conducted through certain United States-related financial intermediaries, unless the beneficial owner furnishes to us or our paying agent the required certification as to its non-U.S. status such as by providing a valid IRS Form W-8BEN (or W-8BEN-E, as applicable) or IRS Form W-8ECI (or other applicable form) (and the payor does not have actual knowledge or reason to know that the beneficial owner is a United States person as defined under the Code), or such owner otherwise establishes an exemption.
122
Table of Contents
Backup withholding is not an additional tax. Any amounts withheld under the backup withholding rules may be allowed as a refund or a credit against a non-U.S. holder’s U.S. federal income tax liability, provided the required information is timely furnished to the IRS.
FATCA
Pursuant to the Foreign Account Tax Compliance Act, or “FATCA,” foreign financial institutions (which term includes most foreign hedge funds, private equity funds, mutual funds, securitization vehicles and other investment vehicles) and certain other foreign entities must comply with certain new information reporting rules with respect to their U.S. account holders and investors or confront a new withholding tax on U.S.-source payments made to them (whether received as a beneficial owner or as an intermediary for another party). More specifically, a foreign financial institution or such other foreign entity that does not comply with the FATCA reporting requirements will generally be subject to a new 30% withholding tax with respect to any “withholdable payments.” For this purpose, withholdable payments generally include U.S.-source payments otherwise subject to nonresident withholding tax (e.g., U.S.-source dividends) and also include the entire gross proceeds from the sale of any equity or debt instruments of U.S. issuers, even if the payment would otherwise not be subject to U.S. nonresident withholding tax (e.g., because it is capital gain). Final Treasury regulations and IRS Notice 2013-43 defer this withholding obligation until July 1, 2014 for payments of U.S.-source dividends and until January 1, 2017 for gross proceeds from dispositions of stock in a U.S. corporation.
We will not pay any additional amounts to non-U.S. holders in respect of any amounts withheld pursuant to FATCA. Under certain circumstances, a non-U.S. holder might be eligible for refunds or credits of such taxes. Non-U.S. holders are urged to consult with their own tax advisors regarding the effect, if any, of the FATCA provisions to them based on their particular circumstances.
THE PRECEDING DISCUSSION OF UNITED STATES FEDERAL TAX CONSIDERATIONS IS FOR GENERAL INFORMATION ONLY. IT IS NOT TAX ADVICE. EACH PROSPECTIVE INVESTOR SHOULD CONSULT ITS OWN TAX ADVISOR REGARDING THE PARTICULAR UNITED STATES FEDERAL, STATE AND LOCAL AND NON-U.S. TAX CONSEQUENCES OF PURCHASING, HOLDING AND DISPOSING OF OUR COMMON STOCK, INCLUDING THE CONSEQUENCES OF ANY PROPOSED CHANGE IN APPLICABLE LAWS.
123
Table of Contents
Subject to the terms and conditions set forth in the underwriting agreement, dated , 2014, among us, the selling stockholder and Jefferies LLC and Piper Jaffray & Co., as the representatives of the underwriters named below and the joint book-running managers of this offering, we and the selling stockholder have agreed to sell to the underwriters, and each of the underwriters has agreed, severally and not jointly, to purchase from us and the selling stockholder, the respective number of shares of common stock shown opposite its name below:
| UNDERWRITER |
NUMBER OF SHARES |
|||
| Jefferies LLC |
||||
| Piper Jaffray & Co. |
||||
| Stifel, Nicolaus & Company, Incorporated |
||||
| Robert W. Baird & Co. Incorporated |
||||
| Roth Capital Partners, LLC |
||||
|
|
|
|||
| Total |
4,000,000 | |||
|
|
|
|||
The underwriting agreement provides that the obligations of the several underwriters are subject to certain conditions precedent such as the receipt by the underwriters of officers’ certificates and legal opinions and approval of certain legal matters by their counsel. The underwriting agreement provides that the underwriters will purchase all of the shares of common stock if any of them are purchased. If an underwriter defaults, the underwriting agreement provides that the purchase commitments of the nondefaulting underwriters may be increased or the underwriting agreement may be terminated. We and the selling stockholder have agreed to indemnify the underwriters and certain of their controlling persons against certain liabilities, including liabilities under the Securities Act, and to contribute to payments that the underwriters may be required to make in respect of those liabilities.
The underwriters have advised us that, following the completion of this offering, they currently intend to make a market in the common stock as permitted by applicable laws and regulations. However, the underwriters are not obligated to do so, and the underwriters may discontinue any market-making activities at any time without notice in their sole discretion. Accordingly, no assurance can be given as to the liquidity of the trading market for the common stock, that you will be able to sell any of the common stock held by you at a particular time or that the prices that you receive when you sell will be favorable.
The underwriters are offering the shares of common stock subject to their acceptance of the shares of common stock from us and the selling stockholder and subject to prior sale. The underwriters reserve the right to withdraw, cancel or modify offers to the public and to reject orders in whole or in part.
The selling stockholder may be, and any broker-dealers or agents that participate in the sale of the common stock will be, deemed to be “underwriters” within the meaning of Section 2(11) of the Securities Act. If the selling stockholder is deemed to be an “underwriter” within the meaning of Section 2(11) of the Securities Act, then profits on the sale of the common stock by the selling stockholder and any discounts, commissions or concessions received by any broker-dealers or agents might be deemed to be underwriting discounts and commissions under the Securities Act. If the selling stockholder is deemed to be an “underwriter” within the meaning of Section 2(11) of the Securities Act, the selling stockholder will be subject to the prospectus delivery requirements of the Securities Act. To the extent the selling stockholder may be deemed to be an “underwriter,” the selling stockholder may be subject to statutory liabilities, including, but not limited to, sections 11, 12 and 17 of the Securities Act.
Commission and Expenses
The underwriters have advised us that they propose to offer the shares of common stock to the public at the public offering price set forth on the cover page of this prospectus and to certain dealers, which may include the underwriters, at that price less a concession not in excess of $ per share of common stock. The underwriters
124
Table of Contents
may allow, and certain dealers may reallow, a discount from the concession not in excess of $ per share of common stock to certain brokers and dealers. After the offering, the public offering price, concession and reallowance to dealers may be reduced by the representatives. No such reduction will change the amount of proceeds to be received by us as set forth on the cover page of this prospectus.
The following table shows the public offering price, the underwriting discounts and commissions that we and the selling stockholder are to pay the underwriters and the proceeds, before expenses, to us and the selling stockholder in connection with this offering. Such amounts are shown assuming both no exercise and full exercise of the underwriters’ option to purchase additional shares.
| PER SHARE | TOTAL | |||||||||||||||
| WITHOUT OPTION TO PURCHASE ADDITIONAL SHARES |
WITH OPTION TO PURCHASE ADDITIONAL SHARES |
WITHOUT OPTION TO PURCHASE ADDITIONAL SHARES |
WITH OPTION TO PURCHASE ADDITIONAL SHARES |
|||||||||||||
| Public offering price |
$ | $ | $ | $ | ||||||||||||
| Underwriting discounts and commissions paid by us |
$ | $ | $ | $ | ||||||||||||
| Proceeds to us, before expenses |
$ | $ | $ | $ | ||||||||||||
| Underwriting discounts and commissions paid by the selling stockholder |
$ | $ | $ | $ | ||||||||||||
| Proceeds to the selling stockholder, before expenses |
$ | $ | $ | $ | ||||||||||||
We estimate expenses payable by us in connection with this offering, other than the underwriting discounts and commissions referred to above, will be approximately $850,000. We have agreed to reimburse the underwriters for certain expenses, including legal expenses and expenses relating to the clearance of this offering with the Financial Industry Regulatory Authority, Inc., up to $25,000. We estimate expenses payable by the selling stockholder in connection with this offering, other than the underwriting discounts and commissions referred to above, will be approximately $ .
Listing
Our common stock is listed on The Nasdaq Global Market under the trading symbol “MBII.”
Stamp Taxes
If you purchase shares of common stock offered in this prospectus, you may be required to pay stamp taxes and other charges under the laws and practices of the country of purchase, in addition to the offering price listed on the cover page of this prospectus.
Option to Purchase Additional Shares
We have granted to the underwriters an option, exercisable for 30 days from the date of this prospectus, to purchase, from time to time, in whole or in part, up to an aggregate of 600,000 shares from us at the public offering price set forth on the cover page of this prospectus, less underwriting discounts and commissions. If the underwriters exercise this option, each underwriter will be obligated, subject to specified conditions, to purchase a number of additional shares proportionate to that underwriter’s initial purchase commitment as indicated in the table above. This option may be exercised only if the underwriters sell more shares than the total number set forth on the cover page of this prospectus.
No Sales of Similar Securities
We, the selling stockholder, certain of our shareholders and all of our directors and executive officers have agreed, subject to specified exceptions, not to directly or indirectly:
| n | sell, offer, contract or grant any option to sell (including any short sale), pledge, transfer, establish an open “put equivalent position” within the meaning of Rule 16a-l(h) under the Securities Exchange Act of 1934, as amended, or |
125
Table of Contents
| n | otherwise dispose of any shares of common stock, options or warrants to acquire shares of common stock, or securities exchangeable or exercisable for or convertible into shares of common stock currently or hereafter owned either of record or beneficially, or |
| n | publicly announce an intention to do any of the foregoing for a period of 90 days after the date of this prospectus for our directors, selling stockholder and certain shareholders, and 180 days after the date of this prospectus for our executive officers. |
This restriction terminates after the close of trading of the common stock on and including the 90th day after the date of this prospectus for our directors, selling stockholder and certain shareholders and the 180th day after the date of this prospectus for our executive officers. If the selling stockholder does not participate in this offering, this restriction will apply to a portion of its shares.
The representatives may, in their sole discretion and at any time or from time to time before the termination of the applicable period, release all or any portion of the securities subject to lock-up agreements. Other than as described herein, there are no existing agreements between the underwriters and any of our stockholders who will execute a lock-up agreement, providing consent to the sale of shares prior to the expiration of the lock-up period.
Stabilization
The underwriters have advised us that they, pursuant to Regulation M under the Securities Exchange Act of 1934, as amended, and certain persons participating in the offering may engage in short sale transactions, stabilizing transactions, syndicate covering transactions or the imposition of penalty bids in connection with this offering. These activities may have the effect of stabilizing or maintaining the market price of the common stock at a level above that which might otherwise prevail in the open market. Establishing short sales positions may involve either “covered” short sales or “naked” short sales.
“Covered” short sales are sales made in an amount not greater than the underwriters’ option to purchase additional shares of our common stock in this offering. The underwriters may close out any covered short position by either exercising their option to purchase additional shares of our common stock or purchasing shares of our common stock in the open market. In determining the source of shares to close out the covered short position, the underwriters will consider, among other things, the price of shares available for purchase in the open market as compared to the price at which they may purchase shares through the option to purchase additional shares.
“Naked” short sales are sales in excess of the option to purchase additional shares of our common stock. The underwriters must close out any naked short position by purchasing shares in the open market. A naked short position is more likely to be created if the underwriters are concerned that there may be downward pressure on the price of the shares of our common stock in the open market after pricing that could adversely affect investors who purchase in this offering.
A stabilizing bid is a bid for the purchase of shares of common stock on behalf of the underwriters for the purpose of fixing or maintaining the price of the common stock. A syndicate covering transaction is the bid for or the purchase of shares of common stock on behalf of the underwriters to reduce a short position incurred by the underwriters in connection with the offering. Similar to other purchase transactions, the underwriters’ purchases to cover the syndicate short sales may have the effect of raising or maintaining the market price of our common stock or preventing or retarding a decline in the market price of our common stock. As a result, the price of our common stock may be higher than the price that might otherwise exist in the open market. A penalty bid is an arrangement permitting the underwriters to reclaim the selling concession otherwise accruing to a syndicate member in connection with the offering if the common stock originally sold by such syndicate member are purchased in a syndicate covering transaction and therefore have not been effectively placed by such syndicate member.
None of we, the selling stockholder or any of the underwriters make any representation or prediction as to the direction or magnitude of any effect that the transactions described above may have on the price of our common stock. The underwriters are not obligated to engage in these activities and, if commenced, any of the activities may be discontinued at any time.
126
Table of Contents
Electronic Distribution
A prospectus in electronic format may be made available by e-mail or on the web sites or through online services maintained by one or more of the underwriters or their affiliates. In those cases, prospective investors may view offering terms online and may be allowed to place orders online. The underwriters may agree with us to allocate a specific number of shares of common stock for sale to online brokerage account holders. Any such allocation for online distributions will be made by the underwriters on the same basis as other allocations. Other than the prospectus in electronic format, the information on the underwriters’ web sites and any information contained in any other web site maintained by any of the underwriters is not part of this prospectus, has not been approved and/or endorsed by us or the underwriters and should not be relied upon by investors.
Other Activities and Relationships
The underwriters and certain of their affiliates are full service financial institutions engaged in various activities, which may include securities trading, commercial and investment banking, financial advisory, investment management, investment research, principal investment, hedging, financing and brokerage activities. The underwriters and certain of their affiliates have, from time to time, performed, and may in the future perform, various commercial and investment banking and financial advisory services for us and our affiliates, for which they received or will receive customary fees and expenses.
In the ordinary course of their various business activities, the underwriters and certain of their affiliates may make or hold a broad array of investments and actively trade debt and equity securities (or related derivative securities) and financial instruments (including bank loans) for their own accounts and for the accounts of their customers, and such investment and securities activities may involve our securities and/or instruments issued by us and our affiliates. If the underwriters or their respective affiliates have a lending relationship with us, they routinely hedge their credit exposure to us consistent with their customary risk management policies. The underwriters and their respective affiliates may hedge such exposure by entering into transactions which consist of either the purchase of credit default swaps or the creation of short positions in our securities or the securities of our affiliates, including potentially the common stock offered hereby. Any such short positions could adversely affect future trading prices of the common stock offered hereby. The underwriters and certain of their respective affiliates may also communicate independent investment recommendations, market color or trading ideas and/or publish or express independent research views in respect of such securities or instruments and may at any time hold, or recommend to clients that they acquire, long and/or short positions in such securities and instruments.
Shaugn Stanley, one of our directors, currently serves as Senior Managing Director at Stifel Financial Corp., an affiliate of one of the underwriters.
Disclaimers About Non-U.S. Jurisdictions
European Economic Area
In relation to each member state of the European Economic Area which has implemented the Prospectus Directive (each, a “Relevant Member State”), with effect from and including the date on which the Prospectus Directive is implemented in that Relevant Member State (the “Relevant Implementation Date”), no offer of any securities which are the subject of the offering contemplated by this prospectus has been or will be made to the public in that Relevant Member State other than any offer where a prospectus has been or will be published in relation to such securities that has been approved by the competent authority in that Relevant Member State or, where appropriate, approved in another Relevant Member State and notified to the relevant competent authority in that Relevant Member State in accordance with the Prospectus Directive, except that with effect from and including the Relevant Implementation Date, an offer of such securities may be made to the public in that Relevant Member State:
| (a) | to any legal entity which is a “qualified investor” as defined in the Prospectus Directive; |
| (b) | to fewer than 100 or, if the Relevant Member State has implemented the relevant provision of the 2010 PD Amending Directive, 150, natural or legal persons (other than qualified investors as defined in the Prospectus Directive), as permitted under the Prospectus Directive, subject to obtaining the prior consent of the representatives of the underwriters for any such offer; or |
| (c) | in any other circumstances falling within Article 3(2) of the Prospectus Directive; |
127
Table of Contents
provided that no such offer of securities shall require us or any of the underwriters to publish a prospectus pursuant to Article 3 of the Prospectus Directive or supplement a prospectus pursuant to Article 16 of the Prospectus Directive.
For the purposes of this provision, the expression an “offer to the public” in relation to any securities in any Relevant Member State means the communication in any form and by any means of sufficient information on the terms of the offer and the securities to be offered so as to enable an investor to decide to purchase or subscribe the securities, as the same may be varied in that Relevant Member State by any measure implementing the Prospectus Directive in that Relevant Member State and the expression “Prospectus Directive” means Directive 2003/71/EC (and amendments thereto, including the 2010 PD Amending Directive, to the extent implemented in the Relevant Member State), and includes any relevant implementing measure in the Relevant Member State and the expression “2010 PD Amending Directive” means Directive 2010/73/EU.
United Kingdom
This prospectus is only being distributed to, and is only directed at, persons in the United Kingdom that are qualified investors within the meaning of Article 2(1)(e) of the Prospectus Directive that are also (i) investment professionals falling within Article 19(5) of the Financial Services and Markets Act 2000 (Financial Promotion) Order 2005, as amended (the “Order”) and/or (ii) high net worth entities falling within Article 49(2)(a) to (d) of the Order and other persons to whom it may lawfully be communicated (each such person being referred to as a “relevant person”).
This prospectus and its contents are confidential and should not be distributed, published or reproduced (in whole or in part) or disclosed by recipients to any other persons in the United Kingdom. Any person in the United Kingdom that is not a relevant person should not act or rely on this document or any of its contents.
Hong Kong
No securities have been offered or sold, and no securities may be offered or sold, in Hong Kong, by means of any document, other than to persons whose ordinary business is to buy or sell shares or debentures, whether as principal or agent; or to “professional investors” as defined in the Securities and Futures Ordinance (Cap. 571) of Hong Kong and any rules made under that Ordinance; or in other circumstances which do not result in the document being a “prospectus” as defined in the Companies Ordinance (Cap. 32) of Hong Kong or which do not constitute an offer to the public within the meaning of the Companies Ordinance (Cap.32) of Hong Kong. No document, invitation or advertisement relating to the securities has been issued or may be issued or may be in the possession of any person for the purpose of issue (in each case whether in Hong Kong or elsewhere), which is directed at, or the contents of which are likely to be accessed or read by, the public of Hong Kong (except if permitted under the securities laws of Hong Kong) other than with respect to securities which are or are intended to be disposed of only to persons outside Hong Kong or only to “professional investors” as defined in the Securities and Futures Ordinance (Cap. 571) of Hong Kong and any rules made under that Ordinance.
This prospectus has not been registered with the Registrar of Companies in Hong Kong. Accordingly, this prospectus may not be issued, circulated or distributed in Hong Kong, and the securities may not be offered for subscription to members of the public in Hong Kong. Each person acquiring the securities will be required, and is deemed by the acquisition of the securities, to confirm that he is aware of the restriction on offers of the securities described in this prospectus and the relevant offering documents and that he is not acquiring, and has not been offered any securities in circumstances that contravene any such restrictions.
Singapore
This prospectus has not been and will not be lodged or registered with the Monetary Authority of Singapore. Accordingly, this prospectus and any other document or material in connection with the offer or sale, or the invitation for subscription or purchase of the securities may not be issued, circulated or distributed, nor may the securities be offered or sold, or be made the subject of an invitation for subscription or purchase, whether directly or indirectly, to the public or any member of the public in Singapore other than (i) to an institutional investor under
128
Table of Contents
Section 274 of the Securities and Futures Act, Chapter 289 of Singapore, or SFA, (ii) to a relevant person as defined under Section 275(2), or any person pursuant to Section 275(1A) of the SFA, and in accordance with the conditions, specified in Section 275 of the SFA, or (iii) otherwise pursuant to, and in accordance with the conditions of any other applicable provision of the SFA.
Where the securities are subscribed or purchased under Section 275 of the SFA by a relevant person which is:
| (a) | a corporation (which is not an accredited investor as defined under Section 4A of the SFA) the sole business of which is to hold investments and the entire share capital of which is owned by one or more individuals, each of whom is an accredited investor; or |
| (b) | a trust (where the trustee is not an accredited investor) whose sole purpose is to hold investments and each beneficiary is an accredited investor, |
shares, debentures and units of shares and debentures of that corporation or the beneficiaries’ rights and interest in that trust shall not be transferable for six months after that corporation or that trust has acquired the Offer Shares under Section 275 of the SFA except:
| (a) | to an institutional investor under Section 274 of the SFA or to a relevant person defined in Section 275(2) of the SFA, or to any person pursuant to an offer that is made on terms that such shares, debentures and units of shares and debentures of that corporation or such rights and interest in that trust are acquired at a consideration of not less than $200,000 (or its equivalent in a foreign currency) for each transaction, whether such amount is to be paid for in cash or by exchange of securities or other assets, and further for corporations, in accordance with the conditions, specified in Section 275 of the SFA; |
| (b) | where no consideration is given for the transfer; or |
| (c) | where the transfer is by operation of law. |
Japan
The offering has not been and will not be registered under the Financial Instruments and Exchange Law of Japan (Law No. 25 of 1948 of Japan, as amended), or FIEL, and the underwriters will not offer or sell any securities, directly or indirectly, in Japan or to, or for the benefit of, any resident of Japan (which term as used herein means, unless otherwise provided herein, any person resident in Japan, including any corporation or other entity organized under the laws of Japan), or to others for re-offering or resale, directly or indirectly, in Japan or to a resident of Japan, except pursuant to an exemption from the registration requirements of, and otherwise in compliance with, the FIEL and any other applicable laws, regulations and ministerial guidelines of Japan.
129
Table of Contents
The validity of our common stock offered hereby will be passed upon for us by Morrison & Foerster LLP, San Francisco, California. Certain legal matters in connection with this offering will be passed upon for the underwriters by Jones Day, New York, New York. A partner of Morrison & Foerster LLP, our counsel, beneficially owns less than 1% of our outstanding shares of common stock.
Ernst & Young LLP, independent registered public accounting firm, has audited our consolidated financial statements at December 31, 2013 and 2012, and for each of the three years in the period ended December 31, 2013, as set forth in their report. We have included our consolidated financial statements in the prospectus and elsewhere in the registration statement in reliance on Ernst & Young LLP’s report, given on their authority as experts in accounting and auditing.
WHERE YOU CAN FIND ADDITIONAL INFORMATION
We have filed with the SEC a registration statement on Form S-1 under the Securities Act with respect to this offering of our common stock. This prospectus, which constitutes a part of the registration statement, does not contain all of the information set forth in the registration statement, some items of which are contained in exhibits to the registration statement as permitted by the rules and regulations of the SEC. For further information with respect to us and our common stock, we refer you to the registration statement, including the exhibits and the consolidated financial statements and notes filed as a part of the registration statement. Statements contained in this prospectus concerning the contents of any contract or any other document are not necessarily complete. If a contract or document has been filed as an exhibit to the registration statement, please see the copy of the contract or document that has been filed. Each statement is this prospectus relating to a contract or document filed as an exhibit is qualified in all respects by the filed exhibit. The exhibits to the registration statement should be referenced for the complete contents of these contracts and documents. You may obtain copies of this information by mail from the Public Reference Section of the SEC, 100 F Street, N.E., Room 1580, Washington, D.C. 20549, at prescribed rates. You may obtain information on the operation of the public reference rooms by calling the SEC at 1-800-SEC-0330. The SEC also maintains an Internet website that contains reports, proxy statements and other information about issuers, like us, that file electronically with the SEC. The address of that website is www.sec.gov.
We are subject to the information and reporting requirements of the Exchange Act and, in accordance with this law, are required to file periodic reports, proxy statements and other information with the SEC. These periodic reports, proxy statements and other information are available for inspection and copying at the SEC’s public reference facilities and the website of the SEC referred to above. We also maintain a website at http://www.marronebioinnovations.com. You may access our annual reports on Form 10-K, quarterly reports on Form 10-Q, current reports on Form 8-K and amendments to those reports filed or furnished pursuant to Section 13(a) or 15(d) of the Exchange Act with the SEC free of charge at our website as soon as reasonably practicable after such material is electronically filed with, or furnished to, the SEC. The information contained in, or that can be accessed through, our website is not part of this prospectus.
130
Table of Contents
INDEX TO CONSOLIDATED FINANCIAL STATEMENTS
| F-2 | ||||
| Audited Consolidated Financial Statements |
||||
| Consolidated Balance Sheets as of December 31, 2013 and 2012 |
F-3 | |||
| Consolidated Statements of Operations for the years ended December 31, 2013, 2012 and 2011 |
F-4 | |||
| Consolidated Statements of Comprehensive Loss for the years ended December 31, 2013, 2012 and 2011 |
F-5 | |||
| F-6 | ||||
| Consolidated Statements of Cash Flows for the years ended December 31, 2013, 2012 and 2011 |
F-7 | |||
| F-8 | ||||
| Unaudited Condensed Consolidated Financial Statements |
||||
| Condensed Consolidated Balance Sheets as of March 31, 2014 and December 31, 2013 |
F-45 | |||
| Condensed Consolidated Statements of Operations for the Three Months Ended March 31, 2014 and 2013 |
F-46 | |||
| F-47 | ||||
| Condensed Consolidated Statements of Cash Flows for the Three Months Ended March 31, 2014 and 2013 |
F-48 | |||
| F-49 |
F-1
Table of Contents
REPORT OF INDEPENDENT REGISTERED PUBLIC ACCOUNTING FIRM
The Board of Directors and Shareholders of
Marrone Bio Innovations, Inc.
We have audited the accompanying consolidated balance sheets of Marrone Bio Innovations, Inc. (“the Company”) as of December 31, 2013 and 2012, and the related consolidated statements of operations, comprehensive loss, convertible preferred stock and stockholders’ equity (deficit), and cash flows for each of the three years in the period ended December 31, 2013. These financial statements are the responsibility of the Company’s management. Our responsibility is to express an opinion on these financial statements based on our audits.
We conducted our audits in accordance with the standards of the Public Company Accounting Oversight Board (United States). Those standards require that we plan and perform the audit to obtain reasonable assurance about whether the financial statements are free of material misstatement. We were not engaged to perform an audit of the Company’s internal control over financial reporting. Our audits included consideration of internal control over financial reporting as a basis for designing audit procedures that are appropriate in the circumstances, but not for the purpose of expressing an opinion on the effectiveness of the Company’s internal control over financial reporting. Accordingly, we express no such opinion. An audit also includes examining, on a test basis, evidence supporting the amounts and disclosures in the financial statements, assessing the accounting principles used and significant estimates made by management, and evaluating the overall financial statement presentation. We believe that our audits provide a reasonable basis for our opinion.
In our opinion, the financial statements referred to above present fairly, in all material respects, the consolidated financial position of Marrone Bio Innovations, Inc. at December 31, 2013 and 2012, and the consolidated results of its operations and its cash flows for each of the three years in the period ended December 31, 2013, in conformity with U.S. generally accepted accounting principles.
/s/ Ernst & Young LLP
Sacramento, California
March 25, 2014
F-2
Table of Contents
Consolidated Balance Sheets
(In Thousands, Except Par Value)
| DECEMBER 31 | ||||||||
| 2013 | 2012 | |||||||
| Assets |
||||||||
| Current assets: |
||||||||
| Cash and cash equivalents |
$ | 24,455 | $ | 10,006 | ||||
| Restricted cash |
— | 9,139 | ||||||
| Short-term investments |
13,677 | — | ||||||
| Accounts receivable |
6,215 | 2,834 | ||||||
| Accounts receivable from related parties |
903 | 136 | ||||||
| Inventories, net |
11,666 | 4,872 | ||||||
| Prepaid expenses and other current assets |
1,737 | 478 | ||||||
|
|
|
|
|
|||||
| Total current assets |
58,653 | 27,465 | ||||||
| Property, plant and equipment, net |
9,420 | 3,528 | ||||||
| Other assets |
806 | 2,785 | ||||||
|
|
|
|
|
|||||
| Total assets |
68,879 | $ | 33,778 | |||||
|
|
|
|
|
|||||
| Liabilities, convertible preferred stock and stockholders’ equity (deficit) |
||||||||
| Current liabilities: |
||||||||
| Accounts payable |
$ | 4,460 | $ | 2,104 | ||||
| Accrued liabilities |
4,380 | 3,023 | ||||||
| Deferred revenue, current portion |
1,209 | 193 | ||||||
| Deferred revenue from related parties, current portion |
131 | 131 | ||||||
| Capital lease obligations, current portion |
1,401 | 207 | ||||||
| Debt, current portion |
157 | 8,572 | ||||||
| Preferred stock warrant liability |
— | 1,884 | ||||||
| Common stock warrant liability |
— | 301 | ||||||
| Convertible notes payable, current portion |
— | 22,518 | ||||||
|
|
|
|
|
|||||
| Total current liabilities |
11,738 | 38,933 | ||||||
| Deferred revenue, less current portion |
744 | 937 | ||||||
| Deferred revenue from related parties, less current portion |
628 | 759 | ||||||
| Capital lease obligations, less current portion |
1,134 | 195 | ||||||
| Debt, less current portion |
12,280 | 7,766 | ||||||
| Convertible notes payable, less current portion |
— | 19,342 | ||||||
| Other liabilities |
571 | 481 | ||||||
|
|
|
|
|
|||||
| Total liabilities |
27,095 | 68,413 | ||||||
| Commitments and contingencies (Note 15) |
||||||||
| Preferred stock: $0.00001 par value; 20,000 shares authorized, no shares issued or outstanding at December 31, 2013; no shares authorized, issued or outstanding at December 31, 2012 |
— | — | ||||||
| Convertible preferred stock—Series A: $0.00001 par value; no shares authorized, issued or outstanding at December 31, 2013; 1,489 shares authorized and 1,484 shares issued and outstanding at December 31, 2012 |
— | 3,747 | ||||||
| Convertible preferred stock—Series B: $0.00001 par value; no shares authorized, issued or outstanding at December 31, 2013; 2,252 shares authorized and 2,242 shares issued and outstanding at December 31, 2012 |
— | 10,758 | ||||||
| Convertible preferred stock—Series C: $0.00001 par value; no shares authorized, issued or outstanding at December 31, 2013; 5,082 shares authorized and 4,778 shares issued and outstanding at December 31, 2012 |
— | 25,107 | ||||||
| Stockholders’ equity (deficit): |
||||||||
| Common stock: $0.00001 par value; 250,000 shares authorized and 19,323 shares issued and outstanding at December 31, 2013; 12,936 shares authorized and 1,267 shares issued and outstanding at December 31, 2012 |
— | — | ||||||
| Additional paid in capital |
147,220 | 1,322 | ||||||
| Accumulated deficit |
(105,436 | ) | (75,569 | ) | ||||
|
|
|
|
|
|||||
| Total stockholders’ equity (deficit) |
41,784 | (74,247 | ) | |||||
|
|
|
|
|
|||||
| Total liabilities, convertible preferred stock and stockholders’ equity (deficit) |
$ | 68,879 | $ | 33,778 | ||||
|
|
|
|
|
|||||
See accompanying notes.
F-3
Table of Contents
Consolidated Statements of Operations
(In Thousands, Except Per Share Data)
| YEAR ENDED DECEMBER 31 | ||||||||||||
| 2013 | 2012 | 2011 | ||||||||||
| Revenues: |
||||||||||||
| Product |
$ | 12,657 | $ | 6,777 | $ | 5,044 | ||||||
| License |
193 | 179 | 57 | |||||||||
| Related party |
1,693 | 184 | 150 | |||||||||
|
|
|
|
|
|
|
|||||||
| Total revenues |
14,543 | 7,140 | 5,251 | |||||||||
| Cost of product revenues, including cost of product revenues to related parties of $984, $126 and $50 for the years ended December 31, 2013, 2012 and 2011, respectively |
10,736 | 4,333 | 2,172 | |||||||||
|
|
|
|
|
|
|
|||||||
| Gross profit |
3,807 | 2,807 | 3,079 | |||||||||
| Operating expenses: |
||||||||||||
| Research, development and patent |
17,814 | 12,741 | 9,410 | |||||||||
| Non-cash charge associated with a convertible note |
— | 3,610 | — | |||||||||
| Selling, general and administrative |
15,018 | 10,294 | 6,793 | |||||||||
|
|
|
|
|
|
|
|||||||
| Total operating expenses |
32,832 | 26,645 | 16,203 | |||||||||
|
|
|
|
|
|
|
|||||||
| Loss from operations |
(29,025 | ) | (23,838 | ) | (13,124 | ) | ||||||
| Other income (expense): |
||||||||||||
| Interest income |
49 | 16 | 22 | |||||||||
| Interest expense |
(5,997 | ) | (2,466 | ) | (88 | ) | ||||||
| Change in estimated fair value of financial instruments |
6,717 | (12,461 | ) | 1 | ||||||||
| Gain on extinguishment of debt |
49 | — | — | |||||||||
| Other (expense) income, net |
(282 | ) | (45 | ) | 9 | |||||||
|
|
|
|
|
|
|
|||||||
| Total other income (expense), net |
536 | (14,956 | ) | (56 | ) | |||||||
|
|
|
|
|
|
|
|||||||
| Loss before income taxes |
(28,489 | ) | (38,794 | ) | (13,180 | ) | ||||||
| Income taxes |
— | — | — | |||||||||
|
|
|
|
|
|
|
|||||||
| Net loss |
(28,489 | ) | (38,794 | ) | (13,180 | ) | ||||||
| Deemed dividend on convertible notes |
(1,378 | ) | (2,039 | ) | — | |||||||
|
|
|
|
|
|
|
|||||||
| Net loss attributable to common stockholders |
$ | (29,867 | ) | $ | (40,833 | ) | $ | (13,180 | ) | |||
|
|
|
|
|
|
|
|||||||
| Net loss per common share: |
||||||||||||
| Basic |
$ | (3.42 | ) | $ | (32.48 | ) | $ | (10.64 | ) | |||
|
|
|
|
|
|
|
|||||||
| Diluted |
$ | (3.94 | ) | $ | (32.48 | ) | $ | (10.64 | ) | |||
|
|
|
|
|
|
|
|||||||
| Weighted-average shares outstanding used in computing net loss per common share: |
||||||||||||
| Basic |
8,731 | 1,257 | 1,239 | |||||||||
|
|
|
|
|
|
|
|||||||
| Diluted |
8,911 | 1,257 | 1,239 | |||||||||
|
|
|
|
|
|
|
|||||||
See accompanying notes.
F-4
Table of Contents
Consolidated Statements of Comprehensive Loss
(In Thousands)
| YEAR ENDED DECEMBER 31 | ||||||||||||
| 2013 | 2012 | 2011 | ||||||||||
| Net loss |
$ | (28,489 | ) | $ | (38,794 | ) | $ | (13,180 | ) | |||
| Other comprehensive loss |
— | — | — | |||||||||
|
|
|
|
|
|
|
|||||||
| Comprehensive loss |
$ | (28,489 | ) | $ | (38,794 | ) | $ | (13,180 | ) | |||
|
|
|
|
|
|
|
|||||||
See accompanying notes.
F-5
Table of Contents
Consolidated Statements of Convertible Preferred Stock and Stockholders’ Equity (Deficit)
(In Thousands)
| CONVERTIBLE PREFERRED STOCK | ADDITIONAL PAID IN CAPITAL |
ACCUMULATED DEFICIT |
TOTAL STOCKHOLDERS’ EQUITY (DEFICIT) |
|||||||||||||||||||||||||||||||||||||||||||||||||
| SERIES A | SERIES B | SERIES C | TOTAL | COMMON STOCK | ||||||||||||||||||||||||||||||||||||||||||||||||
| SHARES | AMOUNT | SHARES | AMOUNT | SHARES | AMOUNT | SHARES | AMOUNT | SHARES | AMOUNT | |||||||||||||||||||||||||||||||||||||||||||
| Balance at December 31, 2010 |
1,484 | $ | 3,747 | 2,242 | $ | 10,758 | 2,286 | $ | 11,947 | 6,012 | $ | 26,452 | 1,234 | $ | — | $ | 352 | $ | (21,556 | ) | $ | (21,204 | ) | |||||||||||||||||||||||||||||
| Net loss |
— | — | — | — | — | — | — | — | — | — | — | (13,180 | ) | (13,180 | ) | |||||||||||||||||||||||||||||||||||||
| Exercise of stock options |
— | — | — | — | — | — | — | — | 13 | — | 13 | — | 13 | |||||||||||||||||||||||||||||||||||||||
| Share-based compensation |
— | — | — | — | — | — | — | — | — | — | 271 | — | 271 | |||||||||||||||||||||||||||||||||||||||
| Issuance of Series C convertible preferred stock, net of issuance costs of $91 |
— | — | — | — | 2,492 | 13,160 | 2,492 | 13,160 | — | — | — | — | — | |||||||||||||||||||||||||||||||||||||||
|
|
|
|
|
|
|
|
|
|
|
|
|
|
|
|
|
|
|
|
|
|
|
|
|
|
|
|||||||||||||||||||||||||||
| Balance at December 31, 2011 |
1,484 | 3,747 | 2,242 | 10,758 | 4,778 | 25,107 | 8,504 | 39,612 | 1,247 | — | 636 | (34,736 | ) | (34,100 | ) | |||||||||||||||||||||||||||||||||||||
| Net loss |
— | — | — | — | — | — | — | — | — | — | — | (38,794 | ) | (38,794 | ) | |||||||||||||||||||||||||||||||||||||
| Exercise of stock options |
— | — | — | — | — | — | — | — | 20 | — | 24 | — | 24 | |||||||||||||||||||||||||||||||||||||||
| Share-based compensation |
— | — | — | — | — | — | — | — | — | — | 662 | — | 662 | |||||||||||||||||||||||||||||||||||||||
| Deemed dividend, convertible notes |
— | — | — | — | — | — | — | — | — | — | — | (2,039 | ) | (2,039 | ) | |||||||||||||||||||||||||||||||||||||
|
|
|
|
|
|
|
|
|
|
|
|
|
|
|
|
|
|
|
|
|
|
|
|
|
|
|
|||||||||||||||||||||||||||
| Balance at December 31, 2012 |
1,484 | 3,747 | 2,242 | 10,758 | 4,778 | 25,107 | 8,504 | 39,612 | 1,267 | — | 1,322 | (75,569 | ) | (74,247 | ) | |||||||||||||||||||||||||||||||||||||
| Net loss |
— | — | — | — | — | — | — | — | — | — | — | (28,489 | ) | (28,489 | ) | |||||||||||||||||||||||||||||||||||||
| Exercise of stock options |
— | — | — | — | — | — | — | — | 217 | — | 250 | — | 250 | |||||||||||||||||||||||||||||||||||||||
| Share-based compensation |
— | — | — | — | — | — | — | — | — | — | 2,300 | — | 2,300 | |||||||||||||||||||||||||||||||||||||||
| Deemed dividend, convertible notes |
— | — | — | — | — | — | — | — | — | — | — | (1,378 | ) | (1,378 | ) | |||||||||||||||||||||||||||||||||||||
| Cash exercise of preferred stock warrants |
— | — | 10 | 47 | — | — | 10 | 47 | — | — | — | — | — | |||||||||||||||||||||||||||||||||||||||
| Net exercise of preferred stock warrants |
— | — | — | — | — | — | — | — | 71 | — | — | — | — | |||||||||||||||||||||||||||||||||||||||
| Conversion of preferred stock into common stock |
(1,484 | ) | (3,747 | ) | (2,252 | ) | (10,805 | ) | (4,778 | ) | (25,107 | ) | (8,514 | ) | (39,659 | ) | 8,514 | — | 39,659 | — | 39,659 | |||||||||||||||||||||||||||||||
| Convertible notes converted into common stock |
— | — | — | — | — | — | — | — | 3,741 | — | 44,890 | — | 44,890 | |||||||||||||||||||||||||||||||||||||||
| Cash exercise of common stock warrants |
— | — | — | — | — | — | — | — | 3 | — | 25 | — | 25 | |||||||||||||||||||||||||||||||||||||||
| Net exercise of common stock warrants |
— | — | — | — | — | — | — | — | 47 | — | — | — | — | |||||||||||||||||||||||||||||||||||||||
| Reclassification of warrants from liability to equity |
— | — | — | — | — | — | — | — | — | — | 2,669 | — | 2,669 | |||||||||||||||||||||||||||||||||||||||
| Issuance of common stock upon initial public offering, net of offering costs and underwriter commission |
— | — | — | — | — | — | — | — | 5,463 | — | 56,105 | — | 56,105 | |||||||||||||||||||||||||||||||||||||||
|
|
|
|
|
|
|
|
|
|
|
|
|
|
|
|
|
|
|
|
|
|
|
|
|
|
|
|||||||||||||||||||||||||||
| Balance at December 31, 2013 |
— | $ | — | — | $ | — | — | $ | — | — | $ | — | 19,323 | $ | — | $ | 147,220 | $ | (105,436 | ) | $ | 41,784 | ||||||||||||||||||||||||||||||
|
|
|
|
|
|
|
|
|
|
|
|
|
|
|
|
|
|
|
|
|
|
|
|
|
|
|
|||||||||||||||||||||||||||
See accompanying notes.
F-6
Table of Contents
Consolidated Statements of Cash Flows
(In Thousands)
| YEAR ENDED DECEMBER 31 | ||||||||||||
| 2013 | 2012 | 2011 | ||||||||||
| Cash flows from operating activities |
||||||||||||
| Net loss |
$ | (28,489 | ) | $ | (38,794 | ) | $ | (13,180 | ) | |||
| Adjustments to reconcile net loss to net cash used in operating activities: |
||||||||||||
| Depreciation and amortization |
976 | 613 | 499 | |||||||||
| Loss on disposal of equipment |
231 | — | — | |||||||||
| Share-based compensation |
2,300 | 662 | 271 | |||||||||
| Non-cash interest expense |
4,315 | 1,224 | 4 | |||||||||
| Reduction of revenue associated with a convertible note (Note 9) |
— | 245 | — | |||||||||
| Non-cash charge associated with a convertible note (Note 9) |
— | 3,610 | — | |||||||||
| Change in estimated fair value of financial instruments |
(6,717 | ) | 12,461 | (1 | ) | |||||||
| Gain on equipment sale leaseback |
— | — | (6 | ) | ||||||||
| Gain on extinguishment of debt |
(49 | ) | — | — | ||||||||
| Amortization of investment securities premiums/discounts, net |
18 | — | — | |||||||||
| Net changes in operating assets and liabilities: |
||||||||||||
| Accounts receivable |
(3,381 | ) | (2,464 | ) | 484 | |||||||
| Accounts receivable from related parties |
(767 | ) | (59 | ) | (54 | ) | ||||||
| Inventories |
(6,794 | ) | (1,625 | ) | (1,703 | ) | ||||||
| Prepaid expenses and other assets |
991 | (2,097 | ) | (663 | ) | |||||||
| Accounts payable |
1,682 | 1,174 | 438 | |||||||||
| Accrued and other liabilities |
987 | 1,381 | 710 | |||||||||
| Deferred revenue |
823 | 354 | 776 | |||||||||
| Deferred revenue from related parties |
(131 | ) | 890 | — | ||||||||
|
|
|
|
|
|
|
|||||||
| Net cash used in operating activities |
(34,005 | ) | (22,425 | ) | (12,425 | ) | ||||||
| Cash flows from investing activities |
||||||||||||
| Purchases of property, plant and equipment |
(4,025 | ) | (2,757 | ) | (423 | ) | ||||||
| Proceeds from sale of equipment |
41 | — | — | |||||||||
| Purchase of short-term investments |
(17,477 | ) | — | (2,000 | ) | |||||||
| Maturities of short-term investments |
3,782 | 2,000 | — | |||||||||
|
|
|
|
|
|
|
|||||||
| Net cash used in investing activities |
(17,679 | ) | (757 | ) | (2,423 | ) | ||||||
| Cash flows from financing activities |
||||||||||||
| Proceeds from initial public offering, net of offering costs and underwriter commissions |
56,105 | — | — | |||||||||
| Proceeds from issuance of convertible preferred stock, net of issuance costs |
— | — | 13,160 | |||||||||
| Proceeds from issuance of convertible notes payable |
6,529 | 24,076 | — | |||||||||
| Proceeds from issuance of debt, net of financing costs |
3,700 | 17,375 | — | |||||||||
| Proceeds from line of credit |
— | 500 | 500 | |||||||||
| Repayment of line of credit |
— | (500 | ) | (500 | ) | |||||||
| Repayment of debt |
(9,433 | ) | (1,154 | ) | (206 | ) | ||||||
| Repayment of capital leases |
(229 | ) | (209 | ) | (191 | ) | ||||||
| Proceeds from secured borrowing |
2,880 | — | — | |||||||||
| Reductions in secured borrowing |
(2,880 | ) | — | — | ||||||||
| Change in restricted cash |
9,139 | (9,139 | ) | — | ||||||||
| Proceeds from exercise of stock options |
250 | 24 | 13 | |||||||||
| Proceeds from exercise of preferred stock warrants |
47 | — | — | |||||||||
| Proceeds from exercise of common stock warrants |
25 | — | — | |||||||||
|
|
|
|
|
|
|
|||||||
| Net cash provided by financing activities |
66,133 | 30,973 | 12,776 | |||||||||
| Net increase (decrease) in cash and cash equivalents |
14,449 | 7,791 | (2,072 | ) | ||||||||
| Cash and cash equivalents, beginning of year |
10,006 | 2,215 | 4,287 | |||||||||
|
|
|
|
|
|
|
|||||||
| Cash and cash equivalents, end of year |
$ | 24,455 | $ | 10,006 | $ | 2,215 | ||||||
|
|
|
|
|
|
|
|||||||
| Supplemental disclosure of cash flow information |
||||||||||||
| Cash paid for interest, net of capitalized interest of $695, $106 and $0 for the years ended December 31, 2013, 2012 and 2011, respectively |
$ | 1,682 | $ | 1,136 | $ | 84 | ||||||
|
|
|
|
|
|
|
|||||||
| Supplemental disclosure of non-cash investing and financing activities |
||||||||||||
| Property, plant and equipment included in accounts payable and accrued liabilities |
$ | 1,009 | $ | — | $ | — | ||||||
|
|
|
|
|
|
|
|||||||
| Equipment acquired under capital leases |
$ | 2,106 | $ | 317 | $ | 93 | ||||||
|
|
|
|
|
|
|
|||||||
| Interest added to the principal of convertible notes |
$ | 1,623 | $ | 837 | $ | — | ||||||
|
|
|
|
|
|
|
|||||||
| Reclassification of warrants from liabilities to equity |
$ | 2,669 | $ | — | $ | — | ||||||
|
|
|
|
|
|
|
|||||||
| Conversion of convertible notes to common stock |
$ | 44,890 | $ | — | $ | — | ||||||
|
|
|
|
|
|
|
|||||||
| Conversion of preferred stock to common stock |
$ | 39,659 | $ | — | $ | — | ||||||
|
|
|
|
|
|
|
|||||||
See accompanying notes.
F-7
Table of Contents
Notes to Consolidated Financial Statements
December 31, 2013
1. Summary of Business
Marrone Bio Innovations, Inc. (Company), formerly Marrone Organic Innovations, Inc., was incorporated under the laws of the State of Delaware on June 15, 2006, and is located in Davis, California. In July 2012, the Company formed a wholly-owned subsidiary, Marrone Michigan Manufacturing LLC (MMM LLC), which holds the assets of a manufacturing plant the Company purchased in July 2012 as discussed in Note 3. The Company makes bio-based pest management and plant health products. The Company targets the major markets that use conventional chemical pesticides, including certain agricultural and water markets where its bio-based products are used as substitutes for, or in connection with, conventional chemical pesticides. The Company also targets new markets for which there are no available conventional chemical pesticides, the use of conventional chemical pesticides may not be desirable or permissible, or the development of pest resistance has reduced the efficacy of conventional chemical pesticides. The Company delivers EPA-approved and registered biopesticide products and other bio-based products that address the global demand for effective, safe and environmentally responsible products.
In August 2013, the Company closed its initial public offering of 5,462,500 shares of its common stock (inclusive of 712,500 shares of common stock sold upon the exercise of the underwriters’ option to purchase additional shares) (IPO). The public offering price of the shares sold in the offering was $12.00 per share. The total gross proceeds from the offering to the Company were $65,550,000, and after deducting underwriting discounts and commissions and offering expenses payable by the Company, the aggregate net proceeds received by the Company totaled approximately $56,105,000. Upon the closing of the IPO, all shares of the Company’s outstanding convertible preferred stock and convertible notes automatically converted into shares of common stock and outstanding warrants to purchase convertible preferred stock and certain warrants to purchase common stock were exercised for shares of common stock (See Note 20).
The Company is an early stage company with a limited operating history and has only recently begun commercializing its products. As of December 31, 2013, the Company had an accumulated deficit of $105,436,000 and expects to continue to incur losses for the foreseeable future. Until the IPO in August 2013, the Company had funded operations primarily with the net proceeds from the private placements of convertible preferred stock, convertible notes, promissory notes, term loans, as well as proceeds from the sale of its products and payments under strategic collaboration agreements and government grants. The Company will need to generate significant revenue to achieve and maintain profitability. As of December 31, 2013, the Company had working capital of $46,915,000, cash and cash equivalents of $24,455,000, and short-term investments of $13,677,000.
On August 1, 2013, the Company amended and restated its certificate of incorporation to effect a reverse split of shares of its common stock at a 1-for-3.138458 ratio (See Note 19).
The Company participates in a heavily regulated and highly competitive crop protection industry and believes that adverse changes in any of the following areas could have a material effect on the Company’s future financial position, results of operations, or cash flows: inability to obtain regulatory approvals, increased competition in the pesticide market, market acceptance of the Company’s products, weather and other seasonal factors beyond the Company’s control, litigation or claims against the Company based on intellectual property, patent, product, regulatory or other factors, and the Company’s ability to support increased growth.
2. Significant Accounting Policies
Basis of Presentation
The consolidated financial statements include the accounts of the Company and its wholly-owned subsidiary. All significant intercompany balances and transactions have been eliminated in consolidation.
F-8
Table of Contents
Use of Estimates
The preparation of financial statements in conformity with U.S. generally accepted accounting principles requires management to make estimates and assumptions that affect the reported amounts of assets and liabilities and disclosure of contingent assets and liabilities at the date of the financial statements and the reported amounts of revenues and expenses during the reporting period. Actual results could differ from those estimates.
Cash and Cash Equivalents
The Company considers all highly liquid financial instruments purchased with a maturity of three months or less to be cash equivalents. Cash and cash equivalents consist of cash on deposit, money market funds and certificates of deposit accounts (CDs) with U.S. financial institutions. The Company is exposed to credit risk in the event of default by financial institutions to the extent that cash and cash equivalents balances with financial institutions are in excess of amounts that are insured by the Federal Deposit Insurance Corporation. The Company has not experienced any losses on these deposits.
Restricted Cash
The Company’s restricted cash consisted of cash that the Company was contractually obligated as of December 31, 2012 to use to pay off the entire indebtedness of the promissory note entered into in April 2012 with an original principal balance of $10,000,000. The Company paid the outstanding balance of the promissory note in January 2013, and as of December 31, 2013, had no remaining contractual obligations which restricted the use of cash. See Note 8 for further discussion.
Short-Term Investments
The Company’s short-term investments consist of certificates of deposit with original maturities less than one year but greater than three months which are classified as held-to-maturity. Certificates of deposit are stated at their amortized cost with realized gains or losses, if any, reported as other income or expenses in the consolidated statements of operations. The Company routinely evaluates the realizability of its short-term investments and recognizes an impairment charge when a decline in the estimated fair value of a short-term investment is below the amortized cost and determined to be other-than-temporary. The Company considers various factors in determining whether to recognize an impairment charge, including the duration of time and the severity to which the fair value has been less than amortized cost, any adverse changes in the investee’s financial condition, and the Company’s intent and ability to hold the short-term investment for a period of time sufficient to allow for any anticipated recovery in market value. To date, the Company has not recognized any losses on its short-term investments.
The amortized cost and estimated fair values of short-term investments are summarized in the following table (in thousands):
| DECEMBER 31, 2013 | ||||||||||||||||
| AMORTIZED COST |
GROSS UNREALIZED GAINS |
GROSS UNREALIZED LOSSES |
ESTIMATED FAIR VALUE |
|||||||||||||
| Securities Held-to-Maturity |
||||||||||||||||
| Certificates of deposit, with maturities less than 1 year |
$ | 13,677 | $ | — | $ | (4 | ) | $ | 13,673 | |||||||
|
|
|
|
|
|
|
|
|
|||||||||
The short-term investments at December 31, 2013 were in inactive markets and, therefore, the estimated fair value is measured based on the Level 2 valuation hierarchy. The Company did not have any investments in securities as of December 31, 2012.
Fair Value of Financial Instruments
ASC 820, Fair Value Measurements (ASC 820), clarifies that fair value is an exit price, representing the amount that would be received to sell an asset or paid to transfer a liability in an orderly transaction between market participants. As such, fair value is a market-based measurement that should be determined based on assumptions that market participants would use in pricing an asset or liability.
F-9
Table of Contents
ASC 820 requires that the valuation techniques used to measure fair value must maximize the use of observable inputs and minimize the use of unobservable inputs. ASC 820 establishes a three tier value hierarchy, which prioritizes inputs that may be used to measure fair value as follows:
| n | Level 1—Quoted prices in active markets for identical assets or liabilities. |
| n | Level 2—Observable inputs other than quoted prices in active markets for identical assets and liabilities, quoted prices for identical or similar assets or liabilities in inactive markets, or other inputs that are observable or can be corroborated by observable market data for substantially the full term of the assets or liabilities. |
| n | Level 3—Inputs that are generally unobservable and typically reflect management’s estimate of assumptions that market participants would use in pricing the asset or liability. |
The following table presents the Company’s financial assets and liabilities measured at fair value on a recurring basis as of December 31, 2013 and 2012 (in thousands):
| DECEMBER 31, 2013 | ||||||||||||||||
| TOTAL | LEVEL 1 | LEVEL 2 | LEVEL 3 | |||||||||||||
| Assets |
||||||||||||||||
| Money market funds |
$ | 16,268 | $ | 16,268 | $ | — | $ | — | ||||||||
|
|
|
|
|
|
|
|
|
|||||||||
| DECEMBER 31, 2012 | ||||||||||||||||
| TOTAL | LEVEL 1 | LEVEL 2 | LEVEL 3 | |||||||||||||
| Assets |
||||||||||||||||
| Money market funds |
$ | 7,668 | $ | 7,668 | $ | — | $ | — | ||||||||
|
|
|
|
|
|
|
|
|
|||||||||
| Liabilities |
||||||||||||||||
| Common stock warrant liability |
$ | 301 | $ | — | $ | — | $ | 301 | ||||||||
| Preferred stock warrant liability |
1,884 | — | — | 1,884 | ||||||||||||
| Convertible notes payable |
41,860 | — | — | 41,860 | ||||||||||||
|
|
|
|
|
|
|
|
|
|||||||||
| Total liabilities at fair value |
$ | 44,045 | $ | — | $ | — | $ | 44,045 | ||||||||
|
|
|
|
|
|
|
|
|
|||||||||
The money market funds held as of December 31, 2013 and 2012 were in active markets and, therefore, are measured based on the Level 1 valuation hierarchy.
The Company estimated the fair value of the common and preferred stock warrant liabilities as of December 31, 2012 using the Probability Weighted Expected Return Method (PWERM), which analyzes the returns afforded to common equity holders under multiple future scenarios. Under the PWERM, share value is based upon the probability-weighted present value of expected future net cash flows (distributions to stockholders), considering each of the possible future events and giving consideration to the rights and preferences of each share class. This method is most appropriate when the long-term outlook for an enterprise is largely known and multiple future scenarios can be reasonably estimated.
The common and preferred stock warrant liabilities were valued by a PWERM valuation using six scenarios, which included three initial public offering scenarios, two merger scenarios and a sale of the Company’s intellectual property. An annual discount rate of 35% was applied to the PWERM valuations as of December 31, 2012. The common stock warrant liability valuation also included an 18% discount for lack of marketability as of December 31, 2012. As the PWERM estimates the fair value of the common and preferred stock warrant liabilities using unobservable inputs, it is considered to be a Level 3 fair value measurement.
Effective on the date of the IPO, under ASC 815-40-15, Contracts in Entity’s Own Equity (ASC 815-40-15), the common and preferred stock warrant liabilities were considered to be indexed to the Company’s stock, and accordingly, the total warrants liability of $2,669,000 was reclassified and included in stockholders’ equity (deficit)
F-10
Table of Contents
as of December 31, 2013. The Company revalued the warrants immediately prior to the IPO. The fair value of the warrants which would have expired on the date of the IPO unless exercised was determined using the intrinsic method based on the IPO price of $12.00 per share, which is deemed a Level 2 fair value measurement. The fair value of the warrants that would not have expired on the date of the IPO regardless of whether or not they were exercised was determined using the Black-Scholes-Merton option-pricing model, which is deemed a Level 3 fair value measurement.
As a result of the change in estimated fair value between December 31, 2012 or the issuance dates of the warrants issued during the year ended December 31, 2013 and the closing of the IPO, the Company recognized a net gain from the total change in estimated fair value of the common and preferred stock warrant liabilities as shown in the tables below.
The following table provides a reconciliation of the beginning and ending balances for the common and preferred stock warrant liabilities measured at fair value using significant unobservable inputs (Level 3). The amounts included in the “Transfers out of Level 3” represent the beginning balance in the interim quarter during which it was transferred (in thousands):
| COMMON STOCK WARRANT LIABILITY |
||||
| Fair value at December 31, 2012 |
$ | 301 | ||
| Warrants issued |
900 | |||
| Change in fair value recorded in change in fair value of financial instruments |
377 | |||
| Transfers out of Level 3 |
(434 | ) | ||
| Reclassified to stockholders’ equity (deficit) |
(1,144 | ) | ||
|
|
|
|||
| Fair value at December 31, 2013 |
$ | — | ||
|
|
|
|||
| PREFERRED STOCK WARRANT LIABILITY |
||||
| Fair value at December 31, 2012 |
$ | 1,884 | ||
| Change in fair value recorded in change in fair value of financial instruments |
(823 | ) | ||
| Transfers out of Level 3 |
(140 | ) | ||
| Reclassified to stockholders’ equity (deficit) |
(921 | ) | ||
|
|
|
|||
| Fair value at December 31, 2013 |
$ | — | ||
|
|
|
|||
Effective on the date of the IPO, all of the Company’s convertible notes were converted into shares of common stock. Prior to the IPO, convertible notes were valued by a PWERM valuation utilizing inputs similar to those used for estimating fair values of the common and preferred stock warrant liabilities described above. A discount rate of 25% was used for valuing the March and October 2012 Convertible Notes, defined in Note 9, as of December 31, 2012. A discount rate of 18% was used for valuing the October 2012 Subordinated Convertible Notes and the December 2012 Convertible Note, both defined in Note 9, as of December 31, 2012. These annual discount rates were applied in the PWERM valuation as of December 31, 2012. The Company revalued the convertible notes immediately prior to the IPO. As a result of the IPO, the number of shares to be issued became known and the Company estimated the fair value of the convertible notes using the intrinsic method based on the IPO price of $12.00 per share, which is deemed a Level 2 fair value measurement. Due to the change in estimated fair values between December 31, 2012 or the issuance dates of the convertible notes issued during the year ended December 31, 2013 and the closing of the IPO, the Company recognized a gain from the change in estimated fair value of the convertible notes as shown in the table below.
F-11
Table of Contents
The following table provides a reconciliation of the beginning and ending balances for the convertible notes measured at fair value using significant unobservable inputs (Level 3). The amounts included in the “Transfers out of Level 3” represent the beginning balance in the interim quarter during which it was transferred (in thousands):
| Fair value at December 31, 2012 |
$ | 41,860 | ||
| Convertible notes issued |
9,069 | |||
| Convertible notes cancelled |
(1,360 | ) | ||
| Accrued interest |
1,299 | |||
| Change in fair value recorded in change in fair value of financial instruments |
(2,634 | ) | ||
| Transfers out of Level 3 |
(48,234 | ) | ||
|
|
|
|||
| Fair value at December 31, 2013 |
$ | — | ||
|
|
|
During the year ended December 31, 2013, as noted above, there were $574,000 of preferred and common stock warrants and $48,234,000 of convertible notes transferred from the Level 3 to Level 2 category. There were no such transfers from the Level 3 to Level 2 category during the year ended December 31, 2012. Further, there were no transfers from the Level 2 to Level 1 category during the years ended December 31, 2013 or 2012.
Concentration of Credit Risk
Financial instruments that potentially subject the Company to concentrations of credit risk consist principally of cash, cash equivalents, short-term investments, accounts receivable and debt. The Company deposits its cash, cash equivalents and short-term investments with high credit quality domestic financial institutions with locations in the U.S. Such deposits may exceed federal deposit insurance limits. The Company believes the financial risks associated with these financial instruments are minimal.
The Company’s customer base is dispersed across many different geographic areas, and currently most customers are pest management distributors in the U.S. Generally, receivables are due up to 120 days from the invoice date and are considered past due after this date, although the Company may offer extended terms from time to time.
During the years ended December 31, 2013, 2012 and 2011, 8%, 20% and 7%, respectively, of the Company’s revenues were generated from international customers.
From inception through December 31, 2012, the Company’s principal source of revenues was its Regalia product line. During the year ended December 31, 2013, Grandevo and Regalia were the principal sources of the Company’s total revenues. During the years ended December 31, 2013, 2012 and 2011, these two product lines accounted for 97%, 96% and 96%, respectively, of the Company’s total revenues.
Customers with 10% or more of the Company’s total revenues consist of the following:
| CUSTOMER A |
CUSTOMER B (1) |
CUSTOMER C |
CUSTOMER D |
CUSTOMER E |
||||||||||||||||
| For the years ended December 31, |
||||||||||||||||||||
| 2013 |
28 | % | 10 | % | * | * | * | |||||||||||||
| 2012 |
33 | % | * | 13 | % | 12 | % | * | ||||||||||||
| 2011 |
39 | % | * | * | 17 | % | 10 | % | ||||||||||||
| * | Represents less than 10% of total revenues |
| (1) | Represents related party revenues. See Note 18 for further discussion. |
F-12
Table of Contents
Customers with 10% or more of the Company’s outstanding accounts receivable consist of the following:
| CUSTOMER A |
CUSTOMER B (1) |
CUSTOMER C |
CUSTOMER D |
CUSTOMER E |
CUSTOMER F |
CUSTOMER G |
||||||||||||||||||||||
| December 31, 2013 |
19 | % | 13 | % | 12 | % | 11 | % | * | * | * | |||||||||||||||||
| December 31, 2012 |
* | * | * | 33 | % | 17 | % | 11 | % | 11 | % | |||||||||||||||||
| * | Represents less than 10% of accounts receivable. |
| (1) | Represents accounts receivable from related parties. See Note 18 for further discussion. |
Concentrations of Supplier Dependence
The active ingredient in the Company’s Regalia product line is derived from the giant knotweed plant, which the Company obtains from China. The Company’s single supplier acquires raw knotweed from numerous regional sources and performs an extraction process on this plant, creating a dried extract that is shipped to the Company’s third- party manufacturer in the U.S. A disruption at this supplier’s manufacturing site or a disruption in trade between the U.S. and China could negatively impact sales of Regalia. The Company currently uses one supplier and does not have a long-term supply contract with this supplier. Although the Company has identified additional sources of knotweed, there can be no assurance that the Company will continue to be able to obtain dried extract from China at a competitive price.
Accounts Receivable
The carrying value of the Company’s receivables represents their estimated net realizable values. The Company generally does not require collateral and estimates any required allowance for doubtful accounts based on historical collection trends, the age of outstanding receivables, and existing economic conditions. If events or changes in circumstances indicate that specific receivable balances may be impaired, further consideration is given to the collectibility of those balances and the allowance is recorded accordingly. Past-due receivable balances are written-off when the Company’s internal collection efforts have been unsuccessful in collecting the amount due. During the years ended December 31, 2013 and 2012, no receivable balances were written-off. As of December 31, 2013 and 2012, the Company had no allowance for doubtful accounts.
Inventories
Inventories are stated at the lower of cost or market value (net realizable value or replacement cost) and include the cost of material and external labor and manufacturing costs. Cost is determined on the first-in, first-out basis. The Company provides for inventory reserves when conditions indicate that the selling price may be less than cost due to physical deterioration, obsolescence, changes in price levels, or other factors. Additionally, the Company provides reserves for excess and slow-moving inventory on hand that is not expected to be sold to reduce the carrying amount of excess slow-moving inventory to its estimated net realizable value. The reserves are based upon estimates about future demand from the Company’s customers and distributors and market conditions. As of December 31, 2013, the Company had $45,000 in reserves against its inventories. As of December 31, 2012, the Company had no reserves against its inventories. During the year ended December 31, 2013, the Company recorded, as a component of cost of product revenues, an inventory write-off of $205,000 primarily due to abnormal scrap and the identification of inventory that was not suitable for sale and an adjustment of $194,000 to write-down its Zequanox inventory to net realizable value. During the year ended December 31, 2012, the Company recorded, as a component of cost of product revenues, an inventory write-off of $913,000 primarily due to an early formulation of the Zequanox line of products that was not suitable for sale.
Inventories, net consist of the following (in thousands):
| DECEMBER 31 | ||||||||
| 2013 | 2012 | |||||||
| Raw materials |
$ | 5,355 | $ | 3,204 | ||||
| Work in progress |
2,917 | 607 | ||||||
| Finished goods |
3,394 | 1,061 | ||||||
|
|
|
|
|
|||||
| $ | 11,666 | $ | 4,872 | |||||
|
|
|
|
|
|||||
F-13
Table of Contents
Deferred Cost of Product Revenues
Deferred cost of product revenues are stated at the lower of cost or net realizable value and include product sold where title has transferred but the criteria for revenue recognition have not been met. As of December 31, 2013, the Company recorded current deferred cost of product revenues of $418,000 which is included in prepaid expenses and other current assets in the consolidated balance sheets. As of December 31, 2012, the Company had no deferred cost of product revenues. During the year ended December 31, 2013, the Company recorded an adjustment of $174,000 to write down the carrying value of deferred cost of product revenues to net realizable value.
Property, Plant and Equipment
Property, plant and equipment are recorded at cost and are depreciated using the straight-line method over their estimated useful lives. The Company generally uses the following estimated useful lives for each asset category:
| ASSET CATEGORY |
ESTIMATED USEFUL LIFE | |
| Building |
30 years | |
| Computer equipment |
2-3 years | |
| Machinery and equipment |
3-20 years | |
| Office equipment |
3-5 years | |
| Furniture |
3-5 years | |
| Leasehold improvements |
Shorter of lease term or useful life | |
| Software |
3 years |
Amortization of assets under capital leases is included in depreciation expense. Maintenance, repairs and minor renewals are expensed as incurred. Expenditures that substantially increase an asset’s useful life are capitalized.
Deferred Financing Costs
Deferred financing costs, net include fees and costs incurred to obtain long-term financing. The costs are being amortized over the terms of the respective loans on a basis that approximates level yield. Unamortized deferred financing fees are written-off when debt is retired before the maturity date. Upon the amendment or termination of debt, unamortized deferred financing fees are accounted for in accordance with ASC 470-50-40, Debt Modifications and Extinguishments (ASC 470-50-40). As of December 31, 2013, $458,000 and $148,000 of the deferred financing costs were recorded as a component of current and non-current other assets, respectively, and are being amortized to interest expense. As of December 31, 2012, $145,000 and $261,000 of the deferred financing costs were recorded as a component of current and non-current other assets, respectively, and are being amortized to interest expense.
Impairment of Long-Lived Assets
Impairment losses related to long-lived assets are recognized in the event the net carrying value of such assets is not recoverable and exceeds fair value. The Company evaluates the recoverability of its long-lived assets whenever events or changes in circumstances indicate that the carrying value of an asset may not be recoverable. The carrying amount of a long-lived asset (asset group) is not recoverable if it exceeds the sum of the undiscounted cash flows expected to result from the use and eventual disposition of the asset (asset group). If an asset is considered is not recoverable, the impairment loss is measured as the amount by which the carrying value of the asset group exceeds its estimated fair value. To date, the Company has not recognized any such impairment loss associated with its long-lived assets.
Preferred Stock Warrant Liability
The Company accounted for outstanding warrants exercisable into shares of its preferred stock as liability instruments as the preferred stock into which these warrants were convertible were contingently redeemable upon the occurrence of certain events or transactions. The Company adjusted the warrant instruments to fair value at each reporting period with the change in fair value recorded as a component of change in estimated fair value of financial instruments in the consolidated statements of operations. Effective on the date of the IPO, under ASC 815-40-15, the preferred stock warrant liabilities were considered to be indexed to the Company’s stock, and accordingly, the total warrants liability was reclassified and included in stockholders’ equity (deficit) as of December 31, 2013.
F-14
Table of Contents
Common Stock Warrant Liability
The Company issued detachable common stock warrants in connection with the October 2012 and April 2013 Junior Secured Promissory Notes as defined and discussed in Note 8 to purchase a variable number of the Company’s shares of common stock based on a fixed monetary amount. As the predominant settlement feature of these common stock warrants was to settle a fixed monetary amount in a variable number of shares, these common stock warrants fell within the scope of ASC 480, Distinguishing Liabilities from Equity (ASC 480). Accordingly, these common stock warrants were recorded at estimated fair value on their issuance date and were adjusted to their estimated fair value as of each reporting date with the change in estimated fair value recorded as a component of change in estimated fair value of financial instruments in the accompanying consolidated statements of operations. Effective on the date of the IPO, under ASC 815-40-15, the common stock warrant liabilities were considered to be indexed to the Company’s stock, and accordingly, the total warrants liability was reclassified and included in stockholders’ equity (deficit) as of December 31, 2013.
Revenue Recognition
The Company recognizes revenues when persuasive evidence of an arrangement exists, delivery and transfer of title has occurred or services have been rendered, the price is fixed or determinable, and collectability is reasonably assured, unless contractual obligations, acceptance provisions or other contingencies exist. If such obligations or provisions exist, revenue is recognized after such obligations or provisions are fulfilled or expire.
Product revenues consist of revenues generated from sales to distributors and from sales of the Company’s products to direct customers, net of rebates and cash discounts. For sales of products made to distributors, the Company considers a number of factors in determining whether revenue is recognized upon transfer of title to the distributor, or when payment is received. These factors include, but are not limited to, whether the payment terms offered to the distributor in comparison to the Company’s historical terms are considered to be longer than normal payment terms, the distributor history of adhering to the terms of its contractual arrangements with the Company, whether the Company has a pattern of granting concessions for the benefit of the distributor, and whether there are other conditions that may indicate that the sale to the distributor is not substantive. When the Company offers payment terms that are considered to be extended in comparison to the Company’s historical terms, the Company considers the arrangement not to be fixed or determinable, and accordingly, revenue is deferred until payment is due. The costs associated with such deferral are also deferred and classified in prepaid expenses and other current assets in the consolidated balance sheets. The Company currently recognizes revenue primarily on the sell-in method with its distributors. Distributors do not have price protection or return rights.
As of December 31, 2013, the Company recorded current deferred product revenues of $1,016,000. As of December 31, 2012, the Company had no deferred product revenues.
From time to time, the Company offers certain product rebates, which are recorded as reductions to product revenues. An accrued liability for these product rebates is recorded at the time the revenues are recorded.
The Company recognizes license revenues pursuant to strategic collaboration and distribution agreements under which the Company receives payments for the achievement of testing validation, regulatory progress and commercialization events. As these activities and payments are associated with exclusive rights that the Company provides in connection with strategic collaboration and distribution agreements over the term of the agreements, revenues related to the payments received are deferred and recognized over the term of the exclusive distribution period of the respective agreement. For the years ended December 31, 2012 and 2011, the Company received payments totaling $1,533,000 and $833,000, respectively, of which $1,000,000 was received from a related party for the year ended December 31, 2012. No payments were received under these agreements during the year ended December 31, 2013. For the years ended December 31, 2013, 2012 and 2011, the Company recognized $193,000, $179,000 and $57,000, respectively, as license revenues, excluding related party revenues, in the accompanying consolidated statements of operations.
For the year ended December 31, 2013, the Company recognized $131,000 of related party revenues under these agreements based on the terms of the Company’s commercial agreement with Syngenta, an affiliate of one of our 5% stockholders. In addition, in connection with the December 2012 Convertible Note issued to a related party in December 2012, which is described in Note 9, the Company recorded a reduction of license revenues included in
F-15
Table of Contents
related party revenues of $110,000 for the year ended December 31, 2012. There were no related party license revenues recognized for the years ended December 31, 2012 and 2011.
At December 31, 2013, the Company recorded current and non-current deferred revenues of $324,000 and $1,372,000, respectively, related to payments received under these agreements, of which $131,000 and $628,000, respectively, related to deferred revenues from related parties based on the terms of the Company’s commercial agreement with Syngenta. At December 31, 2012, the Company recorded current and non-current deferred revenues of $324,000 and $1,696,000, respectively, related to payments received under these agreements, of which $131,000 and $759,000, respectively, related to deferred revenues from related parties based on the terms of the Company’s commercial agreement with Syngenta.
Research, Development and Patent Expenses
Research and development expenditures, which primarily consist of payroll-related expenses, toxicology costs, regulatory costs, consulting costs and lab costs, and patent expenses, which primarily consist of legal costs relating to the patents and patent filing costs, are expensed to operations as incurred. For the years ended December 31, 2013, 2012 and 2011, research and development expenses totaled $16,827,000, $12,140,000 and $9,133,000, respectively, and patent expenses totaled $987,000, $601,000 and $277,000, respectively. Grants received from third parties for research and development activities are recorded as reductions of expense over the term of the agreement as the related activities are conducted. For the years ended December 31, 2012 and 2011, the Company received payments under grants totaling $140,000 and $164,000, respectively. There were no grants received for the year ended December 31, 2013. Of these amounts, $31,000 was recorded in accrued liabilities as accrued grant proceeds for which the underlying grant services had not been provided as of December 31, 2011. There were no accrued grant proceeds for the years ended December 31, 2013 and 2012. For the years ended December 31, 2012 and 2011, the Company reduced research and development expenses by $171,000 and $195,000, respectively, as services were performed under the grants. There was no reduction to research and development expenses for services performed under grants for the year ended December 31, 2013.
Shipping and Handling Costs
Amounts billed for shipping and handling are included as a component of product revenues. Related costs for shipping and handling have been included as a component of cost of product revenues.
Advertising
The Company expenses advertising costs as incurred. Advertising costs for the years ended December 31, 2013, 2012 and 2011, were $760,000, $609,000 and $286,000, respectively.
Share-Based Compensation
The Company recognizes share-based compensation expense for all stock options made to employees and directors based on estimated fair values.
The Company estimates the fair value of stock options on the date of grant using an option-pricing model. The value of the portion of the stock options that is ultimately expected to vest is recognized as expense over the requisite service periods using the straight-line method. Forfeitures are estimated at the time of grant and revised, if necessary, in subsequent periods if actual forfeitures differ from those estimates.
F-16
Table of Contents
For purposes of determining the Company’s historical share-based compensation expense, it used the Black-Scholes-Merton (BSM) option-pricing model to calculate the estimated fair value of stock options on the measurement date (generally, the grant date). This model requires inputs for the expected life of the stock options, estimated volatility factor, risk-free interest rate, and expected dividend yield. The Company’s estimates of forfeiture rates also affect the amount of aggregate compensation expense. These inputs are subjective and generally require significant judgment. For the years ended December 31, 2013, 2012 and 2011, the Company calculated the fair value of stock options granted using the following assumptions:
| YEAR ENDED DECEMBER 31 | ||||||
| 2013 | 2012 | 2011 | ||||
| Expected life (years) |
5.29-7.71 | 5.00-6.08 | 5.00-6.28 | |||
| Estimated volatility factor |
0.70-0.75 | 0.72-0.76 | 0.70 | |||
| Risk-free interest rate |
1.27%-2.11% | 0.74%-1.16% | 0.86%-2.40% | |||
| Expected dividend yield |
— | — | — | |||
Expected Life—The Company’s expected life represents the period that its share-based payment awards are expected to be outstanding. The Company uses the “simplified method” in accordance with Staff Accounting Bulletin (SAB) No. 107, Share-Based Payment, and SAB No. 110, Simplified Method for Plain Vanilla Share Options, to develop the expected term of options determined to be “plain vanilla.” Under this approach, the expected term is presumed to be the midpoint between the vesting date and the contractual end of the option grant. For stock options granted with an exercise price not equal to the determined fair market value, the Company estimates the expected life based on historical data and management’s expectations about exercises and post-vesting termination behavior.
Estimated Volatility Factor—The Company uses the calculated volatility based upon the trading history and calculated volatility of the common stock of comparable agricultural biotechnology companies in determining an estimated volatility factor.
Risk-Free Interest Rate—The Company bases the risk-free interest rate on the implied yield currently available on U.S. Treasury constant-maturity securities with the same or substantially equivalent remaining term.
Expected Dividend Yield—The Company has not declared dividends nor does it expect to in the foreseeable future. Therefore, a zero value was assumed for the expected dividend yield.
Estimated Forfeitures—When estimating forfeitures, the Company considers voluntary and involuntary termination behavior and actual option forfeitures.
If in the future the Company determines that other methods are more reasonable, or other methods for calculating these assumptions are prescribed by authoritative guidance, the fair value calculated for the Company’s stock options could change significantly. Higher volatility and longer expected lives result in an increase to share-based compensation expense determined at the grant date. Share-based compensation expense affects the Company’s research, development and patent expense and selling, general and administrative expense.
Other Income (Expense), Net
Other income (expense), net included net losses resulting from foreign currency transactions in the amount of $53,000 and $54,000 for the years ended December 31, 2013 and 2012, respectively. There were no losses from foreign currency transactions for the year ended December 31, 2011. In addition, in 2013, other income (expense), net included a loss on disposal of fixed assets totaling $231,000. There were no losses on disposals of fixed assets during the years ended December 31, 2012 and 2011.
Income Taxes
The Company uses the asset and liability method of accounting for income taxes. Deferred tax assets and liabilities are recognized for the estimated future tax consequences attributable to the differences between the financial statement carrying amounts of existing assets and liabilities and their respective tax bases. Deferred tax assets and liabilities are measured using enacted tax rates expected to apply to taxable income in the years in which those
F-17
Table of Contents
temporary differences are expected to be recovered or settled. To the extent deferred tax assets cannot be recognized under the preceding criteria, the Company establishes valuation allowances as necessary to reduce deferred tax assets to the amounts expected to be realized. As of December 31, 2013 and 2012, all deferred tax assets were fully offset by a valuation allowance. Realization of deferred tax assets is dependent upon future federal, state, and foreign taxable income. The Company’s judgments regarding deferred tax assets may change as the Company expands into international jurisdictions, due to future market conditions, changes in U.S. or international tax laws, and other factors. These changes, if any, may require possible material adjustments to these deferred tax assets, resulting in a reduction in net income or an increase in net loss in the period when such determinations are made.
The Company recognizes liabilities for uncertain tax positions based upon a two-step process. To the extent a tax position does not meet a more-likely-than-not level of certainty; no benefit is recognized in the consolidated financial statements. If a position meets the more-likely-than-not level of certainty, it is recognized in the consolidated financial statements at the largest amount that has a greater than 50% likelihood of being realized upon ultimate settlement. The Company’s policy is to analyze the Company’s tax positions taken with respect to all applicable income tax issues for all open tax years (in each respective jurisdiction). As of December 31, 2013 and 2012, the Company has concluded that no uncertain tax positions were required to be recognized in its consolidated financial statements. It is the Company’s practice to recognize interest and penalties related to income tax matters in income tax expense. No amounts were recognized for interest and penalties during the years ended December 31, 2013, 2012 and 2011.
Comprehensive Loss
Comprehensive loss represents the net loss for the period plus the results of certain changes to stockholders’ equity (deficit) that are not reflected in the consolidated statements of operations, if applicable. The only component of the Company’s comprehensive loss for the periods presented is net loss.
Net Loss Per Share
Basic net loss per share, which excludes dilution, is computed by dividing the net loss attributable to common stockholders by the weighted-average number of shares of common stock outstanding during the period. Diluted net loss per share reflects the potential dilution that could occur if securities or other contracts to issue common stock, such as stock options, convertible notes, convertible preferred stock and warrants, result in the issuance of common stock which share in the losses of the Company. Certain potential shares of common stock have been excluded from the computation of diluted net loss per share for certain periods as their effect would be anti-dilutive. Such potentially dilutive shares are excluded when the effect would be to reduce the loss per share. The treasury stock method has been applied to determine the dilutive effect of warrants. See Note 4 for further discussion.
Segment Information
The Company is organized as a single operating segment, whereby its chief operating decision maker assesses the performance of and allocates resources to the business as a whole.
Recently Issued Accounting Pronouncements
There have been no new accounting pronouncements issued during the year ended December 31, 2013 that are of significance, or potential significance, to the Company.
Reclassifications
Certain amounts in 2012 and 2011 have been reclassified to conform with the 2013 financial statement presentations. These reclassifications have no effect on previously reported net income.
F-18
Table of Contents
3. Property, Plant and Equipment
Property, plant and equipment consist of the following (in thousands):
| DECEMBER 31 | ||||||||
| 2013 | 2012 | |||||||
| Land |
$ | 1 | $ | 1 | ||||
| Buildings |
— | — | ||||||
| Computer equipment and software |
459 | 355 | ||||||
| Furniture, fixtures and office equipment |
293 | 192 | ||||||
| Machinery and equipment |
4,624 | 2,446 | ||||||
| Leasehold improvements |
497 | 472 | ||||||
| Construction in progress |
6,503 | 2,103 | ||||||
|
|
|
|
|
|||||
| 12,377 | 5,569 | |||||||
| Less accumulated depreciation |
(2,957 | ) | (2,041 | ) | ||||
|
|
|
|
|
|||||
| $ | 9,420 | $ | 3,528 | |||||
|
|
|
|
|
|||||
The Company has granted to third parties interests in specific property and equipment as part of certain financing arrangements (see Note 8).
Depreciation and amortization expense for the years ended December 31, 2013, 2012 and 2011, was $976,000, $613,000 and $499,000, respectively, which included amortization expense related to capital leases for those periods (see Note 14).
On July 19, 2012 (Acquisition Date), the Company purchased land, building and equipment (Manufacturing Plant) for $1,459,000, including $341,000 of transaction costs. The Manufacturing Plant is located in Bangor, Michigan. Prior to the acquisition, the Manufacturing Plant was owned by a bank and sold in a foreclosure auction. Accordingly, the purchase price for the Manufacturing Plant was less than the estimated fair value of the assets acquired by $257,000. The excess of fair value of the assets acquired over the purchase price was allocated on a relative fair value basis to all assets acquired. The acquisition of the Manufacturing Plant will allow the Company to manufacture certain products internally and improve the overall operating efficiencies and margins of the business as the production of these products historically has been outsourced.
The acquisition was accounted for as an asset acquisition in accordance with ASC 805, Business Combinations (ASC 805). The assets acquired under the Manufacturing Plant acquisition have been included in the Company’s consolidated financial statements from the Acquisition Date. The purchase price was allocated to assets acquired as of the Acquisition Date.
Prior to the allocation of the excess of fair value of the assets acquired over the purchase price, the assets acquired are first measured at their fair values. The Company engaged a third-party valuation firm to assist with its estimated fair value of the assets acquired. The following methods and assumptions are used to estimate the fair value of each class of asset acquired:
Land—Market approach based on similar, but not identical, transactions in the market. Adjustments to comparable sales are based on both the quantitative and qualitative data.
Building—The cost approach, market approach and income approach were used to assess fair value. Cost approach is based on replacement cost new less depreciation adjusted for physical deterioration, functional obsolescence and external/economic obsolescence, as applicable. The market approach is based on similar, but not identical, transactions in the market using both quantitative and qualitative data. The income approach is based on the direct capitalization method using similar but not identical lease rates and making an assessment of net operating income.
Equipment—Both the cost approach and the market approach were used to assess fair value. Cost approach is based on replacement cost new less depreciation adjusted for physical deterioration, functional obsolescence and external/economic obsolescence, as applicable. The market approach is based on similar, but not identical, transactions in the market using both quantitative and qualitative data.
F-19
Table of Contents
The following table summarizes the estimated fair value of the assets acquired as of the Acquisition Date, which were determined using Level 2 and 3 inputs as described above (in thousands):
| JULY 19, 2012 |
||||
| Land |
$ | 1 | ||
| Building |
314 | |||
| Equipment |
1,144 | |||
|
|
|
|||
| Assets acquired |
$ | 1,459 | ||
|
|
|
|||
As the Manufacturing Plant had not yet been placed in service as of December 31, 2013, the assets acquired, except the land, were recorded as construction in progress as a component of property, plant and equipment in the accompanying consolidated balance sheets as of December 31, 2013 and 2012. In addition, interest expense in the amount of $801,000 and $106,000 was recorded in construction in progress as of December 31, 2013 and 2012, respectively.
4. Net Loss Per Share
Basic net loss per share, which excludes dilution, is computed by dividing the net loss attributable to common stockholders by the weighted-average number of shares of common stock outstanding during the period. Diluted net loss per share reflects the potential dilution that could occur if securities or other contracts to issue common stock, such as stock options, convertible notes, convertible preferred stock and warrants, result in the issuance of common stock which share in the losses of the Company.
The following table sets forth the potential shares of common stock that are not included in the calculation of diluted net loss per share because to do so would be anti-dilutive as of the end of each period presented (in thousands). Such potentially dilutive shares are excluded when the effect would be to reduce the loss per share. The treasury stock method has been applied to determine the dilutive effect of warrants.
| DECEMBER 31 | ||||||||||||
| 2013 | 2012 | 2011 | ||||||||||
| Convertible preferred stock |
— | 8,504 | 8,504 | |||||||||
| Convertible notes (1) |
— | — | — | |||||||||
| Stock options outstanding |
2,608 | 2,067 | 1,384 | |||||||||
| Warrants to purchase convertible preferred stock |
— | 207 | 36 | |||||||||
| Warrants to purchase common stock (2) |
151 | — | 5 | |||||||||
| (1) | As of December 31, 2012, the Company had approximately $41,860,000, in contingently convertible notes payable and related accrued interest for which the contingencies related to conversion had not been met as of December 31, 2012. Therefore, it would have no dilutive or anti-dilutive impact until the contingency had been met effective upon the IPO in August 2013. All convertible notes converted to common stock in connection with the IPO. See Note 9 for further discussion. |
| (2) | In October 2012 and April 2013, the Company issued warrants to purchase a number of shares of common stock equal to 15% of the funded principal amount of the October 2012 and April 2013 Junior Secured Promissory Notes as defined in Note 8, divided by 70% of the value of common stock in a sale of the Company or a qualified initial public offering (Qualified IPO), with an exercise price of 70% of the value of common stock in a sale of the Company or a Qualified IPO. In June 2013, the Company issued warrants to purchase a number of shares of common stock equal to 10% of the total committed amount of the June 2013 Credit Facility as defined in Note 8, divided by 70% of the value of common stock in a sale of the Company or a Qualified IPO, with an exercise price of 70% of the value of common stock in a sale of the Company or a Qualified IPO. These warrants were contingently exercisable for which the contingencies related to exercise had not been met until the IPO in August 2013. Therefore, they would have no dilutive or anti-dilutive impact until the contingency had been met in August 2013. See Note 8 for further discussion. |
F-20
Table of Contents
The numbers of shares of common stock issuable upon the exercise of warrants to purchase convertible preferred stock and upon the conversion of convertible preferred stock were at a ratio of one-to-one.
| YEAR ENDED DECEMBER 31 | ||||||||||||
| 2013 | 2012 | 2011 | ||||||||||
| (In thousands, except per share data) | ||||||||||||
| Numerator: |
||||||||||||
| Net loss |
$ | (28,489 | ) | $ | (38,794 | ) | $ | (13,180 | ) | |||
| Deemed dividend on convertible notes |
(1,378 | ) | (2,039 | ) | — | |||||||
|
|
|
|
|
|
|
|||||||
| Net loss attributable to common stockholders |
$ | (29,867 | ) | $ | (40,833 | ) | $ | (13,180 | ) | |||
|
|
|
|
|
|
|
|||||||
| Effect of potentially dilutive securities: |
||||||||||||
| Convertible notes |
(4,392 | ) | — | — | ||||||||
| Warrants to purchase preferred stock |
(840 | ) | — | — | ||||||||
|
|
|
|
|
|
|
|||||||
| Net loss for diluted net loss per share |
$ | (35,099 | ) | $ | (40,833 | ) | $ | (13,180 | ) | |||
|
|
|
|
|
|
|
|||||||
| Denominator |
||||||||||||
|
|
|
|
|
|
|
|||||||
| Weighted average shares used for basic net loss per share |
8,731 | 1,257 | 1,239 | |||||||||
|
|
|
|
|
|
|
|||||||
| Effect of potentially dilutive securities: |
||||||||||||
| Convertible notes |
127 | — | — | |||||||||
| Warrants to purchase preferred stock |
53 | — | — | |||||||||
|
|
|
|
|
|
|
|||||||
| Weighted average shares outstanding for diluted net loss per share |
8,911 | 1,257 | 1,239 | |||||||||
|
|
|
|
|
|
|
|||||||
| Basic net loss per share: |
$ | (3.42 | ) | $ | (32.48 | ) | $ | (10.64 | ) | |||
|
|
|
|
|
|
|
|||||||
| Diluted net loss per share: |
$ | (3.94 | ) | $ | (32.48 | ) | $ | (10.64 | ) | |||
|
|
|
|
|
|
|
|||||||
5. Other Assets
Other assets consist of the following (in thousands):
| DECEMBER 31 | ||||||||
| 2013 | 2012 | |||||||
| Prepaid initial public offering costs |
$ | — | $ | 2,257 | ||||
| Prepaid distribution fees |
125 | 134 | ||||||
| Deferred financing costs, less current portion |
148 | 261 | ||||||
| Deposits for equipment |
256 | — | ||||||
| Deposits on equipment leases |
177 | 43 | ||||||
| Other assets |
100 | 90 | ||||||
|
|
|
|
|
|||||
| $ | 806 | $ | 2,785 | |||||
|
|
|
|
|
|||||
F-21
Table of Contents
6. Accrued Liabilities
Accrued liabilities consist of the following (in thousands):
| DECEMBER 31 | ||||||||
| 2013 | 2012 | |||||||
| Accrued compensation |
$ | 2,040 | $ | 1,342 | ||||
| Accrued severance |
100 | — | ||||||
| Accrued expenses |
1,630 | 1,295 | ||||||
| Accrued inventory costs |
610 | — | ||||||
| Accrued product rebates |
— | 386 | ||||||
|
|
|
|
|
|||||
| $ | 4,380 | $ | 3,023 | |||||
|
|
|
|
|
|||||
On November 7, 2013, the Company announced that its Chief Financial Officer, Donald Glidewell, had decided to retire from the Company. To facilitate the transition, Mr. Glidewell agreed to remain as the Company’s Chief Financial Officer for up to five months while the Company searched for a successor Chief Financial Officer, and the Company entered into a transition agreement with Mr. Glidewell that provides, among other things, for continued vesting of his outstanding equity awards through his retirement date and that upon his separation from the Company, Mr. Glidewell is eligible to receive:
| n | an amount equal to six months of his then-current annual base salary payable monthly for a period of six months from his retirement date in the form of salary continuation; |
| n | medical and dental coverage, plus disability and life insurance premiums, for a period of six months following his retirement; and |
| n | full acceleration of vesting of his outstanding equity awards that are unvested as of his retirement date. |
The Company recorded accrued severance expenses in the amount of $100,000 based on the terms of the transition agreement for salary, COBRA, and transition service related costs. See Note 13 for further discussion regarding the acceleration of vesting of Mr. Glidewell’s outstanding equity awards.
7. Factoring and Security Agreement
On June 13, 2013, the Company entered into a factoring and security agreement (Factoring and Security Agreement) with a third-party that would enable the Company to sell the entire interest in certain accounts receivable up to $5,000,000. Under the Factoring and Security Agreement, 15% of the sales proceeds will be held back by the purchaser until collection of such receivables. Such holdbacks are not considered legal securities, nor are they certificated. Upon the sale of the receivable, the Company will not maintain servicing. The purchaser may require the Company to repurchase accounts receivable if (i) the payment is disputed by the account debtor, with the purchaser being under no obligation to determine the bona fides of such dispute; (ii) the account debtor has become insolvent or (iii) upon the effective date of the termination of the Factoring and Security Agreement. The purchaser will retain its security interest in any accounts repurchased by the Company. The Factoring and Security Agreement is secured by all of the Company’s personal property and fixtures, and proceeds thereof, including accounts receivable, inventory, equipment and general intangibles other than intellectual property. Upon sale of the receivable, the Company may elect to set up a reserve where upon the cash for the sale remains with the third-party and the Company can draw on the available amount on the reserve account at any time. The Company elected to utilize the reserve account. On November 11, 2013, the Company terminated the Factoring and Security Agreement effective January 10, 2014.
The Company accounted for sales of accounts receivable under the Factoring and Security Agreement as a secured borrowing in accordance with ASC 860, Transfers and Servicing (ASC 860). As of December 31, 2013, the Company had $479,000 included in accounts receivable that were transferred under this arrangement. As of December 31, 2013, the Company did not have excess funds available on the reserve account and did not have secured borrowings outstanding under the arrangement.
F-22
Table of Contents
8. Debt
Debt consists of the following (in thousands):
| DECEMBER 31 | ||||||||
| 2013 | 2012 | |||||||
| Promissory note bearing interest at 6.25% per annum, which is payable monthly through May 2013, collateralized by all of the Company’s inventories, chattel paper, accounts receivable, equipment and general intangibles (excluding certain financed equipment and intellectual property). The Promissory Note was repaid in May 2013 (1) |
$ | — | $ | 35 | ||||
| Term Loan (Term Loan) bearing interest at 7.00% per annum which is payable monthly through April 2016. The Term Loan is collateralized by all of the Company’s inventories, chattel paper, accounts receivable, equipment and general intangibles (excluding certain financed equipment and intellectual property) pledged as collateral under the Term Loan, subordinated (1) |
309 | 426 | ||||||
| Promissory note bearing interest at 7.00% per annum which is payable monthly through November 2014, collateralized by all of the Company’s inventories, chattel paper, accounts receivable, equipment and general intangibles (excluding certain financed equipment and intellectual property), net of unamortized debt discount at December 31, 2013 of $2, subordinated (1) |
123 | 261 | ||||||
| Senior secured promissory note (April 2012 Senior Secured Promissory Note) bearing interest at 15.00% per annum which is payable monthly through April 2017, collateralized by substantially all of the Company’s assets. The April 2012 Senior Secured Promissory Note was repaid in January 2013 |
— | 8,374 | ||||||
| Junior secured promissory notes (October 2012 and April 2013 Junior Secured Promissory Notes) bearing interest at 12.00% per annum which are payable monthly through October 2015, collateralized by substantially all of the Company’s assets, net of unamortized debt discount at December 31, 2013 of $445 (1) |
12,005 | 7,242 | ||||||
|
|
|
|
|
|||||
| Debt |
12,437 | 16,338 | ||||||
| Less current portion |
(157 | ) | (8,572 | ) | ||||
|
|
|
|
|
|||||
| $ | 12,280 | $ | 7,766 | |||||
|
|
|
|
|
|||||
| (1) | The lender’s security interest was subordinate to the holders of the April 2012 Senior Secured Promissory Note with the exception of its interest in equipment. |
As of December 31, 2013, aggregate contractual future principal payments on the Company’s debt, by year, are due as follows (in thousands):
| Years ending December 31: |
||||
| 2014 |
$ | 251 | ||
| 2015 |
12,585 | |||
| 2016 |
48 | |||
|
|
|
|||
| Total future principal payments |
$ | 12,884 | ||
|
|
|
The fair value of the Company’s outstanding debt obligations was $13,950,000 as of December 31, 2013, which was estimated based on a discounted cash flow model using an estimated market rate of interest of 7.0% and is classified as Level 3 within the fair value hierarchy. The Company believes the carrying values of its debt approximate their fair values at December 31, 2012 based on the interest rates as of those dates compared to similar debt instruments.
F-23
Table of Contents
Promissory Notes, Term Loan, Revolving Line of Credit and Credit Facility
In May 2008, the Company borrowed $400,000 pursuant to a promissory note with a bank which had an interest rate of 6.25% per annum and was payable in 60 equal monthly installments of $7,785 commencing June 1, 2008. This promissory note was repaid in May 2013.
In March 2009, October 2010 and October 2011, the Company and the bank agreed to modify the terms of its existing revolving line of credit (Revolver). Under the modified terms of the Revolver, the Company’s borrowings under the Revolver were limited to 75% of qualifying accounts receivable with a maximum borrowing limit of $500,000. In March 2012, the Company entered into a change in terms agreement with the bank under which the existing Revolver was replaced by the Term Loan in the amount of $500,000 with a rate of 7.00% per annum, maturing April 1, 2016. The Company’s inventories, chattel paper, accounts receivable, equipment and general intangibles (excluding certain financed equipment and intellectual property) have been pledged as collateral under the Term Loan. The Revolver was terminated in March 2012.
In March 2009, the Company borrowed $650,000 pursuant to a promissory note with the bank which bears interest at the rate of 7.00% per annum and is repayable in six monthly interest only payments starting May 1, 2009, followed by 60 equal monthly installments of $13,000 commencing November 1, 2009, with the final payment due on November 1, 2014. All of the Company’s inventories, chattel paper, accounts receivable, equipment and general intangibles (excluding certain financed equipment and any intellectual property) have been pledged as collateral for the promissory notes.
On April 13, 2012, the Company borrowed $10,000,000 pursuant to a senior secured promissory note (April 2012 Senior Secured Promissory Note) which had an interest rate of 15.00% per annum and required the Company to pay the lender non-refundable loan fees of $625,000. The April 2012 Senior Secured Promissory Note was payable in 59 monthly installments of $238,000 beginning in May 2012 with all unpaid principal and interest due in April 2017. The April 2012 Senior Secured Promissory Note was secured by a first priority security interest in substantially all of the Company’s present and future assets. The Company also issued a warrant (Series C Warrant) to the lender to purchase 191,000 shares of the Company’s Series C convertible preferred stock with an exercise price of $7.846 per share. Under its terms, the Series C Warrant would expire, unless exercised, on the earlier to occur of April 2022 or one year after the Company successfully completes a Qualified IPO, however the Series C Warrant was exercised effective upon the completion of the IPO (See Note 20). Until the effective date of the IPO, the Company estimated the fair value of the Series C Warrant using a PWERM valuation based on unobservable inputs and, therefore, the Series C Warrant was considered to be a Level 3 liability.
The loan fees and the fair value of the Series C Warrant at the date of issuance of $625,000 and $306,000, respectively, were recorded as a debt discount to the April 2012 Senior Secured Promissory Note and were being amortized to interest expense over the term of the arrangement.
Under the terms of the April 2012 Senior Secured Promissory Note, the Company could have elected to prepay the entire outstanding principal balance upon thirty days written notice to the lender. In the event the Company decided to prepay the entire loan balance, the Company would incur a termination fee that would be calculated based on the April 2012 Senior Secured Promissory Note’s outstanding principal balance as of the effective date of termination notice. The termination fee is 0% to 3% of the April 2012 Senior Secured Promissory Note’s outstanding balance as of the effective date of the termination notice, depending on the timing of the termination.
Under the terms of the December 2012 Convertible Note issued in December 2012 (Note 9), the Company was required to use the proceeds from this convertible note to repay all outstanding balance of the April 2012 Senior Secured Promissory Note within 35 days of closing. The Company repaid the outstanding balance of the April 2012 Senior Secured Promissory Note in January 2013 and classified the outstanding balance of the April 2012 Senior Secured Promissory Note as of December 31, 2012 as a current liability. The total amount of the payout was $9,451,000 which consisted of $9,139,000 in principal, $34,000 in accrued interest, and an early termination fee of $278,000. The termination fee was recorded as incremental interest expense in the accompanying consolidated statements of operations for the year ended December 31, 2013.
F-24
Table of Contents
Activity related to the April 2012 Senior Secured Promissory Note from December 31, 2012 through December 31, 2013 consisted of the following (in thousands):
| DECEMBER 31, 2012 |
AMORTIZATION OF DEBT DISCOUNT |
PRINCIPAL PAYMENTS |
DECEMBER 31, 2013 |
|||||||||||||
| Principal |
$ | 9,139 | $ | — | $ | (9,139 | ) | $ | — | |||||||
| Discount related to Series C Warrant (1) |
(251 | ) | 251 | — | — | |||||||||||
| Discount related to financing costs (1) |
(514 | ) | 514 | — | — | |||||||||||
|
|
|
|
|
|
|
|
|
|||||||||
| $ | 8,374 | $ | 765 | $ | (9,139 | ) | $ | — | ||||||||
|
|
|
|
|
|
|
|
|
|||||||||
| (1) | The amortization of this account is included in interest expense in the consolidated statements of operations and non-cash interest expense in the consolidated statements of cash flows. |
On October 2, 2012, the Company borrowed $7,500,000 pursuant to senior notes (October 2012 Junior Secured Promissory Notes) with a group of lenders. The October 2012 Junior Secured Promissory Notes have an initial term of three years and can be extended for an additional two years in one year increments. During the initial three-year term, the October 2012 Junior Secured Promissory Notes bear interest at 12% per annum. If the term of the October 2012 Junior Secured Promissory Notes is extended an additional year, the interest rate increases to 13% during the fourth year. If the term of the October 2012 Junior Secured Promissory Notes is extended for an additional two years, the interest rate is 14% during the fifth year. Interest on the October 2012 Junior Secured Promissory Notes is payable monthly through the initial maturity date of the loan which is October 2, 2015 or through any extension period. The principal and all unpaid interest are due on the maturity date, as may be extended.
As part of the terms of the October 2012 Junior Secured Promissory Notes, the Company is required to pay a fee of 5% of the funded principal amount to the agent that facilitated the borrowing and provides management of the relationship with the group of lenders (Agent Fee). This Agent Fee is payable within 30 days after all interest and principal have been paid. For each year the Company extends the maturity date of the October 2012 Junior Secured Promissory Notes beyond the initial term, the agent will receive an additional 1% fee based on the funded principal amount. The present value of the unpaid Agent Fee, based on 5% of the funded principal amount, or $261,000, as of the closing date of the October 2012 Junior Secured Promissory Notes was recorded as both deferred financing costs as a component of current and non-current other assets and non-current other liabilities. The amortization of the deferred financing costs and the accretion of the Agent Fee are recorded to interest expense over the term of the arrangement. As of December 31, 2013 and 2012, $502,000 and $270,000, respectively, of the Agent Fee, including the amounts relating to the additional funds received from the issuance of the April 2013 Junior Secured Promissory Notes discussed below, was recorded under non-current other liabilities. In addition, the Company incurred an additional $66,000 in financing-related costs, primarily legal fees. These costs were recorded as deferred financing costs as a component of current and non-current other assets and are being amortized to interest expense over the term of the arrangement.
The October 2012 Junior Secured Promissory Notes are secured by the Company’s ownership interest in MMM LLC, a security interest in the assets of the Manufacturing Plant, and all of the Company’s other assets, subject to certain permitted liens. This security interest was subordinate to the security interest held by the holders of the April 2012 Senior Secured Promissory Note as described above, which also had a security interest in MMM LLC.
The Company also issued warrants (Common Stock Warrants) to the group of lenders to purchase a number of shares of common stock equal to 15% of the funded principal amount of the October 2012 Junior Secured Promissory Notes divided by 70% of the value of common stock in a sale of the Company or a Qualified IPO, with such Common Stock Warrants having an exercise price of 70% of the value of common stock in a sale of the Company or a Qualified IPO. The Common Stock Warrants would be automatically exercised immediately prior to expiration on the earlier to occur of a Qualified IPO or a sale of the Company or the maturity of the October 2012 Junior Secured Promissory Notes. The October 2012 Junior Secured Promissory Notes could be prepaid six months after the initial funding date or earlier if a Qualified IPO or a sale of the Company occurs. As the predominant settlement feature of
F-25
Table of Contents
the Common Stock Warrants is to settle a fixed monetary amount in a variable number of shares, the Common Stock Warrants were accounted for under ASC 480. Accordingly, the Common Stock Warrants were recorded at estimated fair value on their issuance date and were adjusted to their estimated fair value as of each reporting date with the change in estimated fair value recorded as a component of change in estimated fair value of financial instruments in the Company’s consolidated statements of operations. The fair value of the Common Stock Warrants at the date of issuance of $282,000 was recorded as a discount to the October 2012 Junior Secured Promissory Notes and is being amortized to interest expense over the term of the arrangement. Until the effective date of the IPO, the Company estimated the fair value of the Common Stock Warrants using a PWERM valuation based on unobservable inputs, and, therefore, the Common Stock Warrants were considered to be Level 3 liabilities. Upon closing of the IPO, the exercise price of the Common Stock Warrants was determined to be $8.40 per share and the number of shares to be issued upon exercise of the warrants was no longer variable. As a result of the IPO, the Common Stock Warrants were considered to be indexed to the Company’s stock, and accordingly, the common stock warrants liability was reclassified and included in stockholders’ equity (deficit) during the year ended December 31, 2013.
The October 2012 Junior Secured Promissory Notes contain certain covenant requirements which include a requirement to maintain a minimum cash balance of the lesser of the April 2012 Senior Secured Promissory Note indebtedness described above or $5,000,000. As discussed above, the April 2012 Senior Secured Promissory Note was fully paid off in January 2013. The Company is also precluded from adding additional debt without lender approval unless such debt is subordinated to the October 2012 Junior Secured Promissory Notes and not more than $2,000,000. In the event of default on the October 2012 Junior Secured Promissory Notes, the lenders may declare the entire unpaid principal and interest immediately due and payable.
On April 10, 2013 (Conversion Date), the Company entered an amendment to increase, by up to $5,000,000, the amount available under the terms of the loan agreement with respect to the October 2012 Junior Secured Promissory Notes. Under this amendment, an additional $4,950,000 was issued in partial consideration for $3,700,000 in cash received and in partial conversion for the cancellation of $1,250,000 of the total principal balance of the October 2012 Subordinated Convertible Note described below (collectively, April 2013 Junior Secured Promissory Notes). The total amount borrowed under the amended loan agreement for the October 2012 Junior Secured Promissory Notes and the April 2013 Junior Secured Promissory Notes increased from $7,500,000 to $12,450,000 as of the Conversion Date. The accrued interest of $74,000 for the partially converted October 2012 Subordinated Convertible Note as of the Conversion Date shall be repaid or converted on the applicable maturity date of the October 2012 Subordinated Convertible Note.
In connection with the issuance of the April 2013 Junior Secured Promissory Notes, the Company issued additional warrants (Additional Common Stock Warrants) to purchase a number of shares of common stock equal to 20% of the funded principal amount of the April 2013 Junior Secured Promissory Notes divided by 70% of the value of common stock in a sale of the Company or a Qualified IPO, with such Additional Common Stock Warrants to have an exercise price of 70% of the value of common stock in a sale of the Company or a Qualified IPO. As the predominant settlement feature of the Additional Common Stock Warrants was to settle a fixed monetary amount in a variable number of shares, the Common Stock Warrants were accounted for under ASC 480. Accordingly, the Additional Common Stock Warrants were recorded at estimated fair value on their issuance date and were adjusted to their estimated fair value as of each reporting date with the change in estimated fair value recorded as a component of change in estimated fair value of financial instruments in the Company’s consolidated statements of operations. The fair value of the Additional Common Stock Warrants at the date of issuance was estimated to be $465,000. The Company estimated the fair value of the Additional Common Stock Warrants using a PWERM valuation based on unobservable inputs and, therefore, the Additional Common Stock Warrants were considered to be Level 3 liabilities. Upon closing of the IPO, the exercise price of the Common Stock Warrants was determined to be $8.40 per share and the number of shares to be issued upon exercise of the warrants was no longer variable. As a result of the IPO, the Common Stock Warrants were considered to be indexed to the Company’s stock, and accordingly, the common stock warrants liability was reclassified and included in stockholders’ equity (deficit) during the year ended December 31, 2013.
The debt holder who converted $1,250,000 principal balance of the October 2012 Subordinated Convertible Note (with a fair value of $1,360,000 on the date of conversion) also loaned an additional $2,500,000 in cash as part of the April 2013 Junior Secured Promissory Notes (collectively, the $3,750,000 Notes). The Company accounted for
F-26
Table of Contents
the conversion as an extinguishment of debt in accordance with ASC 470-50-40. The $1,360,000 fair value of the partially converted October 2012 Subordinated Convertible Note on the Conversion Date was derecognized and the fair value of the $3,750,000 Notes with the portion of the fair value of the Additional Common Stock Warrants issued to this debt holder on the date of issuance was recorded. The Company recorded the $49,000 excess of the total fair value of the $3,750,000 Notes and the related Additional Common Stock Warrants on the issuance date over total consideration received as a gain on extinguishment of debt in the accompanying consolidated statements of operations for the year ended December 31, 2013.
The following table shows the consideration received, fair values of the notes and common stock warrants issued and calculation of the gain on extinguishment of debt for the $3,750,000 Notes (in thousands):
| Consideration received |
||||
| Fair Value of October 2012 Subordinated Convertible Note |
$ | 1,360 | ||
| Cash |
2,500 | |||
|
|
|
|||
| Total Consideration Received (a) |
$ | 3,860 | ||
| Notes and Warrants Issued |
||||
| Principal Balance of Notes Issued |
$ | 3,750 | ||
| Debt Discount (1) |
(291 | ) | ||
|
|
|
|||
| Fair Value of Notes Issued |
3,459 | |||
| Fair Value of Additional Common Stock Warrants Issued |
352 | |||
|
|
|
|||
| Total Fair Value of Notes and Warrants Issued (b) |
$ | 3,811 | ||
|
|
|
|||
| Gain on Extinguishment of Debt (a—b) |
$ | 49 | ||
|
|
|
| (1) | The amortization of this account is being recorded in interest expense in the consolidated statements of operations over the term of the arrangement. |
The remaining fair value to the Additional Common Stock Warrants of $113,000, net of the fair value of the Additional Common Stock Warrants issued of $352,000 related to the $3,750,000 Notes discussed above, was recorded as a debt discount to the April 2013 Junior Secured Promissory Notes and is being amortized to interest expense over the term of the arrangement.
As a result of the amendment described above, the Company is also required to pay the Agent Fee, 5% of the $3,700,000 in cash received from the April 2013 Junior Secured Promissory Notes, under the same terms as the October 2012 Junior Secured Promissory Notes. In addition, the portion of the Agent Fee relating to the converted October 2012 Subordinated Convertible Note that would be due under the terms of the October 2012 Subordinated Convertible Note will be paid under the terms of the October 2012 and April 2013 Junior Secured Promissory Notes. The present value of the unpaid Agent Fee of $172,000, based on 5% of the funded principal amount of $4,950,000, as of the closing date of the April 2013 Junior Secured Promissory Notes was recorded as both deferred financing costs as a component of current and non-current other assets and non-current other liabilities. The amortization of the deferred financing costs and the accretion of the Agent Fee are being amortized to interest expense over the term of the arrangement.
In addition, the Company incurred an additional $24,000 in financing-related costs, primarily legal fees. These costs were recorded as deferred financing costs as a component of current and non-current other assets and are being amortized to interest expense over the term of the arrangement.
The amendment to the loan agreement also amended the interest provision applicable to the October 2012 and April 2013 Junior Secured Promissory Notes to allow any holder of the October 2012 and April 2013 Junior Secured Promissory Notes to request the Company to defer all interest due monthly to the applicable maturity date, and the optional prepayment provision applicable to the October 2012 and April 2013 Junior Secured Promissory Notes to allow the Company to repay the outstanding amount of the October 2012 and April 2013 Junior Secured Promissory Notes, either (i) with the written consent of the lender or the agent on such lenders’ behalf or (ii) without such consent provided that the Company pays the interest that would have been due from the prepayment date to the initial maturity date.
F-27
Table of Contents
Activity related to the October 2012 and April 2013 Junior Secured Promissory Notes from December 31, 2012 through December 31, 2013 consisted of the following (in thousands):
| DECEMBER 31, 2012 |
ADDITIONS | AMORTIZATION OF DEBT DISCOUNT |
PRINCIPAL PAYMENTS |
DECEMBER 31, 2013 |
||||||||||||||||
| Principal |
$ | 7,500 | $ | 4,950 | $ | — | $ | — | $ | 12,450 | ||||||||||
| Debt discount related to issuance of common stock warrants (1) |
(258 | ) | (113 | ) | 130 | — | (241 | ) | ||||||||||||
| Discount related to the $3,750,000 Notes (1) |
— | (291 | ) | 87 | — | (204 | ) | |||||||||||||
|
|
|
|
|
|
|
|
|
|
|
|||||||||||
| $ | 7,242 | $ | 4,546 | $ | 217 | $ | — | $ | 12,005 | |||||||||||
|
|
|
|
|
|
|
|
|
|
|
|||||||||||
| (1) | The amortization of this account is included in interest expense in the consolidated statements of operations and as non-cash interest expense in the consolidated statements of cash flows. |
On June 14, 2013, the Company entered into a credit facility agreement (June 2013 Credit Facility) with a group of lenders that are, or that are affiliated with, existing investors in the Company. Under the June 2013 Credit Facility, the lenders have committed to permit the Company to draw an aggregate of up to $5,000,000, and, subject to the Company’s obtaining additional commitments from lenders, such amount may be increased to up to $7,000,000. The June 2013 Credit Facility expires on June 30, 2014. During the term of the June 2013 Credit Facility, the Company may request from the lenders up to four advances, with each advance equal to one-quarter of each lender’s aggregate commitment amount. The Company will issue a promissory note in the principal amount of each such advance that will accrue interest at a rate of 10% per annum. The principal and all unpaid interest under the promissory notes are due on the maturity date, and the Company may not prepay the promissory notes prior to the maturity date without consent of at least a majority in interest of the aggregate principal amount of the promissory notes then outstanding under the credit facility. In connection with the June 2013 Credit Facility, the Company agreed to pay a fee of 2% of the total commitment amount to the lenders. In addition, the Company incurred an additional $10,000 in financing-related costs, primarily legal fees. These costs were recorded as deferred financing costs as a component of current other assets and are being amortized to interest expense over the term of the arrangement.
In connection with the June 2013 Credit Facility, the Company issued warrants (June 2013 Warrants) to purchase a number of shares of common stock equal to 10% of the total committed amount of the June 2013 Credit Facility divided by 70% of the value of common stock in a sale of the Company or a Qualified IPO, with such June 2013 Warrants to have an exercise price of 70% of the value of common stock in a sale of the Company or a Qualified IPO. The June 2013 Warrants expire upon the earlier of June 14, 2023 or the sale of the Company. As the predominant settlement feature of the June 2013 Warrants was to settle a fixed monetary amount in a variable number of shares, the June 2013 Warrants were accounted for under ASC 480. Accordingly, the June 2013 Warrants were recorded at estimated fair value on their issuance date and were adjusted to their estimated fair value as of each reporting date with the change in estimated fair value recorded as a component of change in estimated fair value of financial instruments in the Company’s consolidated statements of operations. The fair value of the June 2013 Warrants at the date of issuance of $435,000 was recorded as a deferred financing cost as a current other asset and is being amortized to interest expense over the term of the arrangement. Until the effective date of the IPO, the Company estimated the fair value of the June 2013 Warrants using a PWERM valuation based on unobservable inputs and, therefore, the June 2013 Warrants were considered to be Level 3 liabilities. Upon closing of the IPO, the exercise price of the June 2013 Warrants was determined to be $8.40 per share and the number of shares to be issued upon exercise of the warrants was no longer variable. As a result of the IPO, the June 2013 Warrants were considered to be indexed to the Company’s stock, and accordingly, the common stock warrants liability was reclassified and included in stockholders’ equity (deficit) during the year ended December 31, 2013.
During the year ended and as of December 31, 2013, there were no amounts outstanding under the June 2013 Credit Facility.
F-28
Table of Contents
The Company is also required to comply with certain affirmative and negative covenants under the debt agreements discussed above. In the event of default on the debt, the lender(s) may declare the entire unpaid principal and interest immediately due and payable. As of December 31, 2013, the Company was in compliance with all of the affirmative and negative covenants, and there were no events of default, as defined in the agreements, related to the debt.
9. Convertible Notes Payable
Convertible notes payable consists of the following (in thousands):
| MATURITY DATE |
DECEMBER 31 | |||||||||
| 2013 | 2012 | |||||||||
| Convertible notes (March 2012 Convertible Notes) bearing interest at 10.00% per annum issued in March and April 2012. The convertible notes were converted to common stock in August 2013 |
September 2013 | $ | — | $ | 20,204 | |||||
| Convertible note (October 2012 Convertible Note) bearing interest at 10.00% per annum issued in October 2012. The convertible note was converted to common stock in August 2013 |
September 2013 | — | 2,314 | |||||||
|
|
|
|
|
|||||||
| Convertible notes payable, current portion |
— | 22,518 | ||||||||
| Convertible note (October 2012 Subordinated Convertible Note) bearing interest at 12.00% per annum issued in October 2012. The convertible note was converted to common stock in August 2013 |
October 2015 | — | 2,797 | |||||||
| Convertible note (December 2012 Convertible Note) bearing interest at 10.00% per annum issued in December 2012. The convertible note was converted to common stock in August 2013 |
October 2015 | — | 16,545 | |||||||
| Convertible notes (First May 2013 Convertible Notes) bearing interest at 10.00% per annum issued in May 2013. The convertible notes were converted to common stock in August 2013 |
May 2016 | — | — | |||||||
| Convertible note (Second May 2013 Convertible Note) bearing interest at 10.00% per annum issued in May 2013. The convertible note was converted to common stock in August 2013 |
May 2016 | — | — | |||||||
|
|
|
|
|
|||||||
| Total convertible notes payable |
$ | — | $ | 41,860 | ||||||
|
|
|
|
|
|||||||
March 2012 and October 2012 Convertible Notes
During March 2012 through April 2012, the Company issued and sold in a series of closings $8,076,000 of convertible notes (March 2012 Convertible Notes) to existing preferred stockholders. During October 2012, the Company issued an additional $1,000,000 convertible note (October 2012 Convertible Note) to another existing preferred stockholder. Collectively, the March 2012 Convertible Notes and the October 2012 Convertible Note are referred to as the “March and October 2012 Convertible Notes,” and they accrued interest at 10% per annum. The principal and accrued interest then outstanding under the March and October 2012 Convertible Notes (Outstanding Balance) would mature on September 30, 2013 (Maturity Date) or earlier, at which time all such Outstanding Balance would automatically convert into a new series of preferred stock to be authorized immediately prior to the Maturity Date.
Under the terms of the notes, if the Company closed an initial public offering in which the Company received gross cash proceeds, before underwriting discounts, commissions and fees, of at least $30,000,000 (a Qualified IPO) or a sale of substantially all of the Company’s assets or a series of transactions that result in the transfer of more than 50% of the Company’s outstanding voting power (an Acquisition), the Outstanding Balance of the March 2012 Convertible Notes would automatically convert into shares of the Company’s common stock at a rate of 70% of the per share price of the Company’s common stock sold in the Qualified IPO or the Acquisition. In the event of a Qualified IPO or Acquisition, the Outstanding Balance of the October 2012 Convertible Note would automatically
F-29
Table of Contents
convert into shares of the Company’s common stock at a rate of 80% of the per share price of the Company’s common stock sold in the Qualified IPO or the Acquisition. Upon the closing of the IPO on August 7, 2013, all outstanding principal and accrued interest of the March and October 2012 Convertible Notes converted into shares of the Company’s common stock at a rate of 70% and 80% of the per share price, respectively (See Note 20).
Alternatively, the Outstanding Balance would have been automatically converted into other new securities, as follows, if prior to closing the Qualified IPO or the Acquisition, the Company had closed an equity financing for an aggregate consideration of at least $5,000,000 (a Qualified Equity Financing). If prior to closing the Qualified IPO or the Acquisition, the Company had closed a Qualified Equity Financing, the Outstanding Balance of the March 2012 Convertible Notes would have converted into the equity securities issued in the equity financing at 80% of the purchase price of such securities. In the event of a Qualified Equity Financing, the Outstanding Balance of the October 2012 Convertible Note would have converted into the equity securities issued in the equity financing at 85% of the purchase price of such securities.
On the issuance date and at each reporting date prior to the conversion, the Company assessed the probability of the potential conversion scenarios under the terms of the March and October 2012 Convertible Notes and determined that the predominant settlement feature of the March and October 2012 Convertible Notes would have been the conversion of the March and October 2012 Convertible Notes into shares of the Company’s common stock issuable at a 30% or 20% discount to the per share price payable in connection with the completion of the Qualified IPO or Acquisition during the term of the arrangement. As the predominant settlement feature of the March and October 2012 Convertible Notes was to settle a fixed monetary amount in a variable number of shares, the March and October 2012 Convertible Notes fell within the scope of ASC 480. Accordingly, the March and October 2012 Convertible Notes were recorded at estimated fair value on their respective issuance dates and were adjusted to their estimated fair value as of each reporting date with the change in estimated fair value recorded as a component of change in estimated fair value of financial instruments in the Company’s consolidated statements of operations. As a result of the IPO, the number of shares to be issued became known and the Company estimated the fair value of the convertible notes immediately prior to the conversion using the intrinsic method based on the IPO price of $12.00 per share.
The Company estimated the fair value of the March and October 2012 Convertible Notes as of the issuance dates to be $9,343,000 and $1,772,000, respectively. As the Company received total cash proceeds of $9,076,000 through the issuance of the March and October 2012 Convertible Notes, the Company determined that $2,039,000 of the excess of the estimated fair value of the March and October 2012 Convertible Notes on the issuance dates over cash proceeds to the Company represented a deemed dividend to preferred stockholders, and this amount was reflected in the net loss attributable to common stockholders for the year ended December 31, 2012 in the Company’s consolidated statements of operations.
As of December 31, 2012 and immediately prior to the closing of the IPO on August 7, 2013, the estimated fair value of the March and October 2012 Convertible Notes was $22,518,000 and $14,599,000, respectively. Between December 31, 2012 and August 7, 2013, the estimated fair value of the March and October 2012 Convertible Notes decreased by $8,516,000, which was recognized as additional income in change in estimated fair value of financial instruments in the Company’s consolidated statements of operations for the year ended December 31, 2013.
For the year ended December 31, 2012, due to changes in the probability and timing of the completion of a Qualified IPO or an Acquisition between the dates of issuance and December 31, 2012, the estimated fair value of the March and October 2012 Convertible Notes increased by $10,721,000, which was recognized as additional expense in change in estimated fair value of financial instruments in the Company’s consolidated statements of operations for the year ended December 31, 2012.
As discussed above, the Company was not required to pay interest on the March and October 2012 Convertible Notes, but interest accrued as part of the principal balance under the March and October 2012 Convertible Notes and was converted, along with the initial principal, into common stock upon closing of the IPO in August 2013.
F-30
Table of Contents
October 2012 Subordinated Convertible Note
On October 16, 2012, the Company borrowed $2,500,000 pursuant to a convertible note (October 2012 Subordinated Convertible Note) from a lender. The October 2012 Subordinated Convertible Note had an initial term of three years. During the initial three-year term, the October 2012 Subordinated Convertible Note accrued interest at 12% per annum.
In April 2013, the Company entered an amendment to convert $1,250,000 of the outstanding principal balance of the October 2012 Subordinated Convertible Note to the April 2013 Junior Secured Promissory Notes, as defined and further discussed in Note 8. The accrued interest of $74,000 for the partially converted October 2012 Subordinated Convertible Note as of the Conversion Date was to be repaid or converted on the applicable maturity date of the October 2012 Subordinated Convertible Note. The Company accounted for the conversion as an extinguishment of debt in accordance with ASC 470-50-40 and derecognized the $1,360,000 fair value of the October 2012 Subordinated Convertible Note and recorded a $49,000 gain on extinguishment of debt which was reflected in the Company’s consolidated statements of operations. In addition, the portion of the Agent Fee relating to the converted October 2012 Subordinated Convertible Note that would be due under the terms of the October 2012 Subordinated Convertible Note will be paid under the terms of the October 2012 and April 2013 Junior Secured Promissory Notes. The amount of the unamortized converted Agent Fee on the date of conversion recorded under non-current other liabilities of $48,000 and the amount recorded as a component of current and non-current other assets of $39,000 was written-off and recorded as an adjustment to interest expense (See Note 8).
As part of the terms of the October 2012 Subordinated Convertible Note, the Company was required to pay the Agent Fee of 5% of the funded principal amount to the agent that facilitated the borrowing and provided management of the relationship with the lender and who also facilitated the October 2012 Junior Secured Promissory Notes discussed in Note 8 above. This Agent Fee was payable within 30 days after all interest and principal had been paid. For each year the Company extended the maturity date of the October 2012 Subordinated Convertible Note beyond the initial term, the agent would have received an additional 1% fee based on the funded principal amount. The present value of the unpaid Agent Fee, based on 5% of the funded principal amount, or $87,000, as of the closing date of the October 2012 Subordinated Convertible Note was recorded as both deferred financing costs as a component of current and non-current other assets and non-current other liabilities. The amortization of the deferred financing costs and the accretion of the Agent Fee were being amortized to interest expense over the term of the arrangement. As of December 31, 2013, the Agent Fee was fully amortized and paid. As of December 31, 2012, $89,000 of the Agent Fee, including the effect of the amendment of the October 2012 Subordinated Convertible Note discussed above, was recorded in current and non-current other liabilities, respectively. In addition, the Company incurred an additional $22,000 in financing-related costs, primarily legal fees. These costs were recorded as deferred financing costs as a component of current and non-current other assets and were amortized to interest expense over the term of the arrangement. As of December 31, 2013, these deferred financing costs were fully amortized.
Under the terms of the note, if the Company closed a Qualified IPO or an Acquisition, the October 2012 Subordinated Convertible Note and any accrued interest would automatically convert into shares of the Company’s common stock at a rate of 85% of the purchase price of common stock sold, provided the closing occurred on or prior to eighteen months from the issuance date of the October 2012 Subordinated Convertible Note. The conversion rate would have adjusted to 80% of the purchase price of such securities, if the closing had occurred on or after eighteen months from the issuance date of the October 2012 Subordinated Convertible Note through the date of maturity. Upon the closing of the IPO in August 2013, all outstanding principal and accrued interest of the October 2012 Subordinated Convertible Note were converted into shares of the Company’s common stock at a rate of 85% of the per share price (See Note 20).
On the issuance date and at each reporting date prior to the conversion, the Company assessed the probability of potential conversion under its terms of the October 2012 Subordinated Convertible Note and determined that the predominate settlement feature of the October 2012 Subordinated Convertible Note would have been the conversion of the October 2012 Subordinated Convertible Note into shares of the Company’s common stock issuable at a 15% or 20% discount to the per share price payable upon the completion of a Qualified IPO, an Acquisition, or Qualified
F-31
Table of Contents
Equity Financing. As the predominant settlement feature of the October 2012 Subordinated Convertible Note was to settle a fixed monetary amount into a variable number of shares, the October 2012 Subordinated Convertible Note fell within the scope of ASC 480. Accordingly, the October 2012 Subordinated Convertible Note was recorded at estimated fair value on its issuance date and was adjusted to its estimated fair value as of each reporting date with the change in estimated fair value recorded as a component of change in estimated fair value of financial instruments in the Company’s consolidated statements of operations. As a result of the IPO, the number of shares to be issued became known and the Company estimated the fair value of the convertible notes immediately prior to the conversion using the intrinsic method based on the IPO price of $12.00 per share.
The Company estimated the fair value of the October 2012 Subordinated Convertible Note as of the issuance date to be $2,662,000. As the Company received cash proceeds of $2,500,000 through the issuance of the October 2012 Subordinated Convertible Note, $162,000 of the excess of the estimated fair value of the October 2012 Subordinated Convertible Note on the issuance date over cash proceeds was recorded as additional interest expense for the year ended December 31, 2012 in the Company’s consolidated statements of operations.
As of December 31, 2012, the principal balance and the estimated fair value of the October 2012 Subordinated Convertible Note was $2,500,000 and $2,797,000, respectively. Immediately prior to the closing of the IPO in August 2013, the principal balance and the estimated fair value of the October 2012 Subordinated Convertible Note was $1,250,000 and $1,703,000, respectively. Between December 31, 2012 and August 7, 2013, the estimated fair value of the October 2012 Subordinated Convertible Note increased by $133,000, which was recognized as additional expense in change in estimated fair value of financial instruments in the Company’s consolidated statements of operations for the year ended December 31, 2013.
December 2012 Convertible Note
On December 6, 2012, the Company borrowed $12,500,000 pursuant to a convertible note (December 2012 Convertible Note) from an existing preferred stockholder that also is an affiliate of one of the Company’s distributors. The December 2012 Convertible Note had an initial maturity date of October 16, 2015. During the initial approximately three-year (two-year and ten-month) term, the December 2012 Convertible Note accrued interest at 10% per annum.
Under the terms of the note, the December 2012 Convertible Note could not have been pre-paid unless such prepayment was mandated by a sale event. A sale event as defined in the agreement was the transfer of substantially all of the Company’s assets, a transaction or series of transactions that result in the transfer of more than 50% voting power of the Company, or transactions that result in gross proceeds of at least $120,000,000 (Sale Event). In the case of a Sale Event, the holder could have elected to either convert all outstanding principal and accrued interest into shares of common stock in accordance with the conversion terms of this agreement or receive cash equal to the principal and accrued interest then outstanding multiplied by 133.33% if the Sale Event occurred prior to or as of June 30, 2013 or multiplied by 142.86% if the Sale Event occurred after June 30, 2013.
Under the terms of the note, a Qualified Financing meant an equity financing for which the gross proceeds were at least $20,000,000 and at least 50% of the amount invested comes from sources other than holders of the Company’s equity, strategic investors, or affiliates (Qualified Financing). In the event of a Qualified Financing, all outstanding principal and unpaid interest on the December 2012 Convertible Note would automatically convert into new securities issued and sold in such qualified financing at a rate of 75% of the purchase price of such new securities provided the closing occurred on or prior to June 30, 2013. The conversion rate would adjust to 70% of the purchase price of such new securities, if the closing occurred after June 30, 2013. Upon the closing of the IPO on August 7, 2013, all outstanding principal and accrued interest of the December 2012 Convertible Note was converted into shares of the Company’s common stock at a rate of 70% of the per share price (See Note 20).
In the event of a non-qualified financing (Non-Qualified Financing) or the Sale Event, the holder of the December 2012 Convertible Note would have had the right, but not the obligation, to convert all or a part of the outstanding principal and unpaid interest on the December 2012 Convertible Note into the same type of securities issued in the Non-Qualified Financing. A Non-Qualified Financing included either a convertible note financing or an equity transaction that did not qualify as a Qualified Financing.
F-32
Table of Contents
If the Non-Qualified Financing related to an equity financing or Sale Event, the number of shares of common stock or common stock equivalents to be received by the holder of the December 2012 Convertible Note would have been calculated by dividing the principal and unpaid accrued interest elected to be converted by the holder by a price per share equal to the price per share paid in the Non-Qualified Financing multiplied by a conversion discount.
If the Non-Qualified Financing related to a debt financing, the December 2012 Convertible Note holder would have received new convertible notes convertible into shares of common stock or common stock equivalents at a per share price equal to the conversion price per share applicable to the other convertible debt issued in the Non-Qualified Financing multiplied by a conversion discount. In each case, if the Non-Qualified Financing had occurred on or before June 30, 2013, the conversion rate would have been equal to 75%, and thereafter the conversion rate would have been equal to 70%.
On the issuance date and at each reporting date prior to the conversion, the Company assessed the probability of the potential conversion scenarios under the terms of the December 2012 Convertible Note and determined that the predominant settlement feature of the December 2012 Convertible Note was the conversion of the December 2012 Convertible Note into shares of the Company’s common stock issuable at a 25% or 30% discount to the per share price payable in connection with the completion of a Qualified Financing or a Sale Event during the term of the arrangement. As the predominant settlement feature of the December 2012 Convertible Note was to settle a fixed monetary amount into a variable number of shares, the December 2012 Convertible Note fell within the scope of ASC 480. Accordingly, the Company determined that the December 2012 Convertible Note should be recorded at estimated fair value on its issuance date and adjusted to its estimated fair value as of each reporting date with the change in estimated fair value recorded as a component of change in estimated fair value of financial instruments in the Company’s consolidated statements of operations. As a result of the IPO, the number of shares to be issued became known and the Company estimated the fair value of the convertible notes immediately prior to the conversion using the intrinsic method based on the IPO price of $12.00 per share.
Following the issuance of the December 2012 Convertible Note, the Company estimated the fair value of the December 2012 Convertible Note as of the issuance date using a PWERM valuation consisting of six scenarios. This valuation included three initial public offering scenarios, two merger scenarios and a sale of the Company’s intellectual property along with the applicable conversion ratios based on the estimated timing of each scenario. Based on this valuation, the Company estimated the fair value of the December 2012 Convertible Note to be $16,355,000 as of the issuance date. As the holder of the December 2012 Convertible Note was an affiliate of one of the Company’s distributors, the $3,855,000 excess of the estimated fair value of the December 2012 Convertible Note on the date of issuance over gross cash proceeds was recorded as a reduction of related party revenues to the extent of revenue recognized from the distributor totaling $245,000 ($110,000 related to license revenues and $135,000 related to product revenues), and the remaining excess of $3,610,000 was recorded separately to an operating expense in accordance with ASC 605-50, Customer Payments and Incentives (ASC 605-50), in the Company’s consolidated statements of operations for the year ended December 31, 2012.
As of December 31, 2012 and immediately prior to conversion on August 7, 2013, the estimated fair value of the December 2012 Convertible Note was $16,545,000 and $19,072,000, respectively. Between December 31, 2012 and August 7, 2013, the estimated fair value of the December 2012 Convertible Note increased by $1,767,000, which was recognized as additional expense in change in estimated fair value of financial instruments in the Company’s consolidated statements of operations for the year ended December 31, 2013.
For the year ended December 31, 2012, due to changes in the probability and timing of the completion of a Qualified IPO or an Acquisition between the dates of issuance and December 31, 2012, the estimated fair value of the December 2012 Convertible Note increased by $100,000, which was recognized as additional expense in change in estimated fair value of financial instruments in the Company’s consolidated statements of operations for the year ended December 31, 2012.
The December 2012 Convertible Note purchase agreement also required the Company to use the proceeds from this note to repay all outstanding obligations under the April 2012 Senior Secured Promissory Note within 35 days of closing as discussed in Note 8.
F-33
Table of Contents
First and Second May 2013 Convertible Notes
On May 22, 2013, the Company completed the sale of convertible notes under a convertible note purchase agreement in the amount of $3,529,000 in a private placement to 22 investors (First May 2013 Convertible Notes). The First May 2013 Convertible Notes accrued interest at a rate of 10% per annum and would have matured on May 22, 2016.
In addition, on May 28, 2013, the Company completed the sale of a convertible note under a separate convertible note purchase agreement in the amount of $3,000,000 in a private placement (Second May 2013 Convertible Note). The Second May 2013 Convertible Note accrued interest at a rate of 10% per annum and would have matured on May 30, 2016.
Under the terms of the notes, no payments were due under the First and Second May 2013 Convertible Notes until maturity. In an event of a Qualified Financing, all outstanding principal and accrued interest due under the First and Second May 2013 Convertible Notes would automatically convert into the number of shares of the Company’s common stock determined by dividing such unpaid amounts by 70% of the per share price of the Company’s common stock sold in such qualified financing. Upon the closing of the IPO in August 2013, all outstanding principal and accrued interest of the First and Second May 2013 Convertible Notes were converted into shares of the Company’s common stock at a rate of 70% of the per share price (See Note 20).
Alternatively, in the earlier event of a Non-Qualified Financing of equity or debt securities, the First and Second May 2013 Convertible Notes could have been converted, at the option of the holder, into the same type of securities issued in such financing, and in the earlier of a Sale Event, the First and Second May 2013 Convertible Notes would have been either, at the option of the holder, repaid in the amount of the principal and accrued interest then outstanding multiplied by 142.86% or converted at a discount into shares of the Company’s common stock.
If the Qualified Financing, Non-Qualified Financing, or Sale Event had not occurred from the date of issuance of the convertible note through January 14, 2014, the holder of the Second May 2013 Convertible Note would have been able to elect to convert all outstanding principal and accrued interest into a number of shares of common stock determined by dividing this amount by the greater of (i) the per share price into which the Outstanding Balance under the Second May Convertible Note would be converted at their maturity in the event a Qualified Financing had not occurred as of September 30, 2013 or (ii) the purchase price paid per share for the most recent Non-Qualified Financing that occurred prior to a Sale Event, provided such Non-Qualified Financing would have been at least $2,000,000 and at least 50% of the proceeds of such Non-Qualified Financing would have been from persons or entities who were not common stockholders, or common share equivalents or affiliates of the Company.
On the issuance date and at each reporting date prior to the conversion, the Company assessed the probability of potential conversion under its terms of the First and Second May 2013 Convertible Notes and determined that the predominate settlement feature of the First and Second May 2013 Convertible Notes was the conversion of the First and Second May 2013 Convertible Notes into shares of the Company’s common stock issuable at a 30% discount to the per share price payable upon the completion of a Qualified IPO, an Acquisition, or Qualified Equity Financing. As the predominant settlement feature of the First and Second May 2013 Convertible Notes was to settle a fixed monetary amount in a variable number of shares, the First and Second May 2013 Convertible Notes fell within the scope of ASC 480. Accordingly, the First and Second May 2013 Convertible Notes were recorded at estimated fair value on their issuance dates and were adjusted to estimated fair value as of each reporting date with the change in estimated fair value recorded as a component of change in estimated fair value of financial instruments in the Company’s consolidated statements of operations. As a result of the IPO, the number of shares to be issued became known and the Company estimated the fair value of the convertible notes immediately prior to the conversion using the intrinsic method based on the IPO price of $12.00 per share.
The Company estimated the fair value of the First May 2013 Convertible Notes as of the issuance date to be $4,907,000. As the Company received cash proceeds of $3,529,000 through the issuance of the First May 2013 Convertible Notes, the Company determined that $1,378,000 of the excess of the estimated fair value of the First May 2013 Convertible Notes on the issuance date over cash proceeds to the Company represented a deemed dividend to preferred stockholders, and this amount was reflected in the net loss attributable to common stockholders for the year ended December 31, 2013 in the Company’s consolidated statements of operations.
F-34
Table of Contents
Immediately prior to conversion in connection with the closing of the IPO on August 7, 2013, the estimated fair value of the First May 2013 Convertible Notes was $5,147,000. The estimated fair value of the First May 2013 Convertible Notes increased by $166,000 from the issuance date, which was recognized as additional expense in change in estimated fair value of financial instruments in the Company’s consolidated statements of operations for the year ended December 31, 2013.
The Company estimated the fair value of the Second May 2013 Convertible Note as of the issuance date to be $4,162,000. As the Company received cash proceeds of $3,000,000 through the issuance of the Second May 2013 Convertible Note, $1,162,000 of the excess of the estimated fair value of the Second May 2013 Convertible Note on the issuance date over cash proceeds to the Company was recorded as additional interest expense for the year ended December 31, 2013 in the Company’s consolidated statements of operations.
Immediately prior to conversion in connection with the closing of the IPO on August 7, 2013, the estimated fair value of the Second May 2013 Convertible Note was $4,369,000. The estimated fair value of the Second May 2013 Convertible Note increased by $149,000 from the issuance date, which was recognized as additional expense in change in estimated fair value of financial instruments in the Company’s consolidated statements of operations for the year ended December, 2013.
10. Preferred Stock
The Company sold 1,484,000 shares of its Series A convertible preferred stock in private placements in April 2007 for $2.608 per share, including conversion of certain convertible notes payable, 2,242,000 shares of its Series B convertible preferred stock in August 2008 for $4.849 per share, including conversion of convertible notes payable, and 4,778,000 shares of its Series C convertible preferred stock from March 2010 to June 2011 for $5.317 per share, including conversion of the $514,000 of convertible notes payable plus accrued interest of $5,000. The Company recorded the issuance of its Series A, B, and C convertible preferred stock, net of issuance costs.
In May 2012, in connection with the issuance of the Series C Warrant, the Company amended certificate of incorporation to increase the number of shares of common stock the Company is authorized to issue from 12,745,000 shares to 12,936,000 shares and to increase the number of shares of convertible preferred stock the Company is authorized to issue from 8,632,000 shares to 8,823,000, of which 1,489,000 shares were designated as Series A convertible preferred stock, 2,252,000 shares were designated as Series B convertible preferred stock, and 5,082,000 shares were designated as Series C convertible preferred stock.
Upon the closing of the IPO, all shares of the Company’s outstanding convertible preferred stock automatically converted into shares of common stock. Further, in August 2013, the Company amended and restated its certificate of incorporation to effect the conversion of its outstanding convertible preferred stock into common stock on a 1-for-1 basis. The amendment also increased the number of shares of preferred stock authorized for issuance to 20,000,000.
Investors in the Company’s Series C convertible preferred stock were entitled to receive noncumulative dividends, before and in preference to any amounts paid to Series A and Series B convertible preferred stockholders and common stockholders, and investors in the Company’s Series A and B convertible preferred stock were entitled to receive noncumulative dividends, on a pari passu basis, before and in preference to any amounts paid to common stockholders. Dividends would be paid only when and if declared by the board of directors. In addition, these investors were entitled to voting rights equal to the number of shares of the Company’s common stock into which the Series A, B and C convertible preferred stock were convertible as of the close of business on the record date fixed for each stockholder’s meeting. No dividends were declared during the years ended December 31, 2013 and 2012.
As the Company’s Series A, B and C convertible preferred stock contained redemption features that were outside of the Company’s control, all shares of Series A, B and C convertible preferred stock were presented outside of permanent equity as of December 31, 2012.
F-35
Table of Contents
11. Warrants
The following table summarizes information about the Company’s common stock warrants outstanding as of December 31, 2013 (in thousands, except exercise price data):
| DESCRIPTION |
ISSUE DATE | EXPIRATION DATE (1) |
NUMBER OF SHARES SUBJECT TO WARRANTS ISSUED |
EXERCISE PRICE |
||||||||
| In connection with April 2013 Junior Secured Promissory Note (Additional Common Stock Warrants) |
April 2013 | October 2015 | 118 | $ | 8.40 | |||||||
| In connection with June 2013 Credit Facility (June 2013 Warrants) |
June 2013 | June 2023 | 33 | $ | 8.40 | |||||||
|
|
|
|||||||||||
| 151 | ||||||||||||
|
|
|
|||||||||||
| (1) | Both the common stock warrants expire upon the earlier to occur of (i) the date listed above; (ii) the acquisition of the Company by another entity by means of any transaction or series of related transactions (including, without limitation, any transfer of more than 50% of the voting power of the Company, reorganization, merger or consolidation, but excluding any merger effected exclusively for the purpose of changing the domicile of the Company) or (iii) a sale of all or substantially all of the assets of the Company; unless the Company’s stockholders of record as constituted immediately prior to such acquisition or sale will, immediately after such acquisition or sale (by virtue of securities issued as consideration for the Company’s acquisition or sale or otherwise) hold at least fifty percent (50%) of the voting power of the surviving or acquiring entity. |
The Additional Common Stock Warrants are exercisable 18 months after the consummation of the IPO and the June 2013 Warrants became exercisable on the date of the IPO.
The following table summarizes information about the Company’s convertible preferred stock and common stock warrants outstanding as of December 31, 2012 (in thousands, except exercise price data):
| DESCRIPTION |
ISSUE DATE | EXPIRATION DATE |
NUMBER OF SHARES SUBJECT TO WARRANTS ISSUED |
EXERCISE PRICE |
ESTIMATED FAIR VALUE AS OF DECEMBER 31, 2012 (2) |
|||||||||||
| In connection with loan agreement (Series A convertible preferred stock) |
April 2007 | April 2014 | 6 | $ | 2.608 | $ | 68 | |||||||||
| In connection with promissory note and revolving line of credit (Series B convertible preferred stock) |
August 2008 | May 2013 | 3 | $ | 4.849 | 34 | ||||||||||
| In connection with promissory note (Series B convertible preferred stock) |
March 2009 | March 2014 | 7 | $ | 4.849 | 72 | ||||||||||
| In connection with April 2012 Senior Secured Promissory Note (Series C convertible preferred stock) |
April 2012 | April 2022 | 191 | $ | 7.846 | 1,710 | ||||||||||
| In connection with October 2012 Junior Secured Promissory Note (Common stock) (1) |
October 2012 | October 2015 | — | $ | — | 301 | ||||||||||
|
|
|
|
|
|||||||||||||
| 207 | $ | 2,185 | ||||||||||||||
|
|
|
|
|
|||||||||||||
| (1) | As of December 31, 2012, the Company had issued warrants to purchase shares of common stock equal to 15% of the funded principal amount of the October 2012 Junior Secured Promissory Notes (See Note 8) divided by 70% of the value of common stock in a sale of the Company or an IPO, with an exercise price of 70% of the value of common stock in a sale of the Company or IPO. These warrants were contingently exercisable for which the contingencies related to exercise had not been met as of December 31, 2012. |
| (2) | See Note 2 for discussion of the methods used to determine the estimated fair values of the preferred stock warrants and common stock warrants. |
F-36
Table of Contents
All of the preferred stock warrants and the common stock warrants issued in connection with the October 2012 Junior Secured Promissory Notes were exercised in 2013 in connection with the IPO. In addition, a portion of the warrants issued in connection with the June 2013 Warrants were exercised in 2013 in connection with the IPO (See Note 20).
12. Common Stock
In August 2013, the Company amended and restated its certificate of incorporation to increase the number of shares of common stock authorized for issuance to 250,000,000 shares with $0.00001 par value. As of December 31, 2013, the Company had reserved shares of common stock for future issuances as follows (in thousands):
| SHARES | ||||
| Stock options available for future grant |
1,194 | |||
| Stock options outstanding |
2,608 | |||
| Warrants to purchase common stock |
151 | |||
|
|
|
|||
| 3,953 | ||||
|
|
|
|||
13. Stock Option Plans
In July 2006, the Company authorized the 2006 Equity Incentive Plan, as amended, (2006 Plan). The 2006 Plan provided for the issuance of up to 1,434,000 shares of common stock underlying awards. The 2006 Plan was terminated in December 2011. As of December 31, 2013 and 2012, there were no shares available to be granted under the 2006 Equity Incentive Plan.
The 2006 Plan allowed holders to exercise stock options prior to their vesting. The common stock received by the employee is restricted and follows the same vesting schedule as the originally granted option. In the event the employee terminates employment from the Company (whether voluntary or involuntary), the Company retains a right to repurchase the unvested common stock at the original option exercise price. As of December 31, 2013 and 2012, no options had been exercised that would be subject to repurchase.
As of December 31, 2013, options to purchase 705,000 shares of the Company’s common stock at a weighted-average exercise price of $1.04 per share were outstanding under the 2006 Plan, of which 624,000 were vested at December 31, 2013. During the year ended December 31, 2013, 204,000 and 116,000 options were exercised and canceled, respectively, under the 2006 Plan.
In July 2011 and as amended in September 2012, the Company authorized the 2011 Stock Plan (2011 Plan). The 2011 Plan provided for the issuance of up to 1,167,000 shares of common stock underlying awards, plus any shares of common stock underlying awards previously issued under the 2006 Plan that terminate or expire after the date of authorization of the 2011 Plan, subject to certain adjustments. In addition, the 2011 Plan provided that the Company not deliver more than 2,446,000 shares upon the exercise of incentive stock options issued under both the 2006 Plan and 2011 Plan. The 2011 Plan was terminated in August 2013 and no new stock awards may be granted under the 2011 Plan. As of December 31, 2013, there were no shares available to be granted under the 2011 Plan.
As of December 31, 2013, options to purchase 1,131,000 shares of the Company’s common stock at a weighted-average exercise price of $7.67 per share were outstanding under the 2011 Plan, of which 420,000 were vested at December 31, 2013. During the year ended December 31, 2013, 13,000 and 120,000 options were exercised and canceled, respectively, under the 2011 Plan.
In August 2013, the Company’s Board of Directors adopted the 2013 Stock Incentive Plan (2013 Plan) covering officers, employees, directors of, and consultants to, the Company. The 2013 Plan allows for the granting of the following types of “stock awards”: incentive stock options, non-qualified stock options, stock appreciation rights, restricted stock, restricted stock units and dividend equivalent rights. At the time the 2013 Plan was established, the maximum aggregate number of shares of the Company’s common stock that could be issued pursuant to the
F-37
Table of Contents
2013 Plan was 1,600,000 plus the number of shares of common stock reserved for issuance pursuant to future grants under the 2011 Plan. The number of shares authorized for issuance pursuant to the 2013 Plan is automatically increased by any additional shares that would have otherwise returned to the 2011 Plan as a result of the forfeiture, termination or expiration of awards previously granted under the 2011 Plan. In addition, the number of shares authorized for issuance pursuant to the 2013 Plan will increase by a number equal to the least of (i) 3.5% of the number of shares of the Company’s common stock outstanding on the last day of the immediately preceding fiscal year or (ii) a lesser number of shares determined by the administrator.
As of December 31, 2013, options to purchase 772,000 shares of the Company’s common stock at a weighted-average exercise price of $16.74 per share were outstanding under the 2013 Plan, of which 11,000 were vested at December 31, 2013. During the year ended December 31, 2013, no options were exercised and 42,000 options were canceled under the 2013 Plan.
Generally, options vest 25% on the first anniversary from the date of grant and 1/48 per month thereafter; however, options may be granted with different vesting terms as determined by the Company’s Board of Directors.
The following table summarizes the activity under the Company’s stock option plans for the year ended December 31, 2013 (in thousands, except exercise price and remaining contractual life data):
| SHARES AVAILABLE FOR GRANT |
SHARES OUTSTANDING |
WEIGHTED- AVERAGE EXERCISE PRICE |
WEIGHTED- AVERAGE REMAINING CONTRACTUAL LIFE (IN YEARS) |
AGGREGATE INTRINSIC VALUE |
||||||||||||||||
| Balances at December 31, 2012 |
352 | 2,067 | $ | 3.86 | 7.7 | $ | 14,380 | |||||||||||||
| Options authorized |
1,600 | — | ||||||||||||||||||
| Options granted |
(1,036 | ) | 1,036 | $ | 15.76 | |||||||||||||||
| Options exercised |
— | (217 | ) | $ | 1.18 | |||||||||||||||
| Options canceled |
278 | (278 | ) | $ | 6.24 | |||||||||||||||
|
|
|
|
|
|||||||||||||||||
| Balances at December 31, 2013 |
1,194 | 2,608 | $ | 8.56 | 8.1 | $ | 24,158 | |||||||||||||
|
|
|
|
|
|||||||||||||||||
| Vested and expected to vest at December 31, 2013 |
2,409 | $ | 8.25 | 8.0 | $ | 23,061 | ||||||||||||||
|
|
|
|||||||||||||||||||
| Exercisable at December 31, 2013 |
1,054 | $ | 2.97 | 6.5 | $ | 15,610 | ||||||||||||||
|
|
|
|||||||||||||||||||
The total intrinsic value of options exercised for the years ended December 31, 2013, 2012 and 2011 were $2,801,000, $93,000 and $7,000, respectively.
The estimated fair value of options vested during the years ended December 31, 2013, 2012 and 2011, was $1,314,000, $489,000 and $228,000, respectively. The weighted-average estimated fair value of options granted during the years ended December 31, 2013, 2012 and 2011 was $10.35 per share, $4.24 per share and $0.78 per share, respectively.
During the years ended December 31, 2013, 2012 and 2011, the Company recorded share-based compensation expense of $2,300,000, $662,000 and $271,000, respectively. For the years ended December 31, 2013, 2012 and 2011, the Company did not realize any tax benefit associated with its share-based compensation expense. No tax benefit was recognized because a portion of the option grants were ISOs for which stock-based compensation expense is not deductible and also due to the full valuation allowance on the Company’s deferred tax asset that is further discussed in Note 16.
As of December 31, 2013, with the exception of unvested options granted to Donald Glidewell for which the vesting will be accelerated through his retirement date of March 31, 2013 (see below), the total share-based compensation expense related to unvested options granted to employees under the Company’s stock option plans but not yet recognized was $10,454,000. These costs will be amortized to expense on a straight-line basis over a weighted-average remaining term of 3.3 years.
F-38
Table of Contents
In connection with Mr. Glidewell’s retirement, the Company entered into a transition agreement with Mr. Glidewell (See Note 6) which provides, among other things, for the vesting of his outstanding equity awards through the retirement date. For the year ended December 31, 2013, the Company recorded share-based compensation expense of $266,000 relating to the acceleration of vesting of Mr. Glidewell’s option awards. The total share-based compensation expense related to unvested options granted to Mr. Glidewell under the Company’s stock option plans but not yet recognized was $444,000. These costs will be amortized to expense on a straight-line basis over a weighted-average remaining term of 0.3 years.
14. Capital Leases
The Company accounts for certain equipment acquired under financing arrangements as capital leases. This equipment is included in property, plant and equipment and related amortization is included in depreciation expense.
As of December 31, 2013 and 2012, the cost of this equipment was $3,046,000 and $939,000, respectively, and the related accumulated amortization was $935,000 and $465,000, respectively.
Amortization of capital leases for the years ended December 31, 2013, 2012 and 2011 was $470,000, $175,000 and $143,000, respectively.
As of December 31, 2013, aggregate contractual future minimum lease payments on the capital leases are due as follows (in thousands):
| CAPITAL LEASES |
||||
| Years ending December 31: |
||||
| 2014 |
$ | 1,520 | ||
| 2015 |
1,120 | |||
| 2016 |
54 | |||
|
|
|
|||
| Total minimum payments required |
2,694 | |||
| Less: amount representing interest |
(159 | ) | ||
|
|
|
|||
| Present value of future payments |
2,535 | |||
| Less: current portion |
(1,401 | ) | ||
|
|
|
|||
| $ | 1,134 | |||
|
|
|
|||
15. Commitments and Contingencies
Operating Leases
The Company has a non-cancelable lease for an aggregate of approximately 24,500 square feet of non-contiguous office space in an office complex in Davis, California under which a portion of the covered space terminates between February 2014 and October 2016. A portion of the lease that terminates in February 2015 provides for an option to extend the term for five years at the then prevailing market rent. The lease includes negotiated annual increases in the monthly rental payments.
On September 9, 2013, the Company entered into a lease agreement for a new 28,700 square foot office and laboratory facility located in Davis, California. The initial term of the lease is for a period of 60 months commencing on the later of the date of substantial completion of initial improvements to the leased property, or May 1, 2014. The monthly base rent is $46,000 for the first 12 months with a 3% increase each year thereafter. The Company will have the option to extend the lease term twice for a period of five years each.
F-39
Table of Contents
The Company recognizes expense under its leases on a straight-line basis over the lease terms. At December 31, 2013, the Company’s aggregate commitment under non-cancelable lease agreements is as follows (in thousands):
| OPERATING LEASES |
||||
| Years ending December 31: |
||||
| 2014 |
$ | 965 | ||
| 2015 |
753 | |||
| 2016 |
666 | |||
| 2017 |
606 | |||
| 2018 and beyond |
822 | |||
|
|
|
|||
| Total minimum payments required |
$ | 3,812 | ||
|
|
|
|||
Rental expense charged to operations for all operating leases was $691,000, $484,000 and $412,000 for the years ended December 31, 2013, 2012 and 2011, respectively.
Contingencies
The Company is subject to legal proceedings and claims that arise in the normal course of business. As of December 31, 2013, there were no current proceedings or litigation involving the Company that management believes would have a material adverse impact on its business, financial position, results of operations or cash flows.
16. Income Taxes
As of December 31, 2013, the Company had net operating loss carry-forwards for federal income tax reporting purposes of $77,682,000, which begin to expire in 2026, and California and various other state net operating loss carry-forwards of $59,829,000 and $13,656,000, respectively, which begin to expire in 2016 and 2031, respectively. Additionally, as of December 31, 2013, the Company had federal research and development tax credit carry-forwards of $1,414,000, which begin to expire in 2026, and state research and development tax credit carry-forwards of $1,274,000, which have no expiration date.
As of December 31, 2013, deferred tax assets of $34,250,000, arising principally as a result of the Company’s net operating loss carry-forwards, tax credits, and certain costs capitalized for tax purposes during the Company’s development stage, were fully offset by a valuation allowance. The valuation allowance increased by $11,850,000, $8,134,000 and $5,211,000 for the years ended December 31, 2013, 2012 and 2011, respectively.
Federal and state laws impose substantial restrictions on the utilization of net operating loss and tax credit carry-forwards in the event of an “ownership change,” as defined in Section 382 of the U.S. Internal Revenue Code of 1986, as amended. The Company completed a Section 382 analysis as of December 31, 2013 and concluded that $493,000 in federal net operating losses and $151,000 in federal research and development credits are expected to expire prior to utilization as a result of the Company’s previous ownership changes and corresponding annual limitations.
The temporary timing differences that give rise to the deferred tax assets are as follows (in thousands):
| DECEMBER 31 | ||||||||
| 2013 | 2012 | |||||||
| Components of deferred taxes: |
||||||||
| Net operating loss carryforwards |
$ | 30,258 | $ | 19,966 | ||||
| Research and development tax credit |
1,577 | 1,002 | ||||||
| Other, net |
2,415 | 1,432 | ||||||
|
|
|
|
|
|||||
| Net deferred tax assets |
34,250 | 22,400 | ||||||
| Less: valuation allowance |
(34,250 | ) | (22,400 | ) | ||||
|
|
|
|
|
|||||
| Net deferred tax assets |
$ | — | $ | — | ||||
|
|
|
|
|
|||||
F-40
Table of Contents
The Company had no deferred tax liabilities at December 31, 2013 and 2012.
The Company recognized no income tax expense, and did not receive a benefit from income taxes for the years ended December 31, 2013, 2012 and 2011.
The provision for income taxes is different than the amount computed using the applicable statutory federal income tax rate with the difference for each year summarized below:
| DECEMBER 31 | ||||||||
| 2013 | 2012 | |||||||
| Federal tax benefit at statutory rate |
34 | % | 34 | % | ||||
| State tax benefit, net of federal benefit |
5 | 5 | ||||||
| Interest expense |
(5 | ) | — | |||||
| Mark-to-market accounting |
9 | (12 | ) | |||||
| Deemed dividend |
(2 | ) | (6 | ) | ||||
| Share-based compensation expense |
(2 | ) | — | |||||
| Other |
1 | (1 | ) | |||||
| Adjustment due to change in valuation allowance |
(40 | ) | (20 | ) | ||||
|
|
|
|
|
|||||
| Provision for income taxes |
— | % | — | % | ||||
|
|
|
|
|
|||||
As of December 31, 2013, the Company had unrecognized tax benefits of $525,000. The unrecognized tax benefits, if recognized, would not impact the Company’s effective tax rate as the recognition of these tax benefits would be offset by changes in the Company’s valuation allowance. The Company does not believe there will be any material changes in its unrecognized tax position over the next twelve months.
A reconciliation of the beginning and ending amount of unrecognized tax benefits is as follows (in thousands):
| 2013 | 2012 | |||||||
| Balance at January 1 |
$ | 340 | $ | 305 | ||||
| Increase related to prior year tax positions |
79 | — | ||||||
| Increase related to current year tax positions |
106 | 35 | ||||||
|
|
|
|
|
|||||
| Balance at December 31 |
$ | 525 | $ | 340 | ||||
|
|
|
|
|
|||||
The Company files income tax returns in the U.S. federal jurisdiction and various state jurisdictions. The Company is subject to U.S. federal and state income tax examination for 2006 through 2013 due to unutilized net operating losses and research credits.
17. Employee Benefit Plan
The Company has a defined contribution plan offered to all eligible employees, which is qualified under Section 401(k) of the Internal Revenue Code. The Company currently provides a matching contribution. Matching contributions are based on a formula which provides for a dollar-for-dollar matching contribution of the employee’s 401(k) contribution up to 3% of eligible pay plus a 50% matching contribution on the employee’s 401(k) contribution between 3% and 5% of eligible pay. Each participant is 100% vested in elective contributions and the Company’s matching contribution. The Company provided 401(k) matching contributions for the years ended December 31, 2013, 2012 and 2011 were $294,000, $229,000 and $190,000, respectively.
F-41
Table of Contents
18. Related Party Transactions
Les Lyman, a member of the Company’s board of directors, is the chairman and significant indirect shareholder of The Tremont Group, Inc. During the year ended December 31, 2013, The Tremont Group, Inc. purchased $1,446,000 of the Company’s products for further distribution and resale. As of December 31, 2013, the Company had outstanding accounts receivable due from The Tremont Group, Inc. of $903,000, all of which are due in April 2014. Although the Company anticipates sales of its products to The Tremont Group, Inc. to continue through 2014, the Company cannot estimate the amount of those sales.
In December 2012, the Company issued a $12,500,000 convertible note to Syngenta Ventures Pte. LTD. (Syngenta), an affiliate of one of the Company’s distributors (See Note 9), for which there was no outstanding balance as of December 31, 2013 as the convertible note converted into shares of the Company’s common stock immediately following the completion of the IPO in August 2013. During the year ended December 31, 2013, the Company recorded revenue of $116,000 relating to sales of product to Syngenta and $131,000 relating to license revenue recognized based on the terms of the Company’s commercial agreement with Syngenta. As of December 31, 2013, the Company had no outstanding accounts receivable due from Syngenta.
19. Reverse Stock Split
On August 1, 2013, the Company amended and restated its certificate of incorporation to effect the conversion of its outstanding convertible preferred stock into common stock on a 1-for-1 basis followed immediately by a reverse split of shares of its common stock (including the common stock issued upon conversion of the convertible preferred stock) at a 1-for-3.138458 ratio (the “Reverse Stock Split”). The amendment also increased the number of shares of common stock authorized for issuance to 250,000,000 shares and the number of shares of preferred stock authorized for issuance to 20,000,000. The par value of the common stock and preferred stock was not adjusted as a result of the Reverse Stock Split.
All issued and outstanding common stock, preferred stock, and warrants for common stock or preferred stock, and the related per share amounts contained in the consolidated financial statements, have been retroactively adjusted to give effect to this Reverse Stock Split for all periods presented.
20. Initial Public Offering
In August 2013, the Company closed its initial public offering of 5,462,500 shares of its common stock (inclusive of 712,500 shares of common stock sold upon the exercise of the underwriters’ option to purchase additional shares). The public offering price of the shares sold in the offering was $12.00 per share. The total gross proceeds from the offering to the Company were $65,550,000, and after deducting underwriting discounts and commissions and offering expenses payable by the Company, the aggregate net proceeds received by the Company totaled approximately $56,105,000. In connection with the IPO:
| n | all outstanding shares of convertible preferred stock were converted into 8,514,000 shares of common stock, including 10,000 shares issued upon the cash exercise of Series B convertible preferred stock warrants; |
| n | all outstanding principal and accrued interest of the convertible notes were converted into 3,741,000 shares of common stock; |
| n | 47,000 shares of common stock were issued upon the net exercise of common stock warrants; |
| n | 3,000 shares of common stock were issued upon the cash exercise of common stock warrants; and |
| n | the Series A and Series C convertible preferred stock warrants were net exercised for 71,000 shares of common stock. |
After the closing of the IPO, the Company had 19,133,000 shares of common stock and 151,000 warrants to purchase common stock outstanding and there were no shares of convertible preferred stock, preferred stock warrants or balances related to convertible notes outstanding.
F-42
Table of Contents
21. Quarterly Financial Information (Unaudited)
| MARCH 31 | JUNE 30 | SEPTEMBER 30 | DECEMBER 31 | |||||||||||||
| (In thousands, except per share data) |
||||||||||||||||
| 2013 |
||||||||||||||||
| Total revenues |
$ | 2,730 | $ | 4,500 | $ | 1,346 | $ | 5,967 | ||||||||
| Gross profit |
935 | 1,102 | 269 | 1,501 | ||||||||||||
| Net loss |
(10,749 | ) | (1,639 | ) | (6,110 | ) | (9,991 | ) | ||||||||
| Deemed dividend on convertible notes |
— | (1,378 | ) | — | — | |||||||||||
| Net loss attributable to common stockholders |
(10,749 | ) | (3,017 | ) | (6,110 | ) | (9,991 | ) | ||||||||
| Net loss per common share: |
||||||||||||||||
| Basic |
(8.48 | ) | (2.36 | ) | (0.47 | ) | (0.52 | ) | ||||||||
| Diluted |
(8.48 | ) | (2.67 | ) | (0.80 | ) | (0.52 | ) | ||||||||
| 2012 |
||||||||||||||||
| Total revenues |
$ | 1,999 | $ | 1,509 | $ | 738 | $ | 2,894 | ||||||||
| Gross profit |
1,139 | 825 | 217 | 626 | ||||||||||||
| Net loss |
(3,984 | ) | (3,912 | ) | (13,802 | ) | (17,096 | ) | ||||||||
| Deemed dividend on convertible notes |
(1,253 | ) | — | — | (786 | ) | ||||||||||
| Net loss attributable to common stockholders |
(5,237 | ) | (3,912 | ) | (13,802 | ) | (17,882 | ) | ||||||||
| Net loss per common share: |
||||||||||||||||
| Basic |
(4.20 | ) | (3.13 | ) | (10.94 | ) | (14.11 | ) | ||||||||
| Diluted |
(4.20 | ) | (3.13 | ) | (10.94 | ) | (14.11 | ) | ||||||||
F-43
Table of Contents
In connection with the preparation of the consolidated financial statements for the year ended December 31, 2013, errors in the computation and disclosure of diluted net loss per share were identified for the three and nine months ended September 30, 2013 and for the three months ended June 30, 2013. This resulted from errors in the computation of how adjustments to the net loss attributable to common stockholders from the potentially dilutive securities were reflected in the diluted net loss per share computations and when identifying which potentially dilutive securities were determined to be dilutive or anti-dilutive. The errors affected both the net loss used in the numerator and the weighted average shares outstanding used in the denominator for diluted net loss per share. The Company evaluated the materiality of these errors in accordance with SEC Staff Accounting Bulletin No. 99, Materiality, and SEC Staff Accounting Bulletin No. 108, Considering the Effects of Prior Year Misstatements When Quantifying Misstatements in Current Year Financial Statements, and concluded that these errors, individually and in the aggregate, were immaterial to all prior periods impacted. While the adjustments were immaterial, the Company has elected to revise its previously reported diluted earnings per share as shown in the following table:
| THREE MONTHS ENDED JUNE 30, 2013 |
THREE MONTHS ENDED SEPTEMBER 30, 2013 |
NINE MONTHS ENDED SEPTEMBER 30, 2013 |
||||||||||||||||||||||
| AS REPORTED |
AS REVISED |
AS REPORTED |
AS REVISED |
AS REPORTED |
AS REVISED |
|||||||||||||||||||
| (In thousands, except per share data) | ||||||||||||||||||||||||
| Numerator: |
||||||||||||||||||||||||
| Net loss |
$ | (1,639 | ) | $ | (1,639 | ) | $ | (6,110 | ) | $ | (6,110 | ) | $ | (18,498 | ) | $ | (18,498 | ) | ||||||
| Deemed dividend on convertible notes |
(1,378 | ) | (1,378 | ) | — | — | (1,378 | ) | (1,378 | ) | ||||||||||||||
|
|
|
|
|
|
|
|
|
|
|
|
|
|||||||||||||
| Net loss attributable to common stockholders |
$ | (3,017 | ) | $ | (3,017 | ) | $ | (6,110 | ) | $ | (6,110 | ) | $ | (19,876 | ) | $ | (19,876 | ) | ||||||
|
|
|
|
|
|
|
|
|
|
|
|
|
|||||||||||||
| Effect of potentially dilutive securities: |
||||||||||||||||||||||||
| Convertible notes |
— | — | (1,089 | ) | (4,392 | ) | (118 | ) | (4,392 | ) | ||||||||||||||
| Warrants to purchase convertible preferred stock |
— | (575 | ) | — | (264 | ) | — | (841 | ) | |||||||||||||||
| Warrants to purchase common stock |
— | — | (201 | ) | — | (201 | ) | — | ||||||||||||||||
|
|
|
|
|
|
|
|
|
|
|
|
|
|||||||||||||
| Net loss for diluted net loss per share |
$ | (3,017 | ) | $ | (3,592 | ) | $ | (7,400 | ) | $ | (10,766 | ) | $ | (20,195 | ) | $ | (25,109 | ) | ||||||
|
|
|
|
|
|
|
|
|
|
|
|
|
|||||||||||||
| Denominator: |
||||||||||||||||||||||||
|
|
|
|
|
|
|
|
|
|
|
|
|
|||||||||||||
| Shares used for basic net loss per share |
1,277 | 1,277 | 12,888 | 12,888 | 5,187 | 5,187 | ||||||||||||||||||
|
|
|
|
|
|
|
|
|
|
|
|
|
|||||||||||||
| Effect of potentially dilutive securities: |
||||||||||||||||||||||||
| Convertible notes |
— | — | 1,043 | 503 | 20 | 169 | ||||||||||||||||||
| Warrants to purchase convertible preferred stock |
— | 70 | — | 31 | — | 61 | ||||||||||||||||||
| Warrants to purchase common stock |
— | — | 86 | — | 22 | — | ||||||||||||||||||
|
|
|
|
|
|
|
|
|
|
|
|
|
|||||||||||||
| Weighted average shares outstanding for diluted net loss per share |
1,277 | 1,347 | 14,017 | 13,422 | 5,229 | 5,417 | ||||||||||||||||||
|
|
|
|
|
|
|
|
|
|
|
|
|
|||||||||||||
| Diluted net loss per share: |
$ | (2.36 | ) | $ | (2.67 | ) | $ | (0.53 | ) | $ | (0.80 | ) | $ | (3.86 | ) | $ | (4.63 | ) | ||||||
|
|
|
|
|
|
|
|
|
|
|
|
|
|||||||||||||
The corrections have no impact on the Company’s consolidated balance sheets, net loss, net loss attributable to common stockholders, basic net loss per share, or the consolidated statements of comprehensive loss, convertible preferred stock and stockholders’ equity (deficit), and cash flows for any of the above mentioned periods.
F-44
Table of Contents
MARRONE BIO INNOVATIONS, INC.
Condensed Consolidated Balance Sheets
(In Thousands, Except Par Value)
| MARCH 31, 2014 |
DECEMBER 31, 2013 |
|||||||
| (Unaudited) | ||||||||
| Assets |
||||||||
| Current assets: |
||||||||
| Cash and cash equivalents |
$ | 21,298 | $ | 24,455 | ||||
| Short-term investments |
2,664 | 13,677 | ||||||
| Accounts receivable |
7,231 | 6,215 | ||||||
| Accounts receivable from related parties |
1,230 | 903 | ||||||
| Inventories, net |
12,837 | 11,666 | ||||||
| Prepaid expenses and other current assets |
1,765 | 1,737 | ||||||
|
|
|
|
|
|||||
| Total current assets |
47,025 | 58,653 | ||||||
| Property, plant and equipment, net |
15,795 | 9,420 | ||||||
| Other assets |
639 | 806 | ||||||
|
|
|
|
|
|||||
| Total assets |
$ | 63,459 | $ | 68,879 | ||||
|
|
|
|
|
|||||
| Liabilities and stockholders’ equity |
||||||||
| Current liabilities: |
||||||||
| Accounts payable |
$ | 8,563 | $ | 4,460 | ||||
| Accrued liabilities |
3,040 | 4,380 | ||||||
| Deferred revenue, current portion |
1,017 | 1,209 | ||||||
| Deferred revenue from related parties, current portion |
31 | 131 | ||||||
| Capital lease obligations, current portion |
1,680 | 1,401 | ||||||
| Debt, current portion |
123 | 157 | ||||||
|
|
|
|
|
|||||
| Total current liabilities |
14,454 | 11,738 | ||||||
| Deferred revenue, less current portion |
695 | 744 | ||||||
| Deferred revenue from related parties, less current portion |
404 | 628 | ||||||
| Capital lease obligations, less current portion |
1,059 | 1,134 | ||||||
| Debt, less current portion |
12,312 | 12,280 | ||||||
| Other liabilities |
574 | 571 | ||||||
|
|
|
|
|
|||||
| Total liabilities |
29,498 | 27,095 | ||||||
| Commitments and contingencies (Note 12) |
||||||||
| Stockholders’ equity: |
||||||||
| Preferred stock: $0.00001 par value; 20,000 shares authorized, no shares issued or outstanding at March 31, 2014 and December 31, 2013 |
— | — | ||||||
| Common stock: $0.00001 par value; 250,000 shares authorized and 19,707 and 19,323 shares issued and outstanding at March 31, 2014 and December 31, 2013, respectively |
— | — | ||||||
| Additional paid in capital |
149,643 | 147,220 | ||||||
| Accumulated deficit |
(115,682 | ) | (105,436 | ) | ||||
|
|
|
|
|
|||||
| Total stockholders’ equity |
33,961 | 41,784 | ||||||
|
|
|
|
|
|||||
| Total liabilities and stockholders’ equity |
$ | 63,459 | $ | 68,879 | ||||
|
|
|
|
|
|||||
See accompanying notes.
F-45
Table of Contents
MARRONE BIO INNOVATIONS, INC.
Condensed Consolidated Statements of Operations
(In Thousands, Except Per Share Amount)
(Unaudited)
| THREE MONTHS ENDED MARCH 31 |
||||||||
| 2014 | 2013 | |||||||
| Revenues: |
||||||||
| Product |
$ | 2,097 | $ | 2,373 | ||||
| License |
45 | 48 | ||||||
| Related party |
648 | 309 | ||||||
|
|
|
|
|
|||||
| Total revenues |
2,790 | 2,730 | ||||||
| Cost of product revenues, including cost of product revenues to related parties of $192 and $194 for the three months ended March 31, 2014 and 2013, respectively |
1,652 | 1,795 | ||||||
|
|
|
|
|
|||||
| Gross profit |
1,138 | 935 | ||||||
| Operating expenses: |
||||||||
| Research, development and patent |
4,282 | 3,283 | ||||||
| Selling, general and administrative |
6,330 | 2,847 | ||||||
|
|
|
|
|
|||||
| Total operating expenses |
10,612 | 6,130 | ||||||
|
|
|
|
|
|||||
| Loss from operations |
(9,474 | ) | (5,195 | ) | ||||
| Other income (expense): |
||||||||
| Interest income |
10 | 1 | ||||||
| Interest expense |
(773 | ) | (1,985 | ) | ||||
| Change in estimated fair value of financial instruments |
— | (3,563 | ) | |||||
| Other expense, net |
(9 | ) | (7 | ) | ||||
|
|
|
|
|
|||||
| Total other expense, net |
(772 | ) | (5,554 | ) | ||||
|
|
|
|
|
|||||
| Loss before income taxes |
(10,246 | ) | (10,749 | ) | ||||
| Income taxes |
— | — | ||||||
|
|
|
|
|
|||||
| Net loss |
$ | (10,246 | ) | $ | (10,749 | ) | ||
|
|
|
|
|
|||||
| Net loss per common share: |
||||||||
| Basic and diluted |
$ | (0.52 | ) | $ | (8.48 | ) | ||
|
|
|
|
|
|||||
| Weighted-average shares outstanding used in computing net loss per common share: |
||||||||
| Basic and diluted |
19,518 | 1,268 | ||||||
|
|
|
|
|
|||||
See accompanying notes.
F-46
Table of Contents
MARRONE BIO INNOVATIONS, INC.
Condensed Consolidated Statements of Comprehensive Loss
(In Thousands)
(Unaudited)
| THREE MONTHS ENDED MARCH 31 |
||||||||
| 2014 | 2013 | |||||||
| Net loss |
$ | (10,246 | ) | $ | (10,749 | ) | ||
| Other comprehensive loss |
— | — | ||||||
|
|
|
|
|
|||||
| Comprehensive loss |
$ | (10,246 | ) | $ | (10,749 | ) | ||
|
|
|
|
|
|||||
See accompanying notes.
F-47
Table of Contents
MARRONE BIO INNOVATIONS, INC.
Condensed Consolidated Statements of Cash Flows
(In Thousands)
(Unaudited)
| THREE MONTHS ENDED MARCH 31 |
||||||||
| 2014 | 2013 | |||||||
| Cash flows from operating activities |
||||||||
| Net loss |
$ | (10,246 | ) | $ | (10,749 | ) | ||
| Adjustments to reconcile net loss to net cash used in operating activities: |
||||||||
| Depreciation and amortization |
488 | 184 | ||||||
| Share-based compensation |
1,522 | 249 | ||||||
| Non-cash interest expense |
248 | 1,467 | ||||||
| Change in estimated fair value of financial instruments |
— | 3,563 | ||||||
| Amortization of investment securities premiums/discounts, net |
9 | — | ||||||
| Net changes in operating assets and liabilities: |
||||||||
| Accounts receivable |
(1,016 | ) | 59 | |||||
| Accounts receivable from related parties |
(327 | ) | (132 | ) | ||||
| Inventories |
(1,171 | ) | (495 | ) | ||||
| Prepaid expenses and other assets |
(224 | ) | (558 | ) | ||||
| Accounts payable |
2,737 | 138 | ||||||
| Accrued and other liabilities |
(1,337 | ) | (1,320 | ) | ||||
| Deferred revenue |
(241 | ) | (48 | ) | ||||
| Deferred revenue from related parties |
(324 | ) | (33 | ) | ||||
|
|
|
|
|
|||||
| Net cash used in operating activities |
(9,882 | ) | (7,675 | ) | ||||
| Cash flows from investing activities |
||||||||
| Purchases of property, plant and equipment |
(5,044 | ) | (432 | ) | ||||
| Purchase of short-term investments |
(49 | ) | — | |||||
| Maturities of short-term investments |
11,053 | — | ||||||
|
|
|
|
|
|||||
| Net cash provided by (used in) investing activities |
5,960 | (432 | ) | |||||
| Cash flows from financing activities |
||||||||
| Repayment of debt |
(67 | ) | (9,224 | ) | ||||
| Repayment of capital leases |
(69 | ) | (25 | ) | ||||
| Change in restricted cash |
— | 9,139 | ||||||
| Proceeds from exercise of stock options |
851 | 2 | ||||||
| Proceeds from exercise of common stock warrants |
50 | — | ||||||
|
|
|
|
|
|||||
| Net cash provided by (used in) financing activities |
765 | (108 | ) | |||||
| Net decrease in cash and cash equivalents |
(3,157 | ) | (8,215 | ) | ||||
| Cash and cash equivalents, beginning of year |
24,455 | 10,006 | ||||||
|
|
|
|
|
|||||
| Cash and cash equivalents, end of period |
$ | 21,298 | $ | 1,791 | ||||
|
|
|
|
|
|||||
| Supplemental disclosure of cash flow information |
||||||||
| Cash paid for interest, net of capitalized interest of $469 and $113 for the three months ended March 31, 2014 and 2013, respectively |
$ | 525 | $ | 518 | ||||
|
|
|
|
|
|||||
| Supplemental disclosure of non-cash investing and financing activities |
||||||||
| Property, plant and equipment included in accounts payable and accrued liabilities |
$ | 2,040 | $ | — | ||||
|
|
|
|
|
|||||
| Equipment acquired under capital leases |
$ | 453 | $ | 77 | ||||
|
|
|
|
|
|||||
| Interest added to the principal of convertible notes |
$ | — | $ | 628 | ||||
|
|
|
|
|
|||||
See accompanying notes.
F-48
Table of Contents
Notes to Condensed Consolidated Financial Statements
March 31, 2014
(Unaudited)
1. Summary of Business
Marrone Bio Innovations, Inc. (Company), formerly Marrone Organic Innovations, Inc., was incorporated under the laws of the State of Delaware on June 15, 2006, and is located in Davis, California. In July 2012, the Company formed a wholly-owned subsidiary, Marrone Michigan Manufacturing LLC (MMM LLC), which holds the assets of a manufacturing plant the Company purchased in July 2012 (See Note 2). The Company makes bio-based pest management and plant health products. The Company targets the major markets that use conventional chemical pesticides, including certain agricultural and water markets where its bio-based products are used as substitutes for, or in connection with, conventional chemical pesticides. The Company also targets new markets for which there are no available conventional chemical pesticides, the use of conventional chemical pesticides may not be desirable or permissible, or the development of pest resistance has reduced the efficacy of conventional chemical pesticides. The Company delivers EPA-approved and registered biopesticide products and other bio-based products that address the global demand for effective, safe and environmentally responsible products.
The Company is an early stage company with a limited operating history and has only recently begun commercializing its products. As of March 31, 2014, the Company had an accumulated deficit of $115,682,000 and expects to continue to incur losses for the foreseeable future. Until the Company’s initial public offering (IPO) in August 2013, the Company had funded operations primarily with the net proceeds from the private placements of convertible preferred stock, convertible notes, promissory notes, term loans, as well as proceeds from the sale of its products and payments under strategic collaboration agreements and government grants. The Company will need to generate significant revenue to achieve and maintain profitability. As of March 31, 2014, the Company had working capital of $32,571,000 and cash, cash equivalents and short-term investments of $23,962,000.
On August 1, 2013, the Company amended and restated its certificate of incorporation to effect a reverse split of shares of its common stock at a 1-for-3.138458 ratio (See Note 13).
The Company participates in a heavily regulated and highly competitive crop protection industry and believes that adverse changes in any of the following areas could have a material effect on the Company’s future financial position, results of operations, or cash flows: inability to obtain regulatory approvals, increased competition in the pesticide market, market acceptance of the Company’s products, weather and other seasonal factors beyond the Company’s control, the Company’s ability to support increased growth and litigation or claims against the Company based on intellectual property, patent, product, regulatory or other factors.
2. Significant Accounting Policies
Basis of Presentation
The condensed consolidated financial statements include the accounts of the Company and its wholly-owned subsidiary. All significant intercompany balances and transactions have been eliminated in consolidation.
The accompanying financial information as of March 31, 2014 and for the three months ended March 31, 2014 and 2013 have been prepared by the Company, without audit, in accordance with generally accepted accounting principles in the United States (GAAP) and applicable rules and regulations of the Securities and Exchange Commission regarding interim financial reporting. Certain information and note disclosures normally included in the financial statements prepared in accordance with GAAP have been condensed or omitted pursuant to such rules and regulations. However, the Company believes that the disclosures are adequate to make the information presented not misleading. The information included in this quarterly report on Form 10-Q should be read in conjunction with the consolidated financial statements and accompanying notes included in our Annual Report on Form 10-K for the fiscal year ended December 31, 2013.
F-49
Table of Contents
In the opinion of management, the condensed consolidated financial statements as of March 31, 2014 and for the three months ended March 31, 2014 and 2013 reflect all adjustments, which are normal recurring adjustments, necessary to present a fair statement of financial position, results of operations, comprehensive loss and cash flows. The results of operations for the three months ended March 31, 2014 are not necessarily indicative of the operating results for the full fiscal year or any future periods.
Use of Estimates
Conformity with GAAP requires the use of estimates and judgments that affect the reported amounts of assets and liabilities and disclosure of contingent assets and liabilities at the date of the financial statements and the reported amounts of revenues and expenses during the reporting period. These estimates are based on management’s knowledge about current events and expectations about actions we may undertake in the future. Actual results could differ materially from those estimates.
Reclassifications
Certain prior period amounts have been reclassified to conform to the current year presentation. These reclassifications have no effect on previously reported net income.
Cash and Cash Equivalents
The Company considers all highly liquid financial instruments purchased with a maturity of three months or less to be cash equivalents. Cash and cash equivalents consist of cash on deposit, money market funds and certificates of deposit accounts (CDs) with U.S. financial institutions. The Company is exposed to credit risk in the event of default by financial institutions to the extent that cash and cash equivalents balances with financial institutions are in excess of amounts that are insured by the Federal Deposit Insurance Corporation. The Company has not experienced any losses on these deposits.
Short-Term Investments
The Company’s short-term investments consist of certificates of deposit with original maturities less than one year but greater than three months which are classified as held-to-maturity. Certificates of deposit are stated at their amortized cost with realized gains or losses, if any, reported as other income or expenses in the condensed consolidated statements of operations. The Company routinely evaluates the realizability of its short-term investments and recognizes an impairment charge when a decline in the estimated fair value of a short-term investment is below the amortized cost and determined to be other-than-temporary. The Company considers various factors in determining whether to recognize an impairment charge, including the duration of time and the severity to which the fair value has been less than amortized cost, any adverse changes in the investee’s financial condition, and the Company’s intent and ability to hold the short-term investment for a period of time sufficient to allow for any anticipated recovery in market value. To date, the Company has not recognized any losses on its short-term investments.
Concentration of Credit Risk
Financial instruments that potentially subject the Company to concentrations of credit risk consist principally of cash, cash equivalents, short-term investments, accounts receivable and debt. The Company deposits its cash, cash equivalents and short-term investments with high credit quality domestic financial institutions with locations in the U.S. Such deposits may exceed federal deposit insurance limits. The Company believes the financial risks associated with these financial instruments are minimal.
The Company’s customer base is dispersed across many different geographic areas, and currently most customers are pest management distributors in the U.S. Generally, receivables are due up to 120 days from the invoice date and are considered past due after this date, although the Company may offer extended terms from time to time.
F-50
Table of Contents
For the three months ended March 31, 2014 and 2013, 5% and 14%, respectively, of the Company’s revenues were generated from international customers.
The Company’s principal sources of revenues are its Regalia and Grandevo product lines. For the three months ended March 31, 2014 and 2013, 87% and 97%, respectively, of the Company’s revenues were generated from sales of Grandevo and Regalia.
Customers with 10% or more of the Company’s total revenues consist of the following:
| CUSTOMER A |
CUSTOMER B |
CUSTOMER C (1) |
CUSTOMER D |
CUSTOMER E |
CUSTOMER F |
CUSTOMER G |
CUSTOMER H |
|||||||||||||||||||||||||
| For the three months ended March 31, |
||||||||||||||||||||||||||||||||
| 2014 |
17 | % | 15 | % | 12 | % | 11 | % | 11 | % | * | * | * | |||||||||||||||||||
| 2013 |
13 | % | * | * | * | * | 17 | % | 15 | % | 11 | % | ||||||||||||||||||||
| * | Represents less than 10% of total revenues |
| (1) | Represents related party revenues. See Note 14 for further discussion. |
Customers with 10% or more of the Company’s outstanding accounts receivable consist of the following:
| CUSTOMER A |
CUSTOMER B (1) |
CUSTOMER C |
CUSTOMER D |
|||||||||||||
| March 31, 2014 |
16 | % | 15 | % | 11 | % | 10 | % | ||||||||
| December 31, 2013 |
19 | % | 13 | % | 11 | % | 12 | % | ||||||||
| (1) | Represents accounts receivable from related parties. See Note 14 for further discussion. |
Inventories
Inventories are stated at the lower of cost or market value (net realizable value or replacement cost) and include the cost of material and external labor and manufacturing costs. Cost is determined on the first-in, first-out basis. The Company provides for inventory reserves when conditions indicate that the selling price may be less than cost due to physical deterioration, obsolescence, changes in price levels, or other factors. Additionally, the Company provides reserves for excess and slow-moving inventory on hand that is not expected to be sold to reduce the carrying amount of excess slow-moving inventory to its estimated net realizable value. The reserves are based upon estimates about future demand from the Company’s customers and distributors and market conditions. As of March 31, 2014 and December 31, 2013, the Company had $45,000 in reserves against its inventories.
Deferred Cost of Product Revenues
Deferred cost of product revenues are stated at the lower of cost or net realizable value and include product sold where title has transferred but the criteria for revenue recognition have not been met. As of March 31, 2014 and December 31, 2013, the Company had $308,000 and $418,000, respectively, of current deferred cost of product revenues, which is included in prepaid expenses and other current assets in the condensed consolidated balance sheets.
Acquisition
On July 19, 2012 (Acquisition Date), the Company purchased land, a building and equipment (Manufacturing Plant) for $1,459,000, including $341,000 of transaction costs. The Manufacturing Plant is located in Bangor, Michigan. Prior to the acquisition, the Manufacturing Plant was owned by a bank and sold in a foreclosure auction. Accordingly, the purchase price for the Manufacturing Plant was less than the estimated fair value of the assets acquired by $257,000. The excess of fair value of the assets acquired over the purchase price was allocated on a relative fair value basis to all assets acquired. The acquisition of the Manufacturing Plant will allow the Company to manufacture certain products internally and improve the overall operating efficiencies and margins of the business as the production of these products historically has been outsourced.
F-51
Table of Contents
The acquisition was accounted for as an asset acquisition in accordance with ASC 805, Business Combinations (ASC 805). The assets acquired under the Manufacturing Plant acquisition have been included in the Company’s condensed consolidated financial statements from the Acquisition Date. The purchase price was allocated to assets acquired as of the Acquisition Date.
Prior to the allocation of the excess of fair value of the assets acquired over the purchase price, the assets acquired are first measured at their fair values. The Company engaged a third-party valuation firm to assist with its estimated fair value of the assets acquired. The following methods and assumptions are used to estimate the fair value of each class of asset acquired:
Land—Market approach based on similar, but not identical, transactions in the market. Adjustments to comparable sales are based on both the quantitative and qualitative data.
Building—The cost approach, market approach and income approach were used to assess fair value. Cost approach is based on replacement cost new less depreciation adjusted for physical deterioration, functional obsolescence and external/economic obsolescence, as applicable. The market approach is based on similar, but not identical, transactions in the market using both quantitative and qualitative data. The income approach is based on the direct capitalization method using similar but not identical lease rates and making an assessment of net operating income.
Equipment—Both the cost approach and the market approach were used to assess fair value. Cost approach is based on replacement cost new less depreciation adjusted for physical deterioration, functional obsolescence and external/economic obsolescence, as applicable. The market approach is based on similar, but not identical, transactions in the market using both quantitative and qualitative data.
The following table summarizes the estimated fair value of the assets acquired as of the Acquisition Date, which were determined using Level 2 and 3 inputs as described above (in thousands):
| JULY 19, 2012 |
||||
| Land |
$ | 1 | ||
| Building |
314 | |||
| Equipment |
1,144 | |||
|
|
|
|||
| Assets acquired |
$ | 1,459 | ||
|
|
|
|||
As the Manufacturing Plant had not yet been placed in full service as of March 31, 2014, the assets acquired, except the land, were recorded as construction in progress as a component of property, plant and equipment in the accompanying condensed consolidated balance sheets as of March 31, 2014 and December 31, 2013. In addition, interest expense in the amount of $1,271,000 and $801,000 was recorded in construction in progress as of March 31, 2014 and December 31, 2013, respectively.
Revenue Recognition
The Company recognizes revenues when persuasive evidence of an arrangement exists, delivery and transfer of title has occurred or services have been rendered, the price is fixed or determinable, and collectability is reasonably assured, unless contractual obligations, acceptance provisions or other contingencies exist. If such obligations or provisions exist, revenue is recognized after such obligations or provisions are fulfilled or expire.
Product revenues consist of revenues generated from sales to distributors and from sales of the Company’s products to direct customers, net of rebates and cash discounts. For sales of products made to distributors, the Company considers a number of factors in determining whether revenue is recognized upon transfer of title to the distributor, or when payment is received. These factors include, but are not limited to, whether the payment terms offered to the distributor in comparison to the Company’s historical terms are considered to be longer than normal payment terms, the distributor history of adhering to the terms of its contractual arrangements with the Company, whether the
F-52
Table of Contents
Company has a pattern of granting concessions for the benefit of the distributor, and whether there are other conditions that may indicate that the sale to the distributor is not substantive. When the Company offers payment terms that are considered to be extended in comparison to the Company’s historical terms, the Company considers the arrangement not to be fixed or determinable, and accordingly, revenue is deferred until payment is due. The costs associated with such deferral are also deferred and classified in prepaid expenses and other current assets in the condensed consolidated balance sheets. The Company currently recognizes revenue primarily on the sell-in method with its distributors. Distributors generally do not have price protection or return rights.
As of March 31, 2014 and December 31, 2013, the Company had current deferred product revenues of $824,000 and $1,016,000, respectively.
From time to time, the Company offers certain product rebates, which are recorded as reductions to product revenues. An accrued liability for these product rebates is recorded at the time the revenues are recorded.
The Company recognizes license revenues pursuant to strategic collaboration and distribution agreements under which the Company receives payments for the achievement of testing validation, regulatory progress and commercialization events. As these activities and payments are associated with exclusive rights that the Company provides in connection with strategic collaboration and distribution agreements over the term of the agreements, revenues related to the payments received are deferred and recognized over the term of the exclusive distribution period of the respective agreement. No payments were received under these agreements during the three months ended March 31, 2014 and 2013. For the three months ended March 31, 2014 and 2013, the Company recognized $45,000 and $48,000, respectively, as license revenues in the accompanying condensed consolidated statements of operations.
For the three months ended March 31, 2014 and 2013, the Company recognized $328,000 and $33,000 of related party revenues under these agreements, respectively, based on the terms of the Company’s agreements with Syngenta, an affiliate of one of our 5% stockholders, of which, $292,000 was recognized during the three months ended March 31, 2014 upon the termination of one of these agreements.
At March 31, 2014, the Company recorded current and non-current deferred revenues of $224,000 and $1,099,000, respectively, related to payments received under these agreements, of which $31,000 and $404,000, respectively, related to deferred revenues from related parties based on the terms of the Company’s commercial agreement with Syngenta. At December 31, 2013, the Company recorded current and non-current deferred revenues of $324,000 and $1,372,000, respectively, related to payments received under these agreements, of which $131,000 and $628,000, respectively, related to deferred revenues from related parties based on the terms of the Company’s agreements with Syngenta.
Research, Development and Patent Expenses
Research and development expenditures, which primarily consist of payroll-related expenses, toxicology costs, regulatory costs, consulting costs and lab costs, and patent expenses, which primarily consist of legal costs relating to the patents and patent filing costs, are expensed to operations as incurred. For the three months ended March 31, 2014 and 2013, research and development expenses totaled $3,985,000 and $3,064,000, respectively, and patent expenses totaled $297,000 and $219,000, respectively.
Recently Issued Accounting Pronouncements
There have been no new accounting pronouncements issued during the three months ended March 31, 2014 that are of significance, or potential significance, to the Company.
3. Fair Value Measurements
ASC 820, Fair Value Measurements (ASC 820), clarifies that fair value is an exit price, representing the amount that would be received to sell an asset or paid to transfer a liability in an orderly transaction between market participants. As such, fair value is a market-based measurement that should be determined based on assumptions that market participants would use in pricing an asset or liability.
F-53
Table of Contents
ASC 820 requires that the valuation techniques used to measure fair value must maximize the use of observable inputs and minimize the use of unobservable inputs. ASC 820 establishes a three tier value hierarchy, which prioritizes inputs that may be used to measure fair value as follows:
| n | Level 1—Quoted prices in active markets for identical assets or liabilities. |
| n | Level 2—Observable inputs other than quoted prices in active markets for identical assets and liabilities, quoted prices for identical or similar assets or liabilities in inactive markets, or other inputs that are observable or can be corroborated by observable market data for substantially the full term of the assets or liabilities. |
| n | Level 3—Inputs that are generally unobservable and typically reflect management’s estimate of assumptions that market participants would use in pricing the asset or liability. |
The following table presents the Company’s financial assets and liabilities measured at fair value on a recurring basis as of March 31, 2014 and December 31, 2013 (in thousands):
| MARCH 31, 2014 | ||||||||||||||||
| TOTAL | LEVEL 1 | LEVEL 2 | LEVEL 3 | |||||||||||||
| Assets |
||||||||||||||||
| Money market funds |
$ | 5,069 | $ | 5,069 | $ | — | $ | — | ||||||||
|
|
|
|
|
|
|
|
|
|||||||||
| DECEMBER 31, 2013 | ||||||||||||||||
| TOTAL | LEVEL 1 | LEVEL 2 | LEVEL 3 | |||||||||||||
| Assets |
||||||||||||||||
| Money market funds |
$ | 16,268 | $ | 16,268 | $ | — | $ | — | ||||||||
|
|
|
|
|
|
|
|
|
|||||||||
The money market funds held as of March 31, 2014, and December 31, 2013, were in active markets and, therefore, are measured based on the Level 1 valuation hierarchy.
4. Short-Term Investments
The Company’s short-term investments consist of certificates of deposit with original maturities less than one year but greater than three months which are classified as held-to-maturity. Certificates of deposit are stated at their amortized cost with realized gains or losses, if any, reported as other income or expenses in the consolidated statements of operations. The Company routinely evaluates the realizability of its short-term investments and recognizes an impairment charge when a decline in the estimated fair value of a short-term investment is below the amortized cost and determined to be other-than-temporary. The Company considers various factors in determining whether to recognize an impairment charge, including the duration of time and the severity to which the fair value has been less than amortized cost, any adverse changes in the investee’s financial condition, and the Company’s intent and ability to hold the short-term investment for a period of time sufficient to allow for any anticipated recovery in market value. To date, the Company has not recognized any losses on its short-term investments.
F-54
Table of Contents
The amortized cost and estimated fair values of short-term investments are summarized in the following table (in thousands):
| MARCH 31, 2014 | ||||||||||||||||
| AMORTIZED COST |
GROSS UNREALIZED GAINS |
GROSS UNREALIZED LOSSES |
ESTIMATED FAIR VALUE |
|||||||||||||
| Securities Held-to-Maturity |
||||||||||||||||
| Certificates of deposit, with maturities less than 1 year |
$ | 2,664 | $ | — | $ | — | $ | 2,664 | ||||||||
|
|
|
|
|
|
|
|
|
|||||||||
| DECEMBER 31, 2013 | ||||||||||||||||
| AMORTIZED COST |
GROSS UNREALIZED GAINS |
GROSS UNREALIZED LOSSES |
ESTIMATED FAIR VALUE |
|||||||||||||
| Securities Held-to-Maturity |
||||||||||||||||
| Certificates of deposit, with maturities less than 1 year |
$ | 13,677 | $ | — | $ | (4 | ) | $ | 13,673 | |||||||
|
|
|
|
|
|
|
|
|
|||||||||
The short-term investments as of March 31, 2014 and December 31, 2013 were in inactive markets and, therefore, the estimated fair value is measured based on the Level 2 valuation hierarchy.
5. Inventories
Inventories, net consist of the following (in thousands):
| MARCH 31, 2014 |
DECEMBER 31, 2013 |
|||||||
| Raw materials |
$ | 5,913 | $ | 5,355 | ||||
| Work in progress |
2,640 | 2,917 | ||||||
| Finished goods |
4,284 | 3,394 | ||||||
|
|
|
|
|
|||||
| $ | 12,837 | $ | 11,666 | |||||
|
|
|
|
|
|||||
6. Net Loss Per Share
Basic net loss per share, which excludes dilution, is computed by dividing the net loss attributable to common stockholders by the weighted-average number of shares of common stock outstanding during the period. Diluted net loss per share reflects the potential dilution that could occur if securities or other contracts to issue common stock, such as stock options, convertible notes, convertible preferred stock and warrants, result in the issuance of common stock which share in the losses of the Company.
The following table sets forth the potential shares of common stock that are not included in the calculation of diluted net loss per share because to do so would be anti-dilutive as of the end of each period presented (in thousands). Such potentially dilutive shares are excluded when the effect would be to reduce the loss per share. The treasury stock method has been applied to determine the dilutive effect of warrants.
| MARCH 31 | ||||||||
| 2014 | 2013 | |||||||
| Convertible preferred stock |
— | 8,504 | ||||||
| Convertible notes (1) |
— | — | ||||||
| Stock options outstanding |
2,974 | 2,040 | ||||||
| Warrants to purchase convertible preferred stock |
— | 207 | ||||||
| Warrants to purchase common stock (2) |
145 | — | ||||||
F-55
Table of Contents
| (1) | As of March 31, 2013, the Company had approximately $46,037,000 in contingently convertible notes payable and related accrued interest for which the contingencies related to conversion had not been met until the IPO in August 2013. Therefore, it would have no dilutive or anti-dilutive impact until the contingency had been met in August 2013. |
| (2) | In October 2012, the Company issued warrants to purchase a number of shares of common stock equal to 15% of the funded principal amount of the October 2012 Junior Secured Promissory Notes as defined in Note 10, divided by 70% of the value of common stock in a sale of the Company or a qualified initial public offering (qualified IPO), with an exercise price of 70% of the value of common stock in a sale of the Company or a qualified IPO. These warrants were contingently exercisable for which the contingencies related to exercise had not been met until the IPO in August 2013. Therefore, they would have no dilutive or anti-dilutive impact until the contingency had been met in August 2013. |
The numbers of shares of common stock issuable upon the exercise of warrants to purchase convertible preferred stock and upon the conversion of convertible preferred stock were at a ratio of one-to-one.
| THREE MONTHS ENDED MARCH 31 |
||||||||
| 2014 | 2013 | |||||||
| (In thousands, except per share data) | ||||||||
| Numerator: |
||||||||
| Net loss for basic and diluted net loss per share |
$ | (10,246 | ) | $ | (10,749 | ) | ||
|
|
|
|
|
|||||
| Denominator |
||||||||
| Weighted average shares outstanding for basic and diluted net loss per share |
19,518 | 1,268 | ||||||
|
|
|
|
|
|||||
| Basic and diluted net loss per share: |
$ | (0.52 | ) | $ | (8.48 | ) | ||
|
|
|
|
|
|||||
7. Other Assets
Other assets consist of the following (in thousands):
| MARCH 31, 2014 |
DECEMBER 31, 2013 |
|||||||
| Prepaid distribution fees |
$ | 122 | $ | 125 | ||||
| Deferred financing costs, less current portion |
102 | 148 | ||||||
| Deposits for equipment |
76 | 256 | ||||||
| Deposits on equipment leases |
177 | 177 | ||||||
| Other assets |
162 | 100 | ||||||
|
|
|
|
|
|||||
| $ | 639 | $ | 806 | |||||
|
|
|
|
|
|||||
8. Accrued Liabilities
Accrued liabilities consist of the following (in thousands):
| MARCH 31, 2014 |
DECEMBER 31, 2013 |
|||||||
| Accrued compensation |
$ | 1,300 | $ | 2,040 | ||||
| Accrued severance |
125 | 100 | ||||||
| Accrued expenses |
1,462 | 1,570 | ||||||
| Accrued warranty costs |
135 | 60 | ||||||
| Accrued inventory costs |
18 | 610 | ||||||
|
|
|
|
|
|||||
| $ | 3,040 | $ | 4,380 | |||||
|
|
|
|
|
|||||
F-56
Table of Contents
On November 7, 2013, the Company announced that its Chief Financial Officer, Donald Glidewell, had decided to retire from the Company. To facilitate the transition, Mr. Glidewell agreed to remain as the Company’s Chief Financial Officer for up to five months while the Company searched for a successor Chief Financial Officer, and the Company entered into a transition agreement with Mr. Glidewell that provided, among other things, for continued vesting of his outstanding equity awards through his retirement date, which was March 25, 2014, and that upon his separation from the Company, Mr. Glidewell would be eligible to receive:
| n | an amount equal to six months of his then-current annual base salary payable monthly for a period of six months from his retirement date in the form of salary continuation; |
| n | medical and dental coverage, plus disability and life insurance premiums, for a period of six months following his retirement; and |
| n | full acceleration of vesting of his outstanding equity awards that are unvested as of his retirement date. |
The Company recorded accrued severance expenses in the amount of $125,000 and $100,000 as of March 31, 2014 and December 31, 2013, respectively, based on the terms of the transition agreement for salary, COBRA, and transition service related costs. See Note 11 for further discussion regarding the acceleration of vesting of Mr. Glidewell’s outstanding equity awards.
The Company warrants the specifications and/or performance of its products through implied product warranties and has extended product warranties to qualifying customers on a contractual basis. The Company estimates the costs that may be incurred during the warranty period and records a liability in the amount of such costs at the time revenue is recognized. The Company’s estimate is based on historical experience and estimates of future warranty costs as a result of increasing usage of the Company’s products. The Company periodically assesses the adequacy of its recorded warranty liabilities and adjusts the amounts as necessary. Changes in the Company’s accrued warranty costs during the period are as follows (in thousands):
| Balance at December 31, 2013 |
$ | 60 | ||
| Warranties issued during the period |
88 | |||
| Settlements made during the period |
(13 | ) | ||
|
|
|
|||
| Balance at March 31, 2014 |
$ | 135 | ||
|
|
|
9. Factoring and Security Agreement
On June 13, 2013, the Company entered into a factoring and security agreement (Factoring and Security Agreement) with a third-party that enabled the Company to sell its entire interest in certain accounts receivable up to $5,000,000. Under the Factoring and Security Agreement, 15% of the sales proceeds were to be held back by the purchaser until collection of such receivables. Such holdbacks were not considered legal securities, nor were they certificated. Upon the sale of the receivable, the Company did not maintain servicing. The purchaser may have required the Company to repurchase accounts receivable if (i) the payment was disputed by the account debtor, with the purchaser being under no obligation to determine the bona fides of such dispute; (ii) the account debtor had become insolvent or (iii) upon the effective date of the termination of the Factoring and Security Agreement. The purchaser would retain its security interest in any accounts repurchased by the Company. The Factoring and Security Agreement was secured by all of the Company’s personal property and fixtures, and proceeds thereof, including accounts receivable, inventory, equipment and general intangibles other than intellectual property. Upon sale of the receivable, the Company may have elected to set up a reserve where upon the cash for the sale remained with the third-party and the Company could draw on the available amount on the reserve account at any time. The Company elected to utilize the reserve account. On November 11, 2013, the Company terminated the Factoring and Security Agreement effective January 10, 2014.
The Company accounted for sales of accounts receivable under the Factoring and Security Agreement as a secured borrowing in accordance with ASC 860, Transfers and Servicing (ASC 860). As of March 31, 2014, there was no balance in accounts receivable that was transferred under this arrangement. As of December 31, 2013, the
F-57
Table of Contents
Company had $479,000 included in accounts receivable that were transferred under this arrangement. As of March 31, 2014 and December 31, 2013, the Company did not have excess funds available on the reserve account and did not have secured borrowings outstanding under the arrangement.
10. Debt
Debt consists of the following (in thousands):
| MARCH 31, 2014 |
DECEMBER 31, 2013 |
|||||||
| Term Loan (Term Loan) bearing interest at 7.00% per annum which is payable monthly through April 2016. The Term Loan is collateralized by all of the Company’s inventories, chattel paper, accounts receivable, equipment and general intangibles (excluding certain financed equipment and intellectual property) pledged as collateral under the Term Loan, subordinated |
279 | 309 | ||||||
| Promissory note bearing interest at 7.00% per annum which is payable monthly through November 2014, collateralized by all of the Company’s inventories, chattel paper, accounts receivable, equipment and general intangibles (excluding certain financed equipment and intellectual property), net of unamortized debt discount at March 31, 2014 of $1, subordinated |
87 | 123 | ||||||
| Junior secured promissory notes (October 2012 and April 2013 Junior Secured Promissory Notes) bearing interest at 12.00% per annum which are payable monthly through October 2015, collateralized by substantially all of the Company’s assets, net of unamortized debt discount at March 31, 2014 of $381 |
12,069 | 12,005 | ||||||
|
|
|
|
|
|||||
| Debt |
12,435 | 12,437 | ||||||
| Less current portion |
(123 | ) | (157 | ) | ||||
|
|
|
|
|
|||||
| $ | 12,312 | $ | 12,280 | |||||
|
|
|
|
|
|||||
The fair value of the Company’s outstanding debt obligations was $13,746,000 and $13,950,000 as of March 31, 2014 and December 31, 2013, respectively, which was estimated based on a discounted cash flow model using an estimated market rate of interest of 7.0% and is classified as Level 3 within the fair value hierarchy.
Promissory Notes, Term Loan, Revolving Line of Credit and Credit Facility
In March 2009, October 2010 and October 2011, the Company and the bank agreed to modify the terms of its existing revolving line of credit (Revolver). Under the modified terms of the Revolver, the Company’s borrowings under the Revolver were limited to 75% of qualifying accounts receivable with a maximum borrowing limit of $500,000. In March 2012, the Company entered into a change in terms agreement with the bank under which the existing Revolver was replaced by the Term Loan in the amount of $500,000 with a rate of 7.00% per annum, maturing April 1, 2016. The Company’s inventories, chattel paper, accounts receivable, equipment and general intangibles (excluding certain financed equipment and intellectual property) have been pledged as collateral under the Term Loan. The Revolver was terminated in March 2012.
In March 2009, the Company borrowed $650,000 pursuant to a promissory note with a bank which bears interest at the rate of 7.00% per annum and is repayable in six monthly interest only payments starting May 1, 2009, followed by 60 equal monthly installments of $13,000 commencing November 1, 2009, with the final payment due on November 1, 2014. All of the Company’s inventories, chattel paper, accounts receivable, equipment and general intangibles (excluding certain financed equipment and any intellectual property) have been pledged as collateral for the promissory notes.
On October 2, 2012, the Company borrowed $7,500,000 pursuant to senior notes (October 2012 Junior Secured Promissory Notes) with a group of lenders. The October 2012 Junior Secured Promissory Notes have an initial term of three years and can be extended for an additional two years in one year increments. During the initial three-year
F-58
Table of Contents
term, the October 2012 Junior Secured Promissory Notes bear interest at 12% per annum. If the term of the October 2012 Junior Secured Promissory Notes is extended an additional year, the interest rate increases to 13% during the fourth year. If the term of the October 2012 Junior Secured Promissory Notes is extended for an additional two years, the interest rate is 14% during the fifth year. Interest on the October 2012 Junior Secured Promissory Notes is payable monthly through the initial maturity date of the loan which is October 2, 2015 or through any extension period. The principal and all unpaid interest are due on the maturity date, as may be extended.
As part of the terms of the October 2012 Junior Secured Promissory Notes, the Company is required to pay a fee of 5% of the funded principal amount to the agent that facilitated the borrowing and provides management of the relationship with the group of lenders (Agent Fee). This Agent Fee is payable within 30 days after all interest and principal have been paid. For each year the Company extends the maturity date of the October 2012 Junior Secured Promissory Notes beyond the initial term, the agent will receive an additional 1% fee based on the funded principal amount. The present value of the unpaid Agent Fee, based on 5% of the funded principal amount, or $261,000, as of the closing date of the October 2012 Junior Secured Promissory Notes was recorded as both deferred financing costs as a component of current and non-current other assets and non-current other liabilities. The amortization of the deferred financing costs and the accretion of the Agent Fee are recorded to interest expense over the term of the arrangement. As of March 31, 2014 and December 31, 2013, $519,000 and $502,000, respectively, of the Agent Fee, including the amounts relating to the additional funds received from the issuance of the April 2013 Junior Secured Promissory Notes discussed below, was recorded under non-current other liabilities. In addition, the Company incurred an additional $66,000 in financing-related costs, primarily legal fees. These costs were recorded as deferred financing costs as a component of current and non-current other assets and are being amortized to interest expense over the term of the arrangement. The October 2012 Junior Secured Promissory Notes are secured by the Company’s ownership interest in MMM LLC, a security interest in the assets of the Manufacturing Plant, and all of the Company’s other assets, subject to certain permitted liens.
The Company also issued warrants (Common Stock Warrants) to the group of lenders to purchase a number of shares of common stock equal to 15% of the funded principal amount of the October 2012 Junior Secured Promissory Notes divided by 70% of the value of common stock in a sale of the Company or a qualified IPO, with such Common Stock Warrants having an exercise price of 70% of the value of common stock in a sale of the Company or a qualified IPO. The Common Stock Warrants would be automatically exercised immediately prior to expiration on the earlier to occur of a qualified IPO or a sale of the Company or the maturity of the October 2012 Junior Secured Promissory Notes. The October 2012 Junior Secured Promissory Notes could be prepaid six months after the initial funding date or earlier if a qualified IPO or a sale of the Company occurs. As the predominant settlement feature of the Common Stock Warrants is to settle a fixed monetary amount with a variable number of shares, the Common Stock Warrants were accounted for under ASC 480, Distinguishing Liabilities from Equity (ASC 480). Accordingly, the Common Stock Warrants were recorded at estimated fair value on their issuance date and were adjusted to their estimated fair value as of each reporting date with the change in estimated fair value recorded as a component of change in estimated fair value of financial instruments in the Company’s consolidated statements of operations. The fair value of the Common Stock Warrants at the date of issuance of $282,000 was recorded as a discount to the October 2012 Junior Secured Promissory Notes and is being amortized to interest expense over the term of the arrangement. Until the effective date of our IPO in August 2013, the Company estimated the fair value of the Common Stock Warrants using a PWERM valuation based on unobservable inputs, and, therefore, the Common Stock Warrants were considered to be Level 3 liabilities. Upon closing of the IPO, the exercise price of the Common Stock Warrants was determined to be $8.40 per share and the number of shares to be issued upon exercise of the warrants was no longer variable. As a result of the IPO, the Common Stock Warrants were considered to be indexed to the Company’s stock, and accordingly, the common stock warrants liability was reclassified and included in stockholders’ equity during the year ended December 31, 2013. In connection with the IPO, the Common Stock Warrants were exercised and accordingly, as of March 31, 2014, these warrants were no longer outstanding.
The October 2012 Junior Secured Promissory Notes contained certain covenant requirements which included a requirement to maintain a minimum cash balance of the lesser of the April 2012 Senior Secured Promissory Note indebtedness or $5,000,000. The April 2012 Senior Secured Promissory Note was fully paid off in January 2013.
F-59
Table of Contents
The Company was also precluded from adding additional debt without lender approval unless such debt is subordinated to the October 2012 Junior Secured Promissory Notes and not more than $2,000,000. In the event of default on the October 2012 Junior Secured Promissory Notes, the lenders could declare the entire unpaid principal and interest immediately due and payable.
On April 10, 2013 (Conversion Date), the Company entered an amendment to increase, by up to $5,000,000, the amount available under the terms of the October 2012 Junior Secured Promissory Notes. Under this amendment, an additional $4,950,000 in Notes were issued for $3,700,000 in cash consideration received and for the cancellation of $1,250,000 of the total principal balance of the October 2012 Subordinated Convertible Note (collectively, April 2013 Junior Secured Promissory Notes). The total amount borrowed under the amended loan agreement for the October 2012 Junior Secured Promissory Notes and the April 2013 Junior Secured Promissory Notes increased from $7,500,000 to $12,450,000 as of the Conversion Date. The accrued interest of $74,000 for the partially converted October 2012 Subordinated Convertible Note as of the Conversion Date would be repaid or converted on the applicable maturity date of the October 2012 Subordinated Convertible Note.
In connection with the issuance of the April 2013 Junior Secured Promissory Notes, the Company issued additional warrants (Additional Common Stock Warrants) to purchase a number of shares of common stock equal to 20% of the funded principal amount of the April 2013 Junior Secured Promissory Notes divided by 70% of the value of common stock in a sale of the Company or a qualified IPO, with such Additional Common Stock Warrants to have an exercise price of 70% of the value of common stock in a sale of the Company or a qualified IPO. As the predominant settlement feature of the Additional Common Stock Warrants was to settle a fixed monetary amount with a variable number of shares, the Common Stock Warrants were accounted for under ASC 480. Accordingly, the Additional Common Stock Warrants were recorded at estimated fair value on their issuance date and were adjusted to their estimated fair value as of each reporting date with the change in estimated fair value recorded as a component of change in estimated fair value of financial instruments in the Company’s consolidated statements of operations. The fair value of the Additional Common Stock Warrants at the date of issuance was estimated to be $465,000. The Company estimated the fair value of the Additional Common Stock Warrants using a PWERM valuation based on unobservable inputs and, therefore, the Additional Common Stock Warrants were considered to be Level 3 liabilities. Upon closing of the IPO, the exercise price of the Common Stock Warrants was determined to be $8.40 per share and the number of shares to be issued upon exercise of the warrants was no longer variable. As a result of the IPO, the Common Stock Warrants were considered to be indexed to the Company’s stock, and accordingly, the common stock warrants liability was reclassified and included in stockholders’ equity during the year ended December 31, 2013.
The debt holder who converted $1,250,000 principal balance of the October 2012 Subordinated Convertible Note (with a fair value of $1,360,000 on the date of conversion) also loaned an additional $2,500,000 in cash as part of the April 2013 Junior Secured Promissory Notes (collectively, the $3,750,000 Notes). The Company accounted for the conversion as an extinguishment of debt in accordance with ASC 470-50-40. The $1,360,000 fair value of the partially converted October 2012 Subordinated Convertible Note on the Conversion Date was derecognized and the fair value of the $3,750,000 Notes with the portion of the fair value of the Additional Common Stock Warrants issued to this debt holder on the date of issuance was recorded. The Company recorded the $49,000 excess of the total fair value of the $3,750,000 Notes and the related Additional Common Stock Warrants on the issuance date over total consideration received as a gain on extinguishment of debt in the accompanying consolidated statements of operations for the year ended December 31, 2013.
F-60
Table of Contents
The following table shows the consideration received, fair values of the notes and common stock warrants issued and calculation of the gain on extinguishment of debt for the $3,750,000 Notes (in thousands):
| Consideration received |
||||
| Fair Value of October 2012 Subordinated Convertible Note |
$ | 1,360 | ||
| Cash |
2,500 | |||
|
|
|
|||
| Total Consideration Received (a) |
$ | 3,860 | ||
| Notes and Warrants Issued |
||||
| Principal Balance of Notes Issued |
$ | 3,750 | ||
| Debt Discount (1) |
(291 | ) | ||
|
|
|
|||
| Fair Value of Notes Issued |
3,459 | |||
| Fair Value of Additional Common Stock Warrants Issued |
352 | |||
|
|
|
|||
| Total Fair Value of Notes and Warrants Issued (b) |
$ | 3,811 | ||
|
|
|
|||
| Gain on Extinguishment of Debt (a - b) |
$ | 49 | ||
|
|
|
| (1) | The amortization of this account is being recorded in interest expense in the consolidated statements of operations over the term of the arrangement. |
The remaining fair value to the Additional Common Stock Warrants of $113,000, net of the fair value of the Additional Common Stock Warrants issued of $352,000 related to the $3,750,000 Notes discussed above, was recorded as a debt discount to the April 2013 Junior Secured Promissory Notes and is being amortized to interest expense over the term of the arrangement.
As a result of the amendment described above, the Company is also required to pay the Agent Fee, 5% of the $3,700,000 in cash received from the April 2013 Junior Secured Promissory Notes, under the same terms as the October 2012 Junior Secured Promissory Notes. In addition, the portion of the Agent Fee relating to the converted October 2012 Subordinated Convertible Note that would be due under the terms of the October 2012 Subordinated Convertible Note will be paid under the terms of the October 2012 and April 2013 Junior Secured Promissory Notes. The present value of the unpaid Agent Fee of $172,000, based on 5% of the funded principal amount of $4,950,000, as of the closing date of the April 2013 Junior Secured Promissory Notes was recorded as both deferred financing costs as a component of current and non-current other assets and non-current other liabilities. The amortization of the deferred financing costs and the accretion of the Agent Fee are being amortized to interest expense over the term of the arrangement.
In addition, the Company incurred an additional $24,000 in financing-related costs, primarily legal fees. These costs were recorded as deferred financing costs as a component of current and non-current other assets and are being amortized to interest expense over the term of the arrangement.
The amendment to the loan agreement also amended the interest provision applicable to the October 2012 and April 2013 Junior Secured Promissory Notes to allow any holder of the October 2012 and April 2013 Junior Secured Promissory Notes to request the Company to defer all interest due monthly to the applicable maturity date, and the optional prepayment provision applicable to the October 2012 and April 2013 Junior Secured Promissory Notes to allow the Company to repay the outstanding amount of the October 2012 and April 2013 Junior Secured Promissory Notes, either (i) with the written consent of the lender or the agent on such lenders’ behalf or (ii) without such consent provided that the Company pays the interest that would have been due from the prepayment date to the initial maturity date.
F-61
Table of Contents
Activity related to the October 2012 and April 2013 Junior Secured Promissory Notes from December 31, 2013 through March 31, 2014 consisted of the following (in thousands):
| DECEMBER 31, 2013 |
ADDITIONS | AMORTIZATION OF DEBT DISCOUNT |
PRINCIPAL PAYMENTS |
MARCH 31, 2014 |
||||||||||||||||
| Principal |
$ | 12,450 | $ | — | $ | — | $ | — | $ | 12,450 | ||||||||||
| Debt discount related to issuance of common stock warrants (1) |
(241 | ) | — | 35 | — | (206 | ) | |||||||||||||
| Discount related to the $3,750,000 Notes (1) |
(204 | ) | — | 29 | — | (175 | ) | |||||||||||||
|
|
|
|
|
|
|
|
|
|
|
|||||||||||
| $ | 12,005 | $ | — | $ | 64 | $ | — | $ | 12,069 | |||||||||||
|
|
|
|
|
|
|
|
|
|
|
|||||||||||
| (1) | The amortization of this account is included in interest expense in the consolidated statements of operations and as non-cash interest expense in the consolidated statements of cash flows. |
On June 14, 2013, the Company entered into a credit facility agreement (June 2013 Credit Facility) with a group of lenders that were, or that were affiliated with, existing investors in the Company. Under the June 2013 Credit Facility, the lenders have committed to permit the Company to draw an aggregate of up to $5,000,000, and, subject to the Company’s obtaining additional commitments from lenders, such amount may be increased to up to $7,000,000. The June 2013 Credit Facility expires on June 30, 2014. During the term of the June 2013 Credit Facility, the Company could request from the lenders up to four advances, with each advance equal to one-quarter of each lender’s aggregate commitment amount. The Company would issue a promissory note in the principal amount of each such advance that would accrue interest at a rate of 10% per annum. The principal and all unpaid interest under the promissory notes would be due on the maturity date, and the Company could not prepay the promissory notes prior to the maturity date without consent of at least a majority in interest of the aggregate principal amount of the promissory notes then outstanding under the credit facility. In connection with the June 2013 Credit Facility, the Company paid a fee of 2% of the total commitment amount to the lenders. In addition, the Company incurred an additional $10,000 in financing-related costs, primarily legal fees. These costs were recorded as deferred financing costs as a component of current other assets and are being amortized to interest expense over the term of the arrangement.
In connection with the June 2013 Credit Facility, the Company issued warrants (June 2013 Warrants) to purchase a number of shares of common stock equal to 10% of the total committed amount of the June 2013 Credit Facility divided by 70% of the value of common stock in a sale of the Company or a qualified IPO, with such June 2013 Warrants to have an exercise price of 70% of the value of common stock in a sale of the Company or a qualified IPO. The June 2013 Warrants expire upon the earlier of June 14, 2023 or the sale of the Company. As the predominant settlement feature of the June 2013 Warrants was to settle a fixed monetary amount with a variable number of shares, the June 2013 Warrants were accounted for under ASC 480. Accordingly, the June 2013 Warrants were recorded at estimated fair value on their issuance date and were adjusted to their estimated fair value as of each reporting date with the change in estimated fair value recorded as a component of change in estimated fair value of financial instruments in the Company’s consolidated statements of operations. The fair value of the June 2013 Warrants at the date of issuance of $435,000 was recorded as a deferred financing cost as a current other asset and is being amortized to interest expense over the term of the arrangement. Until the effective date of the IPO in August 2013, the Company estimated the fair value of the June 2013 Warrants using a PWERM valuation based on unobservable inputs and, therefore, the June 2013 Warrants were considered to be Level 3 liabilities. Upon closing of the IPO, the exercise price of the June 2013 Warrants was determined to be $8.40 per share and the number of shares to be issued upon exercise of the warrants was no longer variable. As a result of the IPO, the June 2013 Warrants were considered to be indexed to the Company’s stock, and accordingly, the common stock warrants liability was reclassified and included in stockholders’ equity during the year ended December 31, 2013.
During the three months ended and as of March 31, 2014 and the year ended December 31, 2013, there were no amounts outstanding under the June 2013 Credit Facility.
F-62
Table of Contents
The Company is also required to comply with certain affirmative and negative covenants under the debt agreements discussed above. In the event of default on the debt, the lender(s) may declare the entire unpaid principal and interest immediately due and payable. As of March 31, 2014, the Company was in compliance with all of the affirmative and negative covenants, and there were no events of default, as defined in the agreements, related to the debt.
11. Share-Based Plans
As of March 31, 2014, there were 2,974,000 options outstanding and 1,128,000 share-based awards available for grant under the outstanding equity incentive plans.
For the three months ended March 31, 2014, the Company recognized share-based compensation of $1,522,000, of which $444,000 related to the accelerated vesting of Donald Glidewell’s option awards. In connection with Mr. Glidewell’s retirement, the Company entered into a transition agreement with Mr. Glidewell (See Note 8) which provided, among other things, for the vesting of his outstanding equity awards through the retirement date. For the three months ended March 31, 2013, the Company recognized share-based compensation of $249,000.
During the three months ended March 31, 2014, the Company granted 769,000 options at a weighted-average exercise price of $14.87 per share. During the three months ended March 31, 2014, 378,000 options were exercised at a weighted-average exercise price of $2.49 per share.
12. Commitments and Contingencies
Commitments
On September 9, 2013, the Company entered into a lease agreement for a new 28,700 square foot office and laboratory facility located in Davis, California. The initial term of the lease is for a period of 60 months commencing on the later of the date of substantial completion of initial improvements to the leased property, or May 1, 2014. The monthly base rent is $46,000 for the first 12 months with a 3% increase each year thereafter. The Company has the option to extend the lease term twice for a period of five years each. This agreement was subsequently amended in April 2014 (See Note 15).
Contingencies
The Company is subject to legal proceedings and claims that arise in the normal course of business. As of March 31, 2014, there were no current proceedings or litigation involving the Company that management believes would have a material adverse impact on its business, financial position, results of operations or cash flows.
13. Reverse Stock Split
On August 1, 2013, the Company amended and restated its certificate of incorporation to effect the conversion of its outstanding convertible preferred stock into common stock on a 1-for-1 basis followed immediately by a reverse split of shares of its common stock (including the common stock issued upon conversion of the convertible preferred stock) at a 1-for-3.138458 ratio (the “Reverse Stock Split”). The amendment also increased the number of shares of common stock authorized for issuance to 250,000,000 shares and the number of shares of preferred stock authorized for issuance to 20,000,000. The par value of the common stock and preferred stock was not adjusted as a result of the Reverse Stock Split.
All issued and outstanding common stock, preferred stock, and warrants for common stock or preferred stock, and the related per share amounts contained in the condensed consolidated financial statements, have been retroactively adjusted to give effect to this Reverse Stock Split for all periods presented.
14. Related Party Transactions
Les Lyman, a member of the Company’s board of directors, is the chairman and significant indirect shareholder of The Tremont Group, Inc. During the three months ended March 31, 2014, The Tremont Group, Inc. purchased
F-63
Table of Contents
$320,000 of the Company’s products for further distribution and resale. As of March 31, 2014, the Company had outstanding accounts receivable due from The Tremont Group, Inc. of $1,230,000. Although the Company anticipates sales of its products to The Tremont Group, Inc. to continue through 2014, the Company cannot estimate the amount of those sales.
During the three months ended March 31, 2014, the Company recorded revenue of $328,000 relating to license revenue recognized based on the terms of the Company’s agreements with Syngenta, an affiliate of one of our 5% stockholders. As of March 31, 2014, the Company had no outstanding accounts receivable due from Syngenta.
15. Subsequent Events
In April 2014, the Company entered into an agreement with a bank for a revolving line of credit, which allows the Company to borrow up to $5,000,000 with an interest rate of 1.5%. The line of credit is payable in full upon the bank’s demand, if no demand is made, it is payable in full in April 2015. Interest is payable monthly beginning in May 2014. In accordance with the terms of the agreement, the Company deposited $5,000,000 into a restricted deposit account with the bank as collateral.
In April 2014, the Company entered into an agreement to amend the lease agreement for the new office and laboratory facility located in Davis, California. The amendment extends the commencement date to the later of August 1, 2014 or substantial completion of initial improvements. In addition, the square footage leased was reduced to 27,303 square feet and the monthly base rent was reduced to $44,000 per month for the first 12 months, with a 3% increase each year thereafter.
Concurrent with this amendment in April 2014, the Company entered into a lease agreement with an affiliate of the landlord to lease 17,438 square feet of office and laboratory space in the same building complex in Davis, California. The initial term of the lease is for a period of 60 months commencing on the date of substantial completion of initial improvements. If the premises are not delivered by September 1, 2014, then the Company can terminate the lease at any time prior to January 1, 2015. The monthly base rent is $28,000 with a 3% increase each year thereafter.
F-64
Table of Contents

Table of Contents
4,000,000 Shares
Marrone Bio Innovations, Inc.
Common Stock
PRELIMINARY PROSPECTUS
Jefferies
Piper Jaffray
, 2014
Table of Contents
PART II
INFORMATION NOT REQUIRED IN PROSPECTUS
| Item 13. | Other Expenses of Issuance and Distribution |
The following table sets forth the costs and expenses, other than the underwriting discount, payable by the registrant in connection with the sale and distribution of the securities being registered. All amounts are estimated except the SEC registration fee and the FINRA filing fee.
| AMOUNT TO BE PAID |
||||
| SEC Registration Fee |
$ | 5,285 | ||
| FINRA Filing Fee |
6,655 | |||
| Legal Fees and Expenses |
450,000 | |||
| Accounting Fees and Expenses |
200,000 | |||
| Printing and Engraving Expenses |
125,000 | |||
| Blue Sky Fees and Expenses |
25,000 | |||
| Transfer Agent and Registrar Fees |
5,000 | |||
| Miscellaneous Expenses |
33,060 | |||
|
|
|
|||
| Total |
$ | 850,000 | ||
| Item 14. | Indemnification of Directors and Officers |
Section 102(b)(7) of the Delaware General Corporation Law, or DGCL, provides that a corporation may, in its original certificate of incorporation or an amendment thereto, eliminate or limit the personal liability of a director for violations of the director’s fiduciary duty, except (1) for any breach of the director’s duty of loyalty to the corporation or its stockholders, (2) for acts or omissions not in good faith or which involve intentional misconduct or a knowing violation of law, (3) pursuant to Section 174 of the DGCL, which provides for liability of directors for unlawful payments of dividends or unlawful stock purchases or redemptions or (4) for any transaction from which a director derived an improper personal benefit.
Section 145 of the DGCL provides that a corporation may indemnify any person, including an officer or director, who is, or is threatened to be made, party to any threatened, pending or completed legal action, suit or proceeding, whether civil, criminal, administrative or investigative, other than an action by or in the right of such corporation, by reason of the fact that such person was an officer, director, employee or agent of such corporation or is or was serving at the request of such corporation as an officer, director, employee or agent of another corporation or enterprise. The indemnity may include expenses (including attorneys’ fees), judgments, fines and amounts paid in settlement actually and reasonably incurred by such person in connection with such action, suit or proceeding, provided such officer, director, employee or agent acted in good faith and in a manner he reasonably believed to be in, or not opposed to, the corporation’s best interest and, for criminal proceedings, had no reasonable cause to believe that his conduct was unlawful. A Delaware corporation may indemnify any officer or director in an action by or in the right of the corporation under the same conditions, except that no indemnification is permitted without judicial approval if the officer or director is adjudged to be liable to the corporation. Where an officer or director is successful on the merits or otherwise in the defense of any action referred to above, the corporation must indemnify him against the expenses that such officer or director actually and reasonably incurred.
Our certificate of incorporation as currently in effect provides for the indemnification of directors to the fullest extent permissible under Delaware law.
Our bylaws as currently in effect provide for the indemnification of officers and directors acting on our behalf if this person acted in good faith and in a manner reasonably believed to be in and not opposed to our best interest, and, with respect to any criminal action or proceeding, the indemnified party had no reason to believe his or her conduct was unlawful.
II-1
Table of Contents
In addition, we have entered into separate indemnification agreements with each of our executive officers and directors, a form of which is filed as Exhibit 10.4 hereto. Such agreements may require us, among other things, to advance expenses and otherwise indemnify our executive officers and directors against certain liabilities that may arise by reason of their status or service as executive officers or directors, to the fullest extent permitted by law. We intend to enter into indemnification agreements with any new directors and executive officers in the future.
The underwriting agreement (to be filed as Exhibit 1.1 hereto) provides for indemnification by the underwriters of us for certain liabilities arising under the Securities Act of 1933, as amended.
We have purchased and intend to maintain insurance on behalf of us and any person who is or was a director or officer against any loss arising from any claim asserted against him or her and incurred by him or her in that capacity, subject to certain exclusions and limits of the amount of coverage.
| Item 15. | Recent Sales of Unregistered Securities |
Since December 31, 2010, we have sold the following unregistered securities:
Preferred Stock.
From March 2011 through June 2011, we sold to accredited investors in a series of closings an aggregate of 2,492,302 shares of Series C convertible preferred stock at a per share price of $5.317, for aggregate consideration of approximately $13.3 million.
Warrants
In April 2012, we issued to an accredited investor a warrant to purchase 191,177 shares of Series C convertible preferred stock at an exercise price of $7.846 per share, for an aggregate exercise price of $1.5 million.
In October 2012, we issued to accredited investors warrants to purchase a variable number of shares of common stock, with coverage based on 15% of the aggregate of $7.5 million invested by such investors in promissory notes.
In April 2013, we issued to accredited investors warrants to purchase a variable number of shares of common stock, with coverage based on 20% of the aggregate of $4.95 million invested by such investors in promissory notes.
In June 2013, we issued to accredited investors warrants to purchase a variable number of shares of common stock, with coverage based on 10% of the $5.0 million provided by such investors under a credit facility agreement.
In March 2014, 5,950 shares of common stock were issued upon the cash exercise of outstanding common stock warrants at an exercise price of $8.40 per share, for an aggregate purchase price of $49,980.
Debt Securities
From March 2012 through May 2013, we sold to accredited investors, in a series of closings, convertible promissory notes for an aggregate consideration of approximately $30.6 million.
In April 2012, we sold to an accredited investor a senior secured promissory note for an aggregate consideration of $10.0 million (subsequently repaid).
From October 2012 through April 2013, we sold to accredited investors, in a series of closings, promissory notes for an aggregate consideration of approximately $12.45 million.
Equity Incentive Plans
Since December 31, 2010 pursuant to the 2006 Plan, we granted options to purchase an aggregate of 512,806 shares of common stock to directors, officers, employees and consultants, in each case having an exercise price of $1.19 per share.
Since December 31, 2010 pursuant to the 2011 Plan, we granted options to purchase an aggregate of 1,322,906 shares of common stock to directors, officers, employees and consultants, with a weighted-average exercise price of $7.36 per share.
II-2
Table of Contents
Common Stock
In August 2013, upon the completion of our initial public offering, we issued an aggregate of 3,740,865 shares of common stock in connection with the automatic conversion of outstanding convertible promissory notes, and an aggregate of 130,700 shares of common stock in connection with the exercise of outstanding warrants.
Since December 31, 2010, and prior to filing a Registration Statement on Form S-8, we have issued and sold an aggregate of 67,565 shares of common stock to directors, officers, employees and consultants at per share prices ranging from $0.08 to $3.11 pursuant to the exercise of stock options granted under our 2006 Plan and 2011 Plan.
| Item 16. | Exhibits and Financial Statement Schedules |
(a) Exhibits
EXHIBIT INDEX
| INCORPORATED BY REFERENCE | FILED | |||||||||||
| EXHIBIT |
EXHIBIT DESCRIPTION |
FORM | FILE NO. | EXHIBIT NUMBER |
FILING DATE | |||||||
| 1.1 | Form of Underwriting Agreement. | X | ||||||||||
| 3.1 | Fourth Amended and Restated Certificate of Incorporation of Marrone Bio Innovations, Inc. | 10-K | 001-36030 | 3.1 | March 25, 2014 | |||||||
| 3.2 | Amended and Restated Bylaws of Marrone Bio Innovations, Inc. | 10-K | 001-36030 | 3.2 | March 25, 2014 | |||||||
| 4.1 | Form of Marrone Bio Innovations, Inc.’s common stock certificate. | S-1/A | 333-189753 | 10.4 | July 22, 2013 | |||||||
| 4.2 | Form of promissory note warrants. | 10-K | 001-36030 | 4.2 | March 25, 2014 | |||||||
| 4.3 | Form of credit facility warrants. | 10-K | 001-36030 | 4.3 | March 25, 2014 | |||||||
| 5.1 | Opinion of Morrison & Foerster LLP. | X | ||||||||||
| 10.1† | Marrone Bio Innovations, Inc. Stock Option Plan and related documents. | S-1 | 333-189753 | 10.1 | July 1, 2013 | |||||||
| 10.2† | Marrone Bio Innovations, Inc. 2011 Stock Plan and related documents. | S-1 | 333-189753 | 10.2 | July 1, 2013 | |||||||
| 10.3† | Marrone Bio Innovations, Inc. 2013 Stock Incentive Plan and related documents. | S-1/A | 333-189753 | 10.3 | July 22, 2013 | |||||||
| 10.4† | Indemnification Agreement by and between Marrone Bio Innovations, Inc. and each of its directors and executive officers. | S-1/A | 333-189753 | 10.4 | July 22, 2013 | |||||||
| 10.5† | Offer letter, dated June 29, 2006, between Marrone Organic Innovations, Inc. and Dr. Pamela G. Marrone. | S-1 | 333-189753 | 10.5 | July 1, 2013 | |||||||
| 10.6† | Offer letter, dated March 16, 2011, between Marrone Bio Innovations, Inc. and Donald J. Glidewell. | S-1 | 333-189753 | 10.6 | July 1, 2013 | |||||||
| 10.7† | Offer letter, dated August 7, 2012, between Marrone Bio Innovations, Inc. and Hector Absi. | S-1 | 333-189753 | 10.7 | July 1, 2013 | |||||||
II-3
Table of Contents
| INCORPORATED BY REFERENCE | FILED | |||||||||||||
| EXHIBIT |
EXHIBIT DESCRIPTION |
FORM | FILE NO. | EXHIBIT NUMBER |
FILING DATE | |||||||||
| 10.8† | Offer letter, dated February 10, 2014, between Marrone Bio Innovations, Inc. and James B. Boyd. | 10-K | 001-36030 | 10.8 | March 25, 2014 | |||||||||
| 10.9† | Transition agreement, dated November 7, 2013, between Marrone Bio Innovations, Inc. and Donald J. Glidewell. | 10-K | 001-36030 | 10.9 | March 25, 2014 | |||||||||
| 10.10† | Offer letter, dated February 26, 2014, between Marrone Bio Innovations, Inc. and Linda V. Moore. | 10-Q | 001-36030 | 10.2 | May 15, 2014 | |||||||||
| 10.11 | Standard Multi-Tenant Office Lease, dated August 3, 2007, by and between Davis Commerce Center, LLC and Marrone Organic Innovations, Inc. | S-1 | 333-189753 | 10.8 | July 1, 2013 | |||||||||
| 10.12 | First Amendment to Lease, dated January 1, 2008, by and between Davis Commerce Center, LLC and Marrone Organic Innovations, Inc. | S-1 | 333-189753 | 10.9 | July 1, 2013 | |||||||||
| 10.13 | Second Amendment to Lease, dated November 13, 2008, by and between 2121 Second Street Investors, LLC and Marrone Organic Innovations, Inc. | S-1 | 333-189753 | 10.10 | July 1, 2013 | |||||||||
| 10.14 | Third Amendment to Lease, dated September 20, 2010, by and between 2121 Second Street Investors, LLC and Marrone Bio Innovations, Inc. | S-1 | 333-189753 | 10.11 | July 1, 2013 | |||||||||
| 10.15 | Fourth Amendment to Lease, dated March 14, 2012, by and between 2121 Second Street Investors, LLC and Marrone Bio Innovations, Inc. | S-1 | 333-189753 | 10.12 | July 1, 2013 | |||||||||
| 10.16 | Fifth Amendment to Lease, dated March 14, 2012, by and between 2121 Second Street Investors, LLC and Marrone Bio Innovations, Inc. | S-1 | 333-189753 | 10.13 | July 1, 2013 | |||||||||
| 10.17 | Sixth Amendment to Lease, dated December 21, 2012, by and between 2121 Second Street Investors, LLC and Marrone Bio Innovations, Inc. | S-1 | 333-189753 | 10.14 | July 1, 2013 | |||||||||
II-4
Table of Contents
| INCORPORATED BY REFERENCE | FILED | |||||||||||
| EXHIBIT |
EXHIBIT DESCRIPTION |
FORM | FILE NO. | EXHIBIT NUMBER |
FILING DATE | |||||||
| 10.18 | Lease Agreement with Six Davis, LLC. | 10-Q | 001-36030 | 10.1 | September 13, 2013 | |||||||
| 10.19 | First Amendment to Lease, dated April 30, 2014, by and between Six Davis LLC and Marrone Bio Innovations, Inc. | 10-Q | 001-36030 | 10.3 | May 15, 2014 | |||||||
| 10.20 | Office Lease, dated April 30, 2014, by and between Seven Davis LLC and Marrone Bio Innovations, Inc. | 10-Q | 001-36030 | 10.4 | May 15, 2014 | |||||||
| 10.21 | Convertible Note Purchase Agreement, dated March 15, 2012, by and among Marrone Bio Innovations, Inc. and the Investors party thereto, including form of convertible promissory note. | S-1 | 333-189753 | 10.15 | July 1, 2013 | |||||||
| 10.22 | Amendment and Consent, dated August 30, 2012, by and among Marrone Bio Innovations, Inc. and the Investors party thereto, including form of convertible promissory note. | S-1 | 333-189753 | 10.16 | July 1, 2013 | |||||||
| 10.23 | Loan Agreement, dated October 2, 2012, by and among Marrone Bio Innovations, Inc., the Investors party thereto and the administrative and collateral agent, including form of promissory note and warrant. | S-1 | 333-189753 | 10.17 | July 1, 2013 | |||||||
| 10.24 | Security Agreement, dated October 2, 2012, by and among Marrone Bio Innovations, Inc. and the administrative and collateral agent. | S-1 | 333-189753 | 10.18 | July 1, 2013 | |||||||
| 10.25 | Loan Agreement, dated October 16, 2012, by and among Marrone Bio Innovations, Inc., the Investor party thereto and the administrative and collateral agent, including form of convertible promissory note. | S-1 | 333-189753 | 10.19 | July 1, 2013 | |||||||
| 10.26 | Security Agreement, dated October 16, 2012, by and among Marrone Bio Innovations, Inc. and the administrative and collateral agent. | S-1 | 333-189753 | 10.20 | July 1, 2013 | |||||||
| 10.27 | Note Purchase Agreement, dated December 6, 2012, by and between Marrone Bio Innovations, Inc. and Syngenta Ventures Pte. Ltd., including convertible promissory note. | S-1 | 333-189753 | 10.21 | July 1, 2013 | |||||||
II-5
Table of Contents
| INCORPORATED BY REFERENCE | FILED | |||||||||||
| EXHIBIT |
EXHIBIT DESCRIPTION |
FORM | FILE NO. | EXHIBIT NUMBER |
FILING DATE | |||||||
| 10.28 | Intercreditor Agreement, dated December 6, 2012, by and among Marrone Bio Innovations, Inc., Syngenta Ventures Pte. Ltd. and the administrative agent and collateral agent. | S-1 | 333-189753 | 10.22 | July 1, 2013 | |||||||
| 10.29 | Amendment and Consent, dated April 10, 2013, by and among Marrone Bio Innovations, Inc. and the administrative agent party thereto. | S-1 | 333-189753 | 10.23 | July 1, 2013 | |||||||
| 10.30 | Convertible Note Purchase Agreement, dated May 22, 2013, by and between Marrone Bio Innovations, Inc. and the Investors party thereto, including form of convertible promissory note. | S-1 | 333-189753 | 10.31 | July 1, 2013 | |||||||
| 10.31 | Convertible Note Purchase Agreement, dated May 30, 2012, by and among Marrone Bio Innovations, Inc. and DSM Venturing BV, including form of convertible promissory note. | S-1 | 333-189753 | 10.32 | July 1, 2013 | |||||||
| 10.32 | Loan Agreement, dated October 2, 2012, by and among Marrone Bio Innovations, Inc., the Investors party thereto and the administrative and collateral agent, including form of promissory note and warrant. | S-1 | 333-189753 | 10.17 | July 1, 2013 | |||||||
| 10.33 | Security Agreement, dated October 2, 2012, by and among Marrone Bio Innovations, Inc. and the administrative and collateral agent. | S-1 | 333-189753 | 10.18 | July 1, 2013 | |||||||
| 10.34 | Amendment and Consent, dated April 10, 2013, by and among Marrone Bio Innovations, Inc. and the administrative agent party thereto. | S-1 | 333-189753 | 10.23 | July 1, 2013 | |||||||
| 10.35 | Credit Facility Agreement, dated June 14, 2013, by and among Marrone Bio Innovations, Inc. and the Investors party thereto, including form of promissory note and warrant. | S-1 | 333-189753 | 10.33 | July 1, 2013 | |||||||
II-6
Table of Contents
| INCORPORATED BY REFERENCE | FILED | |||||||||||||
| EXHIBIT |
EXHIBIT DESCRIPTION |
FORM | FILE NO. | EXHIBIT NUMBER |
FILING DATE | |||||||||
| 10.36 | Promissory Note, dated April 30, 2014, by and between Five Star Bank and jointly and severally and Marrone Michigan Manufacturing, LLC and Marrone Bio Innovations, Inc. | 10-Q | 001-036030 | 10.5 | May 15, 2014 | |||||||||
| 10.37†† | License Agreement, dated May 22, 2007, between the KHH Biosci, Inc. and Marrone Organic Innovations, Inc. | S-1/A | 333-189753 | 10.24 | July 31, 2013 | |||||||||
| 10.38†† | License Agreement, dated November 13, 2007, between the U.S. Government, as represented by the U.S. Department of Agriculture, Agricultural Research Service, and Marrone Organic Innovations, Inc. | S-1 | 333-189753 | 10.25 | July 1, 2013 | |||||||||
| 10.39†† | License Agreement, dated December 28, 2009, between the University of the State of New York and Marrone Bio Innovations, Inc. | S-1/A | 333-189753 | 10.26 | July 31, 2013 | |||||||||
| 10.40†† | Commercial Agreement, dated February 1, 2011, between Syngenta Crop Protection AG and Marrone Bio Innovations, Inc. | S-1/A | 333-189753 | 10.27 | July 31, 2013 | |||||||||
| 10.41†† | Commercial Agreement, dated August 26, 2011, between FMC Corporation and Marrone Bio Innovations, Inc. | S-1/A | 333-189753 | 10.28 | July 31, 2013 | |||||||||
| 10.42†† | Technology Evaluation and Master Development Agreement, dated September 13, 2011, between The Scotts Company LLC and Marrone Bio Innovations, Inc. | S-1/A | 333-189753 | 10.29 | July 31, 2013 | |||||||||
| 10.43 | Asset Purchase Agreement, dated May 25, 2012, between Bankruptcy Trustee for Michigan BioDiesel, LLC and Marrone Bio Innovations, Inc. | S-1 | 333-189753 | 10.30 | July 1, 2013 | |||||||||
| 21.1 | Subsidiary List of Marrone Bio Innovations, Inc. | S-1/A | 333-189753 | 21.1 | July 22, 2013 | |||||||||
| 23.1 | Consent of Ernst & Young LLP, Independent Registered Public Accounting Firm. | X | ||||||||||||
| 23.2 | Consent of Counsel (included in exhibit 5.1). | X | ||||||||||||
II-7
Table of Contents
| INCORPORATED BY REFERENCE | FILED | |||||||||||
| EXHIBIT |
EXHIBIT DESCRIPTION |
FORM | FILE NO. | EXHIBIT NUMBER |
FILING DATE | |||||||
| 24.1 | Power of Attorney. | * | ||||||||||
| 101.1††† | Interactive Data Files Pursuant to Rule 405 of Regulation S-T: (i) Consolidated Balance Sheets as of December 31, 2013 and 2012; (ii) Consolidated Statements of Operations for the Years ended December 31, 2013, 2012 and 2011; (iii) Consolidated Statements of Comprehensive Loss for the Years ended December 31, 2013, 2012 and 2011; (iv) Consolidated Statements of Convertible Preferred Stock and Stockholders’ Equity (Deficit) as of December 31, 2013, 2012 and 2011; (v) Consolidated Statements of Cash Flows for the Years ended December 31, 2013, 2012 and 2011 and (vi) Notes to Consolidated Financial Statements. | * | ||||||||||
| 101.2††† | Interactive Data Files Pursuant to Rule 405 of Regulation S-T: (i) Condensed Consolidated Balance Sheets as of March 31, 2014 and December 31, 2013, (ii) Condensed Consolidated Statements of Operations for the Three Months ended March 31, 2014 and March 31, 2013, (iii) Condensed Consolidated Statements of Comprehensive Loss for the Three Months ended March 31, 2014 and March 31, 2013, (iv) Condensed Consolidated Statements of Cash Flows for the Three Months ended March 31, 2014 and March 31, 2013 and (v) Notes to Condensed Consolidated Financial Statements | 10-Q | 001-36030 | 101 | May 15, 2014 | * | ||||||
| * | Previously filed. |
| † | Indicates a management contract or compensatory plan or arrangement. |
| †† | Confidential portions of this document have been redacted and filed separately with the Securities and Exchange Commission. |
| ††† | In accordance with Rule 406T of Regulation S-T, the information in these exhibits is furnished and deemed not filed or part of a registration statement or prospectus for purposes of sections 11 or 12 of the Securities Act of 1933, is deemed not filed for purposes of section 18 of the Exchange Act of 1934, and otherwise is not subject to liability under these sections. |
II-8
Table of Contents
| Item 17. | Undertakings |
The undersigned registrant hereby undertakes that:
| (1) | For purposes of determining any liability under the Securities Act, the information omitted from the form of prospectus as filed as part of this Registration Statement in reliance upon Rule 430A and contained in a form of prospectus filed by the registrant pursuant to Rule 424(b)(1) or (4) or 497(h) under the Securities Act shall be deemed to be part of this Registration Statement as of the time it was declared effective. |
| (2) | For the purpose of determining any liability under the Securities Act, each post-effective amendment that contains a form of prospectus shall be deemed to be a new Registration Statement relating to the securities offered therein, and the offering of such securities at that time shall be deemed to be the initial bona fide offering thereof. |
Insofar as indemnification for liabilities arising under the Securities Act may be permitted to directors, officers and controlling persons of the registrant pursuant to the foregoing provisions, or otherwise, the registrant has been advised that in the opinion of the SEC such indemnification is against public policy as expressed in the Securities Act and is, therefore, unenforceable. In the event that a claim for indemnification against such liabilities (other than the payment by the registrant of expenses incurred or paid by a director, officer or controlling person of the registrant in the successful defense of any action, suit or proceeding) is asserted by such director, officer or controlling person in connection with the securities being registered, the registrant will, unless in the opinion of its counsel the matter has been settled by controlling precedent, submit to a court of appropriate jurisdiction the question whether such indemnification by it is against public policy as expressed in the Securities Act and will be governed by the final adjudication of such issue.
II-9
Table of Contents
SIGNATURES
Pursuant to the requirements of the Securities Act of 1933, we have duly caused this Registration Statement on Form S-1 to be signed on its behalf by the undersigned, thereunto duly authorized, in the City of Davis, State of California, on June 2, 2014.
| MARRONE BIO INNOVATIONS, INC. |
| /S/ PAMELA G. MARRONE |
| Pamela G. Marrone President and Chief Executive Officer |
Pursuant to the requirements of the Securities Act of 1933, as amended, this Registration Statement on Form S-1 has been signed by the following persons in the capacities and on the dates indicated.
| SIGNATURE |
TITLE |
DATE | ||||||
| /S/ PAMELA G. MARRONE Pamela G. Marrone |
President and Chief Executive Officer (Principal Executive Officer) |
June 2, 2014 | ||||||
| /S/ JAMES B. BOYD James B. Boyd |
Chief Financial Officer (Principal Financial Officer and Principal Accounting Officer) |
June 2, 2014 | ||||||
| * Elin Miller |
Chair of the Board | June 2, 2014 | ||||||
| * Pamela Contag |
Director | June 2, 2014 | ||||||
| * Tim Fogarty |
Director | June 2, 2014 | ||||||
| * Les Lyman |
Director | June 2, 2014 | ||||||
| * Richard Rominger |
Director | June 2, 2014 | ||||||
| * Shaugn Stanley |
Director | June 2, 2014 | ||||||
| *By: | /S/ PAMELA G. MARRONE | |
| Pamela G. Marrone | ||
| Attorney-in-Fact |
II-10
Table of Contents
EXHIBIT INDEX
| EXHIBIT DESCRIPTION |
INCORPORATED BY REFERENCE | FILED HEREWITH | ||||||||||||
| EXHIBIT |
FORM | FILE NO. | EXHIBIT NUMBER |
FILING DATE | ||||||||||
| 1.1 | Form of Underwriting Agreement. | X | ||||||||||||
| 3.1 | Fourth Amended and Restated Certificate of Incorporation of Marrone Bio Innovations, Inc. | 10-K | 001-36030 | 3.1 | March 25, 2014 | |||||||||
| 3.2 | Amended and Restated Bylaws of Marrone Bio Innovations, Inc. | 10-K | 001-36030 | 3.2 | March 25, 2014 | |||||||||
| 4.1 | Form of Marrone Bio Innovations, Inc.’s common stock certificate. | S-1/A | 333-189753 | 10.4 | July 22, 2013 | |||||||||
| 4.2 | Form of promissory note warrants. | 10-K | 001-36030 | 4.2 | March 25, 2014 | |||||||||
| 4.3 | Form of credit facility warrants. | 10-K | 001-36030 | 4.3 | March 25, 2014 | |||||||||
| 5.1 | Opinion of Morrison & Foerster LLP. | X | ||||||||||||
| 10.1† | Marrone Bio Innovations, Inc. Stock Option Plan and related documents. | S-1 | 333-189753 | 10.1 | July 1, 2013 | |||||||||
| 10.2† | Marrone Bio Innovations, Inc. 2011 Stock Plan and related documents. | S-1 | 333-189753 | 10.2 | July 1, 2013 | |||||||||
| 10.3† | Marrone Bio Innovations, Inc. 2013 Stock Incentive Plan and related documents. | S-1/A | 333-189753 | 10.3 | July 22, 2013 | |||||||||
| 10.4† | Indemnification Agreement by and between Marrone Bio Innovations, Inc. and each of its directors and executive officers. | S-1/A | 333-189753 | 10.4 | July 22, 2013 | |||||||||
| 10.5† | Offer letter, dated June 29, 2006, between Marrone Organic Innovations, Inc. and Dr. Pamela G. Marrone. | S-1 | 333-189753 | 10.5 | July 1, 2013 | |||||||||
| 10.6† | Offer letter, dated March 16, 2011, between Marrone Bio Innovations, Inc. and Donald J. Glidewell. | S-1 | 333-189753 | 10.6 | July 1, 2013 | |||||||||
| 10.7† | Offer letter, dated August 7, 2012, between Marrone Bio Innovations, Inc. and Hector Absi. | S-1 | 333-189753 | 10.7 | July 1, 2013 | |||||||||
Table of Contents
| EXHIBIT DESCRIPTION |
INCORPORATED BY REFERENCE | FILED HEREWITH | ||||||||||||
| EXHIBIT |
FORM | FILE NO. | EXHIBIT NUMBER |
FILING DATE | ||||||||||
| 10.8† | Offer letter, dated February 10, 2014, between Marrone Bio Innovations, Inc. and James B. Boyd. | 10-K | 001-36030 | 10.8 | March 25, 2014 | |||||||||
| 10.9† | Transition agreement, dated November 7, 2013, between Marrone Bio Innovations, Inc. and Donald J. Glidewell. | 10-K | 001-36030 | 10.9 | March 25, 2014 | |||||||||
| 10.10† | Offer letter, dated February 26, 2014, between Marrone Bio Innovations, Inc. and Linda V. Moore. | 10-Q | 001-36030 | 10.2 | May 15, 2014 | |||||||||
| 10.11 | Standard Multi-Tenant Office Lease, dated August 3, 2007, by and between Davis Commerce Center, LLC and Marrone Organic Innovations, Inc. | S-1 | 333-189753 | 10.8 | July 1, 2013 | |||||||||
| 10.12 | First Amendment to Lease, dated January 1, 2008, by and between Davis Commerce Center, LLC and Marrone Organic Innovations, Inc. | S-1 | 333-189753 | 10.9 | July 1, 2013 | |||||||||
| 10.13 | Second Amendment to Lease, dated November 13, 2008, by and between 2121 Second Street Investors, LLC and Marrone Organic Innovations, Inc. | S-1 | 333-189753 | 10.10 | July 1, 2013 | |||||||||
| 10.14 | Third Amendment to Lease, dated September 20, 2010, by and between 2121 Second Street Investors, LLC and Marrone Bio Innovations, Inc. | S-1 | 333-189753 | 10.11 | July 1, 2013 | |||||||||
| 10.15 | Fourth Amendment to Lease, dated March 14, 2012, by and between 2121 Second Street Investors, LLC and Marrone Bio Innovations, Inc. | S-1 | 333-189753 | 10.12 | July 1, 2013 | |||||||||
| 10.16 | Fifth Amendment to Lease, dated March 14, 2012, by and between 2121 Second Street Investors, LLC and Marrone Bio Innovations, Inc. | S-1 | 333-189753 | 10.13 | July 1, 2013 | |||||||||
| 10.17 | Sixth Amendment to Lease, dated December 21, 2012, by and between 2121 Second Street Investors, LLC and Marrone Bio Innovations, Inc. | S-1 | 333-189753 | 10.14 | July 1, 2013 | |||||||||
Table of Contents
| EXHIBIT DESCRIPTION |
INCORPORATED BY REFERENCE | FILED HEREWITH | ||||||||||||
| EXHIBIT |
FORM | FILE NO. | EXHIBIT NUMBER |
FILING DATE | ||||||||||
| 10.18 | Lease Agreement with Six Davis, LLC. | 10-Q | 001-36030 | 10.1 | September 13, 2013 | |||||||||
| 10.19 | First Amendment to Lease, dated April 30, 2014, by and between Six Davis LLC and Marrone Bio Innovations, Inc. | 10-Q | 001-36030 | 10.3 | May 15, 2014 | |||||||||
| 10.20 | Office Lease, dated April 30, 2014, by and between Seven Davis LLC and Marrone Bio Innovations, Inc. | 10-Q | 001-36030 | 10.4 | May 15, 2014 | |||||||||
| 10.21 | Convertible Note Purchase Agreement, dated March 15, 2012, by and among Marrone Bio Innovations, Inc. and the Investors party thereto, including form of convertible promissory note. | S-1 | 333-189753 | 10.15 | July 1, 2013 | |||||||||
| 10.22 | Amendment and Consent, dated August 30, 2012, by and among Marrone Bio Innovations, Inc. and the Investors party thereto, including form of convertible promissory note. | S-1 | 333-189753 | 10.16 | July 1, 2013 | |||||||||
| 10.23 | Loan Agreement, dated October 2, 2012, by and among Marrone Bio Innovations, Inc., the Investors party thereto and the administrative and collateral agent, including form of promissory note and warrant. | S-1 | 333-189753 | 10.17 | July 1, 2013 | |||||||||
| 10.24 | Security Agreement, dated October 2, 2012, by and among Marrone Bio Innovations, Inc. and the administrative and collateral agent. | S-1 | 333-189753 | 10.18 | July 1, 2013 | |||||||||
| 10.25 | Loan Agreement, dated October 16, 2012, by and among Marrone Bio Innovations, Inc., the Investor party thereto and the administrative and collateral agent, including form of convertible promissory note. | S-1 | 333-189753 | 10.19 | July 1, 2013 | |||||||||
Table of Contents
| EXHIBIT DESCRIPTION |
INCORPORATED BY REFERENCE | FILED HEREWITH | ||||||||||||
| EXHIBIT |
FORM | FILE NO. | EXHIBIT NUMBER |
FILING DATE | ||||||||||
| 10.26 | Security Agreement, dated October 16, 2012, by and among Marrone Bio Innovations, Inc. and the administrative and collateral agent. | S-1 | 333-189753 | 10.20 | July 1, 2013 | |||||||||
| 10.27 | Note Purchase Agreement, dated December 6, 2012, by and between Marrone Bio Innovations, Inc. and Syngenta Ventures Pte. Ltd., including convertible promissory note. | S-1 | 333-189753 | 10.21 | July 1, 2013 | |||||||||
| 10.28 | Intercreditor Agreement, dated December 6, 2012, by and among Marrone Bio Innovations, Inc., Syngenta Ventures Pte. Ltd. and the administrative agent and collateral agent. | S-1 | 333-189753 | 10.22 | July 1, 2013 | |||||||||
| 10.29 | Amendment and Consent, dated April 10, 2013, by and among Marrone Bio Innovations, Inc. and the administrative agent party thereto. | S-1 | 333-189753 | 10.23 | July 1, 2013 | |||||||||
| 10.30 | Convertible Note Purchase Agreement, dated May 22, 2013, by and between Marrone Bio Innovations, Inc. and the Investors party thereto, including form of convertible promissory note. | S-1 | 333-189753 | 10.31 | July 1, 2013 | |||||||||
| 10.31 | Convertible Note Purchase Agreement, dated May 30, 2012, by and among Marrone Bio Innovations, Inc. and DSM Venturing BV, including form of convertible promissory note. | S-1 | 333-189753 | 10.32 | July 1, 2013 | |||||||||
| 10.32 | Loan Agreement, dated October 2, 2012, by and among Marrone Bio Innovations, Inc., the Investors party thereto and the administrative and collateral agent, including form of promissory note and warrant. | S-1 | 333-189753 | 10.17 | July 1, 2013 | |||||||||
Table of Contents
| EXHIBIT DESCRIPTION |
INCORPORATED BY REFERENCE | FILED HEREWITH | ||||||||||||
| EXHIBIT |
FORM | FILE NO. | EXHIBIT NUMBER |
FILING DATE | ||||||||||
| 10.33 | Security Agreement, dated October 2, 2012, by and among Marrone Bio Innovations, Inc. and the administrative and collateral agent. | S-1 | 333-189753 | 10.18 | July 1, 2013 | |||||||||
| 10.34 | Amendment and Consent, dated April 10, 2013, by and among Marrone Bio Innovations, Inc. and the administrative agent party thereto. | S-1 | 333-189753 | 10.23 | July 1, 2013 | |||||||||
| 10.35 | Credit Facility Agreement, dated June 14, 2013, by and among Marrone Bio Innovations, Inc. and the Investors party thereto, including form of promissory note and warrant. | S-1 | 333-189753 | 10.33 | July 1, 2013 | |||||||||
| 10.36 | Promissory Note, dated April 30, 2014, by and between Five Star Bank and jointly and severally and Marrone Michigan Manufacturing, LLC and Marrone Bio Innovations, Inc. | 10-Q | 001-036030 | 10.5 | May 15, 2014 | |||||||||
| 10.37†† | License Agreement, dated May 22, 2007, between the KHH Biosci, Inc. and Marrone Organic Innovations, Inc. | S-1/A | 333-189753 | 10.24 | July 31, 2013 | |||||||||
| 10.38†† | License Agreement, dated November 13, 2007, between the U.S. Government, as represented by the U.S. Department of Agriculture, Agricultural Research Service, and Marrone Organic Innovations, Inc. | S-1 | 333-189753 | 10.25 | July 1, 2013 | |||||||||
| 10.39†† | License Agreement, dated December 28, 2009, between the University of the State of New York and Marrone Bio Innovations, Inc. | S-1/A | 333-189753 | 10.26 | July 31, 2013 | |||||||||
| 10.40†† | Commercial Agreement, dated February 1, 2011, between Syngenta Crop Protection AG and Marrone Bio Innovations, Inc. | S-1/A | 333-189753 | 10.27 | July 31, 2013 | |||||||||
Table of Contents
| EXHIBIT DESCRIPTION |
INCORPORATED BY REFERENCE | FILED HEREWITH | ||||||||||||
| EXHIBIT |
FORM | FILE NO. | EXHIBIT NUMBER |
FILING DATE | ||||||||||
| 10.41†† | Commercial Agreement, dated August 26, 2011, between FMC Corporation and Marrone Bio Innovations, Inc. | S-1/A | 333-189753 | 10.28 | July 31, 2013 | |||||||||
| 10.42†† | Technology Evaluation and Master Development Agreement, dated September 13, 2011, between The Scotts Company LLC and Marrone Bio Innovations, Inc. | S-1/A | 333-189753 | 10.29 | July 31, 2013 | |||||||||
| 10.43 | Asset Purchase Agreement, dated May 25, 2012, between Bankruptcy Trustee for Michigan BioDiesel, LLC and Marrone Bio Innovations, Inc. | S-1 | 333-189753 | 10.30 | July 1, 2013 | |||||||||
| 21.1 | Subsidiary List of Marrone Bio Innovations, Inc. | S-1/A | 333-189753 | 21.1 | July 22, 2013 | |||||||||
| 23.1 | Consent of Ernst & Young LLP, Independent Registered Public Accounting Firm. | X | ||||||||||||
| 23.2 | Consent of Counsel (included in exhibit 5.1). | X | ||||||||||||
| 24.1 | Power of Attorney. | * | ||||||||||||
| 101.1†† | Interactive Data Files Pursuant to Rule 405 of Regulation S-T: (i) Consolidated Balance Sheets as of December 31, 2013 and 2012; (ii) Consolidated Statements of Operations for the Years ended December 31, 2013, 2012 and 2011; (iii) Consolidated Statements of Comprehensive Loss for the Years ended December 31, 2013, 2012 and 2011; (iv) Consolidated Statements of Convertible Preferred Stock and Stockholders’ Equity (Deficit) as of December 31, 2013, 2012 and 2011; (v) Consolidated Statements of Cash Flows for the Years ended December 31, 2013, 2012 and 2011 and (vi) Notes to Consolidated Financial Statements. | * | ||||||||||||
Table of Contents
| EXHIBIT DESCRIPTION |
INCORPORATED BY REFERENCE | FILED HEREWITH | ||||||||||
| EXHIBIT |
FORM | FILE NO. | EXHIBIT NUMBER |
FILING DATE | ||||||||
| 101.2††† | Interactive Data Files Pursuant to Rule 405 of Regulation S-T: (i) Condensed Consolidated Balance Sheets as of March 31, 2014 and December 31, 2013, (ii) Condensed Consolidated Statements of Operations for the Three Months ended March 31, 2014 and March 31, 2013, (iii) Condensed Consolidated Statements of Comprehensive Loss for the Three Months ended March 31, 2014 and March 31, 2013, (iv) Condensed Consolidated Statements of Cash Flows for the Three Months ended March 31, 2014 and March 31, 2013 and (v) Notes to Condensed Consolidated Financial Statements | 10-Q | 001-36030 | 101 | May 15, 2014 | * | ||||||
| * | Previously filed. |
| † | Indicates a management contract or compensatory plan or arrangement. |
| †† | Confidential portions of this document have been redacted and filed separately with the Securities and Exchange Commission. |
| ††† | In accordance with Rule 406T of Regulation S-T, the information in these exhibits is furnished and deemed not filed or part of a registration statement or prospectus for purposes of sections 11 or 12 of the Securities Act of 1933, is deemed not filed for purposes of section 18 of the Exchange Act of 1934, and otherwise is not subject to liability under these sections. |