Attached files
| file | filename |
|---|---|
| 8-K - CURRENT REPORT - AMERICAN REALTY CAPITAL HEALTHCARE TRUST INC | v380355_8k.htm |

American Realty Capital Healthcare Trust, Inc. (NASDAQ: HCT) Agrees to be Acquired by Ventas, Inc. (NYSE: VTR)
Investing in the Growth of Healthcare 2 ADDITIONAL INFORMATION & WHERE TO FIND IT This communication does not constitute an offer to sell or the solicitation of an offer to buy any securities or a solicitati on of any vote or approval. In connection with the proposed Merger, the Company expects to prepare and file with the SEC a proxy statement and Ventas expects to prepare and file with the SEC a registration statement on Form S - 4 containing the Company’s proxy statement as a presentation and other documents with respect to Ventas ’ proposed acquisition of the Company. INVESTORS ARE URGED TO READ THE PROXY STATEMENT/PRESENTATION (INCLUDING ALL AMENDMENTS AND SUPPLEMENTS THERETO) AND OTHER RELEVANT DOCUMENTS FILED BY THE COMPANY OR VENTAS WITH THE SEC IF AND WHEN THEY BECOME AVAILABLE BECAUSE THEY WILL CONTAIN IMPORTANT INFORMATION ABOUT THE PROPOSED MERGER. Investors may obtain free copies of the registration statement, proxy statement/presentation and other relevant documents filed by the Company and Ventas , as applicable, with the SEC (if and when they become available) through the website maintained by the SEC at www.sec.gov. Copies of the documents filed by the Company with the SEC are also available free of charge on the Company’s website at http://www.archealthcaretrust.com, and cop ies of the documents filed by Ventas with the SEC are available free of charge on Ventas ’ website at http://www.ventasreit.com. The Company, the Advisor and their respective directors and executive officers may be deemed to be participants in the solici tat ion of proxies from the Company’s stockholders in respect of the proposed Merger. Information regarding these persons can be found in the Company’s definitive pro xy statement filed with the SEC on April 28, 2014. Additional information regarding the interests of such potential participants will be included in the prox y statement/presentation and other relevant documents filed with the SEC in connection with the proposed Merger if and when they become available. These documen ts are available free of charge on the SEC’s website and from the Company or Ventas , as applicable, using the sources indicated above.

Investing in the Growth of Healthcare 3 FORWARD - LOOKING STATEMENTS This presentation contains forward - looking statements. You can identify forward - looking statements by the use of forward - looking terminology such as “believes,” “expects,” “may,” “will,” “would,” “could,” “should,” “seeks,” “intends,” “plans,” “projects,” “estimates,” “anticipates,” “predicts,” or “pote nti al” or the negative of these words and phrases or similar words or phrases. You can also identify forward - looking statements by discussions of strategy, plans or intentions. Please refer to the disclosure on page 27 for further information regarding forward - looking statements.

ACQUISITION BY VENTAS IS A VALUE CREATING TRANSACTION FOR HCT SHAREHOLDERS Investing in the Growth of Healthcare 4 NYSE Ticker: VTR Market Cap: $19.7 billion Target Closing: Q4 2014 Sale at $2.6 billion Implied $11.33 Net Price per HCT Share 1 Closed Non - Traded Offering April 2013 Fully Invested December 2013 Acquired High - Quality Healthcare Real Estate (2011 to 2013) Incorporated August 2010 Listed on NASDAQ April 2014 1) $11.33 is the net price payable to common stockholders after giving effect to the OP units to be issued to the Advisor
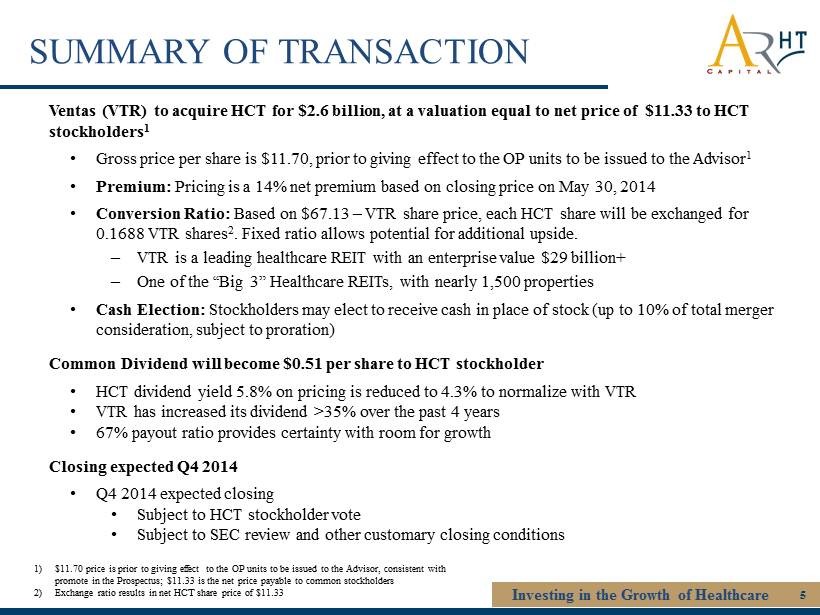
SUMMARY OF TRANSACTION Investing in the Growth of Healthcare 5 Ventas (VTR) to acquire HCT for $2.6 billion, at a valuation equal to net price of $ 11.33 to HCT stockholders 1 • Gross price per share is $ 11.70, prior to giving effect to the OP units to be issued to the Advisor 1 • Premium: Pricing is a 14% net premium based on closing price on May 30, 2014 • Conversion Ratio: Based on $67.13 – VTR share price, each HCT share will be exchanged for 0.1688 VTR shares 2 . Fixed ratio allows potential for additional upside. ‒ VTR is a leading healthcare REIT with an enterprise value $29 billion+ ‒ One of the “Big 3” Healthcare REITs, with nearly 1,500 properties • Cash Election: Stockholders may elect to receive cash in place of stock (up to 10% of total merger consideration, subject to proration) Common Dividend will become $0.51 per share to HCT stockholder • HCT dividend yield 5.8% on pricing is reduced to 4.3% to normalize with VTR • VTR has increased its dividend >35% over the past 4 years • 67% payout ratio provides certainty with room for growth Closing expected Q4 2014 • Q4 2014 expected closing • Subject to HCT stockholder vote • Subject to SEC review and other customary closing conditions 1) $11.70 price is prior to giving effect to the OP units to be issued to the Advisor, consistent with promote in the Prospectus; $11.33 is the net price payable to common stockholders 2) Exchange ratio results in net HCT share price of $11.33

A COMPELLING TRANSACTION FOR HCT SHAREHOLDERS Investing in the Growth of Healthcare 6 Strong Valuation: Ventas to acquire HCT’s assets at significant premium • Significant premium to recent HCT stock price 1 ‒ 14% net premium to HCT’s closing price on May 30, 2014 ‒ 12% net premium to VWAP since listing on April 7, 2014 • Transaction prices HCT’s assets at approximately a 6.0% capitalization rate Ideal Strategic Buyer: Ventas represents the ideal strategic buyer • Strong, large, diversified real estate portfolio with nearly 1,500 properties • Industry leading management team has helped grow dividends at 9% CAGR since 2000 • Ventas has produced significant total shareholder returns over the past 10 years at a 13.5% CAGR • Investment grade balance sheet allows flexibility and low cost borrowing ‒ Low leverage profile, currently maintains 3 4% debt / enterprise value 2 1) $11.33 is the net price payable to common stockholders after giving effect to the OP units to be issued to the Advisor 2) Leverage as reported in Ventas Q1 ‘14 earnings release

TRANSACTION BENEFITS TO HCT STOCKHOLDERS Investing in the Growth of Healthcare 7 • The transaction exchange rate values HCT at $11.33 per share net to HCT stockholders 1 , eliminating the risk of HCT’s business model delivering similar value over time • Ventas’ experienced management team has a superlative track record of producing strong stockholder returns and increasing dividends • Significant capacity to further drive dividend growth as Ventas has the healthcare industry’s low payout ratio of 67% • HCT and Ventas have complementary real estate asset types of equivalent quality; transaction should be well received in the market • Combined enterprise value will exceed $30 billion, making Ventas largest healthcare REIT and the 6 th largest U.S. REIT • Large healthcare REITs trade at higher multiples to smaller healthcare REITs generally • HCT stockholders will own approximately 8.3% of the combined company’s common stock 2 • Ventas stock is trading at a significant discount to its last 24 months highs , leaving upside potential for HCT’s shareholders receiving Ventas shares Acceleration of Value Recognition Exceptionally Strong Ventas Currency Complementary Real Estate Portfolios Size and Scale Matter Ownership Structure 1) $11.33 is the net price payable to common stockholders after giving effect to the OP units to be issued to the Advisor 2) Assumes full 10% cash election

$9.95 $11.33 $9.00 $9.50 $10.00 $10.50 $11.00 $11.50 HCT Closing Price at 5/30/14 Ventas Purchase Price COMBINATION CREATES IMMEDIATE FINANCIAL VALUE FOR HCT STOCKHOLDERS Investing in the Growth of Healthcare 8 14% Net Premium to C losing Price at May 30, 2014 1 12% Net Premium to VWAP Since Listing 1. Net premium based on HCT’s $9.95 closing price on 5/30/2014 1) $11.33 is the net price payable to common stockholders after giving effect to the OP units to be issued to the Advisor 2

Medical Office, 55% Senior Housing - NNN, 5% Senior Housing - RIDEA, 27% SNF/Post - Acute, 2% Hospital, 11% TRANSACTION BRINGS TOGETHER COMPLEMENTARY PORTFOLIOS Investing in the Growth of Healthcare 9 The combination of the two portfolios provides increased scale and stability for HCT shareholders, while positioning portfolio for improved diversification and growth • Ventas’s portfolio focuses on high quality senior housing assets, both triple net and RIDEA • HCT’s assets have a high concentration of desirable MOB properties HCT Portfolio Mix 1 (by NOI) Ventas Portfolio Mix 12 (by NOI) Medical Office, 16% Sr. Housing - NNN, 26% Sr. Housing - RIDEA, 28% SNF/Post - Acute, 19% Hospital, 7% Loan Investments & Other , 3% 1. As reported for 1Q ’14 2. Ventas’s hospitals are U.S. domiciled
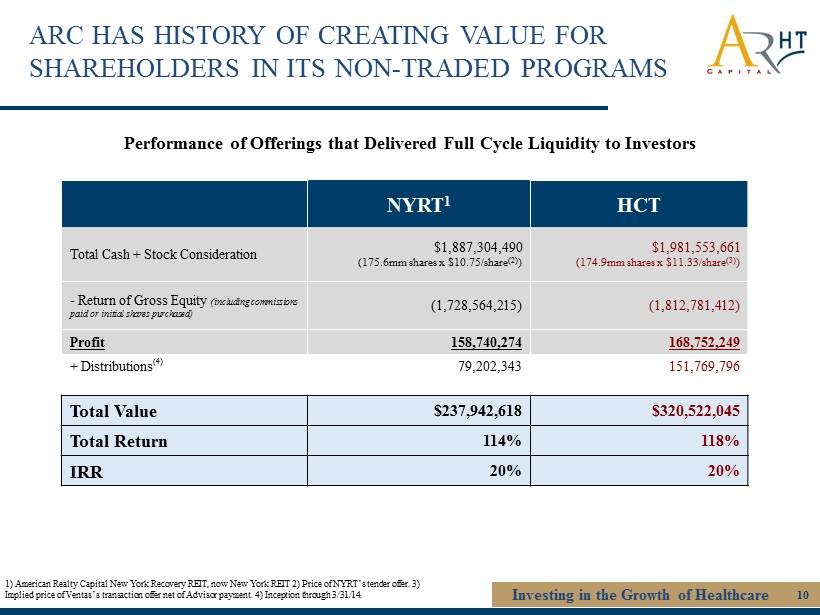
ARC HAS HISTORY OF CREATING VALUE FOR SHAREHOLDERS IN ITS NON - TRADED PROGRAMS Investing in the Growth of Healthcare 10 1) American Realty Capital New York Recovery REIT, now New York REIT 2) Price of NYRT’s tender offer. 3 ) Implied price of Ventas’s transaction offer net of Advisor payment. 4) Inception through 3/31/14. NYRT 1 HCT Total Cash + Stock Consideration $1,887,304,490 (175.6mm shares x $10.75/share (2) ) $1,981,553,661 (174.9mm shares x $11.33/share (3) ) - Return of Gross Equity (including commissions paid or initial shares purchased) (1,728,564,215) (1,812,781,412) Profit 158,740,274 168,752,249 + Distributions (4) 79,202,343 151,769,796 Total Value $237,942,618 $320,522,045 Total Return 114% 118% IRR 20% 20% Performance of Offerings that Delivered Full Cycle Liquidity to Investors

ARC HAS HISTORY OF CREATING VALUE FOR SHAREHOLDERS IN ITS NON - TRADED PROGRAMS Investing in the Growth of Healthcare 11 1 ) ARCT final stock price plus $0.35 special distribution paid to ARCT stockholders upon merger with Realty Income on 1/22/201 3. 2 ) Final stock conversion price paid to ARCT III stockholders upon merger with ARCP on 2/28/13. 3 ) HTA stock price as of market close 7/5/2013. 4) Implied nominal consideration based on ARCP stock price of $13.07. 5 ) Inception through 12/31/12. 6 ) Inception through 3/31/13. 7 ) Inception through 9/30/13. 8 ) Inception through 9/30/13. ARCT ARCT III ARCT IV Total Cash + Stock Consideration $2,377,591,197 (178.0mm shares x $13.36/share (1) ) $2,336,816,560 (176.9mm shares x $13.21/share (2) ) $2,171,022,798 (71.5mm shares x $30.53/share (4) ) - Return of Gross Equity (including commissions paid or initial shares purchased) (1,745,821,081) (1,736,021,996) (1,763,018,472) Profit 631,770,116 600,794,564 408,004,326 + Distributions 228,650,283 (5) 86,092,000 (6) 167,385,763 ( 8 ) Total Value $860,420,399 $686,886,564 $575,390,089 Total Return 149% 140% 133% IRR 13% 27% 25% Full Cycle Performance for Offerings that Delivered Full Cycle Liquidity to Investors
VENTAS, INC. COMPANY PROFILE
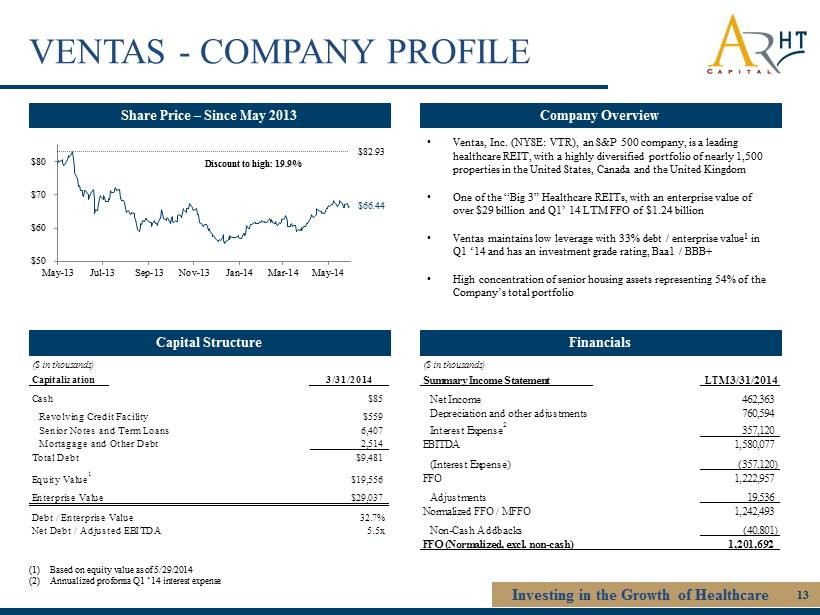
VENTAS - COMPANY PROFILE Investing in the Growth of Healthcare 13 (1) Based on equity value as of 5/29/2014 (2) Annualized pro forma Q1 ‘14 interest expense Share Price – Since May 2013 Capital Structure Company Overview Financials • Ventas, Inc. (NYSE: VTR), an S&P 500 company, is a leading healthcare REIT, with a highly diversified portfolio of nearly 1,500 properties in the United States, Canada and the United Kingdom • One of the “Big 3” Healthcare REITs, with an enterprise value of over $29 billion and Q1’ 14 LTM FFO of $1.24 billion • Ventas maintains low leverage with 33% debt / enterprise value 1 in Q1 ‘14 and has an investment grade rating, Baa1 / BBB+ • High concentration of senior housing assets representing 54% of the Company’s total portfolio ($ in thousands) Summary Income Statement LTM 3/31/2014 Net Income 462,363 Depreciation and other adjustments 760,594 Interest Expense 2 357,120 EBITDA 1,580,077 (Interest Expense) (357,120) FFO 1,222,957 Adjustments 19,536 Normalized FFO / MFFO 1,242,493 Non-Cash Addbacks (40,801) FFO (Normalized, excl. non-cash) 1,201,692 $50 $60 $70 $80 May-13 Jul-13 Sep-13 Nov-13 Jan-14 Mar-14 May-14 $66.44 Discount to high : 19.9% $82.93 ($ in thousands) Capitalization 3/31/2014 Cash $85 Revolving Credit Facility $559 Senior Notes and Term Loans 6,407 Mortagage and Other Debt 2,514 Total Debt $9,481 Equity Value 1 $19,556 Enterprise Value $29,037 Debt / Enterprise Value 32.7% Net Debt / Adjusted EBITDA 5.5x

VENTAS HAS CONSISTENTLY OUTPERFORMED THE MARKET OVER THE PAST DECADE Investing in the Growth of Healthcare 14 Source: Ventas Investor Presentation, May 2014 1. Bloomberg for the 10 - year period ended 03/31/2014.
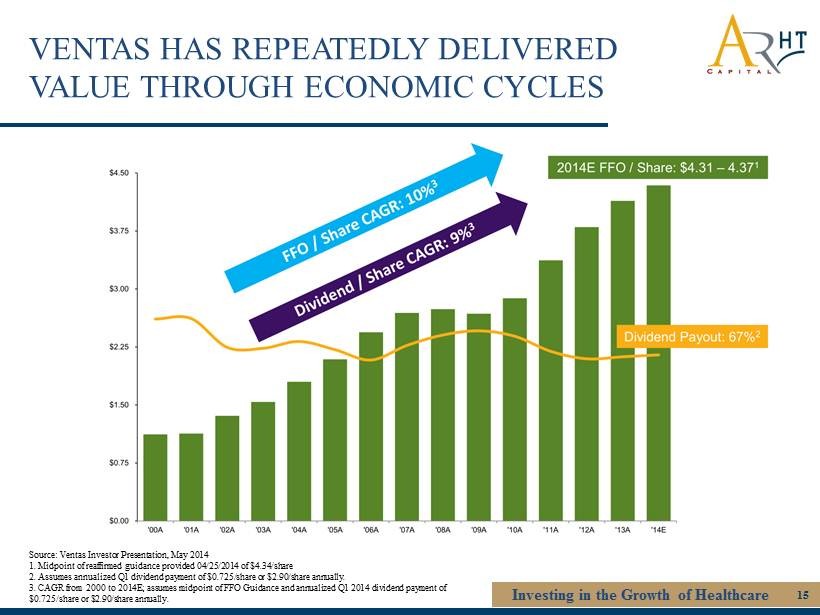
VENTAS HAS REPEATEDLY DELIVERED VALUE THROUGH ECONOMIC CYCLES Investing in the Growth of Healthcare 15 Source: Ventas Investor Presentation, May 2014 1. Midpoint of reaffirmed guidance provided 04/25/2014 of $4.34/share 2. Assumes annualized Q1 dividend payment of $0.725/share or $2.90/share annually. 3. CAGR from 2000 to 2014E; assumes midpoint of FFO Guidance and annualized Q1 2014 dividend payment of $0.725/share or $2.90/share annually .

VENTAS HAS GROWN ITS DIVIDEND SINCE 2010 Investing in the Growth of Healthcare 16 • Ventas has a successful track record of growing its dividend • Ventas enjoys the healthcare industry’s lowest payout ratio of 67% • Ventas has shown capacity and willingness to further drive dividend growth Dividend Payout Ratio 74% 68% 65% 66% 67% $2.14 $2.30 $2.48 $2.74 $2.90 $0.00 $0.50 $1.00 $1.50 $2.00 $2.50 $3.00 $3.50 2010 2011 2012 2013 2014E ($ / share) 1 Source: Ventas Investor Presentation, May 2014; dividend payout ratio is based on Normalized FFO as presented by Ventas 1) 2014E dividend assumes annualized Q1 ‘14 dividend of $0.725 / share
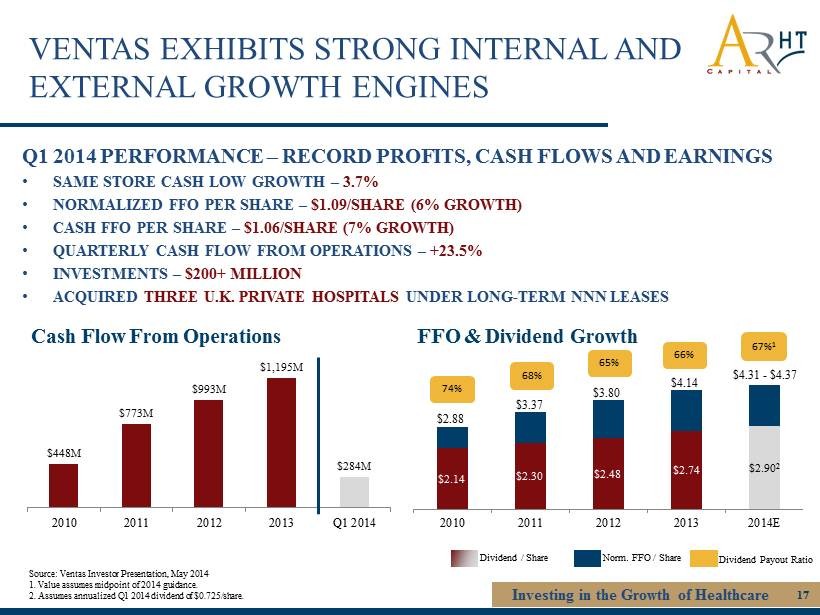
VENTAS EXHIBITS STRONG INTERNAL AND EXTERNAL GROWTH ENGINES Investing in the Growth of Healthcare 17 Q1 2014 PERFORMANCE – RECORD PROFITS, CASH FLOWS AND EARNINGS • SAME STORE CASH LOW GROWTH – 3.7% • NORMALIZED FFO PER SHARE – $1.09/SHARE (6% GROWTH) • CASH FFO PER SHARE – $1.06/SHARE (7% GROWTH) • QUARTERLY CASH FLOW FROM OPERATIONS – + 23.5% • INVESTMENTS – $ 200+ MILLION • ACQUIRED THREE U.K. PRIVATE HOSPITALS UNDER LONG - TERM NNN LEASES Source: Ventas Investor Presentation, May 2014 1. Value assumes midpoint of 2014 guidance. 2. Assumes annualized Q1 2014 dividend of $0.725/share. $448M $773M $993M $1,195M $284M 2010 2011 2012 2013 Q1 2014 Cash Flow From Operations $2.14 $2.30 $2.48 $2.74 $2.90 2 $2.88 $3.37 $3.80 $4.14 $4.31 - $4.37 2010 2011 2012 2013 2014E FFO & Dividend Growth 74% 68% 65% 66% 67% 1 Dividend / Share Norm. FFO / Share Dividend Payout Ratio

VENTAS – CORE STRENGTHS Investing in the Growth of Healthcare 18 Source: Ventas Investor Presentation, May 2014 1. Includes $20 million pre - paid rent on renewed 2015 Kindred assets. Raising Capital $5.5 Bn Raised January 2013 – April 2014 Accretive Investments Over $2Bn Invested January 2013 – April 2014 Managing Assets +3.7% Q1 2014 YoY Cash Same - Store NOI 1 Consistent Superior Long Term Total Shareholder Returns
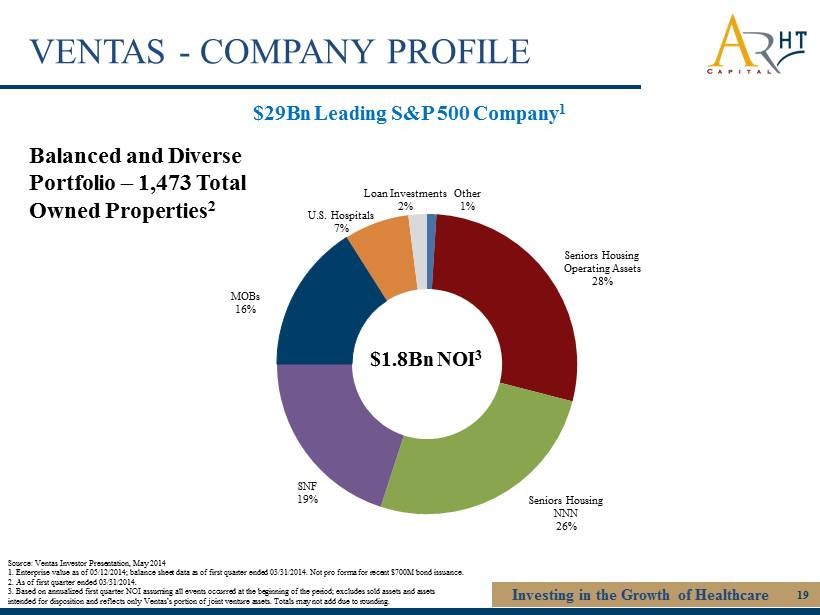
Investing in the Growth of Healthcare 19 Source : Ventas Investor Presentation, May 2014 1. Enterprise value as of 05/12/2014; balance sheet data as of first quarter ended 03/31/2014. Not pro forma for recent $700M bo nd issuance. 2. As of first quarter ended 03/31/2014. 3. Based on annualized first quarter NOI assuming all events occurred at the beginning of the period; excludes sold assets an d a ssets intended for disposition and reflects only Ventas’s portion of joint venture assets. Totals may not add due to rounding. Other 1% Seniors Housing Operating Assets 28% Seniors Housing NNN 26% SNF 19% MOBs 16% U.S. Hospitals 7% Loan Investments 2% $1.8Bn NOI 3 Balanced and Diverse Portfolio – 1,473 Total Owned Properties 2 $29Bn Leading S&P 500 Company 1 VENTAS - COMPANY PROFILE

VENTAS – PORTFOLIO DIVERSIFICATION Investing in the Growth of Healthcare 20 Atria Senior Living 17% MOB 16% Kindred Healthcare 12% Sunrise Senior Living 11% Brookdale Senior Living 9% Elmcroft Senior Living 4% Holiday Retirement 3% Avamere Senior Living 2% Emeritus Senior Living 1% All Other 24% Operating Model by NOI 1,3 Asset Class by NOI 1,2 Tenant / Operator by NOI 1 Source : Ventas Investor Presentation, May 2014 1. Based on annualized first quarter NOI assuming all events occurred at the beginning of the period; excludes sold assets an d a ssets intended for disposition and reflects only Ventas’s portion of joint venture assets. Totals may not add due to rounding. Not pro forma for Brookdale acquisition of Emeritus (02/20/2014). 2. “Other” includes U.K. private hospitals NOI. 3. “Other” includes loan investments and U.K private hospitals NOI Loan Investments 2% Other 1% Senior Housing Operating Assets 28% Seniors Housing NNN 26% SNF 19% MOBs 16% U.S. Hospitals 7% NNN/ Other 56% Seniors Housing Operating Assets 28% MOBs 16%

VENTAS – PRIVATE PAY FOCUS AND GEOGRAPHIC DIVERSIFICATION Investing in the Growth of Healthcare 21 Private Pay 84 % SNFs and U.S. Hospitals 16 % Pay Source by Revenue 1 Other 41 States, D.C., Canada and U.K. 60% CA 14% NY 8 % TX 8% IL 5% FL 5% Geography by Revenue 1 Source: Ventas Investor Presentation, May 2014 1. Based on annualized first quarter revenue assuming all events occurred at the beginning of the period; excludes sold asset s a nd assets intended for disposition and reflects only Ventas’s portion of joint venture assets. Totals may not add due to roundin g.

APPENDIX
VENTAS – LEADING TENANTS AND OPERATORS Investing in the Growth of Healthcare 23

VENTAS’ LONG - TERM GOALS Investing in the Growth of Healthcare 24 • Superior Total Returns: Deliver consistent , superior total returns – 3,430% since 12/31/1999 1 • Financial Strength and Liquidity: Maintain financial strength and excellent liquidity • Cash Flow and NOI Growth: Moderate cash flow and NOI g rowth through accretive transactions and lower interest rates • Growth Through Development: Growth from development and redevelopment with over $200 million under construction and approximately $200 million in near - term development pipeline • Do Not Take Excessive Risk: Maintain a conservative business strategy that does not take excessive risk in the pursuit of objectives • Financial Position: Maintain a conservative financial position for stockholders – below 35 % debt / enterprise value in 1Q 2014 • Cover Dividend: Solid dividend coverage – 67% 2014E payout ratio 1) Returns for the period ending 3/31/2014

VENTAS – MANAGEMENT & BOARD MEMBERS Investing in the Growth of Healthcare 25 Debra A. Cafaro Chairman of the Board and Chief Executive Officer Raymond J. Lewis President Todd W. Lillibridge Executive Vice President, Medical Property Operations T. Richard Riney Executive Vice President, Chief Administrative Officer and General Counsel Richard A. Schweinhart Executive Vice President and Chief Financial Officer John D. Cobb Executive Vice President, Chief Investment Officer Douglas Crocker II Presiding Director of the Board Ronald G. Geary Board Member Jay M. Gellert Board Member Richard I. Gilchrist Board Member Matthew J. Lustig Board Member Douglas M. Pasquale Board Member Robert D. Reed Board Member Glenn J. Rufrano Board Member James D. Shelton Board Member

ADDITIONAL DISCLOSURE
Investing in the Growth of Healthcare 27 FORWARD - LOOKING STATEMENTS Statements regarding the following subjects may be impacted by a number of risks and uncertainties which may cause our actual results, p erf ormance or achievements to be materially different from any future results, performances or achievements expressed or implied by the forward - looking statements: • all of our executive officers are also officers, managers and/or holders of a direct or indirect interest in our Advisor and othe r A merican Realty Capital - affiliated entities; as a result, our executive officers, our Advisor and its affiliates face conflicts of interest, including significant conflicts cr eat ed by our Advisor’s compensation arrangements with us and other investor entities advised by American Realty Capital affiliates, and conflicts in allocating time among these entit ies and us, which could negatively impact our operating results; • because investment opportunities that are suitable for us may also be suitable for other American Realty Capital - advised programs or inv estors, our Advisor and its affiliates face conflicts of interest relating to the purchase of properties and other investments and such conflicts may not be resolved in our favor, meaning that we could invest in less attractive assets, which could reduce the investment return to our stockholders; • we depend on tenants for our revenue, and, accordingly, our revenue is dependent upon the success and economic viability of our ten ants; • we may not be able to achieve our rental rate incentives and our expenses could be greater, which may impact our results of oper ati ons; • increases in interest rates could increase the amount of our debt payments and limit our ability to pay distributions ; • we may not generate cash flows sufficient to pay our distributions to stockholders, as such, we may be forced to borrow at highe r r ates or depend on our Advisor or our property manager, American Realty Capital Healthcare Properties, LLC, to waive reimbursement of certain expenses and fees to fund our ope rations; • we may be unable to pay or maintain cash distributions or increase distributions over time ;

Investing in the Growth of Healthcare 28 FORWARD - LOOKING STATEMENTS • we are obligated to pay fees, which may be substantial, to our Advisor and its affiliates, including fees payable upon the sale of properties; • we are subject to risks associated with the significant dislocations and liquidity disruptions that recently existed or occurred in the credit markets of the United States; • we may fail to continue to qualify to be treated as a real estate investment trust for U.S. federal income tax purposes (“REIT”) ; • we focus on acquiring healthcare - related assets located in the United States, which are subject to risk inherent in concentrating i nvestments in the healthcare industry; • the availability of qualified personnel; • the healthcare industry is heavily regulated, and new laws or regulations, changes to existing laws or regulations, loss of licen sur e or failure to obtain licensure could result in the inability of tenants to make lease payments to us; and • changes in general economic, business and political conditions, including the possibility of intensified international hostilities, a cts of terrorism, and changes in conditions of United States or international lending, capital and financing markets. The forward - looking statements contained in this presentation reflect our beliefs, assumptions and expectations of our future performance, taking into account all information currently available to us. These beliefs, assumptions and expectations are subject to risks and uncertainties and can change as a resul t o f many possible events or factors, not all of which are known to us. If a change occurs, our business, financial condition, liquidity and results of operations may vary materially f rom those expressed in our forward - looking statements. You should carefully consider these risks before you make an investment decision with respect to our securities. For more information regarding risks that may cause our actual results to differ materially from any forward - looking statements, see “Risk Factors.” We disclaim any obligation to publicly update or revise any forward - looking statements to reflect changes in underlying assumptions or factors, new informatio n, future events or other changes, except as required by law.