Attached files
| file | filename |
|---|---|
| EX-23.1 - EX-23.1 - Catalent, Inc. | d655309dex231.htm |
| EX-21.1 - EX-21.1 - Catalent, Inc. | d655309dex211.htm |
| EX-10.50 - EX-10.50 - Catalent, Inc. | d655309dex1050.htm |
Table of Contents
As filed with the Securities and Exchange Commission on May 30, 2014.
Registration No. 333-193542
UNITED STATES
SECURITIES AND EXCHANGE COMMISSION
Washington, D.C. 20549
Amendment No. 4
to
FORM S-1
REGISTRATION STATEMENT
UNDER
THE SECURITIES ACT OF 1933
Catalent, Inc.
(Exact Name of Registrant as Specified in its Charter)
| Delaware | 2834 | 20-8737688 | ||
| (State or other jurisdiction of incorporation or organization) |
(Primary Standard Industrial Classification Code Number) |
(I.R.S. Employer Identification No.) |
14 Schoolhouse Road
Somerset, New Jersey 08873
(732) 537-6200
(Address, including zip code, and telephone number, including area code, of Registrant’s principal executive offices)
Samrat S. Khichi, Esq.
Senior Vice President, Chief Administrative Officer, General Counsel and Secretary
Catalent, Inc.
14 Schoolhouse Road
Somerset, New Jersey 08873
(732) 537-6200
(Name, address, including zip code, and telephone number, including area code, of agent for service)
Copies to:
| Edward P. Tolley III, Esq. Simpson Thacher & Bartlett LLP 425 Lexington Avenue New York, NY 10017 Telephone: (212) 455-2000 Facsimile: (212) 455-2502 |
Michael Benjamin, Esq. Shearman & Sterling LLP 599 Lexington Avenue New York, NY 10022-6069 Telephone: (212) 848-4000 Facsimile: (212) 848-7179 |
Approximate date of commencement of the proposed sale of the securities to the public: As soon as practicable after the Registration Statement is declared effective.
If any of the securities being registered on this form are to be offered on a delayed or continuous basis pursuant to Rule 415 under the Securities Act of 1933, check the following box. ¨
If this form is filed to register additional securities for an offering pursuant to Rule 462(b) under the Securities Act, check the following box and list the Securities Act registration statement number of the earlier effective registration statement for the same offering. ¨
If this form is a post-effective amendment filed pursuant to Rule 462(c) under the Securities Act, check the following box and list the Securities Act registration statement number of the earlier effective registration statement for the same offering. ¨
If this form is a post-effective amendment filed pursuant to Rule 462(d) under the Securities Act, check the following box and list the Securities Act registration statement number of the earlier effective registration statement for the same offering. ¨
| Large accelerated filer | ¨ | Accelerated filer | ¨ | |||
| Non-accelerated filer | x (Do not check if a smaller reporting company) | Smaller reporting company | ¨ | |||
CALCULATION OF REGISTRATION FEE
|
| ||||
| Title Of Each Class Of Securities To Be Registered |
Proposed Maximum Aggregate Offering Price(1)(2) |
Amount of Registration Fee(3) | ||
| Common Stock, par value $0.01 per share |
$100,000,000 | $12,880 | ||
|
| ||||
|
| ||||
| (1) | Estimated solely for the purpose of determining the amount of the registration fee in accordance with Rule 457(o) under the Securities Act of 1933. |
| (2) | Includes shares of common stock subject to the underwriters’ option to purchase additional shares of common stock. |
| (3) | Previously paid. |
The Registrant hereby amends this Registration Statement on such date or dates as may be necessary to delay its effective date until the Registrant shall file a further amendment which specifically states that this Registration Statement shall thereafter become effective in accordance with Section 8(a) of the Securities Act of 1933 or until the Registration Statement shall become effective on such date as the Commission, acting pursuant to said Section 8(a), may determine.
Table of Contents
The information in this prospectus is not complete and may be changed. We may not sell these securities until the registration statement filed with the Securities and Exchange Commission is effective. This prospectus is not an offer to sell these securities and it is not soliciting an offer to buy these securities in any jurisdiction where the offer or sale is not permitted.
Subject to Completion. Dated May 30, 2014.
Shares

Catalent, Inc.
Common Stock
This is an initial public offering of shares of common stock of Catalent, Inc. All of the shares of common stock are being sold by the company.
Prior to this offering, there has been no public market for the common stock. It is currently estimated that the initial public offering price per share will be between $ and $ . We have applied to list our shares of common stock on the New York Stock Exchange under the symbol “CTLT”.
After the completion of this offering, affiliates of The Blackstone Group L.P. will continue to own a majority of the voting power of shares eligible to vote in the election of our directors. As a result, we will be a “controlled company” within the meaning of the corporate governance standards of the New York Stock Exchange. See “Management—Controlled Company Exception.”
See “Risk Factors” beginning on page 17 to read about factors you should consider before buying shares of our common stock.
Neither the Securities and Exchange Commission nor any other regulatory body has approved or disapproved of these securities or passed upon the accuracy or adequacy of this prospectus. Any representation to the contrary is a criminal offense.
| Per Share |
Total |
|||||||
| Initial public offering price |
$ | $ | ||||||
| Underwriting discounts and commissions(1) |
$ | $ | ||||||
| Proceeds, before expenses, to us(2) . |
$ | $ | ||||||
| (1) | The underwriters will receive compensation in addition to the underwriting discount. See “Underwriting (Conflict of Interest).” |
| (2) | See “Underwriting (Conflict of Interest).” |
To the extent that the underwriters sell more than shares of our common stock, the underwriters have the option to purchase up to an additional shares of our common stock from us at the initial public offering price less the underwriting discount.
The underwriters expect to deliver the shares against payment in New York, New York on or about , 2014.
| MORGAN STANLEY | J.P. MORGAN | |||||
| BofA MERRILL LYNCH | GOLDMAN, SACHS & CO. | JEFFERIES | DEUTSCHE BANK SECURITIES | |||
| BLACKSTONE CAPITAL MARKETS | PIPER JAFFRAY |
RAYMOND JAMES | ||
| WELLS FARGO SECURITIES |
WILLIAM BLAIR | EVERCORE | ||
Prospectus dated , 2014.
Table of Contents

Table of Contents
Neither we nor the underwriters have authorized anyone to provide you with information different from that contained in this prospectus, any amendment or supplement to this prospectus or any free writing prospectus prepared by us or on our behalf. Neither we nor the underwriters take any responsibility for, or can provide any assurance as to the reliability of, any information other than the information in this prospectus, any amendment or supplement to this prospectus or any free writing prospectus prepared by us or on our behalf. We and the underwriters are offering to sell, and seeking offers to buy, shares of our common stock only in jurisdictions where offers and sales are permitted. The information in this prospectus is accurate only as of the date of this prospectus, regardless of the time of delivery of this prospectus or any sale of shares of our common stock.
Unless indicated otherwise, the information included in this prospectus (1) assumes no exercise by the underwriters of the option to purchase up to an additional shares of common stock from us, (2) assumes that the shares of common stock to be sold in this offering are sold at $ per share of common stock, which is the midpoint of the price range indicated on the front cover of this prospectus and (3) assumes the -for- stock split of our common stock, which will be effected prior to the completion of this offering and accounts for the adjustment of the exercise price of all outstanding stock options and the number of shares subject to all outstanding stock options and restricted stock units.
Except where the context requires otherwise, references in this prospectus to “Catalent,” “the Company,” “we,” “us,” and “our” refer to Catalent, Inc., together with its consolidated subsidiaries. In this prospectus, when we refer to our fiscal years, we say “fiscal” and the year number, as in “fiscal 2013,” which refers to our fiscal year ended June 30, 2013.
Investment funds associated with or designated by The Blackstone Group L.P., our current majority owners, are referred to herein as “Blackstone” or “Sponsor” and Blackstone, together with the other owners of Catalent, Inc. prior to this offering, are collectively referred to as our “existing owners.”
i
Table of Contents
This summary highlights information contained elsewhere in this prospectus and does not contain all of the information you should consider before investing in shares of our common stock. You should read this entire prospectus carefully, including the section entitled “Risk Factors” and the financial statements and the related notes included elsewhere in this prospectus, before you decide to invest in shares of our common stock.
OUR COMPANY
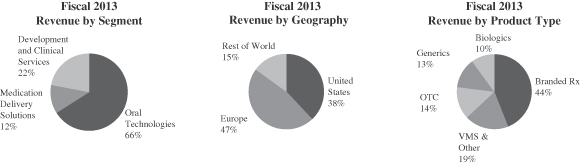
We are the leading global provider of advanced delivery technologies and development solutions for drugs, biologics and consumer health products. Our oral, injectable, and respiratory delivery technologies address the full diversity of the pharmaceutical industry including small molecules, large molecule biologics and consumer health products. Through our extensive capabilities and deep expertise in product development, we help our customers take products to market faster, including nearly half of new drug products approved by the U.S. Food and Drug Administration (“FDA”) in the last decade. Our advanced delivery technology platforms, broad and deep intellectual property, and proven formulation, manufacturing and regulatory expertise enable our customers to develop more products and better treatments. Across both development and delivery, our commitment to reliably supply our customers’ needs is the foundation for the value we provide; annually, we produce more than 70 billion doses for nearly 7,000 customer products. We believe that through our investments in growth-enabling capacity and capabilities, our ongoing focus on operational and quality excellence, the sales of existing customer products, the introduction of new customer products, our patents and innovation activities, and our entry into new markets, we will continue to benefit from attractive and differentiated margins, and realize the growth potential from these areas.
Since 2010, we have made investments to expand our sales and marketing activities, leading to growth in the number of active development programs in both strategic platforms for our customers. This has further enhanced our extensive, long-duration relationships and long-term contracts with a broad and diverse range of industry-leading customers. In the fiscal year ended June 30, 2013, we did business with 85 of the top 100 branded drug marketers, 20 of the top 25 generics marketers, 41 of the top 50 biologics marketers, and 19 of the top 20 consumer health marketers globally. Selected key customers include Pfizer, Johnson & Johnson, GlaxoSmithKline, Merck, Novartis, Roche, Actavis and Teva. We have many long-standing relationships with our customers, particularly in advanced delivery technologies, where we tend to follow a prescription molecule through all phases of its lifecycle, from the original brand prescription development and launch to generics or over-the-counter switch. A prescription pharmaceutical product relationship with an innovator will often last for nearly two decades, extending from mid-clinical development through the end of the product’s life cycle. We serve customers who require innovative product development, superior quality, advanced manufacturing and skilled technical services to support their development and marketed product needs. Our broad and diverse range of technologies closely integrates with our customers’ molecules to yield final dose forms, and this generally results in the inclusion of Catalent in our customers’ prescription product regulatory filings. Both of these factors translate to long-duration supply relationships at an individual product level.
We believe our customers value us because our depth of development solutions and advanced delivery technologies, intellectual property, consistent and reliable supply, geographic reach, and substantial expertise enable us to create a broad range of business and product solutions that can be customized to fit their individual needs. Today we employ more than 1,000 scientists and technicians and hold approximately 1,300 patents and patent applications in advanced delivery, drug and biologics formulation and manufacturing. The aim of our offerings is to allow our customers to bring more products to market faster, and develop and market differentiated new products that improve patient outcomes. We believe our leading market position, significant global scale, and diversity of customers, offerings, regulatory categories, products, and geographies reduce our exposure to potential strategic and product shifts within the industry.
1
Table of Contents
We provide a number of proprietary, differentiated technologies, products and service offerings to our customers across our advanced delivery technologies and development solutions platforms. The core technologies within our advanced delivery technologies platform include softgel capsules, our Zydis oral dissolving tablets, blow-fill-seal unit dose liquids and a range of other oral, injectable and respiratory technologies. The technologies and service offerings within our development solutions platform span the drug development process, ranging from the Optiform, GPEx and SMARTag platforms for development of small molecules, biologics and antibody-drug conjugates, or ADCs, respectively, to formulation, analytical services, early stage clinical development, clinical trials supply and regulatory consulting. Our offerings serve a critical need in the development and manufacturing of difficult to formulate products across a number of product types.
For the fiscal year ended June 30, 2013, our revenues were $1,800 million and Adjusted EBITDA was $413 million. From the fiscal year ended June 30, 2009 to the fiscal year ended June 30, 2013, our revenues and Adjusted EBITDA grew at compound annual growth rates, or CAGRs, of 6.5% and 10.8%, respectively. For a reconciliation of Adjusted EBITDA to net income, see “—Summary Financial Data.”
HISTORY
Catalent was formed in April 2007, when we were acquired by affiliates of The Blackstone Group L.P. (“Blackstone”). Prior to that, we formed the core of the Pharmaceutical Technologies and Services (“PTS”) segment of Cardinal Health, Inc. (“Cardinal”). PTS was in turn created by Cardinal through a series of acquisitions beginning with R.P. Scherer Corporation in 1998, with the intent of creating the world’s leading outsourcing provider of specialized, market-leading solutions to the global pharmaceutical and biotechnology industry. Subsequent to our 2007 acquisition, we have regularly reviewed our portfolio of offerings and operations in the context of our strategic growth plan. As a result of those ongoing assessments, since 2007 we have sold five businesses and consolidated operations at four facilities, integrating them into the remaining facility network. We have also remained active through acquisitions completing five transactions since fiscal 2009.
INDUSTRY
We participate in nearly every sector of the $800 billion annual revenue global pharmaceutical industry, including but not limited to the prescription drug and biologic sectors as well as consumer health, which includes the over-the-counter and vitamins and nutritional supplement sectors. Global demand for both pharmaceutical and consumer healthcare products continues to increase, driven by: expanded access to care arising from reforms in two key large markets, China and the United States; increased life expectancy in aging and increasingly obese populations in both developed markets and emerging markets; and a rising number of affluent consumers in emerging markets.
2
Table of Contents
While benefiting from this strong demand, innovator companies have been facing many challenges, including significant patent expirations and challenges, pricing pressures, increasingly complex discovery and development activities, and higher regulatory expectations. In response, many larger pharmaceutical companies have been restructuring their in-house approaches to research and development, manufacturing and sales and marketing, including realigning therapeutic class focus, scaling back on idle capacity resulting from generic conversions, and accessing specialized capabilities and capacity through outsourcing arrangements. The total share of industry spend that is outsourced is estimated around 30% today, with the share of large company spend that is outsourced growing, and medium-to-smaller companies already outsourcing a significant portion of their activities due to their limited resources and more virtual business models.
Advanced Delivery Technologies Market. More than half of today’s prescription revenues come from dose forms that require more than simple, immediate release tablets and oral solutions—drugs and biologics frequently require specialized manufacturing and/or molecular profile modification to achieve expected clinical results. An increasing share of molecules will require advanced delivery technologies, with estimates ranging from 60% to 90% of all new molecules entering development. Consumer health products also benefit from advanced delivery technologies, to enable innovative new products, or to create new formats for existing products and extend a brand franchise. We believe, based on external industry analysts, that the size of the advanced delivery technologies market will grow approximately 6-10% annually driven by these factors.
Development Solutions Market. The global pharmaceutical industry invests approximately $160 billion annually in R&D, of which an estimated 40% is outsourced (approximately 25% in large companies, with more than 50% in mid-sized and specialty companies). Approximately 50% of R&D spend is for compounds in Phase II and later stages of development; separately approximately half of R&D spend is on the combination of clinical research and chemistry, manufacturing and controls (“CMC”) work. These areas are the most common areas of outsourcing, with large global and regional clinical research organizations participating in clinical research spend (approximately 36% of R&D spend), and providers of development sciences, clinical trial supplies and logistics such as Catalent, participating in the CMC spend (approximately 14% of R&D spend). Global development and clinical activities are increasingly complex, with evolving global standards, and more complex multi-arm trials in multiple patient populations across both developed and emerging markets.
OUR COMPETITIVE STRENGTHS
Leading Provider of Advanced Delivery Technologies and Development Solutions
We are the leading global provider of advanced delivery technologies and development solutions for drugs, biologics and consumer health products. In the last decade, we have earned revenue with respect to nearly half of the new chemical entity (“NCE”) products approved by the FDA, and over the past three years with respect to 80% of the top 200 largest-selling compounds globally. With over 1,000 scientists and technicians worldwide and approximately 1,300 patents and patent applications, our expertise is in providing differentiated technologies and solutions which help our customers bring more products and better treatments to market faster. For example in the high value area of NCEs, approximately 90% of NCE softgel approvals by the FDA over the last 25 years have been developed and supplied by us.
Diversified Operating Platform
We are diversified by virtue of our geographic scope, our large customer base, the extensive range of products we produce, our broad service offerings, and our ability to provide solutions at nearly every stage of product lifecycles. We produce nearly 7,000 distinct items across multiple categories, including brand and generic prescription drugs and biologics, over-the-counter, consumer health and veterinary products, medical devices and diagnostics. In fiscal 2013, our top 20 products represented approximately 25% of total revenue, with no single customer accounting for greater than 10% of revenue and with no individual product greater than 3%. We serve approximately 1,000 customers in approximately 80 countries, with a majority of our fiscal 2013
3
Table of Contents
revenues coming from outside the United States. This diversity, combined with long product lifecycles and close customer relationships, has contributed to the stability of our business. It has also allowed us to reduce our exposure to potential strategic, customer and product shifts as well as to payor-driven pricing pressures experienced by our branded drug and biologic customers.
Longstanding, Extensive Relationships with Blue Chip Customers
We have longstanding, extensive relationships with leading pharmaceutical and biotechnology customers. In fiscal 2013, we did business with 85 of the top 100 branded drug marketers, 20 of the top 25 generics marketers, 41 of the top 50 biologics marketers, and 19 of the top 20 consumer health marketers globally, as well as with nearly a thousand other customers, including emerging and specialty companies, which are often more reliant on outside partners as a result of their more virtual business models. Regardless of size, our customers seek innovative product development, superior quality, advanced manufacturing and skilled technical services to support their development and marketed product needs.
Deep, Broad and Growing Technology Foundation
Our breadth of proprietary and patented technologies and long track record of innovation substantially differentiate us from other industry participants. Within our oral technologies business, our leading softgel platforms, including Liqui-Gels, Vegicaps and OptiShell capsules, and our modified release technologies including the Zydis family, OSDrC OptiDose and OptiMelt technologies, provide formulation expertise to solve complex delivery challenges for our customers. We offer advanced technologies for delivery of small molecules and biologics via respiratory, ophthalmic and injectable routes, including the blow-fill-seal unit dose technology and prefilled syringes. We also provide advanced biologics formulation options, including Gene Product Expression (“GPEx”) cell-line and SMARTag antibody-drug conjugate technologies. We have a market leadership position within respiratory delivery, including metered dose/dry powder inhalers and nasal. We have reinforced our leadership position in advanced delivery technologies over the last three years, as we have launched nearly a dozen new technology platforms and applications.
Long-Duration Relationships Provide Sustainability
Our broad and diverse range of technologies closely integrates with our customers’ molecules to yield final dose forms, and this generally results in the inclusion of Catalent in our customers’ prescription product regulatory filings. Both of these factors translate to long-duration supply relationships at an individual product level, to which we apply our expertise in contracting to produce long-duration commercial supply agreements. These agreements typically have initial terms of three to ten years with regular renewals of one to three years (see “Business—Contractual Arrangements” for more detail). Nearly 70% of our fiscal 2013 advanced delivery technology platform revenues (comprised of our oral technologies and medication delivery solutions reporting segments) were covered by such long-term contractual arrangements. We believe this base provides us with a sustainable competitive advantage.
Significant Recent Growth Investments
We have made significant past investments to establish a global manufacturing network, and today hold 4.6 million square feet of manufacturing and laboratory space across five continents. We have invested approximately $439.1 million in the last five fiscal years in capital expenditures. Growth-related investments in facilities, capacity and capabilities across our businesses have positioned us for future growth in areas aligned with anticipated future demand. Through our focus on operational, quality and regulatory excellence, we drive ongoing and continuous improvements in safety, productivity and reliable supply to customer expectations, which we believe further differentiate us. Our manufacturing network and capabilities allow us the flexibility to reliably supply the changing needs of our customers while consistently meeting their quality, delivery and regulatory compliance expectations.
4
Table of Contents
High Standards of Regulatory Compliance and Operational and Quality Excellence
We operate our plants in accordance with current good manufacturing practices (“cGMP”), following our own high standards which are consistent with those of many of our large global pharmaceutical and biotechnology customers. We have approximately 1,000 employees around the globe focused on quality and regulatory compliance. More than half of our facilities are registered with the FDA, with the remaining facilities registered with other applicable regulatory agencies, such as the European Medicines Agency (“EMA”). In some cases, facilities are registered with multiple regulatory agencies. In fiscal 2013, we underwent 38 regulatory audits and, over the last five fiscal years, we successfully completed more than 200 regulatory audits. We also undergo nearly 500 customer and internal audits annually. We believe our quality and regulatory track record to be a competitive differentiator for Catalent.
Strong and Experienced Management Team
Our executive leadership team has been transformed since 2009, with most of the team in place since fiscal 2010. Today, our management team has more than 200 years of combined and diverse experience within the pharmaceutical and healthcare industries. With an average of more than 20 years of functional experience, this team possesses deep knowledge and a wide network of industry relationships.
OUR STRATEGY
We are pursuing the following key growth initiatives:
“Follow the Molecule” by Providing Solutions to our Customers across all Phases of the Product Lifecycle
We intend to use our advanced delivery technologies and development solutions across the entire lifecycle of our customers’ products to drive future growth. Our development solutions span the drug development process, starting with our platforms for development of small molecules, biologics and antibody-drug conjugates, to formulation and analytical services, through early stage clinical development and manufacturing of clinical trials supply, to regulatory consulting. Once a molecule is ready for late-stage trials and subsequent commercialization, we provide our customers with a range of advanced delivery technologies and manufacturing expertise that allow them to deliver their molecules to the end-users in appropriate dosage forms. Our breadth of solutions gives us multiple entry points into the lifecycle of our customers’ molecules.
An example of this can be found in a leading over-the-counter respiratory brand, which today uses both our Zydis fast dissolve and our Liqui-Gels softgel technologies. We originally began development of the prescription format of this product for our partner multinational pharmaceutical company in 1992, to address specific patient sub-segment needs. After four years of development, we then commercially supplied the prescription Zydis product for six years, and continued to provide the Zydis form as it switched to OTC status in the United States in the early 2000s. More recently, we proactively brought a softgel product concept for the brand to the customer, which the customer elected to develop and launch as well. By following this molecule, we have built a strong, 22-year long relationship across multiple formats and markets.
Continue to Grow Through New Product Launches and Projects
We intend to grow by supplementing our existing diverse base of commercialized advanced delivery technology products with new development programs. As of June 30, 2013, our product development teams were working on approximately 450 new customer programs. Our base of active development programs has expanded in recent years from growing market demand, as well as from our investments since 2010 to expand our global sales and marketing function; once developed and approved in the future, we expect these programs to add to long-duration commercial revenues under long-term contracts and grow our existing product base. In fiscal 2013, we introduced 97 new products, an increase of more than 60% from the 59 new product introductions in fiscal 2012. In the nine months ended March 31, 2014, we introduced 123 new products, an increase of more than 112% from the 58 new product introductions in the nine months ended March 31, 2013. We also expect that our
5
Table of Contents
expanded offerings and capacity such as bioanalytical testing and metered dose inhaler production, our expanded presence in Brazil, and our market entry into China will further expand our active advanced delivery technologies development programs, and position us for future growth. Our development solutions business is driven by thousands of projects annually, ranging from individual short-duration analytical projects to multi-year clinical supply programs.
Accelerate Growth with Existing Customers through Increased Penetration and Broadening of Services
While we have a broad presence across the entire biopharmaceutical industry, we believe there are significant opportunities for additional revenue growth in our existing customer base, by providing advanced delivery solutions for new pipeline or commercial molecules, and by expanding the range and depth of development solutions used by those customers. Within our top 50 customers, nearly 75% utilize less than half of our individual offerings. In order to ensure we provide the most value to our customers, we have increased our field force by approximately 20% since fiscal 2009. We have continued to follow a targeted account strategy, designating certain accounts as global accounts, based on current materiality, partnering approach and growth potential. We have also begun to designate other accounts as growth accounts, based primarily on partnering approach and potential to become global accounts in the future. In both cases, we assign incremental business development and R&D resources to identify and pursue new opportunities to partner.
Enter into and Expand in Attractive Technologies and Geographies
We have made a number of internal investments in new geographies and markets, including the construction of a state-of-the-art biomanufacturing facility in Wisconsin to serve the growing global biologics development market, and the in-licensing of the SMARTag antibody-drug conjugate technology to address the growing need for improved targeted delivery of therapeutic compounds directly to tumor sites. In addition, we intend to proactively enter into emerging/high-growth geographies and other markets where we are currently only narrowly represented, including, but not limited to, China, Brazil, Japan and the animal health market. We have made recent investments in such high-growth areas, including the formation of a China-based clinical supplies joint venture with ShangPharma Corporation, the first provider in China of end-to-end clinical supply solutions, a softgel joint venture in China focused initially on the export of cost-advantaged consumer health products, as well as our recent acquisition of a Brazilian softgel provider.
Capitalize on our Substantial Technology Platform
We have a broad and diverse technology platform that is supported by more than 1,300 patents and patent applications in 106 families across advanced delivery technologies, drug and biologics formulation and manufacturing. This platform is supported by substantial know-how and trade secrets that provide us with additional competitive advantages.
In addition to resolving product challenges for our customers’ molecules, for more than two decades we have applied our technology platforms and development expertise to proactively develop proof of concept products, whether improved versions of existing drugs, new generic formulations or innovative consumer health products. These activities have provided us with opportunities to capture an increased share of end-market value through out-licensing, profit-sharing and other arrangements.
Leverage Existing Infrastructure and Operational Discipline to Drive Profitable Growth
Through our existing infrastructure, including our global network of operating locations and programs, we promote operational discipline and drive margin expansion. With our Lean Six Sigma programs, a global procurement function and conversion cost productivity metrics in place, we have created a culture of functional excellence and cost accountability. We intend to continue to apply this discipline to further leverage our operational network for profitable growth. Since fiscal 2009, we have expanded gross margin by over 400 basis points and Adjusted EBITDA margin by over 300 basis points.
6
Table of Contents
Pursue Strategic Acquisitions and Licensing to Build upon our Existing Platform
We operate in highly fragmented markets in both our advanced delivery technologies and development solutions businesses. Within those markets, the five top players represent only 30% and 10% of the total market share, respectively, by revenue. Our broad platform, global infrastructure and diversified customer base provide us with a strong foundation from which to consolidate within these markets and to generate operating leverage through such acquisitions.
We intend to continue to opportunistically source and execute bolt-on acquisitions within our existing business areas, as well as to undertake transactions that provide us with expansion opportunities within new geographic markets or adjacent market segments. We have a dedicated business development team in place to identify these opportunities and have a rigorous and financially disciplined process for evaluating, executing and integrating such acquisitions.
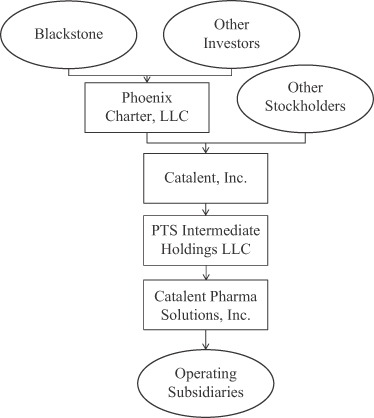
Catalent, Inc. (formerly known as PTS Holdings Corp.) is a holding company that owns PTS Intermediate Holdings LLC. PTS Intermediate Holdings LLC owns Catalent Pharma Solutions, Inc., which is a holding company that owns, directly or indirectly, all of our operating subsidiaries.
ORGANIZATIONAL STRUCTURE PRIOR TO THIS OFFERING
The diagram below depicts our summary organizational structure prior to this offering:
7
Table of Contents
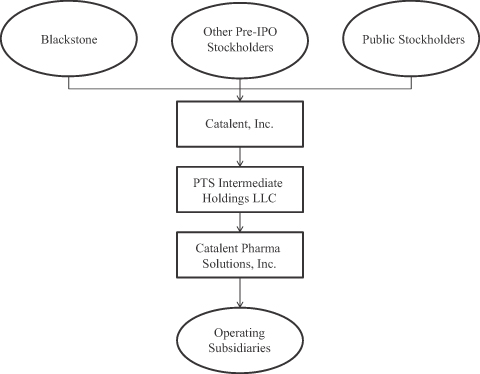
ORGANIZATIONAL STRUCTURE FOLLOWING THIS OFFERING
The diagram below depicts our summary organizational structure following this offering:
OUR SPONSOR
Blackstone (NYSE: BX) is one of the world’s leading investment and advisory firms. Blackstone’s alternative asset management businesses include the management of corporate private equity funds, real estate funds, hedge fund solutions, credit-oriented funds and closed-end mutual funds. Blackstone also provides various financial advisory services, including financial and strategic advisory, restructuring and reorganization advisory and fund placement services. Through its different businesses, Blackstone had total assets under management of approximately $272 billion as of March 31, 2014.
8
Table of Contents
INVESTMENT RISKS
An investment in shares of our common stock involves substantial risks and uncertainties that may adversely affect our business, financial condition and results of operations and cash flows. Some of the more significant challenges and risks relating to an investment in our company include the following:
| • | We participate in a highly competitive market and increased competition may adversely affect our business. |
| • | The demand for our offerings depends in part on our customers’ research and development and the clinical and market success of their products. Our business, financial condition and results of operations may be harmed if our customers spend less on or are less successful in these activities. |
| • | We are subject to product and other liability risks that could adversely affect our results of operations, financial condition, liquidity and cash flows. |
| • | Failure to comply with existing and future regulatory requirements could adversely affect our results of operations and financial condition. |
| • | Failure to provide quality offerings to our customers could have an adverse effect on our business and subject us to regulatory actions and costly litigation. |
| • | The services and offerings we provide are highly exacting and complex, and if we encounter problems providing the services or support required, our business could suffer. |
| • | Our global operations are subject to a number of economic, political and regulatory risks. |
| • | If we do not enhance our existing or introduce new technology or service offerings in a timely manner, our offerings may become obsolete over time, customers may not buy our offerings and our revenue and profitability may decline. |
| • | We and our customers depend on patents, copyrights, trademarks and other forms of intellectual property protections, however, these protections may not be adequate. |
| • | Our future results of operations are subject to fluctuations in the costs, availability, and suitability of the components of the products we manufacture, including active pharmaceutical ingredients, excipients, purchased components, and raw materials. |
| • | Changes in market access or healthcare reimbursement in the United States or internationally could adversely affect our results of operations and financial condition. |
| • | Fluctuations in the exchange rate of the U.S. dollar and other foreign currencies could have a material adverse effect on our financial performance and results of operations. |
| • | Tax legislation initiatives or challenges to our tax positions could adversely affect our results of operations and financial condition. |
| • | We are dependent on key personnel. |
| • | Risks generally associated with our information systems could adversely affect our results of operations. |
| • | We may in the future engage in acquisitions and other transactions that may complement or expand our business or divest of non-strategic businesses or assets. We may not be able to complete such transactions and such transactions, if executed, pose significant risks and could have a negative effect on our operations. |
| • | Our offerings and our customers’ products may infringe on the intellectual property rights of third parties. |
9
Table of Contents
| • | We are subject to environmental, health and safety laws and regulations, which could increase our costs and restrict our operations in the future. |
| • | We are subject to labor and employment laws and regulations, which could increase our costs and restrict our operations in the future. |
| • | Certain of our pension plans are underfunded, and additional cash contributions we may be required to make will reduce the cash available for our business, such as the payment of our interest expense. |
| • | Our substantial leverage could adversely affect our ability to raise additional capital to fund our operations, limit our ability to react to changes in the economy or in our industry, expose us to interest rate risk to the extent of our variable rate debt and prevent us from meeting our obligations under our indebtedness. |
| • | Affiliates of Blackstone control us and their interests may conflict with ours or yours in the future. |
Please see “Risk Factors” for a discussion of these and other factors you should consider before making an investment in shares of our common stock.
Catalent, Inc. is a Delaware corporation. Our principal executive offices are located at 14 Schoolhouse Road, Somerset, New Jersey 08873 and our telephone number is (732) 537-6200. We maintain a website at www.catalent.com. The information contained on our website or that can be accessed through our website neither constitutes part of this prospectus nor is incorporated by reference herein.
10
Table of Contents
THE OFFERING
| Common stock offered by us |
shares. |
| Option to purchase additional shares |
The underwriters have an option to purchase up to additional shares of our common stock from us. The underwriters can exercise this option at any time within 30 days from the date of this prospectus. |
| Common stock outstanding after giving effect to this offering |
shares ( shares if the underwriters exercise their option to purchase additional shares in full). |
| Use of proceeds |
We estimate that the net proceeds to us from this offering, after deducting estimated underwriting discounts and offering expenses, will be approximately $ , based on an assumed initial public offering price of $ per share, which is the midpoint of the price range set forth on the cover page of this prospectus. |
| We intend to use the net proceeds from this offering to pay a termination fee to Blackstone and certain of the other existing owners and to repay our outstanding indebtedness, with any remaining balance to be used for general corporate purposes. See “Use of Proceeds.” |
| Conflict of interest |
Because Blackstone Advisory Partners L.P., one of the participating underwriters, is an affiliate of Blackstone Group L.P., which owns in excess of 10% of our outstanding common shares, Blackstone Advisory Partners L.P. is deemed to have a “conflict of interest” under Rule 5121 (“Rule 5121”) of the Financial Industry Regulatory Authority, Inc. Accordingly, this offering is being made in compliance with the requirements of FINRA Rule 5121. Pursuant to FINRA Rule 5121, Blackstone Advisory Partners L.P. will not sell to an account holder with a discretionary account any security with respect to which the conflict exists, unless Blackstone Advisory Partners L.P. has received specific written approval of the transaction from the account holder and retains documentation of the approval in its records. |
| Dividend policy |
We have no current plans to pay dividends on our common stock. Any decision to declare and pay dividends in the future will be made at the sole discretion of our board of directors and will depend on, among other things, our results of operations, cash requirements, financial condition, contractual restrictions and other factors that our board of directors may deem relevant. |
| Risk factors |
See “Risk Factors” for a discussion of risks you should carefully consider before deciding to invest in our common stock. |
| Proposed New York Stock Exchange trading symbol |
“CTLT.” |
11
Table of Contents
In this prospectus, unless otherwise indicated, the number of shares of common stock outstanding and the information based thereon does not reflect:
| • | shares of common stock issuable upon exercise of the underwriters’ option to purchase additional shares of common stock from us; or |
| • | shares of common stock that may be granted under our 2014 Omnibus Incentive Plan. See “Management—2014 Omnibus Incentive Plan.” |
All share numbers, stock option exercise prices and number of shares subject to outstanding stock options and restricted stock units have been adjusted to reflect a -for- stock split to be completed prior to the closing of this offering.
12
Table of Contents
SUMMARY FINANCIAL DATA
We derived the summary statement of operations data and the summary statement of cash flows data for the years ended June 30, 2013, 2012 and 2011 and the summary balance sheet data as of June 30, 2013 and 2012 from our audited consolidated financial statements included elsewhere in this prospectus. We derived the summary statement of operations data and the summary statement of cash flows data for the nine months ended March 31, 2014 and 2013 and the summary balance sheet data as of March 31, 2014 from our unaudited condensed consolidated financial statements included elsewhere in this prospectus. We have prepared the unaudited condensed consolidated financial statements on the same basis as our audited consolidated financial statements and, in our opinion, have included all adjustments, which include only normal recurring adjustments, necessary to present fairly in all material respects our financial position and results of operations. The results for any interim period are not necessarily indicative of the results that may be expected for the full year. Additionally, our historical results are not necessarily indicative of the results expected for any future period.
You should read the summary historical financial data below, together with our audited consolidated financial statements included elsewhere in this prospectus and related notes thereto appearing elsewhere in this prospectus, as well as “Selected Financial Data,” “Management’s Discussion and Analysis of Financial Condition and Results of Operations,” “Description of Certain Indebtedness,” and the other financial information included elsewhere in this prospectus.
| Nine Months Ended March 31, |
Year Ended June 30, | |||||||||||||||||||
| 2014 | 2013 | 2013 | 2012 | 2011 | ||||||||||||||||
| (dollars in millions, except per share data) | ||||||||||||||||||||
| Statement of Operations Data: |
||||||||||||||||||||
| Net revenue |
$ | 1,308.1 | $ | 1,295.1 | $ | 1,800.3 | $ | 1,694.8 | $ | 1,531.8 | ||||||||||
| Cost of sales |
899.8 | 900.2 | 1,231.7 | 1,136.2 | 1,029.7 | |||||||||||||||
|
|
|
|
|
|
|
|
|
|
|
|||||||||||
| Gross margin |
408.3 | 394.9 | 568.6 | 558.6 | 502.1 | |||||||||||||||
| Selling, general and administrative expense |
256.2 | 251.7 | 340.6 | 348.1 | 288.3 | |||||||||||||||
| Impairment charges and (gain)/loss on sale of assets |
0.4 | 4.6 | 5.2 | 1.8 | 3.6 | |||||||||||||||
| Restructuring and other |
11.9 | 12.7 | 18.4 | 19.5 | 12.5 | |||||||||||||||
| Property and casualty (gain)/loss, net(1) |
— | — | — | (8.8 | ) | 11.6 | ||||||||||||||
|
|
|
|
|
|
|
|
|
|
|
|||||||||||
| Operating earnings/(loss) |
139.8 | 125.9 | 204.4 | 198.0 | 186.1 | |||||||||||||||
| Interest expense, net |
122.8 | 160.7 | 203.2 | 183.2 | 165.5 | |||||||||||||||
| Other (income)/expense, net |
2.8 | 20.3 | 25.1 | (3.8 | ) | 26.0 | ||||||||||||||
|
|
|
|
|
|
|
|
|
|
|
|||||||||||
| Earnings/(loss) from continuing operations before income taxes |
14.2 | (55.1 | ) | (23.9 | ) | 18.6 | (5.4 | ) | ||||||||||||
| Income tax expense/(benefit) |
23.3 | 5.9 | 24.1 | 16.5 | 23.7 | |||||||||||||||
|
|
|
|
|
|
|
|
|
|
|
|||||||||||
| Earnings/(loss) from continuing operations |
(9.1 | ) | (61.0 | ) | (48.0 | ) | 2.1 | (29.1 | ) | |||||||||||
| Earnings/(loss) from discontinued operations, net of tax(2) |
(2.7 | ) | (4.9 | ) | 1.2 | (41.3 | ) | (21.0 | ) | |||||||||||
|
|
|
|
|
|
|
|
|
|
|
|||||||||||
| Net earnings/(loss) |
(11.8 | ) | (65.9 | ) | (46.8 | ) | (39.2 | ) | (50.1 | ) | ||||||||||
| Less: Net earnings/(loss) attributable to noncontrolling interest, net of tax |
(0.8 | ) | — | (0.1 | ) | 1.2 | 3.9 | |||||||||||||
| Net earnings/(loss) attributable to Catalent |
(11.0 | ) | (65.9 | ) | (46.7 | ) | (40.4 | ) | (54.0 | ) | ||||||||||
13
Table of Contents
| Nine Months Ended March 31, |
Year Ended June 30, | |||||||||||||||||||
| 2014 | 2013 | 2013 | 2012 | 2011 | ||||||||||||||||
| (dollars in millions, except per share data) | ||||||||||||||||||||
| Basic earnings per share attributable to Catalent common shareholders: |
||||||||||||||||||||
| Earnings/(loss) from continuing operations |
$ | (8.49) | $ | (56.97) | (44.72 | ) | 0.84 | (30.93 | ) | |||||||||||
| Net earnings/(loss) |
(11.01) | (61.54) | (43.60 | ) | (37.77 | ) | (54.61 | ) | ||||||||||||
| Diluted earnings per share attributable to Catalent common shareholders: |
||||||||||||||||||||
| Earnings/(loss) from continuing operations |
$ | (8.49) | $ | (56.97) | (44.72 | ) | 0.84 | (30.93 | ) | |||||||||||
| Net earnings/(loss) |
(11.01) | (61.54) | (43.60 | ) | (37.71 | ) | (54.61 | ) | ||||||||||||
| Balance Sheet Data (at period end): |
||||||||||||||||||||
| Cash and cash equivalents |
$ | 55.7 | $ | 106.4 | $ | 139.0 | ||||||||||||||
| Total assets |
3,091.0 | 3,056.8 | 3,139.0 | |||||||||||||||||
| Total debt, including current portion of long-term debt and other short-term borrowing |
2,701.2 | 2,691.6 | 2,683.5 | |||||||||||||||||
| Total liabilities |
3,491.4 | 3,467.1 | 3,489.7 | |||||||||||||||||
| Summary Statement of Cash Flows Data: |
||||||||||||||||||||
| Net cash provided by (used in) continuing operations: |
||||||||||||||||||||
| Operating activities |
$ | 95.2 | $ | 84.4 | $ | 139.1 | $ | 87.7 | $ | 111.6 | ||||||||||
| Investing activities |
(114.7 | ) | (84.5 | ) | (122.1 | ) | (538.2 | ) | (83.3 | ) | ||||||||||
| Financing activities |
(36.3 | ) | (51.4 | ) | (49.3 | ) | 352.9 | (26.1 | ) | |||||||||||
| Operational and Other Data: |
||||||||||||||||||||
| Adjusted EBITDA(3) |
$ | 281.6 | $ | 284.5 | $ | 412.7 | $ | 388.3 | $ | 353.8 | ||||||||||
| Capital expenditures |
62.0 | 84.8 | 122.5 | 104.2 | 87.3 | |||||||||||||||
| (1) | In March 2011, a U.K. based packaging facility was damaged by fire. Amounts reported are net of insurance recovery. |
| (2) | In the fourth quarter of fiscal 2012, we sold our U.S. based commercial packaging operations. During fiscal 2011, we classified its printed components facilities as held for sale and therefore as a discontinued operation. |
| (3) | Management measures operating performance based on consolidated earnings from continuing operations before interest expense, expense/(benefit) for income taxes and depreciation and amortization and adjusted for the income or loss attributable to noncontrolling interest (“EBITDA from continuing operations”). EBITDA from continuing operations is not defined under U.S. GAAP and is not a measure of operating income, operating performance or liquidity presented in accordance with U.S. GAAP and is subject to important limitations. |
We believe that the presentation of EBITDA from continuing operations enhances an investor’s understanding of our financial performance. We believe this measure is a useful financial metric to assess our operating performance from period to period by excluding certain items that we believe are not representative of our core business and use this measure for business planning purposes. In addition, given the significant investments that we have made in the past in property, plant and equipment, depreciation and amortization expenses represent a meaningful portion of our cost structure. We believe that EBITDA from continuing operations provides investors with a useful tool for assessing the comparability between periods of our ability to generate cash from operations sufficient to pay taxes, to service debt and to undertake capital expenditures because it eliminates depreciation and amortization expense. Adjusted EBITDA is defined as EBITDA from continuing operations with certain other adjustments noted in the table below. Our management uses Adjusted EBITDA as an operating performance measure. Under the indentures governing
14
Table of Contents
our existing notes, the credit agreements governing our new senior secured credit facilities and our senior unsecured term loan facility, our ability to engage in certain activities such as incurring certain additional indebtedness, making certain investments and paying certain dividends is tied to ratios based on Adjusted EBITDA (which is defined as “EBITDA” in the indentures and the credit agreement governing the senior unsecured term loan facility). Adjusted EBITDA is based on the definitions in our indentures and the credit agreements, is not defined under U.S. GAAP, and is subject to important limitations. We believe that the presentation of Adjusted EBITDA is useful to investors because it is frequently used by securities analysts, investors and other interested parties in their evaluation of the operating performance of companies in industries similar to ours. In addition, targets for Adjusted EBITDA are among the measures we use to evaluate our management’s performance for purposes of determining their compensation under our incentive plans.
Because not all companies use identical calculations, our presentation of EBITDA from continuing operations and Adjusted EBITDA may not be comparable to other similarly titled measures of other companies. EBITDA from continuing operations and Adjusted EBITDA have important limitations as analytical tools and you should not consider them in isolation or as substitutes for analysis of our results as reported under U.S. GAAP. For example, EBITDA from continuing operations and Adjusted EBITDA:
| • | exclude certain tax payments that may represent a reduction in cash available to us; |
| • | do not reflect any cash capital expenditure requirements for the assets being depreciated and amortized that may have to be replaced in the future; |
| • | do not reflect changes in, or cash requirements for, our working capital needs; and |
| • | do not reflect the significant interest expense, or the cash requirements, necessary to service our debt. |
In calculating Adjusted EBITDA, we add back certain non-cash, non-recurring and other items that are included in EBITDA and net income as required by various covenants in the indentures governing our outstanding notes. Adjusted EBITDA among other things:
| • | does not include non-cash stock-based employee compensation expense and certain other non-cash charges; |
| • | does not include cash and non-cash restructuring, severance and relocation costs incurred to realize future cost savings and enhance our operations; |
| • | adds back minority interest expense, which represents the minority investors’ ownership of certain of our consolidated subsidiaries and is, therefore not available to us; |
| • | includes estimated cost savings which have not yet been fully reflected in our results; and |
| • | does not reflect management fees paid to our existing owners. |
15
Table of Contents
A reconciliation of earnings/(loss) from continuing operations, the most directly comparable U.S. GAAP measure, to EBITDA from continuing operations and Adjusted EBITDA is as follows:
| Nine Months Ended March 31, |
Year Ended June 30, | |||||||||||||||||||
| 2014 | 2013 | 2013 | 2012 | 2011 | ||||||||||||||||
| (in millions) | ||||||||||||||||||||
| Earnings/(loss) from continuing operations |
$ | (9.1 | ) | $ | (61.0 | ) | $ | (48.0 | ) | $ | 2.1 | $ | (29.1 | ) | ||||||
| Interest expense, net |
122.8 | 160.7 | 203.2 | 183.2 | 165.5 | |||||||||||||||
| Depreciation and amortization |
108.9 | 114.9 | 152.2 | 129.7 | 115.5 | |||||||||||||||
| Income tax expense |
23.3 | 5.9 | 24.1 | 16.5 | 23.7 | |||||||||||||||
| Noncontrolling interest |
0.8 | — | 0.1 | (1.2 | ) | (3.9 | ) | |||||||||||||
|
|
|
|
|
|
|
|
|
|
|
|||||||||||
| EBITDA from continuing operations |
246.7 | 220.5 | 331.6 | 330.3 | 271.7 | |||||||||||||||
| Equity compensation(a) |
3.4 | 2.2 | 2.8 | 3.7 | 3.9 | |||||||||||||||
| Impairment charges and loss on sale of assets(b) |
0.4 | 4.6 | 5.2 | 1.8 | 3.6 | |||||||||||||||
| Financing related expenses(c) |
0.1 | 11.2 | 16.9 | — | — | |||||||||||||||
| U.S. GAAP Restructuring(d) |
11.9 | 12.7 | 18.4 | 19.5 | 12.5 | |||||||||||||||
| Acquisition, integration and other special items(e) |
9.2 | 12.8 | 15.5 | 33.1 | 14.4 | |||||||||||||||
| Property and casualty losses/(gains) net(f) |
— | — | — | (8.8 | ) | 11.6 | ||||||||||||||
| Foreign exchange loss/(gain) (included in other (income)/expense, net)(g) |
0.3 | 10.5 | 5.7 | (4.6 | ) | 25.5 | ||||||||||||||
| Other adjustments(h) |
(0.1 | ) | 0.6 | 4.2 | 1.4 | — | ||||||||||||||
| Sponsor advisory fee(i) |
9.7 | 9.4 | 12.4 | 11.9 | 10.6 | |||||||||||||||
|
|
|
|
|
|
|
|
|
|
|
|||||||||||
| Adjusted EBITDA |
$ | 281.6 | $ | 284.5 | $ | 412.7 | $ | 388.3 | $ | 353.8 | ||||||||||
| (a) | Reflects non-cash stock-based compensation expense under the provisions of ASC 718 Compensation Stock Compensation. |
| (b) | Reflects non-cash asset impairment charges and losses from the sale of assets not included in restructuring and other special items discussed below. |
| (c) | Reflects the expenses associated with refinancing activities undertaken by us during the period. |
| (d) | Reflects U.S. GAAP restructuring charges which were primarily attributable to activities which focus on various aspects of operations, including consolidating certain operations, rationalizing headcount and aligning operations in a more strategic and cost-efficient structure to optimize our business. |
| (e) | Primarily reflects acquisition and integration related costs. |
| (f) | Primarily reflects property and casualty (gains)/losses resulting from fire damage to a U.K. packaging services operation and the associated insurance reimbursements. |
| (g) | Represents unrealized foreign currency exchange rate (gains)/losses primarily driven by inter-company loans denominated in a currency different from the functional currency of either the borrower or the lender. The foreign exchange adjustment is also impacted by the exclusion of realized foreign currency exchange rate (gains)/losses from the non-cash and cash settlement of inter-company loans. Inter-company loans are between Catalent entities and do not reflect the ongoing results of our trade operations. |
| (h) | Reflects certain other adjustments made pursuant to the definition of “EBITDA” under our indentures and credit agreements. |
| (i) | Represents amount of sponsor advisory fee, which will be terminated following the offering. See “Certain Relationships and Related Party Transactions—Transaction and Advisory Fee Agreement.” |
16
Table of Contents
Investing in our common stock involves a high degree of risk. You should consider carefully the risks and uncertainties described below and the other information contained in this prospectus, including our consolidated financial statements and the related notes, before you decide whether to purchase our common stock.
Risks Relating to Our Business and Industry
We participate in a highly competitive market and increased competition may adversely affect our business.
We operate in a market that is highly competitive. We compete on several fronts, both domestically and internationally, including competing with other companies that provide similar offerings to pharmaceutical, biotechnology and consumer health companies based in North America, Latin America, Europe and the Asia-Pacific region. We also may compete with the internal operations of those pharmaceutical, biotechnology and consumer health manufacturers that choose to source these offerings internally, where possible.
We face material competition in each of our markets. Competition is driven by proprietary technologies and know-how, capabilities, consistency of operational performance, quality, price, value and speed. Some competitors may have greater financial, research and development, operational and marketing resources than we do. Competition may also increase as additional companies enter our markets or use their existing resources to compete directly with ours. Expanded competition from companies in low-cost jurisdictions, such as India and China, may in the future impact our results of operations or limit our growth. Greater financial, research and development, operational and marketing resources may allow our competitors to respond more quickly with new, alternative or emerging technologies. Changes in the nature or extent of our customer requirements may render our offerings obsolete or non-competitive and could adversely affect our results of operations and financial condition.
The demand for our offerings depends in part on our customers’ research and development and the clinical and market success of their products. Our business, financial condition and results of operations may be harmed if our customers spend less on, or are less successful in, these activities.
Our customers are engaged in research, development, production and marketing of pharmaceutical, biotechnology and consumer health products. The amount of customer spending on research, development, production and marketing, as well as the outcomes of such research, development, and marketing activities, have a large impact on our sales and profitability, particularly the amount our customers choose to spend on our offerings. Our customers determine the amounts that they will spend based upon, among other things, available resources and their need to develop new products, which, in turn, is dependent upon a number of factors, including their competitors’ research, development and production initiatives, and the anticipated market uptake, clinical and reimbursement scenarios for specific products and therapeutic areas. In addition, consolidation in the industries in which our customers operate may have an impact on such spending as customers integrate acquired operations, including research and development departments and their budgets. Our customers finance their research and development spending from private and public sources. A reduction in spending by our customers could have a material adverse effect on our business, financial condition and results of operations. If our customers are not successful in attaining or retaining product sales due to market conditions, reimbursement issues or other factors, our results of operations may be materially impacted.
We are subject to product and other liability risks that could adversely affect our results of operations, financial condition, liquidity and cash flows.
We are subject to significant product liability and other liability risks that are inherent in the design, development, manufacture and marketing of our offerings. We may be named as a defendant in product liability
17
Table of Contents
lawsuits, which may allege that our offerings have resulted or could result in an unsafe condition or injury to consumers. Such lawsuits could be costly to defend and could result in reduced sales, significant liabilities and diversion of management’s time, attention and resources. Even claims without merit could subject us to adverse publicity and require us to incur significant legal fees. Beginning in 2006, we were named in a number of civil lawsuits relating to the prescription acne medication Amnesteem®, all but one of which have been dismissed or settled without our being required to make any contribution toward any settlement to date. We may be named in similar lawsuits in the future. See “Business—Legal Proceedings.”
Furthermore, product liability claims and lawsuits, regardless of their ultimate outcome, could have a material adverse effect on our business operations, financial condition and reputation and on our ability to attract and retain customers. We have historically sought to manage this risk through the combination of product liability insurance and contractual indemnities and liability limitations in our agreements with customers and vendors. The availability of product liability insurance for companies in the pharmaceutical industry is generally more limited than insurance available to companies in other industries. Insurance carriers providing product liability insurance to those in the pharmaceutical and biotechnology industries generally limit the amount of available policy limits, require larger self-insured retentions and exclude coverage for certain products and claims. We maintain product liability insurance with annual aggregate limits in excess of $25 million. There can be no assurance that a successful product liability claim or other liability claim would be adequately covered by our applicable insurance policies or by any applicable contractual indemnity or liability limitations.
Failure to comply with existing and future regulatory requirements could adversely affect our results of operations and financial condition.
The healthcare industry is highly regulated. We are subject to various local, state, federal, foreign and transnational laws and regulations, which include the operating and security standards of the DEA, the FDA, various state boards of pharmacy, state health departments, the DHHS, the EU member states and other comparable agencies and, in the future, any changes to such laws and regulations could adversely affect us. In particular, we are subject to laws and regulations concerning good manufacturing practices and drug safety. Our subsidiaries may be required to register for permits and/or licenses with, and may be required to comply with the laws and regulations of the DEA, the FDA, DHHS, foreign agencies including the EMA, and other various state boards of pharmacy, state health departments and/or comparable state agencies as well as certain accrediting bodies depending upon the type of operations and location of product distribution, manufacturing and sale.
The manufacture, distribution and marketing of our offerings for use in our customers’ products are subject to extensive ongoing regulation by the FDA, the DEA, the EMA, and other equivalent local, state, federal and foreign regulatory authorities. Failure by us or by our customers to comply with the requirements of these regulatory authorities could result in warning letters, product recalls or seizures, monetary sanctions, injunctions to halt manufacture and distribution, restrictions on our operations, civil or criminal sanctions, or withdrawal of existing or denial of pending approvals, including those relating to products or facilities. In addition, such a failure could expose us to contractual or product liability claims as well as contractual claims from our customers, including claims for reimbursement for lost or damaged active pharmaceutical ingredients, the cost of which could be significant.
In addition, any new offerings or products must undergo lengthy and rigorous clinical testing and other extensive, costly and time-consuming procedures mandated by the FDA, the EMA and other equivalent local, state, federal and foreign regulatory authorities. We or our customers may elect to delay or cancel anticipated regulatory submissions for current or proposed new products for any number of reasons.
Although we believe that we are in compliance in all material respects with applicable laws and regulations, there can be no assurance that a regulatory agency or tribunal would not reach a different conclusion concerning the compliance of our operations with applicable laws and regulations. In addition, there can be no assurance that we will be able to maintain or renew existing permits, licenses or any other regulatory approvals or obtain,
18
Table of Contents
without significant delay, future permits, licenses or other approvals needed for the operation of our businesses. Any noncompliance by us with applicable laws and regulations or the failure to maintain, renew or obtain necessary permits and licenses could have an adverse effect on our results of operations and financial condition.
Failure to provide quality offerings to our customers could have an adverse effect on our business and subject us to regulatory actions and costly litigation.
Our results depend on our ability to execute and improve when necessary our quality management strategy and systems, and effectively train and maintain our employee base with respect to quality management. Quality management plays an essential role in determining and meeting customer requirements, preventing defects and improving our offerings. While we have a network of quality systems throughout our business units and facilities which relate to the design, formulation, development, manufacturing, packaging, sterilization, handling, distribution and labeling of our customers’ products which use our offerings, quality and safety issues may occur with respect to any of our offerings. A quality or safety issue could have an adverse effect on our business, financial condition and results of operations and may subject us to regulatory actions, including product recalls, product seizures, injunctions to halt manufacture and distribution, restrictions on our operations, or civil sanctions, including monetary sanctions and criminal actions. In addition, such an issue could subject us to costly litigation, including claims from our customers for reimbursement for the cost of lost or damaged active pharmaceutical ingredients, the cost of which could be significant.
The services and offerings we provide are highly exacting and complex, and if we encounter problems providing the services or support required, our business could suffer.
The offerings we provide are highly exacting and complex, particularly in our Medication Delivery Solutions segment, due in part to strict regulatory requirements. From time to time, problems may arise in connection with facility operations or during preparation or provision of an offering, in both cases for a variety of reasons including, but not limited to, equipment malfunction, sterility variances or failures, failure to follow specific protocols and procedures, problems with raw materials, environmental factors and damage to, or loss of, manufacturing operations due to fire, flood or similar causes. Such problems could affect production of a particular batch or series of batches, requiring the destruction of product, or could halt facility production altogether. This could, among other things, lead to increased costs, lost revenue, damage to customer relations, reimbursement to customers for lost active pharmaceutical ingredients, time and expense spent investigating the cause and, depending on the cause, similar losses with respect to other batches or products. Production problems in our drug and biologic manufacturing operations could be particularly significant because the cost of raw materials is often higher than in our other businesses. If problems are not discovered before the product is released to the market, recall and product liability costs may also be incurred. In addition, such risks may be greater at facilities that are new or going through significant expansion or renovation.
Our global operations are subject to a number of economic, political and regulatory risks.
We conduct our operations in various regions of the world, including North America, South America, Europe and the Asia-Pacific region. Global economic and regulatory developments affect businesses such as ours in many ways. Our operations are subject to the effects of global competition, including potential competition from manufacturers in low-cost jurisdictions such as India and China. Local jurisdiction risks include regulatory risks arising from local laws. Our global operations are also affected by local economic environments, including inflation and recession. Political changes, some of which may be disruptive, can interfere with our supply chain and customers and some or all of our activities in a particular location. While some of these risks can be hedged using derivatives or other financial instruments and some are insurable, such attempts to mitigate these risks are costly and not always successful. Also, fluctuations in foreign currency exchange rates can impact our consolidated financial results.
19
Table of Contents
If we do not enhance our existing or introduce new technology or service offerings in a timely manner, our offerings may become obsolete over time, customers may not buy our offerings and our revenue and profitability may decline.
The healthcare industry is characterized by rapid technological change. Demand for our offerings may change in ways we may not anticipate because of such evolving industry standards as well as a result of evolving customer needs that are increasingly sophisticated and varied and the introduction by others of new offerings and technologies that provide alternatives to our offerings. Several of our higher margin offerings are based on proprietary technologies. The patents for these technologies will ultimately expire, and these offerings may become subject to competition. Without the timely introduction of enhanced or new offerings, our offerings may become obsolete over time, in which case our revenue and operating results would suffer. For example, if we are unable to respond to changes in the nature or extent of the technological or other needs of our pharmaceutical customers through enhancing our offerings, our competition may develop offering portfolios that are more competitive than ours and we could find it more difficult to renew or expand existing agreements or obtain new agreements. Innovations directed at continuing to offer enhanced or new offerings generally will require a substantial investment before we can determine their commercial viability, and we may not have the financial resources necessary to fund these innovations.
The success of enhanced or new offerings will depend on several factors, including our ability to:
| • | properly anticipate and satisfy customer needs, including increasing demand for lower cost products; |
| • | enhance, innovate, develop and manufacture new offerings in an economical and timely manner; |
| • | differentiate our offerings from competitors’ offerings; |
| • | achieve positive clinical outcomes for our customers’ new products; |
| • | meet safety requirements and other regulatory requirements of government agencies; |
| • | obtain valid and enforceable intellectual property rights; and |
| • | avoid infringing the proprietary rights of third parties. |
Even if we succeed in creating enhanced or new offerings from these innovations, they may still fail to result in commercially successful offerings or may not produce revenue in excess of the costs of development, and they may be quickly rendered obsolete by changing customer preferences or the introduction by our competitors of offerings embodying new technologies or features. Finally, innovations may not be accepted quickly in the marketplace because of, among other things, entrenched patterns of clinical practice, the need for regulatory clearance and uncertainty over market access or government or third-party reimbursement.
We and our customers depend on patents, copyrights, trademarks and other forms of intellectual property protections, however, these protections may not be adequate.
We rely on a combination of know-how, trade secrets, patents, copyrights and trademarks and other intellectual property laws, nondisclosure and other contractual provisions and technical measures to protect a number of our offerings and intangible assets. These proprietary rights are important to our ongoing operations. There can be no assurance that these protections will prove meaningful against competitive offerings or otherwise be commercially valuable or that we will be successful in obtaining additional intellectual property or enforcing our intellectual property rights against unauthorized users. Our exclusive rights under certain of our offerings are protected by patents, some of which are subject to expire in the near term. When patents covering an offering expire, loss of exclusivity may occur and this may force us to compete with third parties, thereby affecting our revenue and profitability. We do not currently expect any material loss of revenue to occur as a result of the expiration of any patent.
20
Table of Contents
Our proprietary rights may be invalidated, circumvented or challenged. We have in the past been subject to patent oppositions before the European Patent Office and we may in the future be subject to patent oppositions in Europe or other jurisdictions in which we hold patent rights. In addition, in the future, we may need to take legal actions to enforce our intellectual property rights, to protect our trade secrets or to determine the validity and scope of the proprietary rights of others. The outcome of any such legal action may be unfavorable to us.
These legal actions regardless of outcome might result in substantial costs and diversion of resources and management attention. Although we use reasonable efforts to protect our proprietary and confidential information, there can be no assurance that our confidentiality and non-disclosure agreements will not be breached, our trade secrets will not otherwise become known by competitors or that we will have adequate remedies in the event of unauthorized use or disclosure of proprietary information. Even if the validity and enforceability of our intellectual property is upheld, a court might construe our intellectual property not to cover the alleged infringement. In addition, intellectual property enforcement may be unavailable in some foreign countries. There can be no assurance that our competitors will not independently develop technologies that are substantially equivalent or superior to our technology or that third parties will not design around our patent claims to produce competitive offerings. The use of our technology or similar technology by others could reduce or eliminate any competitive advantage we have developed, cause us to lose sales or otherwise harm our business.
We have applied in the United States and certain foreign countries for registration of a number of trademarks, service marks and patents, some of which have been registered or issued, and also claim common law rights in various trademarks and service marks. In the past, third parties have opposed our applications to register intellectual property and there can be no assurance that they will not do so in the future. It is possible that in some cases we may be unable to obtain the registrations for trademarks, service marks and patents for which we have applied and a failure to obtain trademark and patent registrations in the United States or other countries could limit our ability to protect our trademarks and proprietary technologies and impede our marketing efforts in those jurisdictions.
Our use of certain intellectual property rights is also subject to license agreements with third parties for certain patents, software and information technology systems and proprietary technologies. If these license agreements were terminated for any reason, it could result in the loss of our rights to this intellectual property, our operations may be materially adversely affected and we may be unable to commercialize certain offerings.
In addition, many of our branded pharmaceutical customers rely on patents to protect their products from generic competition. Because incentives exist in some countries, including the United States, for generic pharmaceutical companies to challenge these patents, pharmaceutical and biotechnology companies are under the ongoing threat of a challenge to their patents. If our customers’ patents were successfully challenged and as a result subjected to generic competition, the market for our customers’ products could be significantly impacted, which could have an adverse effect on our results of operations and financial condition.
Our future results of operations are subject to fluctuations in the costs, availability, and suitability of the components of the products we manufacture, including active pharmaceutical ingredients, excipients, purchased components, and raw materials.
We depend on various active pharmaceutical ingredients, components, compounds, raw materials, and energy supplied primarily by others for our offerings. This includes, but is not limited to, gelatin, starch, iota carrageenan, petroleum-based products and resin. Also, frequently our customers provide their active pharmaceutical or biologic ingredient for formulation or incorporation in the finished product. It is possible that any of our or our customer supplier relationships could be interrupted due to natural disasters, international supply disruptions caused by pandemics, geopolitical issues, other events or could be terminated in the future.
For example, gelatin is a key component in our Oral Technologies segment. The supply of gelatin is obtained from a limited number of sources. In addition, much of the gelatin we use is bovine-derived. Past
21
Table of Contents
concerns of contamination from Bovine Spongiform Encephalopathy (“BSE”) have narrowed the number of possible sources of particular types of gelatin. If there were a future disruption in the supply of gelatin from any one or more key suppliers, we may not be able to obtain an alternative supply from our other suppliers. If future restrictions were to emerge on the use of bovine-derived gelatin due to concerns of contamination from BSE, any such restriction could hinder our ability to timely supply our customers with products and the use of alternative non-bovine-derived gelatin could be subject to lengthy formulation, testing and regulatory approval.
Any sustained interruption in our receipt of adequate supplies could have an adverse effect on us. In addition, while we have processes intended to reduce volatility in component and material pricing, we may not be able to successfully manage price fluctuations and future price fluctuations or shortages may have an adverse effect on our results of operations.
Changes in market access or healthcare reimbursement for our customers’ products in the United States or internationally could adversely affect our results of operations and financial condition.
The healthcare industry has changed significantly over time, and we expect the industry to continue to evolve. Some of these changes, such as ongoing healthcare reform, adverse changes in government or private funding of healthcare products and services, legislation or regulations governing the patient access to care and privacy, or the delivery, pricing or reimbursement approval of pharmaceuticals and healthcare services or mandated benefits, may cause healthcare industry participants to change the amount of our offerings they purchase or the price they are willing to pay for our offerings. Changes in the healthcare industry’s pricing, selling, inventory, distribution or supply policies or practices could also significantly reduce our revenue and results of operations. Particularly, volatility in individual product demand may result from changes in public or private payer reimbursement or coverage.
Fluctuations in the exchange rate of the U.S. dollar and other foreign currencies could have a material adverse effect on our financial performance and results of operations.
As a company with many international entities, certain revenues, costs, assets and liabilities, including a portion of our new senior secured credit facilities and the senior subordinated notes, are denominated in currencies other than the U.S. dollar. As a result, changes in the exchange rates of these currencies or any other applicable currencies to the U.S. dollar will affect our revenues, earnings and cash flows and could result in unrealized and realized exchange losses despite any efforts we may undertake to manage or mitigate our exposure to foreign currency fluctuations.
Tax legislation initiatives or challenges to our tax positions could adversely affect our results of operations and financial condition.
We are a large multinational corporation with operations in the United States and international jurisdictions, including North America, South America, Europe and the Asia-Pacific region. As such, we are subject to the tax laws and regulations of the United States federal, state and local governments and of many international jurisdictions. From time to time, various legislative initiatives may be proposed that could adversely affect our tax positions. There can be no assurance that our effective tax rate or tax payments will not be adversely affected by these initiatives. In addition, United States federal, state and local, as well as international tax laws and regulations are extremely complex and subject to varying interpretations. There can be no assurance that our tax positions will not be challenged by relevant tax authorities or that we would be successful in any such challenge.
Our ability to use our net operating loss carryforwards and certain other tax attributes may be limited.
We have net operating loss carryforwards available to reduce future taxable income. Utilization of our net operating loss carryforwards may be subject to a substantial limitation under Section 382 of the Internal Revenue Code of 1986, as amended (the “Code”), and comparable provisions of state, local and foreign tax laws due to
22
Table of Contents
changes in ownership of our company that may occur in the future. Under Section 382 of the Code and comparable provisions of state, local and foreign tax laws, if a corporation undergoes an “ownership change,” generally defined as a greater than 50% change by value in its equity ownership over a three year period, the corporation’s ability to carry forward its pre-change net operating loss carryforwards to reduce its post-change income may be limited. We may experience ownership changes in the future as a result of future changes in our stock ownership. As a result, if we generate taxable income in future years, our ability to use our pre-change net operating loss carryforwards to reduce U.S. federal and state taxable income may be subject to limitations, which could result in increased future tax liability to us.
We are dependent on key personnel.
We depend on senior executive officers and other key personnel, including our technical personnel, to operate and grow our business and to develop new enhancements, offerings and technologies. The loss of any of these officers or other key personnel combined with a failure to attract and retain suitably skilled technical personnel could adversely affect our operations.
In addition to our executive officers, we rely on the top approximately 150 senior leaders to lead and direct the company. Our senior leadership team (“SLT”) is comprised of vice presidents and directors who hold critical positions and possess specialized talents and capabilities which give us a competitive advantage in the market. The members of the SLT hold positions such as general manager of manufacturing, general manager of analytical and development laboratories, vice president/general manager of business unit commercial development, director of operations, and vice president of quality and regulatory activities.
With respect to our technical talent, we have over 1,000 scientists and technicians whose areas of expertise and specialization cover subjects such as advanced delivery, drug and biologics formulation and manufacturing. Many of our sites and laboratories are located in competitive labor markets like Morrisville, North Carolina; Brussels, Belgium; Woodstock, Illinois; Madison, Wisconsin; Schorndorf, Germany. Global and regional competitors and, in some cases, customers and suppliers compete for the same skills and talent as we do.
Risks generally associated with our information systems could adversely affect our results of operations.
We rely on information systems in our business to obtain, rapidly process, analyze and manage data to:
| • | facilitate the manufacture and distribution of thousands of inventory items to and from our facilities; |
| • | receive, process and ship orders on a timely basis; |
| • | manage the accurate billing and collections for thousands of customers; |
| • | manage the accurate accounting and payment for thousands of vendors; and |
| • | schedule and operate our global network of development, manufacturing and packaging facilities. |
Our results of operations could be adversely affected if these systems are interrupted, damaged by unforeseen events or fail for any extended period of time, including due to the actions of third parties.
We may in the future engage in acquisitions and other transactions that may complement or expand our business or divest of non-strategic businesses or assets. We may not be able to complete such transactions and such transactions, if executed, pose significant risks and could have a negative effect on our operations.
Our future success may be dependent on opportunities to buy other businesses or technologies and possibly enter into joint ventures that could complement, enhance or expand our current business or offerings and services or that might otherwise offer us growth opportunities. We may face competition from other companies in pursuing acquisitions in the pharmaceutical and biotechnology industry. Our ability to acquire targets may also be limited by applicable antitrust laws and other regulations in the United States and other foreign jurisdictions in
23
Table of Contents
which we do business. To the extent that we are successful in making acquisitions, we may have to expend substantial amounts of cash, incur debt and assume loss-making divisions. We may not be able to complete such transactions, for reasons including, but not limited to, a failure to secure financing. Any transactions that we are able to identify and complete may involve a number of risks, including the diversion of management’s attention to integrate the acquired businesses or joint ventures, the possible adverse effects on our operating results during the integration process, the potential loss of customers or employees in connection with the acquisition, delays or reduction in realizing expected synergies, unexpected liabilities relating to a joint venture of acquired business and our potential inability to achieve our intended objectives for the transaction. In addition, we may be unable to maintain uniform standards, controls, procedures and policies, and this may lead to operational inefficiencies.
To the extent that we are not successful in completing divestitures, as such may be determined by future strategic plans and business performance, we may have to expend substantial amounts of cash, incur debt and continue to absorb loss-making or under-performing divisions. Any divestitures that we are unable to complete may involve a number of risks, including diversion of management’s attention, a negative impact on our customer relationships, costs associated with retaining the targeted divestiture, closing and disposing of the impacted business or transferring business to other facilities.
Our offerings and our customers’ products may infringe on the intellectual property rights of third parties
From time to time, third parties have asserted intellectual property infringement claims against us and our customers and there can be no assurance that third parties will not assert infringement claims against either us or our customers in the future. While we believe that our offerings do not infringe in any material respect upon proprietary rights of other parties and/or that meritorious defenses would exist with respect to any assertions to the contrary, there can be no assurance that we would not be found to infringe on the proprietary rights of others. Patent applications in the United States and some foreign countries are generally not publicly disclosed until the patent is issued or published, and we may not be aware of currently filed patent applications that relate to our offerings or processes. If patents later issue on these applications, we may be found liable for subsequent infringement. There has been substantial litigation in the pharmaceutical and biotechnology industries with respect to the manufacture, use and sale of products that are the subject of conflicting patent rights.
Any claims that our offerings or processes infringe these rights (including claims arising through our contractual indemnification of our customers), regardless of their merit or resolution, could be costly and may divert the efforts and attention of our management and technical personnel. We may not prevail in such proceedings given the complex technical issues and inherent uncertainties in intellectual property litigation. If such proceedings result in an adverse outcome, we could, among other things, be required to:
| • | pay substantial damages (potentially treble damages in the United States); |
| • | cease the manufacture, use or sale of the infringing offerings or processes; |
| • | discontinue the use of the infringing technology; |
| • | expend significant resources to develop non-infringing technology; |
| • | license technology from the third party claiming infringement, which license may not be available on commercially reasonable terms, or may not be available at all; and |
| • | lose the opportunity to license our technology to others or to collect royalty payments based upon successful protection and assertion of our intellectual property against others. |
In addition, our customers’ products may be subject to claims of intellectual property infringement and such claims could materially affect our business if their products cease to be manufactured and they have to discontinue the use of the infringing technology which we may provide.
Any of the foregoing could affect our ability to compete or have a material adverse effect on our business, financial condition and results of operations.
24
Table of Contents
We are subject to environmental, health and safety laws and regulations, which could increase our costs and restrict our operations in the future.
Our operations are subject to a variety of environmental, health and safety laws and regulations, including those of EPA and equivalent local, state, and foreign regulatory agencies in each of the jurisdictions in which we operate. These laws and regulations govern, among other things, air emissions, wastewater discharges, the use, handling and disposal of hazardous substances and wastes, soil and groundwater contamination and employee health and safety. Any failure by us to comply with environmental, health and safety requirements could result in the limitation or suspension of production or subject us to monetary fines or civil or criminal sanctions, or other future liabilities in excess of our reserves. We are also subject to laws and regulations governing the destruction and disposal of raw materials and non-compliant products, the handling of regulated material that are included in our offerings, and the disposal of our offerings at the end of their useful life. In addition, compliance with environmental, health and safety requirements could restrict our ability to expand our facilities or require us to acquire costly pollution control equipment, incur other significant expenses or modify our manufacturing processes. Our manufacturing facilities may use, in varying degrees, hazardous substances in their processes. These substances include, among others, chlorinated solvents, and in the past chlorinated solvents were used at one or more of our facilities, including a number we no longer own or operate. As at our current facilities, contamination at such formerly owned or operated properties can result and has resulted in liability to us. In the event of the discovery of new or previously unknown contamination either at our facilities or at third-party locations, including facilities we formerly owned or operated, the issuance of additional requirements with respect to existing contamination, or the imposition of other cleanup obligations for which we are responsible, we may be required to take additional, unplanned remedial measures for which no reserves have been recorded. We are conducting monitoring and cleanup of contamination at certain facilities currently or formerly owned or operated by us. We have established accounting reserves for certain contamination liabilities but cannot assure you that such liabilities will not exceed our reserves.
We are subject to labor and employment laws and regulations, which could increase our costs and restrict our operations in the future.
We employ approximately 8,000 employees worldwide, including approximately 3,000 employees in North America, 3,400 in Europe, 1,000 in South America and 600 in the Asia/Pacific region. Certain employees at one of our North American facilities are represented by a labor organization, and national works councils and/or labor organizations are active at all twelve of our European facilities consistent with labor environments/laws in European countries. Similar relationships with labor organizations or national works councils exist in our plants in Argentina, Brazil and Australia. Our management believes that our employee relations are satisfactory. However, further organizing activities or collective bargaining may increase our employment-related costs and we may be subject to work stoppages and other labor disruptions. Moreover, as employers are subject to various employment-related claims, such as individual and class actions relating to alleged employment discrimination, wage-hour and labor standards issues, such actions, if brought against us and successful in whole or in part, may affect our ability to compete or have a material adverse effect on our business, financial condition and results of operations.
Certain of our pension plans are underfunded, and additional cash contributions we may be required to make will reduce the cash available for our business, such as the payment of our interest expense.
Certain of our employees in the United States, United Kingdom, Germany, France, Japan and Australia are participants in defined benefit pension plans which we sponsor. As of June 30, 2013, the underfunded amount of our pension plans on a worldwide basis was approximately $90.7 million, primarily related to our fiscal 2012 plans in the United Kingdom and Germany. In addition, we have an estimated obligation of approximately $39.7 million, as of June 30, 2013, related to our withdrawal from a multiemployer pension plans in which we participated, resulting in a total underfunded amount related to our pension plans of $130.4 million as of June 30, 2013. In general, the amount of future contributions to the underfunded plans will depend upon asset returns and a number of other factors and, as a result, the amount we may be required to contribute to such plans in the future may vary. Such cash contributions to the plans will reduce the cash available for our business to pursue strategic growth initiatives or the payment of interest expense on our indebtedness.
25
Table of Contents
Risks Relating to Our Indebtedness
Our substantial leverage could adversely affect our ability to raise additional capital to fund our operations, limit our ability to react to changes in the economy or in our industry, expose us to interest rate risk to the extent of our variable rate debt and prevent us from meeting our obligations under our indebtedness.
Following this offering, we will continue to be highly leveraged. As of March 31, 2014, on an as adjusted basis giving effect to this offering, the use of proceeds therefrom as described under “Use of Proceeds” and the refinancing of our existing senior secured credit facilities with our new senior secured credit facilities, we would have had $ million of indebtedness. In addition, we would have had $188.2 million of availability under our new revolving credit facility after giving effect to $11.8 million of outstanding letters of credit. If the proceeds of this offering are not sufficient to repay such indebtedness, our leverage may be higher. See “Use of Proceeds.”
Our high degree of leverage could have important consequences for us, including:
| • | increasing our vulnerability to adverse economic, industry or competitive developments; |
| • | exposing us to the risk of increased interest rates because certain of our borrowings are at variable rates of interest; |
| • | exposing us to the risk of fluctuations in exchange rates because certain of our borrowings are denominated in euros; |
| • | making it more difficult for us to satisfy our obligations with respect to our indebtedness, and any failure to comply with the obligations of any of our debt instruments, including restrictive covenants and borrowing conditions, could result in an event of default under the governing our indebtedness; |
| • | restricting us from making strategic acquisitions or causing us to make non-strategic divestitures; |
| • | limiting our ability to obtain additional financing for working capital, capital expenditures, product development, debt service requirements, acquisitions and general corporate or other purposes; and |
| • | limiting our flexibility in planning for, or reacting to, changes in our business or market conditions and placing us at a competitive disadvantage compared to our competitors who are less highly leveraged and who, therefore, may be able to take advantage of opportunities that our leverage prevents us from exploiting. |
Our total interest expense, net was $203.2 million, $183.2 million and $165.5 million for fiscal years 2013, 2012 and 2011, respectively.
Assuming we redeem all of our outstanding notes as described under “Use of Proceeds,” following this offering, all of our indebtedness will be floating rate debt. After this offering we may elect to enter into swaps to reduce our exposure to floating interest rates as described under “—We may utilize derivative financial instruments to reduce our exposure to market risks from changes in interest rates on our variable rate indebtedness and we will be exposed to risks related to counterparty creditworthiness or non-performance of these instruments.”
Despite our high indebtedness level, we and our subsidiaries will still be able to incur significant additional amounts of debt, which could further exacerbate the risks associated with our substantial indebtedness.
We and our subsidiaries may be able to incur substantial additional indebtedness in the future. Although the agreements governing our indebtedness contain restrictions on the incurrence of additional indebtedness, these restrictions are subject to a number of significant qualifications and exceptions and, under certain circumstances, the amount of indebtedness that could be incurred in compliance with these restrictions could be substantial.
26
Table of Contents
Our debt agreements contain restrictions that limit our flexibility in operating our business.
The agreements governing our outstanding indebtedness and our new senior secured credit facilities contain various covenants that limit our ability to engage in specified types of transactions. These covenants limit the ability of our subsidiary, Catalent Pharma Solutions, Inc., and its restricted subsidiaries to, among other things:
| • | incur additional indebtedness and issue certain preferred stock; |
| • | pay certain dividends on, repurchase or make distributions in respect of capital stock or make other restricted payments; |
| • | place limitations on distributions from restricted subsidiaries; |
| • | issue or sell capital stock of restricted subsidiaries; |
| • | guarantee certain indebtedness; |
| • | make certain investments; |
| • | sell or exchange assets; |
| • | enter into transactions with affiliates; |
| • | create certain liens; and |
| • | consolidate, merge or transfer all or substantially all of their assets and the assets of their subsidiaries on a consolidated basis. |
A breach of any of these covenants could result in a default under one or more of these agreements, including as a result of cross default provisions, and, in the case of our revolving credit facility, permit the lenders to cease making loans to us.
We may utilize derivative financial instruments to reduce our exposure to market risks from changes in interest rates on our variable rate indebtedness and we will be exposed to risks related to counterparty credit worthiness or non-performance of these instruments.
We may enter into pay-fixed interest rate swaps to limit our exposure to changes in variable interest rates. Such instruments may result in economic losses should exchange rates decline to a point lower than our fixed rate commitments. We will be exposed to credit-related losses which could impact the results of operations in the event of fluctuations in the fair value of the interest rate swaps due to a change in the credit worthiness or non-performance by the counterparties to the interest rate swaps.
Risks Related to this Offering and Ownership of Our Common Stock
No market currently exists for our common stock, and an active, liquid trading market for our common stock may not develop, which may cause our common stock to trade at a discount from the initial offering price and make it difficult for you to sell the common stock you purchase.
Prior to this offering, there has not been a public market for our common stock. We cannot predict the extent to which investor interest in the Company will lead to the development of an active trading market on the New York Stock Exchange or otherwise or how active and liquid that market may become. If an active and liquid trading market does not develop or continue, you may have difficulty selling any of our common stock that you purchase. The initial public offering price for the shares will be determined by negotiations between us and the underwriters and may not be indicative of prices that will prevail in the open market following this offering. The market price of our common stock may decline below the initial offering price, and you may not be able to sell your shares of our common stock at or above the price you paid in this offering, or at all.
27
Table of Contents
You will incur immediate and substantial dilution in the net tangible book value of the shares you purchase in this offering.
Prior stockholders have paid substantially less per share of our common stock than the price in this offering. The initial public offering price of our common stock will be substantially higher than the net tangible book value per share of outstanding common stock prior to completion of the offering. Based on our net tangible book value as of March 31, 2014 and upon the issuance and sale of shares of common stock by us at an assumed initial public offering price of $ per share, which is the mid-point of the range set forth on the cover page of this prospectus, if you purchase our common stock in this offering, you will pay more for your shares than the amounts paid by our existing stockholders for their shares and you will suffer immediate dilution of approximately $ per share in net tangible book value. Dilution is the amount by which the offering price paid by purchasers of our common stock in this offering will exceed the pro forma net tangible book value per share of our common stock upon completion of this offering. If the underwriters exercise their option to purchase additional shares, you will experience additional dilution. You may experience additional dilution upon future equity issuances or the exercise of stock options to purchase common stock granted to our employees, executive officers and directors under our current and future stock incentive plans, including our 2014 Omnibus Incentive Plan. See “Dilution.”
Our stock price may change significantly following the offering, and you may not be able to resell shares of our common stock at or above the price you paid or at all, and you could lose all or part of your investment as a result.
The trading price of our common stock is likely to be volatile. The stock market recently has experienced extreme volatility. This volatility often has been unrelated or disproportionate to the operating performance of particular companies. We and the underwriters will negotiate to determine the initial public offering price. You may not be able to resell your shares at or above the initial public offering price due to a number of factors such as those listed in “—Risks Related to Our Business and Industry” and the following:
| • | results of operations that vary from the expectations of securities analysts and investors; |
| • | results of operations that vary from those of our competitors; |
| • | changes in expectations as to our future financial performance, including financial estimates and investment recommendations by securities analysts and investors; |
| • | declines in the market prices of stocks generally, or those of pharmaceutical companies; |
| • | strategic actions by us or our competitors; |
| • | announcements by us or our competitors of significant contracts, new products, acquisitions, joint marketing relationships, joint ventures, other strategic relationships or capital commitments; |
| • | changes in general economic or market conditions or trends in our industry or markets; |
| • | changes in business or regulatory conditions; |
| • | future sales of our common stock or other securities; |
| • | investor perceptions or the investment opportunity associated with our common stock relative to other investment alternatives; |
| • | the public’s response to press releases or other public announcements by us or third parties, including our filings with the Securities and Exchange Commission (the “SEC”); |
| • | announcements relating to litigation; |
| • | guidance, if any, that we provide to the public, any changes in this guidance or our failure to meet this guidance; |
| • | the development and sustainability of an active trading market for our stock; |
28
Table of Contents
| • | changes in accounting principles; and |
| • | other events or factors, including those resulting from natural disasters, war, acts of terrorism or responses to these events. |
These broad market and industry fluctuations may adversely affect the market price of our common stock, regardless of our actual operating performance. In addition, price volatility may be greater if the public float and trading volume of our common stock is low.
In the past, following periods of market volatility, stockholders have instituted securities class action litigation. If we were involved in securities litigation, it could have a substantial cost and divert resources and the attention of executive management from our business regardless of the outcome of such litigation.
Because we have no current plans to pay cash dividends on our common stock for the foreseeable future, you may not receive any return on investment unless you sell your common stock for a price greater than that which you paid for it.
We intend to retain future earnings, if any, for future operations, expansion and debt repayment and have no current plans to pay any cash dividends for the foreseeable future. The declaration, amount and payment of any future dividends on shares of common stock will be at the sole discretion of our board of directors. Our board of directors may take into account general and economic conditions, our financial condition and results of operations, our available cash and current and anticipated cash needs, capital requirements, contractual, legal, tax and regulatory restrictions and implications on the payment of dividends by us to our stockholders or by our subsidiaries to us and such other factors as our board of directors may deem relevant. In addition, our ability to pay dividends is limited by covenants of our existing and outstanding indebtedness and may be limited by covenants of any future indebtedness we or our subsidiaries incur. As a result, you may not receive any return on an investment in our common stock unless you sell our common stock for a price greater than that which you paid for it.
If securities analysts do not publish research or reports about our business or if they downgrade our stock or our sector, our stock price and trading volume could decline.
The trading market for our common stock will rely in part on the research and reports that industry or financial analysts publish about us or our business. We do not control these analysts. Furthermore, if one or more of the analysts who do cover us downgrade our stock or our industry, or the stock of any of our competitors, or publish inaccurate or unfavorable research about our business, the price of our stock could decline. If one or more of these analysts ceases coverage of the Company or fail to publish reports on us regularly, we could lose visibility in the market, which in turn could cause our stock price or trading volume to decline.
Future sales, or the perception of future sales, by us or our existing stockholders in the public market following this offering could cause the market price for our common stock to decline.
After this offering, the sale of shares of our common stock in the public market, or the perception that such sales could occur, could harm the prevailing market price of shares of our common stock. These sales, or the possibility that these sales may occur, also might make it more difficult for us to sell equity securities in the future at a time and at a price that we deem appropriate.
Upon consummation of this offering we will have a total of shares of common stock outstanding. Of the outstanding shares, the shares sold in this offering will be freely tradable without restriction or further registration under the Securities Act, except that any shares held by our affiliates, as that term is defined under Rule 144 of the Securities Act (“Rule 144”), including our directors, executive officers and other affiliates (including affiliates of Blackstone) may be sold only in compliance with the limitations described in “Shares Eligible for Future Sale.”
29
Table of Contents
The remaining shares, representing % of our total outstanding shares of common stock following this offering, will be “restricted securities” within the meaning of Rule 144 and subject to certain restrictions on resale following the consummation of this offering. Restricted securities may be sold in the public market only if they are registered under the Securities Act or are sold pursuant to an exemption from registration such as Rule 144, as described in “Shares Eligible for Future Sale.”
In connection with this offering, we, our directors and executive officers, and holders of substantially all of our common stock prior to this offering have each agreed with the underwriters, subject to certain exceptions, not to dispose of or hedge any of our or their common stock or securities convertible into or exchangeable for shares of common stock during the period from the date of this prospectus continuing through the date 180 days after the date of this prospectus, except with the prior written consent of the representatives of the underwriters. See “Underwriting” for a description of these lock-up agreements.
In addition, shares of common stock will be eligible for sale upon exercise of vested options. As soon as practicable following this offering, we intend to file one or more registration statements on Form S-8 under the Securities Act to register all shares of common stock subject to outstanding stock options and the shares of common stock subject to issuance under the 2014 Omnibus Incentive Plan to be adopted in connection with this offering. Any such Form S-8 registration statements will automatically become effective upon filing. We expect that the initial registration statement on Form S-8 will cover shares of common stock. Once these shares are registered, they can be sold in the public market upon issuance, subject to restrictions under the securities laws applicable to resales by affiliates.
Upon the expiration of the lock-up agreements described above, the remaining shares will be eligible for resale, which would be subject to volume, manner of sale and other limitations under Rule 144. In addition, pursuant to a registration rights agreement, our existing owners have the right, subject to certain conditions, to require us to register the sale of their shares of our common stock under the Securities Act. By exercising their registration rights and selling a large number of shares, our existing owners could cause the prevailing market price of our common stock to decline. Following completion of this offering, the shares covered by registration rights would represent approximately % of our outstanding common stock (or %, if the underwriters exercise in full their option to purchase additional shares). Registration of any of these outstanding shares of common stock would result in such shares becoming freely tradable without compliance with Rule 144 upon effectiveness of the registration statement. See “Shares Eligible for Future Sale.”
As restrictions on resale end or if these stockholders exercise their registration rights, the market price of our shares of common stock could drop significantly if the holders of these shares sell them or are perceived by the market as intending to sell them. These factors could also make it more difficult for us to raise additional funds through future offerings of our shares of common stock or other securities. In the future, we may also issue our securities in connection with investments or acquisitions. The amount of shares of our common stock issued in connection with an investment or acquisition could constitute a material portion of then-outstanding shares of our common stock. Any issuance of additional securities in connection with investments or acquisitions may result in additional dilution to you.
Anti-takeover provisions in our organizational documents could delay or prevent a change of control.
Certain provisions of our amended and restated certificate of incorporation and amended and restated bylaws may have an anti-takeover effect and may delay, defer or prevent a merger, acquisition, tender offer, takeover attempt or other change of control transaction that a stockholder might consider in its best interest, including those attempts that might result in a premium over the market price for the shares held by our stockholders.
These provisions provide for, among other things:
| • | a classified board of directors with staggered three-year terms; |
| • | the ability of our board of directors to issue one or more series of preferred stock; |
30
Table of Contents
| • | advance notice for nominations of directors by stockholders and for stockholders to include matters to be considered at our annual meetings; |
| • | certain limitations on convening special stockholder meetings; |
| • | the removal of directors only for cause and only upon the affirmative vote of holders of at least 66 2⁄3% of the shares of common stock entitled to vote generally in the election of directors if Blackstone and its affiliates hold less than 40% of our outstanding shares of common stock; and |
| • | that certain provisions may be amended only by the affirmative vote of at least 66 2⁄3% of the shares of common stock entitled to vote generally in the election of directors if Blackstone and its affiliates cease to hold less than 40% of our outstanding shares of common stock. |
These anti-takeover provisions could make it more difficult for a third party to acquire us, even if the third-party’s offer may be considered beneficial by many of our stockholders. As a result, our stockholders may be limited in their ability to obtain a premium for their shares. See “Description of Capital Stock.”
Affiliates of Blackstone control us and their interests may conflict with ours or yours in the future.
Immediately following this offering of common stock, affiliates of Blackstone will beneficially own approximately % of our common stock, or approximately % if the underwriters exercise in full their option to purchase additional shares. As a result, investment funds associated with or designated by affiliates of Blackstone will have the ability to elect all of the members of our board of directors and thereby control our policies and operations, including the appointment of management, future issuances of our common stock or other securities, the payment of dividends, if any, on our common stock, the incurrence or modification of debt by us, amendments to our amended and restated certificate of incorporation and amended and restated bylaws and the entering into of extraordinary transactions, and their interests may not in all cases be aligned with your interests. In addition, Blackstone may have an interest in pursuing acquisitions, divestitures and other transactions that, in its judgment, could enhance its investment, even though such transactions might involve risks to you. For example, Blackstone could cause us to make acquisitions that increase our indebtedness or cause us to sell revenue-generating assets. Additionally, in certain circumstances, acquisitions of debt at a discount by purchasers that are related to a debtor can give rise to cancellation of indebtedness income to such debtor for U.S. federal income tax purposes.
Blackstone is in the business of making investments in companies and may from time to time acquire and hold interests in businesses that compete directly or indirectly with us. For example, Blackstone has made investments in Biomet, Inc., Emcure Pharmaceuticals Ltd., Apria Healthcare Group Inc., Nycomed Holding A/S, DJO Global LLC, Independent Clinical Services Ltd, Southern Cross Healthcare Group PLC, Stiefel Laboratories, Inc, Team Health Holdings, Inc. and Vanguard Health Systems, Inc.
Our amended and restated certificate of incorporation will provide that none of Blackstone, any of its affiliates or any director who is not employed by us (including any non-employee director who serves as one of our officers in both his director and officer capacities) or his or her affiliates will have any duty to refrain from engaging, directly or indirectly, in the same business activities or similar business activities or lines of business in which we operate. Blackstone also may pursue acquisition opportunities that may be complementary to our business, and, as a result, those acquisition opportunities may not be available to us. So long as Blackstone continues to own a significant amount of our combined voting power, even if such amount is less than 50%, Blackstone will continue to be able to strongly influence or effectively control our decisions and, so long as Blackstone and its affiliates collectively own at least 5% of all outstanding shares of our stock entitled to vote generally in the election of directors, it will be able to appoint individuals to our board of directors under a stockholders agreement which we expect to adopt in connection with this offering. In addition, Blackstone will be able to determine the outcome of all matters requiring stockholder approval and will be able to cause or prevent a change of control of the Company or a change in the composition of our board of directors and could
31
Table of Contents
preclude any unsolicited acquisition of the Company. The concentration of ownership could deprive you of an opportunity to receive a premium for your shares of common stock as part of a sale of the Company and ultimately might affect the market price of our common stock.
We will be a “controlled company” within the meaning of the rules of the New York Stock Exchange and the rules of the SEC. As a result, we will qualify for, and intend to rely on, exemptions from certain corporate governance requirements that would otherwise provide protection to stockholders of other companies.
After completion of this offering, Blackstone will continue to control a majority of the voting power of our outstanding common stock. As a result, we will be a “controlled company” within the meaning of the corporate governance standards of the New York Stock Exchange. Under these rules, a company of which more than 50% of the voting power is held by an individual, group or another company is a “controlled company” and may elect not to comply with certain corporate governance requirements, including:
| • | the requirement that a majority of our board of directors consist of “independent directors” as defined under the rules of the New York Stock Exchange; |
| • | the requirement that our director nominees be selected, or recommended for our board of directors’ selection, either (1) by a majority of independent directors in a vote by independent directors, pursuant to a nominations process adopted by a board of directors resolution, or (2) by a nominating/governance committee comprised solely of independent directors with a written charter addressing the nominations process; |
| • | the requirement that the compensation of our executive officers be determined, or recommended to our board of directors for determination, by a majority of independent directors in a vote by independent directors, or a compensation committee comprised solely of independent directors; and |
| • | the requirement for an annual performance evaluation of the nominating/corporate governance and compensation committees. |
Following this offering, we intend to utilize these exemptions. As a result, we may not have a majority of independent directors, our nominating/corporate governance committee, and compensation committee may not consist entirely of independent directors and such committees will not be subject to annual performance evaluations. Accordingly, you may not have the same protections afforded to stockholders of companies that are subject to all of the corporate governance requirements of the New York Stock Exchange.
In addition, on June 20, 2012, the SEC passed final rules implementing provisions of the Dodd-Frank Wall Street Reform and Consumer Protection Act of 2010 pertaining to compensation committee independence and the role and disclosure of compensation consultants and other advisers to the compensation committee. The SEC’s rules direct each of the national securities exchanges (including the New York Stock Exchange on which we intend to list our common stock) to develop listing standards requiring, among other things, that:
| • | compensation committees be composed of fully independent directors, as determined pursuant to new independence requirements; |
| • | compensation committees be explicitly charged with hiring and overseeing compensation consultants, legal counsel and other committee advisors; and |
| • | compensation committees be required to consider, when engaging compensation consultants, legal counsel or other advisors, certain independence factors, including factors that examine the relationship between the consultant or advisor’s employer and us. |
As a “controlled company,” we will not be subject to these compensation committee independence requirements if and when they are adopted by under the SEC’s rules.
32
Table of Contents
This prospectus contains forward-looking statements that reflect our current views with respect to, among other things, our operations and financial performance. Forward-looking statements include all statements that are not historical facts. In some cases, you can identify these forward-looking statements by the use of words such as “outlook,” “believes,” “expects,” “potential,” “continues,” “may,” “will,” “should,” “could,” “seeks,” “approximately,” “predicts,” “intends,” “plans,” “estimates,” “anticipates” or the negative version of these words or other comparable words. Such forward-looking statements are subject to various risks and uncertainties. Accordingly, there are or will be important factors that could cause actual outcomes or results to differ materially from those indicated in these statements. We believe these factors include but are not limited to those described under “Risk Factors.” These factors should not be construed as exhaustive and should be read in conjunction with the other cautionary statements that are included in this prospectus. We undertake no obligation to publicly update or review any forward-looking statement, whether as a result of new information, future developments or otherwise, except as required by law.
“LyoPan®,” “OptiForm®,” “GPEx®,” “Liqui-Gels®,” “VegiCaps®” and “Zydis®” are our registered U.S. and/or foreign trademarks. This prospectus also includes trademarks and trade names owned by other parties, and these trademarks and trade names are the property of their respective owners. We use certain other trademarks and service marks, including OptiShell™, OsDRC®, OptiDose™, SMARTag™, Zydis Bio™, Zydis Nano™ and OptiMelt™ on an unregistered basis in the United States.
Solely for convenience, the trademarks, service marks and trade names referred to in this prospectus are without the ® and ™ symbols, but such references are not intended to indicate, in any way, that we will not assert, to the fullest extent under applicable law, our rights or the rights of the applicable licensors to these trademarks, service marks, and trade names. All trademarks, service marks and trade names appearing in this prospectus are the property of their respective owners.
Within this prospectus, we reference information and statistics regarding various industries and sectors. We have obtained this information and statistics from various independent third-party sources, including independent industry publications, reports by market research firms and other independent sources. Some data and other information are also based on our good faith estimates, which are derived from our review of internal surveys and independent sources.
33
Table of Contents
We estimate that the net proceeds from our sale of shares of common stock in this offering at an assumed initial public offering price of $ per share, which is the midpoint of the price range set forth on the cover page of this prospectus, after deducting estimated underwriting discounts and commissions and estimated offering expenses payable by us, will be approximately $ million (or $ million if the underwriters exercise in full their option to purchase additional shares). A $1.00 increase or decrease in the assumed initial public offering price of $ per share would increase or decrease, as applicable, the net proceeds to us from this offering by approximately $ million (or $ million if the underwriters exercise in full their option to purchase additional shares), assuming the number of shares offered by us remains the same as set forth on the cover page of this prospectus and after deducting the estimated underwriting discounts and commissions and estimated offering expenses payable by us.
We intend to use the net proceeds from this offering to:
| • | pay a termination fee equal to approximately $ million to Blackstone and certain of the other existing owners; |
| • | redeem the outstanding $297.1 million aggregate principal amount of our 9 3⁄4% Senior Subordinated Notes due 2017 for a total redemption price of $ million; |
| • | redeem the outstanding $350.0 million aggregate principal amount of our 7 7⁄8% Senior Notes due 2018 for a total redemption price of $ million; and |
| • | to the extent that there are any remaining proceeds, repay all or a portion of the $275.0 million aggregate principal amount outstanding under our senior unsecured term loan facility. |
Any remaining net proceeds will be used for general corporate purposes.
Borrowings under our senior unsecured term loan facility bear interest, at our option, at a rate equal to the margin over either (a) a base rate determined by reference to the higher of (1) the rate of interest published by The Wall Street Journal as its “prime interest rate” and (2) the federal funds rate plus 0.5% or (b) a LIBOR rate determined by reference to the cost of funds for deposits in the currency of such borrowing for the interest period relevant to such borrowing adjusted for certain additional costs. Under the senior unsecured term loan, the applicable margin is 5.25% for loans based on a LIBOR rate and 4.25% for loans based on the base rate. The LIBOR rate is subject to a floor of 1.25% and the base rate is subject to a floor of 2.25%. See “Description of Certain Indebtedness—Senior Unsecured Credit Facilities.” Our senior unsecured term loan facility matures December 31, 2017.
34
Table of Contents
We have no current plans to pay dividends on our common stock. Any decision to declare and pay dividends in the future will be made at the sole discretion of our board of directors and will depend on, among other things, our results of operations, cash requirements, financial condition, contractual restrictions and other factors that our board of directors may deem relevant. Because we are a holding company and have no direct operations, we will only be able to pay dividends from funds we receive from our subsidiaries. In addition, our ability to pay dividends will be limited by covenants in our existing indebtedness and may be limited by the agreements governing other indebtedness we or our subsidiaries incur in the future. See “Description of Certain Indebtedness.”
We did not declare or pay any dividends on our common stock in fiscal 2013, fiscal 2012 or in the nine months ended March 31, 2014.
35
Table of Contents
The following table sets forth our consolidated cash and cash equivalents and capitalization as of March 31, 2014 on:
| • | an actual basis; and |
| • | an as adjusted basis to give effect to: |
| • | our borrowings under our new senior secured term loan facility and repayment of the borrowings under our existing senior secured credit facilities; |
| • | the sale by us of shares of common stock in this offering at an assumed initial public offering price of $ per share, which is the midpoint of the price range set forth on the cover page of this prospectus; and |
| • | the application of net proceeds from this offering and our borrowings under our new senior secured credit facility as described under “Use of Proceeds,” assuming all of our existing debt is refinanced, as if this offering and such borrowings and the application of the net proceeds therefrom had occurred on March 31, 2014. |
You should read this table in conjunction with the information contained in “Use of Proceeds,” “Selected Financial Data,” “Management’s Discussion and Analysis of Financial Condition and Results of Operations” and “Description of Certain Indebtedness,” as well as our audited and unaudited consolidated financial statements included elsewhere in this prospectus and the notes thereto included elsewhere in this prospectus.
| As of March 31, 2014 | ||||||||
| Actual | As Adjusted(1) | |||||||
| (In millions, except share and per share data) |
||||||||
| Cash and cash equivalents |
$ | 55.7 | ||||||
|
|
|
|
|
|||||
| Debt: |
||||||||
| Senior secured credit facilities |
||||||||
| Revolving credit facility(2) |
— | |||||||
| Term loan facilities(3) |
1,708.2 | |||||||
| 9 3⁄4% Senior Subordinated Notes due 2017(4) |
297.1 | |||||||
| 7 7⁄8% Senior Notes |
348.6 | |||||||
| Senior unsecured term loan facility |
274.3 | |||||||
| New senior secured credit facilities |
||||||||
| New revolving credit facility(5) |
— | |||||||
| New term loan facilities(6) |
— | |||||||
| Other obligations(7) |
73.0 | |||||||
|
|
|
|
|
|||||
| Total debt |
2,701.2 | |||||||
| Redeemable noncontrolling interest(8) |
4.5 | |||||||
| Stockholders’ equity: |
||||||||
| Common stock, $0.01 par value, 1,200,000 shares authorized, actual; 1,068,566 shares issued and outstanding, actual; shares authorized, as adjusted; and shares issued and outstanding, as adjusted |
— | |||||||
| Additional paid-in capital |
1,031.0 | |||||||
| Accumulated deficit |
(1,439.8 | ) | ||||||
| Accumulated other comprehensive income/(loss) |
||||||||
| Total Catalent shareholders’ deficit |
(400.0 | ) | ||||||
|
|
|
|
|
|||||
| Noncontrolling interest |
(0.4 | ) | ||||||
|
|
|
|
|
|||||
| Total shareholders’ deficit |
(400.4 | ) | ||||||
|
|
|
|
|
|||||
| Total capitalization |
$ | 2,300.8 | $ | |||||
|
|
|
|
|
|||||
| (1) | Each $1.00 increase or decrease in the assumed initial public offering price of $ per share would increase or decrease, as applicable, cash and cash equivalents, additional paid-in capital and total Catalent |
36
Table of Contents
| shareholders’ deficit by approximately $ million, assuming the number of shares offered by us remains the same as set forth on the cover page of this prospectus and after deducting the estimated underwriting discounts and commissions and estimated offering expenses that we must pay. |
| (2) | Our revolving credit facility as of March 31, 2014 provided for availability of $200.3 million. As of March 31, 2014, there were no outstanding borrowings under the revolving credit facility and there were $11.8 million in outstanding letters of credit. On May 20, 2014, our former revolving credit facility was replaced with a new five-year $200 million revolving credit facility as described under “Description of Certain Indebtedness—New Senior Secured Credit Facilities.” |
| (3) | As of March 31, 2014, our former senior secured term loan facilities included three tranches: a €202.3 million euro-denominated tranche maturing September 15, 2016, a $786.2 million U.S. dollar-denominated tranche maturing September 15, 2016 and a $643.1 million U.S. dollar-denominated tranche maturing September 15, 2017. The euro-denominated tranche is shown using a U.S. dollar-equivalent based on an exchange rate of approximately €1 = $1.38. On May 20, 2014, we amended and restated our senior secured credit agreement and replaced all of our former senior secured term loan facilities as described under “Description of Certain Indebtedness—New Senior Secured Credit Facilities.” |
| (4) | Represents the U.S. dollar-equivalent of the €215.4 million aggregate principal amount of senior subordinated notes based on an exchange rate of approximately €1 = $1.38. |
| (5) | Our new revolving credit facility provides for availability of $200.0 million. See “Description of Certain Indebtedness—New Senior Secured Credit Facilities.” |
| (6) | The amended and restated credit agreement provides for two tranches of term loan facilities: a $1,400.0 million U.S. dollar term loan and a €250 million euro term loan. See “Description of Certain Indebtedness—New Senior Secured Credit Facilities.” |
| (7) | Other obligations consist primarily of loans for equipment, buildings and a capital lease for a building. |
| (8) | In July 2013, we acquired a 67% controlling interest in a softgel manufacturing facility located in Haining, China. The noncontrolling interest shareholders have the right to jointly sell the remaining 33% interest to us during the 30-day period following the third anniversary of closing for a price based on the greater of (1) an amount that would provide the noncontrolling interest shareholders a return on their investment of a predetermined amount per annum on their pro rata share of the initial valuation or (2) a multiple of the sum of the target’s earnings before interest, taxes, depreciation and amortization and amortization less net debt for the four quarters immediately preceding such sale. Noncontrolling interests with redemption features, such as the arrangement described above, that are not solely within the issuer’s control are considered redeemable noncontrolling interests, which are considered temporary equity and are therefore reported outside of permanent equity on our consolidated balance sheet at the greater of (1) the initial carrying amount adjusted for the noncontrolling interest’s share of net income/(loss) and (2) its redemption value. As of March 31, 2014, the redemption value of the redeemable noncontrolling interest approximated the carrying value. |
37
Table of Contents
If you invest in shares of our common stock in this offering, your investment will be immediately diluted to the extent of the difference between the initial public offering price per share of common stock and the net tangible book value per share of common stock after this offering. Dilution results from the fact that the per share offering price of the shares of common stock is substantially in excess of the net tangible book value per share attributable to the shares of common stock held by existing owners.
Our net tangible book value as of March 31, 2014 was approximately $ , or $ per share of common stock. We calculate net tangible book value per share by taking the amount of our total tangible assets, reduced by the amount of our total liabilities, and then dividing that amount by the total number of shares of common stock outstanding.
After giving effect to our sale of the shares in this offering at an assumed initial public offering price of $ per share, the midpoint range described on the cover of this prospectus, and after deducting estimated underwriting discounts and commissions and offering expenses payable by us, our net tangible book value as of March 31, 2014 would have been $ , or $ per share of common stock. This represents an immediate increase in net tangible book value of $ per share of common stock to our existing owners and an immediate and substantial dilution in net tangible book value of $ per share of common stock to investors in this offering at the assumed initial public offering price.
The following table illustrates this dilution on a per share of common stock basis assuming the underwriters do not exercise their option to purchase additional shares of common stock:
| Assumed initial public offering price per share of common stock |
$ | |||||||
| Net tangible book value per share of common stock as of March 31, 2014 |
$ | |||||||
| Increase in net tangible book value per share of common stock attributable to investors in this offering |
$ | |||||||
|
|
|
|||||||
| As adjusted net tangible book value per share of common stock after the offering |
$ | |||||||
|
|
|
|||||||
| Dilution per share of common stock to investors in this offering |
$ | |||||||
|
|
|
A $1.00 increase in the assumed initial public offering price of $ per share of our common stock would increase our net tangible book value after giving to the offering by $ million, or by $ per share of our common stock, assuming the number of shares offered by us remains the same and after deducting the underwriting discount and the estimated offering expenses payable by us. A $1.00 decrease in the assumed initial public offering price per share would result in equal changes in the opposite direction.
The following table summarizes, as of March 31, 2014, the total number of shares of common stock purchased from us, the total cash consideration paid to us, and the average price per share paid by existing owners and by new investors. As the table shows, new investors purchasing shares in this offering will pay an average price per share substantially higher than our existing owners paid. The table below assumes an initial public offering price of $ per share, the midpoint of the range set forth on the cover of this prospectus, for shares purchased in this offering and excludes underwriting discounts and commissions and estimated offering expenses payable by us:
| Shares of Common Stock Purchased |
Total Consideration |
Average Price Per Share of Common Stock |
||||||||||||||||
| Number | Percent | Amount | Percent | |||||||||||||||
| (Dollar amounts in thousands, except per share amounts) |
||||||||||||||||||
| Existing owners |
% | $ | % | $ | ||||||||||||||
| Investors in this offering |
% | $ | % | $ | ||||||||||||||
|
|
|
|
|
|
|
|
||||||||||||
| Total |
100.0 | % | $ | 100.0 | % | $ | ||||||||||||
|
|
|
|
|
|
|
|
||||||||||||
38
Table of Contents
Each $1.00 increase in the assumed offering price of $ per share would increase total consideration paid by investors in this offering and total consideration paid by all stockholders by $ million, assuming the number of shares offered by us remains the same and after deducting the underwriting discount and the estimated offering expenses payable by us. A $1.00 decrease in the assumed initial public offering price per share would result in equal changes in the opposite direction.
The dilution information above is for illustration purposes only. Our net tangible book value following the consummation of this offering is subject to adjustment based on the actual initial public offering price of our shares and other terms of this offering determined at pricing.
39
Table of Contents
We derived the selected statement of operations data for the years ended June 30, 2013, 2012 and 2011 and the selected balance sheet data as of June 30, 2013 and 2012 from our audited consolidated financial statements included elsewhere in this prospectus. We derived the selected statement of operations data for the years ended June 30, 2010 and 2009 and the selected balance sheet data as of June 30, 2011, 2010 and 2009 from our audited consolidated financial statements, which are not included in this prospectus. We derived the selected statement of operations data for the nine months ended March 31, 2014 and 2013 and the selected consolidated balance sheet data as of March 31, 2014 from our unaudited condensed consolidated financial statements included elsewhere in this prospectus. We have prepared the unaudited condensed consolidated financial statements on the same basis as our audited consolidated financial statements and, in our opinion, have included all adjustments, which include only normal recurring adjustments, necessary to present fairly in all material respects our financial position and results of operations. The results for any interim period are not necessarily indicative of the results that may be expected for the full year. Additionally, our historical results are not necessarily indicative of the results expected for any future period.
You should read the selected consolidated financial data below together with our audited consolidated financial statements included elsewhere in this prospectus including the related notes thereto appearing elsewhere in this prospectus, as well as “Management’s Discussion and Analysis of Financial Condition and Results of Operations” and “Description of Certain Indebtedness,” and the other financial information included elsewhere in this prospectus.
| Nine Months Ended March 31, |
Year Ended June 30, | |||||||||||||||||||||||||||
| 2014 | 2013 | 2013 | 2012 | 2011 | 2010 | 2009 | ||||||||||||||||||||||
| (in millions, except per share data) | ||||||||||||||||||||||||||||
| Statement of Operations Data: |
||||||||||||||||||||||||||||
| Revenues |
||||||||||||||||||||||||||||
| Net revenue |
$ | 1,308.1 | $ | 1,295.1 | $ | 1,800.3 | $ | 1,694.8 | $ | 1,531.8 | $ | 1,480.4 | $ | 1,398.8 | ||||||||||||||
| Cost of sales |
899.8 | 900.2 | 1,231.7 | 1,136.2 | 1,029.7 | 1,039.5 | 1,018.1 | |||||||||||||||||||||
|
|
|
|
|
|
|
|
|
|
|
|
|
|
|
|||||||||||||||
| Gross margin |
408.3 | 394.9 | 568.6 | 558.6 | 502.1 | 440.9 | 380.7 | |||||||||||||||||||||
| Selling, general and administrative expenses |
256.2 | 251.7 | 340.6 | 348.1 | 288.3 | 270.1 | 241.4 | |||||||||||||||||||||
| Impairment charges and (gain)/loss on sale of assets |
0.4 | 4.6 | 5.2 | 1.8 | 3.6 | 214.8 | 139.4 | |||||||||||||||||||||
| Restructuring and other |
11.9 | 12.7 | 18.4 | 19.5 | 12.5 | 17.7 | 15.4 | |||||||||||||||||||||
| Property and casualty (gain)/loss, net(1) |
— | — | — | (8.8 | ) | 11.6 | — | — | ||||||||||||||||||||
|
|
|
|
|
|
|
|
|
|
|
|
|
|
|
|||||||||||||||
| Operating earnings/(loss) |
139.8 | 125.9 | $ | 204.4 | $ | 198.0 | $ | 186.1 | $ | (61.7 | ) | $ | (15.5 | ) | ||||||||||||||
| Interest expense, net |
122.8 | 160.7 | 203.2 | 183.2 | 165.5 | 161.0 | 182.0 | |||||||||||||||||||||
| Other (income)/expense, net |
2.8 | 20.3 | 25.1 | (3.8 | ) | 26.0 | (7.3 | ) | (17.0 | ) | ||||||||||||||||||
|
|
|
|
|
|
|
|
|
|
|
|
|
|
|
|||||||||||||||
| Earnings/(loss) from continuing operations before income taxes |
14.2 | (55.1 | ) | (23.9 | ) | 18.6 | (5.4 | ) | (215.4 | ) | (180.5 | ) | ||||||||||||||||
| Income tax expense/(benefit) |
23.3 | 5.9 | 24.1 | 16.5 | 23.7 | 21.9 | 17.0 | |||||||||||||||||||||
|
|
|
|
|
|
|
|
|
|
|
|
|
|
|
|||||||||||||||
| Earnings/(loss) from continuing operations |
(9.1 | ) | (61.0 | ) | (48.0 | ) | 2.1 | (29.1 | ) | (237.3 | ) | (197.5 | ) | |||||||||||||||
| Earnings/(loss) from discontinued operations, net of tax |
(2.7 | ) | (4.9 | ) | 1.2 | (41.3 | ) | (21.0 | ) | (49.7 | ) | (111.2 | ) | |||||||||||||||
|
|
|
|
|
|
|
|
|
|
|
|
|
|
|
|||||||||||||||
| Net earnings/(loss) |
(11.8 | ) | (65.9 | ) | (46.8 | ) | (39.2 | ) | (50.1 | ) | (287.0 | ) | (308.7 | ) | ||||||||||||||
| Less: net earnings/(loss) attributable to noncontrolling interest, net of tax |
(0.8 | ) | — | (0.1 | ) | 1.2 | 3.9 | 2.6 | (0.6 | ) | ||||||||||||||||||
|
|
|
|
|
|
|
|
|
|
|
|
|
|
|
|||||||||||||||
| Net earnings/loss attributable to Catalent |
$ | (11.0 | ) | $ | (65.9 | ) | (46.7 | ) | (40.4 | ) | (54.0 | ) | (289.6 | ) | (308.1 | ) | ||||||||||||
|
|
|
|
|
|
|
|
|
|
|
|
|
|
|
|||||||||||||||
| Basic earnings per share attributable to Catalent common shareholders: |
||||||||||||||||||||||||||||
| Earnings/(loss) from continuing operations |
(8.49 | ) | (56.97 | ) | (44.72 | ) | 0.84 | (30.93 | ) | (225.76 | ) | (236.15 | ) | |||||||||||||||
| Net earnings/(loss) |
(11.01 | ) | (61.54 | ) | (43.60 | ) | (37.77 | ) | (50.61 | ) | (272.53 | ) | (289.98 | ) | ||||||||||||||
| Diluted earnings per share attributable to Catalent common shareholders: |
||||||||||||||||||||||||||||
| Earnings/(loss) from continuing operations |
(8.49 | ) | (56.97 | ) | (44.72 | ) | 0.84 | (30.93 | ) | (225.76 | ) | (236.15 | ) | |||||||||||||||
| Net earnings/(loss) |
(11.01 | ) | (61.54 | ) | (43.60 | ) | (37.51 | ) | (50.61 | ) | (272.53 | ) | (289.98 | ) | ||||||||||||||
| (1) | In March 2011, a U.K. based packaging facility was damaged by fire. Amounts reported are net of insurance recovery. |
40
Table of Contents
| As of March 31, 2014 |
As of June 30, | |||||||||||||||||||||||
| 2013 | 2012 | 2011 | 2010 | 2009 | ||||||||||||||||||||
| (in millions) | ||||||||||||||||||||||||
| Selected Balance Sheet Data: |
||||||||||||||||||||||||
| Cash and cash equivalents |
$ | 55.7 | $ | 106.4 | $ | 139.0 | $ | 205.1 | $ | 164.0 | $ | 63.9 | ||||||||||||
| Goodwill |
1,088.3 | 1,023.4 | 1,029.9 | 906.1 | 848.9 | 1,071.0 | ||||||||||||||||||
| Total assets |
3,091.0 | 3,056.8 | 3,139.0 | 2,831.2 | 2,727.4 | 3,131.8 | ||||||||||||||||||
| Long-term debt, including current portion and other short-term borrowing |
2,701.2 | 2,691.6 | 2,683.5 | 2,346.6 | 2,268.9 | 2,345.8 | ||||||||||||||||||
| Total debt |
3,491.4 | 3,467.1 | 3,489.7 | 3,041.1 | 2,990.9 | 3,051.3 | ||||||||||||||||||
| Total equity (deficit) |
(400.4 | ) | (410.3 | ) | (350.7 | ) | (209.9 | ) | (263.5 | ) | (80.5 | ) | ||||||||||||
| Nine Months Ended March 31, |
Year Ended June 30, | |||||||||||||||||||||||||||
| 2014 | 2013 | 2013 | 2012 | 2011 | 2010 | 2009 | ||||||||||||||||||||||
| (dollars in millions) | ||||||||||||||||||||||||||||
| Other Financial Data: |
||||||||||||||||||||||||||||
| Capital expenditures |
$ | 62.0 | $ | 84.8 | $ | 122.5 | $ | 104.2 | $ | 87.3 | $ | 70.5 | $ | 75.9 | ||||||||||||||
| Net cash provided by/(used in) continuing operations: |
||||||||||||||||||||||||||||
| Operating activities |
95.2 | 84.4 | 139.1 | 87.7 | 111.6 | 231.5 | 62.2 | |||||||||||||||||||||
| Investing activities |
(114.7 | ) | (84.5 | ) | (122.1 | ) | (538.2 | ) | (83.3 | ) | (70.2 | ) | (74.0 | ) | ||||||||||||||
| Financing activities |
(36.3 | ) | (51.4 | ) | (49.3 | ) | 352.9 | (26.1 | ) | (56.7 | ) | 7.2 | ||||||||||||||||
| Net cash provided by/(used in) discontinued operations |
2.1 | (1.2 | ) | (1.4 | ) | 43.9 | 21.0 | 5.8 | 3.7 | |||||||||||||||||||
| Effect of foreign currency on cash |
$ | 3.0 | 1.2 | $ | 1.1 | $ | (12.4 | ) | $ | 17.9 | $ | (10.3 | ) | $ | (7.6 | ) | ||||||||||||
41
Table of Contents
MANAGEMENT’S DISCUSSION AND ANALYSIS OF FINANCIAL CONDITION
AND RESULTS OF OPERATIONS
The following discussion and analysis of our financial condition and results of operations should be read in conjunction with “Summary Historical Financial Data,” “Selected Financial Data” and our consolidated financial statements and related notes that appear elsewhere in this prospectus. In addition to historical consolidated financial information, the following discussion contains forward-looking statements that reflect our plans, estimates, and beliefs. Our actual results could differ materially from those discussed in the forward-looking statements. Factors that could cause or contribute to these differences include those discussed below and elsewhere in this prospectus, particularly in “Risk Factors.”
Overview
We are the leading global provider of advanced delivery technologies and development solutions for drugs, biologics and consumer health products. Our oral, injectable, and respiratory delivery technologies address the full diversity of the pharmaceutical industry including small molecules, large molecule biologics and consumer health products. Through our extensive capabilities and deep expertise in product development, we help our customers take products to market faster, including nearly half of new drug products approved by the FDA in the last decade. Our advanced delivery technology platforms, broad and deep intellectual property, and proven formulation, manufacturing and regulatory expertise enable our customers to develop more products and better treatments. Across both development and delivery, our commitment to reliably supply our customers’ needs is the foundation for the value we provide; annually, we produce more than 70 billion doses for nearly 7,000 customer products. We believe that through our investments in growth-enabling capacity and capabilities, our ongoing focus on operational and quality excellence, the sales of existing customer products, the introduction of new customer products, our patents and innovation activities, and our entry into new markets, we will continue to benefit from attractive and differentiated margins, and realize the growth potential from these areas.
For financial reporting purposes, we present three distinct financial reporting segments based on criteria established by U.S. GAAP: Oral Technologies, Medication Delivery Solutions and Development & Clinical Services. The Oral Technologies segment includes the Softgel Technologies and Modified Release Technologies businesses.
Oral Technologies
Our Oral Technologies segment provides advanced oral delivery technologies, including formulation, development and manufacturing of oral dose forms for prescription and consumer health products across all phases of a molecule’s lifecycle. These oral dose forms include softgel, modified release technologies and immediate release solid oral products. At certain facilities we also provide integrated primary packaging services for the products we manufacture. In fiscal 2013, we generated approximately $850 million in revenue from our softgel products and approximately $370 million in revenue from our MRT products.
Through our Softgel Technologies business, we provide formulation, development and manufacturing services for soft gelatin capsules, or “softgels”, which we first commercialized in the 1930s and have continually enhanced. We are the market leader in overall softgel manufacturing, and hold the leading market position in the prescription arena. Our principal softgel technologies include traditional softgel capsules (in which the shell is made from animal-derived materials) and VegiCaps and OptiShell capsules (in which the shell is made from vegetable-derived materials), which are used in a broad range of customer products, including prescription drugs, over-the-counter medications, and vitamins and supplements. Softgel capsules encapsulate liquid, paste or oil-based active compounds in solution or suspension within an outer shell, filling and sealing the capsule simultaneously. We perform all encapsulation within one of our softgel facilities, with active ingredients provided by customers or sourced directly by us. Softgels have historically been used to solve formulation challenges or technical issues for a specific drug, to help improve the clinical performance of compounds, to
42
Table of Contents
provide important market differentiation, particularly for over-the-counter compounds, and to provide safe handling of hormonal, potent and cytotoxic drugs. We also participate in the softgel vitamin, mineral and supplement business in selected regions around the world. With the 2001 introduction of our vegetable-derived softgel shell, VegiCaps capsules, consumer health manufacturers have been able to extend the softgel dose form to a broader range of active ingredients and serve patient/consumer populations that were previously inaccessible due to religious, dietary or cultural preferences. In recent years this platform has been extended to pharmaceutical active ingredients via the OptiShell platform. Our VegiCaps and OptiShell capsules are patent protected in most major global markets. Physician and patient studies we have conducted have demonstrated a preference for softgels versus traditional tablet and hard capsule dose forms in terms of ease of swallowing, real or perceived speed of delivery, ability to remove or eliminate unpleasant odor or taste and, for physicians, perceived improved patient adherence with dosing regimens.
Through our Modified Release Technologies business we provide formulation, development and manufacturing services for fast-dissolve tablets and both proprietary and conventional controlled release products. We launched our orally dissolving tablet business in 1986 with the introduction of Zydis tablets, a unique oral dosage form that is freeze-dried in its package, can be swallowed without water, and typically dissolves in the mouth in less than three seconds. Most often used for indications, drugs and patient groups that can benefit from rapid oral disintegration, the Zydis technology is utilized in a wide range of products and indications, including treatments for a variety of central nervous system-related conditions such as migraines, Parkinsons’ Disease, schizophrenia, and pain relief. Zydis tablets continue to be used in new ways by our customers as we extend the application of the technology to new categories, such as for immunotherapies, vaccines and biologics delivery. More recently we have added three new technology platforms to the Modified Release Technologies business portfolio, including the highly flexible OptiDose tab-in-tab technology, already commercially proven in Japan; the OptiMelt hot melt extrusion technology; and the development stage LyoPan oral dissolving tablet technology. We plan to continue to expand the development pipeline of customer products for all of our Modified Release technologies. Representative Oral Technologies business customers include Pfizer, Novartis, Merck, GlaxoSmithKline, Eli Lilly, Johnson & Johnson and Actavis.
We have fourteen Oral Technologies facilities in nine countries, including three in North America, five in Europe, three in South America and two in the Asia-Pacific region. Our Oral Technologies segment represented approximately 66% of total net revenue for fiscal 2013 on a combined basis before inter-segment eliminations.
Medication Delivery Solutions
Our Medication Delivery Solutions segment provides formulation, development and manufacturing services for delivery of drugs and biologics, administered via injection, inhalation and ophthalmic routes, using both traditional and advanced technologies. Our range of injectable manufacturing offerings includes filling drugs or biologics into pre-filled syringes, with flexibility to accommodate other formats within our existing network, focused increasingly on complex pharmaceuticals and biologics. With our range of technologies we are able to meet a wide range of specifications, timelines and budgets. The complexity of the manufacturing process, the importance of experience and know-how, regulatory compliance, and high start-up capital requirements create significant barriers to entry and, as a result, limit the number of competitors in the market. For example, blow-fill-seal is an advanced aseptic processing technology which uses a continuous process to form, fill with drug, and seal a plastic container in a sterile environment. Blow-fill-seal units are currently used for a variety of pharmaceuticals in liquid form, such as respiratory, ophthalmic and otic products. We are a leader in the outsourced blow-fill-seal market, and operate one of the largest capacity commercial manufacturing blow-fill-seal facilities in the world. Our sterile blow-fill-seal manufacturing has significant capacity and flexibility of manufacturing configurations. This business provides flexible and scalable solutions for unit-dose delivery of complex formulations such as suspensions and emulsions, products that are temperature, light and/or oxygen-sensitive. We also provide as well as innovative design and engineering container design and manufacturing solutions related to complex container design and manufacturing. Our regulatory expertise can lead to decreased time to commercialization, and our dedicated development production lines support feasibility, stability and
43
Table of Contents
clinical runs. We plan to continue to expand our product line in existing and new markets, and in higher margin specialty products with additional respiratory, ophthalmic, injectable and nasal applications. Representative customers include Pfizer, Sanofi-Aventis, Novartis, Roche and Teva.
Our biologics offerings include our formulation development and cell-line manufacturing based on our advanced and patented Gene Product Expression (“GPEx”) technology, which is used to develop stable, high-yielding mammalian cell lines for both innovator and bio-similar biologic compounds. Our GPEx technology can provide rapid cell line development, high biologics production yields, flexibility and versatility. We believe our development stage SMARTag next-generation antibody-drug conjugate technology will provide more precision targeting for delivery of drugs to tumors or other locations, with improved safety versus existing technologies. In fiscal 2013, we launched our recently completed biologics facility in Madison, Wisconsin, with expanded capability and capacity to produce clinical scale biologic supplies; combined with offerings from other businesses of Catalent and external partners, we now provide the broadest range of technologies and services supporting the development and launch of new biologic entities, biosimilars or biobetters to bring a product from gene to market commercialization, faster.
We have four Medication Delivery Solutions manufacturing facilities, including two in North America and two in Europe. Our Medication Delivery Solutions segment represented approximately 13% of total net revenue for fiscal 2013 on a combined basis before inter-segment eliminations.
Development and Clinical Services
Our Development and Clinical Services segment provides manufacturing, packaging, storage and inventory management for drugs and biologics in clinical trials. We offer customers flexible solutions for clinical supplies production, and provide distribution and inventory management support for both simple and complex clinical trials. This includes dose form manufacturing or over-encapsulation where needed; supplying placebos, comparator drug procurement and clinical packages and kits for physicians and patients; inventory management; investigator kit ordering and fulfillment; and return supply reconciliation and reporting. We support trials in all regions of the world through our facilities and distribution network. In fiscal 2012, we substantially expanded this business via our acquisition of the clinical trial supplies (CTS) business of Aptuit in February 2012 (see Note 2 to our audited consolidated financial statements included elsewhere in this prospectus for further discussion).
We also offer analytical chemical and cell-based testing and scientific services, stability testing, respiratory products formulation and manufacturing, regulatory consulting, and bioanalytical testing for biologic products. Our respiratory product capabilities include development and manufacturing services for inhaled products for delivery via metered dose inhalers, dry powder inhalers and nasal sprays. We also provide formulation development and clinical and commercial manufacturing for conventional and specialty oral dose forms. We provide global regulatory and clinical support services for our customers’ regulatory and clinical strategies during all stages of development. Demand for our offerings is driven by the need for scientific expertise and depth and breadth of services offered, as well as by the reliable supply thereof, including quality, execution and performance. We have nine Development and Clinical Services facilities, including three in North America, four in Europe and two in the Asia Pacific region. Our Development & Clinical Services segment represented approximately 22% of total net revenue for fiscal 2013 on a combined basis before inter-segment eliminations.
Factors Affecting our Performance
Fluctuations in Operating Results
Our financial reporting periods operate on a June 30 fiscal year end. Our revenue and net earnings are generally higher in our third and fourth quarters of each fiscal year. These fluctuations are primarily the result of the timing of our, and our customers’, annual operational maintenance periods at locations in Europe and the
44
Table of Contents
United Kingdom, the seasonality associated with pharmaceutical and biotechnology budgetary spending decisions, clinical trial and research and development schedules and, to a lesser extent, the time of the year some of our customers’ products are in higher demand.
Acquisition and Related Integration Efforts
Our growth and profitability are impacted by the acquisitions we are able to complete and the speed at which we integrate those acquisitions into our existing operating platforms. Since January 1, 2012, we have completed five acquisitions, the largest of which was the February 2012 purchase of the Aptuit CTS business. Since that acquisition, we have consolidated one operation in December 2012 and recently completed the consolidation of a second operation in December 2013. In addition, in February 2012, we acquired the remaining 49% ownership interest in our German softgel joint venture with Gelita in pursuit of synergies related to market penetration and cost in February 2012. Our more recent joint venture in China commenced in June 2013 and the acquisitions in China and Brazil, completed in the first and second quarter of fiscal 2014 are progressing as planned.
Foreign Exchange Rates
Significant portions of our revenues and costs are affected by changes in foreign exchange rates. Our operating network is global and, as a result, our revenues are influenced by changes in foreign exchange rates. In fiscal 2013, approximately 62% of our revenue was generated from our operations outside the United States. Much of the revenue generated outside the United States and many of the expenses associated with our operations outside the United States are denominated in currencies other than the U.S. dollar, particularly the British pound, the Euro, the Brazilian real, the Argentine peso, the Japanese yen and the Australian dollar. Changes in those currencies relative to the U.S. dollar will impact our revenues and expenses. Exchange rate fluctuations may also affect our compensation and other operating expenses due to foreign currency inflation.
Components of our Revenue, Costs and Expenses
Revenue
We sell products and services directly to our pharmaceutical, biotechnology and consumer health customers. The majority of our business is conducted through supply or development agreements. Contractual provisions, which may include pricing, are sometimes adjusted through arm’s-length negotiations with customers in the course of renewing a contract. Our revenue is charged on a price-per-unit or service basis and is recognized either upon shipment or delivery of the product or service. Revenue generated from research and development arrangements are generally priced by project and are recognized either upon completion of the required service or achievement of a specified project phase or milestone. The broad capabilities we have to serve our customers provides us limited concentration risk with no customer exceeding 10% and no single product generating more than 3% of revenue.
Costs and Expenses
Cost of sales consists of direct costs incurred to manufacture products and costs associated with supplying other revenue-generating services. Cost of sales includes labor costs for employees involved in the production process and the cost of raw materials and components used in the process or product. Cost of sales also includes labor costs of employees supporting the production process, such as production management, quality, engineering, and other support services. Other costs in this category include the external research and development costs, depreciation of fixed assets used in the manufacturing process, utility costs, freight, operating lease expenses and other general manufacturing expenses.
Selling, general and administration expenses consist of all expenditures incurred in connection with the sales and marketing of our products, as well as administrative expenses to support our businesses. The category includes salaries and related benefit costs of employees supporting sales and marketing, finance, human
45
Table of Contents
resources, information technology, research and development costs and costs related to executive management. Other costs in this category include depreciation of other fixed assets, amortization of our intangible assets, professional fees, marketing and other expenses to support selling and administrative areas.
Trends Affecting Our Business
Industry
We participate in nearly every sector of the $800 billion annual revenue global pharmaceutical industry, including but not limited to the prescription drug and biologic sectors, as well as consumer health, which includes the over-the-counter and vitamins and nutritional supplement sectors. Innovative pharmaceuticals continue to play a critical role in the global market, while generic drug share is increasing in both developed and developing markets. Sustained developed market demand and rapid growth in emerging economies is driving the consumer health product growth rate to more than double that for pharmaceuticals. Payors, both public and private, have sought to limit the economic impact of such demand through greater use of generic drugs, access and spending controls and health technology assessment techniques, favoring products which deliver truly differentiated outcomes.
New Molecule Development and R&D Sourcing
Continued strengthening in early stage development pipelines for drugs and biologics, compounded by increasing clinical trial breadth and complexity, sustain our belief in the attractive growth prospects for development solutions. Large companies are in many cases reconfiguring their R&D resources, increasingly involving the appointment of strategic partners for key outsourced functions. Additionally, an increasing portion of compounds in development are from companies who less frequently have full R&D infrastructure, and thus are more likely to need strategic development solutions partners.
Demographics
Aging population demographics in developed countries, combined with health care reforms in many global markets which are expanding access to treatments to a greater proportion of their populations, will continue to drive increases in demand for both pharmaceutical and consumer health product volumes. Increasing economic affluence in key developing regions will further increase demand for health care treatments, and we are taking active steps to allow us to participate effectively in these key growth regions and product categories.
Finally, we believe the market access and payor pressures our customers face, global supply chain complexity, and the increasing demand for improved of treatments will continue to escalate the need for product differentiation, improved outcomes and treatment cost reduction, all of which can often be addressed using our advanced delivery technologies.
Key Performance Metrics
Use of EBITDA from continuing operations and Adjusted EBITDA
Management measures operating performance based on consolidated earnings from continuing operations before interest expense, expense/(benefit) for income taxes and depreciation and amortization and is adjusted for the income or loss attributable to noncontrolling interest (“EBITDA from continuing operations”). EBITDA from continuing operations is not defined under U.S. GAAP and is not a measure of operating income, operating performance or liquidity presented in accordance with U.S. GAAP and is subject to important limitations.
We believe that the presentation of EBITDA from continuing operations enhances an investor’s understanding of our financial performance. We believe this measure is a useful financial metric to assess our operating performance from period to period by excluding certain items that we believe are not representative of our core business and use this measure for business planning purposes. In addition, given the significant
46
Table of Contents
investments that we have made in the past in property, plant and equipment, depreciation and amortization expenses represent a meaningful portion of our cost structure. We believe that EBITDA from continuing operations will provide investors with a useful tool for assessing the comparability between periods of our ability to generate cash from operations sufficient to pay taxes, to service debt and to undertake capital expenditures because it eliminates depreciation and amortization expense. We present EBITDA from continuing operations in order to provide supplemental information that we consider relevant for the readers of our consolidated financial statements included elsewhere in this prospectus, and such information is not meant to replace or supersede U.S. GAAP measures. Our definition of EBITDA from continuing operations may not be the same as similarly titled measures used by other companies.
In addition, we evaluate the performance of our segments based on segment earnings before noncontrolling interest, other (income)/expense, impairments, restructuring costs, interest expense, income tax expense/(benefit), and depreciation and amortization (“Segment EBITDA”).
Under the indentures governing our existing notes, the senior unsecured term loan facility, and the credit agreement governing the senior unsecured term loan facility, our ability to engage in certain activities such as incurring certain additional indebtedness, making certain investments and paying certain dividends is tied to ratios based on Adjusted EBITDA (which is defined as “EBITDA” in the indentures and the credit agreement governing the senior unsecured term loan facility). Adjusted EBITDA is based on the definitions in our indentures and the credit agreement governing the senior unsecured term loan facility, is not defined under U.S. GAAP, and is subject to important limitations. We have included the calculations of Adjusted EBITDA for the periods presented. Adjusted EBITDA is the covenant compliance measure used in certain covenants under the indentures governing the notes and the credit agreement governing the senior unsecured term loan facility, particularly those governing debt incurrence and restricted payments. Because not all companies use identical calculations, our presentation of Adjusted EBITDA may not be comparable to other similarly titled measures of other companies.
The most directly comparable GAAP measure to EBITDA from continuing operations and Adjusted EBITDA is earnings/(loss) from continuing operations. For a reconciliation of Adjusted EBITDA to net income, see “Summary—Summary Financial Data.”
Adjusted Net Income
Management also measures operating performance based on Adjusted Net Income/(loss). Adjusted Net Income/(loss) is not defined under U.S. GAAP and is not a measure of operating income, operating performance or liquidity presented in accordance with U.S. GAAP and is subject to important limitations. For example, Adjusted Net Income excludes our non-cash tax expense and does not reflect the impact on earnings resulting from certain other items.
We believe that the presentation of Adjusted Net Income/(loss) enhances an investor’s understanding of our financial performance. We believe this measure is a useful financial metric to assess our operating performance from period to period by excluding certain items that we believe are not representative of our core business and we use this measure for business planning purposes. We define Adjusted Net Income/(loss) as net earnings/(loss) adjusted for (1) earnings or loss of discontinued operations, net of tax, (2) tax expense or income which is not cash, (3) amortization attributable to purchase accounting and (4) income or loss from non-controlling interest in our majority-owned operations. We also make adjustments for other cash and non-cash items included in the table below, partially offset by our estimate of the cash taxes saved as a result of such cash and non-cash items. We believe that Adjusted Net Income/(loss) will provide investors with a useful tool for assessing the comparability between periods of our ability to generate cash from operations available to our stockholders.
We present Adjusted Net Income/(loss) in order to provide supplemental information that we consider relevant for the readers of our consolidated financial statements included elsewhere in this prospectus, and such information is not meant to replace or supersede U.S. GAAP measures. Our definition of Adjusted Net Income/(loss) may not be the same as similarly titled measures used by other companies.
47
Table of Contents
A reconciliation of net income, the most directly comparable U.S. GAAP measure, to Adjusted Net Income is as follows:
| Nine Months Ended March 31, |
Year Ended June 30, | |||||||||||||||||||
| 2014 | 2013 | 2013 | 2012 | 2011 | ||||||||||||||||
| (in millions) | ||||||||||||||||||||
| Net earnings/(loss) |
$ | (11.8) | $ | (65.9) | $ | (46.8) | $ | (39.2) | $ | (50.1) | ||||||||||
| (Earnings)/loss from discontinued operations, net of tax |
2.7 | 4.9 | (1.2) | 41.3 | 21.0 | |||||||||||||||
|
|
|
|
|
|
|
|
|
|
|
|||||||||||
| Earnings/(loss) from continuing operations |
(9.1) | (61.0) | (48.0) | 2.1 | (29.1) | |||||||||||||||
| Amortization(1) |
31.7 | 32.2 | 43.4 | 34.0 | 28.8 | |||||||||||||||
| Non-cash income tax (benefit)/expense(2) |
9.8 | (4.4) | 9.9 | (7.4) | 3.1 | |||||||||||||||
| Net earnings/loss attributable to noncontrolling interest, net of tax |
0.8 | — | 0.1 | (1.2) | (3.9) | |||||||||||||||
| Equity compensation(3) |
3.4 | 2.2 | 2.8 | 3.7 | 3.9 | |||||||||||||||
| Impairment charges and (gain)/loss on sale of assets(4) |
0.4 | 4.6 | 5.2 | 1.8 | 3.6 | |||||||||||||||
| Financing related expenses(5) |
0.1 | 11.2 | 16.9 | — | — | |||||||||||||||
| U.S. GAAP Restructuring(6) |
11.9 | 12.7 | 18.4 | 19.5 | 12.5 | |||||||||||||||
| Acquisition, integration and other special items(7) |
9.2 | 12.8 | 15.5 | 33.1 | 14.4 | |||||||||||||||
| Property and casualty (gains)/losses, net(8) |
— | — | — | (8.8) | 11.6 | |||||||||||||||
| Foreign Exchange loss (gain)/ (included in other (income)/expense, net)(9) |
0.3 | 10.5 | 5.7 | (4.6) | 25.5 | |||||||||||||||
| Other adjustments(10) |
(0.1) | 0.6 | 4.2 | 1.4 | — | |||||||||||||||
| Sponsor advisory fee(11) |
9.7 | 9.4 | 12.4 | 11.9 | 10.6 | |||||||||||||||
| Estimated cash tax (savings)/expense attributable to reconciling items(12) |
(2.7) | (3.0) | (4.1) | (4.3) | (7.1) | |||||||||||||||
|
|
|
|
|
|
|
|
|
|
|
|||||||||||
| Adjusted Net Income/(loss) |
$ | 65.4 | $ | 27.8 | $ | 82.4 | $ | 81.2 | $ | 73.9 | ||||||||||
| (1) | Represents the amortization attributable to purchase accounting for previously completed business combinations. |
| (2) | Represents the amount of income tax-related (benefit)/expense recorded within our net earnings/(loss) which does not result in cash payment or receipt. |
| (3) | Reflects non-cash stock-based compensation expense under the provisions of ASC 718 Compensation Stock Compensation. |
| (4) | Reflects non-cash asset impairment charges and losses from the sale of assets not included in restructuring and other special items discussed below. |
| (5) | Reflects the expense associated with refinancing activities undertaken by the Company during the period. |
| (6) | Reflects U.S. GAAP restructuring charges which were primarily attributable to activities which focus on various aspects of operations, including consolidating certain operations, rationalizing headcount and aligning operations in a more strategic and cost-efficient structure to optimize our business. |
| (7) | Primarily reflects acquisition and integration related costs. |
| (8) | Primarily reflects property and casualty (gains)/losses resulting from fire damage to a U.K. packaging services operation and the associated insurance reimbursements. |
| (9) | Represents unrealized foreign currency exchange rate (gains)/losses primarily driven by inter-company loans denominated in a currency different from the functional currency of either the borrower or the lender. The foreign exchange adjustment is also impacted by the exclusion of realized foreign currency exchange rate (gains)/losses from the non-cash and cash settlement of inter-company loans. Inter-company loans are between Catalent entities and do not reflect the ongoing results of our trade operations. |
48
Table of Contents
| (10) | Reflects certain other adjustments made pursuant to the definition of “EBITDA” under our indentures and credit agreements. |
| (11) | Represents amount of sponsor advisory fee, which will be terminated following the offering. See “Certain Relationships and Related Party Transactions—Transaction and Advisory Fee Agreement.” |
| (12) | Represents the estimated cash tax impact of certain items recorded in each period that are added back in the calculation of Adjusted Net Income/(loss). The estimate is determined by applying the statutory tax rate in tax paying jurisdictions to income or expense items which impact cash taxes paid. Generally, amortization attributable to purchase accounting, unrealized gains/losses due to foreign currency translation and non-cash equity compensation do not impact cash taxes. |
Use of Constant Currency
As exchange rates are an important factor in understanding period-to-period comparisons, we believe the presentation of results on a constant currency basis in addition to reported results helps improve investors’ ability to understand our operating results and evaluate our performance in comparison to prior periods. Constant currency information compares results between periods as if exchange rates had remained constant period-over-period. We use results on a constant currency basis as one measure to evaluate our performance. We calculate constant currency by calculating current-year results using prior-year foreign currency exchange rates. We generally refer to such amounts calculated on a constant currency basis as excluding the impact of foreign exchange. These results should be considered in addition to, not as a substitute for, results reported in accordance with U.S. GAAP. Results on a constant currency basis, as we present them, may not be comparable to similarly titled measures used by other companies and are not measures of performance presented in accordance with U.S. GAAP.
Results of Operations
Nine Months Ended March 31, 2014 compared to the Nine Months Ended March 31, 2013
| Nine Months Ended March 31, |
Increase/(Decrease) | |||||||||||||||
| (Dollars in millions) |
2014 | 2013 | Change $ | Change % | ||||||||||||
| Net revenue |
$ | 1,308.1 | $ | 1,295.1 | $ | 13.0 | 1 | % | ||||||||
| Cost of sales |
899.8 | 900.2 | (0.4 | ) | * | |||||||||||
|
|
|
|
|
|||||||||||||
| Gross margin |
408.3 | 394.9 | 13.4 | 3 | % | |||||||||||
| Selling, general and administrative expense |
256.2 | 251.7 | 4.5 | 2 | % | |||||||||||
| Impairment charges and (gain)/loss on sale of assets |
0.4 | 4.6 | (4.2 | ) | (91 | )% | ||||||||||
| Restructuring and other |
11.9 | 12.7 | (0.8 | ) | (6 | )% | ||||||||||
|
|
|
|
|
|||||||||||||
| Operating earnings/(loss) |
139.8 | 125.9 | 13.9 | 11 | % | |||||||||||
| Interest expense, net |
122.8 | 160.7 | (37.9 | ) | (24 | )% | ||||||||||
| Other (income)/expense, net |
2.8 | 20.3 | (17.5 | ) | (86 | )% | ||||||||||
|
|
|
|
|
|||||||||||||
| Earnings/(loss) from continuing operations, before income taxes |
14.2 | (55.1 | ) | 69.3 | * | |||||||||||
| Income tax expense/(benefit) |
23.3 | 5.9 | 17.4 | * | ||||||||||||
|
|
|
|
|
|||||||||||||
| Earnings/(loss) from continuing operations |
(9.1 | ) | (61.0 | ) | 51.9 | (85 | )% | |||||||||
| Net earnings/(loss) from discontinued operations, net of tax |
(2.7 | ) | (4.9 | ) | 2.2 | * | ||||||||||
|
|
|
|
|
|||||||||||||
| Net earnings/(loss) |
(11.8 | ) | (65.9 | ) | 54.1 | (82 | )% | |||||||||
| Net earnings/(loss) attributable to noncontrolling interest |
(0.8 | ) | — | (0.8 | ) | * | ||||||||||
|
|
|
|
|
|||||||||||||
| Net earnings/(loss) attributable to Catalent |
$ | (11.0 | ) | $ | (65.9 | ) | $ | 54.9 | (83 | )% | ||||||
|
|
|
|
|
|||||||||||||
| * | Percentage not meaningful |
49
Table of Contents
Net Revenue
Net revenue increased $13.0 million, or 1%, for the nine months ended March 31, 2014. Excluding the unfavorable impact from foreign exchange fluctuation of $5.3 million, or less than 1%, net revenue increased by $18.3 million, or 1%, as compared to the nine months ended March 31, 2013. The increase was primarily driven by increased demand in our Medication Delivery Solutions segment and our Development and Clinical Services segment, partially offset by lower volume within our Oral Technologies segment.
Gross Margin
Gross margin increased $13.4 million, or 3%, for the nine months ended March 31, 2014. Excluding the unfavorable impact from foreign exchange fluctuation of $2.3 million, or 1%, gross margin increased by $15.7 million, as compared to the nine months ended March 31, 2013. The increase in gross margin was primarily due to a favorable shift in revenue mix within our Medication Delivery Solutions segment and within our softgel business within our Oral Technologies segment, partially offset by unfavorable revenue mix within our Development and Clinical Services segment and decreased sales in our modified release technologies business within our Oral Technologies segment.
Selling, General and Administrative Expense
Selling, general and administrative expense increased $4.5 million, or 2%, for the nine months ended March 31, 2014. Excluding the impact from foreign exchange fluctuation of $0.7 million, or less than 1%, selling, general and administrative expense increased by $5.2 million, as compared to the nine months ended March 31, 2013, primarily due to employee compensation costs driven by inflationary increases, partially offset by decreased integration costs related to the acquisition of the Aptuit CTS business and decreased amortization and depreciation expense.
Restructuring and Other
Restructuring and other charges of $11.9 million for the nine months ended March 31, 2014 decreased by $0.8 million, or 6%, compared to the nine months ended March 31, 2013. The prior period charges primarily related to headcount reduction within our Oral Technology segment during the nine months ended March 31, 2013. The nine months ended March 31, 2014 included restructuring initiatives across several of our operations which were enacted to improve cost efficiency, including the consolidation of our Allendale clinical services operation into our Philadelphia location and employee related severance expenses.
Interest Expense, net
Interest expense, net of $122.8 million for the nine months ended March 31, 2014 decreased by $37.9 million, or 24%, compared to nine months ended March 31, 2013, primarily driven by the absence of interest rate swaps in the current period coupled with a lower average interest rate as a result of our debt refinancing activity which occurred in fiscal 2013.
Other (Income)/Expense, net
Other expense, net of $2.8 million for the nine months ended March 31, 2014 changed from a net expense of $20.3 million in the nine months ended March 31, 2013. Other expense, net for the nine months ended March 31, 2013 was primarily driven by expenses related to the October 2012 redemption of our Senior Toggle Notes, which included the call premium and the write off of unamortized deferred financing fees. Other expense, net of $2.8 million for the nine months ended March 31, 2014 was primarily driven by non-cash unrealized gains related to foreign currency translation partially offset by realized losses related to foreign currency translation.
50
Table of Contents
Provision/(Benefit) for Income Taxes
Our provision for income taxes for the nine months ended March 31, 2014 was $23.3 million relative to earnings before income taxes of $14.2 million. Our provision for income taxes for the nine months ended March 31, 2013 was $5.9 million relative to losses before income taxes of $55.1 million. The income tax provision for the current period is not comparable to the same period of the prior year due to changes in pretax income over many jurisdictions and the impact of discrete items. Generally, fluctuations in the effective tax rate are primarily due to changes in our geographic pretax income resulting from our business mix and changes in the tax impact of permanent differences, restructuring, other special items and other discrete tax items, which may have unique tax implications depending on the nature of the item. Our effective tax rate at March 31, 2014 reflects an increase in a tax reserve related to the potential disallowance of certain tax benefits in the United Kingdom, partially offset by a deferred tax benefit resulting from a reduction in the United Kingdom statutory tax rate during the first quarter of fiscal 2014 and benefits derived from operations outside the United States, which are generally taxed at lower rates than the U.S. statutory rate of 35%.
Segment Review
Our results on a segment basis for the nine months ended March 31, 2014 compared to the nine months ended March 31, 2013 are as follows:
| Nine Months Ended March 31, |
Increase/(Decrease) | |||||||||||||||
| (Dollars in millions) |
2014 | 2013 | Change $ | Change % | ||||||||||||
| Oral Technologies |
||||||||||||||||
| Net revenue |
$ | 832.0 | $ | 853.0 | $ | (21.0 | ) | (2 | )% | |||||||
| Segment EBITDA |
211.2 | 214.9 | (3.7 | ) | (2 | )% | ||||||||||
| Medication Delivery Solutions |
||||||||||||||||
| Net revenue |
177.2 | 151.2 | 26.0 | 17 | % | |||||||||||
| Segment EBITDA |
30.9 | 17.1 | 13.8 | 81 | % | |||||||||||
| Development and Clinical Services |
||||||||||||||||
| Net revenue |
306.8 | 298.1 | 8.7 | 3 | % | |||||||||||
| Segment EBITDA |
57.2 | 55.5 | 1.7 | 3 | % | |||||||||||
| Inter-segment revenue elimination |
(7.9 | ) | (7.2 | ) | (0.7 | ) | (10 | )% | ||||||||
| Unallocated Costs(1) |
(52.6 | ) | (67.0 | ) | 14.4 | 21 | % | |||||||||
| Combined Total |
||||||||||||||||
|
|
|
|
|
|||||||||||||
| Net revenue |
$ | 1,308.1 | $ | 1,295.1 | $ | 13.0 | 1 | % | ||||||||
|
|
|
|
|
|||||||||||||
| EBITDA from continuing operations |
$ | 246.7 | $ | 220.5 | $ | 26.2 | 12 | % | ||||||||
|
|
|
|
|
|||||||||||||
| * | Percentage not meaningful |
| (1) | Unallocated costs includes equity-based compensation, impairment charges, certain other corporate directed costs, and other costs that are not allocated to the segments as follows: |
| Nine Months Ended March 31, |
||||||||
| (Dollars in millions) |
2014 | 2013 | ||||||
| Impairment charges and gain/(loss) on sale of assets |
$ | (0.4 | ) | $ | (4.6 | ) | ||
| Equity compensation |
(3.4 | ) | (2.2 | ) | ||||
| Restructuring and other special items |
(20.9 | ) | (21.3 | ) | ||||
| Sponsor advisory fee |
(9.7 | ) | (9.4 | ) | ||||
| Noncontrolling interest |
0.8 | — | ||||||
| Other income/(expense)(2), net |
(2.8 | ) | (20.3 | ) | ||||
| Non-allocated corporate costs, net |
(16.2 | ) | (9.2 | ) | ||||
|
|
|
|
|
|||||
| Total unallocated costs |
$ | (52.6 | ) | $ | (67.0 | ) | ||
|
|
|
|
|
|||||
51
Table of Contents
| (2) | Primarily relates to realized and unrealized gains/(losses) related to foreign currency translation and expenses related to financing transactions during the period. |
For a reconciliation of EBITDA from continuing operations to earnings/loss from continuing operations, see “Summary—Summary Financial Data.”
Oral Technologies segment
Net revenue decreased by $21.0 million, or 2%, for the nine months ended March 31, 2014. Excluding the unfavorable impact from foreign exchange fluctuation of $12.7 million, or 1%, Oral Technologies’ net revenue decreased $8.3 million, or 1%. The decrease is primarily due to decreased sales of approximately $24 million, or 3% within our modified release technologies business and is attributable to the prior year period including approximately $31 million of packaging services related revenue. In June 2013 we wound down our U.K. packaging services operation and no material revenue is included in the current year period. In addition, demand for our softgel offering increased approximately $16 million, or 2%, as compared to the nine months ended March 31, 2013.
Oral Technologies’ segment EBITDA decreased by $3.7 million, or 2%, for the nine months ended March 31, 2014. Excluding the unfavorable impact from foreign exchange fluctuation of $3.1 million, or 1%, Oral Technologies’ segment EBITDA decreased by $0.6 million, or less than 1%, as compared to the nine months ended March 31, 2013. The decrease was primarily driven by unfavorable mix in our softgel offering within the Oral Technologies segment.
Medication Delivery Solutions segment
Net revenue increased by $26.0 million, or 17%, for the nine months ended March 31, 2014. Excluding the favorable impact from foreign exchange fluctuation of $4.1 million, or 3%, Medication Delivery Solutions’ net revenue increased by $21.9 million, or 14%, as compared to the nine months ended March 31, 2013 primarily due to increased demand for injectable products at our European pre-filled syringe operations of approximately $20 million, or 13% as well as increased demand for products utilizing our blow-fill-seal technology platform of approximately $6 million, or 4%. These increases were partially offset by decreased demand for biologics services of approximately $5 million, or 3%.
Medication Delivery Solutions’ segment EBITDA increased by $13.8 million, or 81%, for the nine months ended March 31, 2014. Excluding the favorable impact from foreign exchange fluctuation of $0.6 million, or 4%, Medication Delivery Solutions’ segment EBITDA increased by $13.2 million, or 77%, as compared to the nine months ended March 31, 2013. The increase was primarily attributable to the increased demand for injectable and blow-fill-seal products as noted above, partially offset by lower revenue from our biologics offerings as compared to a strong prior year period.
Development and Clinical Services segment
Net revenues increased by $8.7 million, or 3%, for the nine months ended March 31, 2014. Excluding the favorable impact from foreign exchange fluctuation of $3.3 million, or 1%, Development and Clinical Services’ net revenue increased by $5.4 million, or 2%, as compared to the nine months ended March 31, 2013 primarily due to increased demand from our analytical service operations of approximately $16 million, or 5%, and increased demand for manufacturing and packaging services in North America of approximately $2 million, or 1%, partially offset by decreased demand for manufacturing and packaging services in Europe of approximately $15 million, or 5%. As we consolidated two of our operations in pursuit of acquisition synergies, we experienced revenue declines due to the hesitancy of customers to renew or place new business while we transitioned customer clinical studies. We believe such fluctuations to be temporary in nature.
Development and Clinical Services’ segment EBITDA increased by $1.7 million, or 3%, for the nine months ended March 31, 2014. Excluding the favorable impact from foreign exchange fluctuation of $0.8 million, or 1%, Development and Clinical Services’ segment EBITDA increased by $0.9 million, or 2%, as
52
Table of Contents
compared to the nine months ended March 31, 2013, primarily due to increased demand and favorable revenue mix for analytical services, partially offset by decreased demand for manufacturing and packaging services.
Fiscal Year Ended June 30, 2013 compared to the Fiscal Year Ended June 30, 2012
Results for the fiscal year ended June 30, 2013 compared to the fiscal year ended June 30, 2012 were as follows:
| Fiscal Year Ended June 30, |
Increase/(Decrease) | |||||||||||||||
| (Dollars in millions) |
2013 | 2012 | Change $ | Change % | ||||||||||||
| Net revenue |
$ | 1,800.3 | $ | 1,694.8 | $ | 105.5 | 6 | % | ||||||||
| Cost of sales |
1,231.7 | 1,136.2 | 95.5 | 8 | % | |||||||||||
|
|
|
|
|
|||||||||||||
| Gross margin |
568.6 | 558.6 | 10.0 | 2 | % | |||||||||||
| Selling, general and administrative expenses |
340.6 | 348.1 | (7.5 | ) | (2 | )% | ||||||||||
| Impairment charges and (gain)/loss on sale of assets |
5.2 | 1.8 | 3.4 | * | ||||||||||||
| Restructuring and other |
18.4 | 19.5 | (1.1 | ) | (6 | )% | ||||||||||
| Property and casualty (gain)/loss, net |
— | (8.8 | ) | 8.8 | * | |||||||||||
|
|
|
|
|
|||||||||||||
| Operating earnings/(loss) |
204.4 | 198.0 | 6.4 | 3 | % | |||||||||||
| Interest expense, net |
203.2 | 183.2 | 20.0 | 11 | % | |||||||||||
| Other (income)/expense, net |
25.1 | (3.8 | ) | 28.9 | * | |||||||||||
|
|
|
|
|
|||||||||||||
| Earnings/(loss) from continuing operations before income taxes |
(23.9 | ) | 18.6 | (42.5 | ) | * | ||||||||||
| Income tax expense/(benefit) |
24.1 | 16.5 | 7.6 | 46 | % | |||||||||||
|
|
|
|
|
|||||||||||||
| Earnings/(loss) from continuing operations |
(48.0 | ) | 2.1 | (50.1 | ) | * | ||||||||||
| Net earnings/(loss) from discontinued operations, net of tax |
1.2 | (41.3 | ) | 42.5 | * | |||||||||||
|
|
|
|
|
|||||||||||||
| Net earnings/(loss) |
(46.8 | ) | (39.2 | ) | (7.6 | ) | 19 | % | ||||||||
| Less: Net earnings/(loss) attributable to noncontrolling interest, net of tax |
(0.1 | ) | 1.2 | (1.3 | ) | * | ||||||||||
|
|
|
|
|
|||||||||||||
| Net earnings/(loss) attributable to Catalent |
$ | (46.7 | ) | $ | (40.4 | ) | $ | (6.3 | ) | 16 | % | |||||
|
|
|
|
|
|||||||||||||
| * | Percentage not meaningful |
Net Revenue
Net revenue increased $105.5 million, or 6%, in fiscal 2013 compared to fiscal 2012. Excluding the unfavorable impact from foreign exchange fluctuation of $35.5 million, or 2%, net revenue increased by $141.0 million, or 8%, as compared to fiscal 2012. The increase was primarily due to the inclusion of a full year of revenue from the acquired Aptuit CTS business within our Development and Clinical Services segment, partially offset by volume declines within our Zydis technology platform and the impact of reduced revenues from certain customers within our softgel business in our Oral Technologies segment as a result of switching to lower priced, but longer term, arrangements.
Gross Margin
Gross margin increased $10.0 million, or 2%, in fiscal 2013 compared to fiscal 2012. Excluding the unfavorable impact from foreign exchange fluctuation of $10.6 million, or 2%, gross margin increased by $20.6 million, or approximately 4%, as compared to fiscal 2012. This increase in gross margin was due to the revenue generated by the acquired Aptuit CTS business within Development and Clinical Services and research and development profit participation revenue recorded within the Oral Technologies segment. These gross margin increases were partially offset by unfavorable product mix and volume declines in the Zydis technology platform in our Oral Technologies segment and within the Medication Delivery Solutions segments.
53
Table of Contents
Selling, General and Administrative Expense
Selling, general and administrative expense decreased $7.5 million, or 2%, in fiscal 2013 compared to fiscal 2012. Excluding the increase resulting from foreign exchange fluctuation of $3.4 million, or 1%, selling, general and administrative expense decreased by $4.1 million as compared to the same period a year ago. The decrease was primarily due to the absence of $15.0 million of transaction related costs associated with the Aptuit CTS business acquisition which was incurred in fiscal 2012, partially offset by increased depreciation and amortization and integration costs associated with the Aptuit CTS business acquisition.
Restructuring and Other
Restructuring and other charges decreased $1.1 million, or 6%, in fiscal 2013 compared to fiscal 2012. The fiscal 2013 charges related to restructuring initiatives across several of our operations, which were enacted to improve cost efficiency, including both site consolidation and employee related severance charges undertaken to achieve acquisition related synergies. The fiscal 2012 charges primarily related to consolidating and streamlining our manufacturing footprint and employee related charges resulting from organizational changes and workforce reductions to adjust the capacity of our workforce within our business units.
Interest Expense, net
Interest expense, net of $203.2 million increased by $20.0 million, or 11%, in fiscal 2013 compared to fiscal 2012. The increase was primarily the result of the full twelve month fiscal 2013 effect of the incremental term loan borrowing of $400.0 million used to finance the Aptuit CTS business acquisition, which closed during the third quarter of fiscal 2012, during which four months of interest expense was recognized. In addition, we recorded capital leases in the third quarter of fiscal 2012, for which a full year of interest expense has been incurred in fiscal 2013 compared to only four months in fiscal 2012.
Other (Income)/Expense, net
Other expense of $25.1 million increased by $28.9 million in fiscal 2013 compared to fiscal 2012. The increased expense was primarily driven by both cash and non-cash charges associated with financing related fees occurring during fiscal 2013 and by increased non-cash unrealized losses related to foreign currency translation on intercompany loans as compared to fiscal 2012.
Provision/(Benefit) for Income Taxes
Our provision for income taxes was $24.1 million in fiscal 2013 relative to our loss from continuing operations before income taxes of $23.9 million resulting in an income tax provision rate in excess of 100% due to the mix of profits and losses in various jurisdictions. Our provision for income taxes for the fiscal year ended June 30, 2012 was $16.5 million relative to earnings from continuing operations before income taxes of $18.6 million resulting in an income tax provision rate of 88.8%. Generally, fluctuations in the effective tax rate are primarily due to changes in our geographic pretax income resulting from our business mix and changes in the tax impact of permanent differences, restructuring, other special items and other discrete tax items, which may have unique tax implications depending on the nature of the item. Key drivers in permanent differences year over year include the reversal of intercompany dividend income which is not included for tax purposes, disallowed interest expense as well as a non-deductible asset impairment.
54
Table of Contents
Segment Review
Our results on a segment basis for the fiscal year ended June 30, 2013 compared to the fiscal year ended June 30, 2012 were as follows:
| Fiscal Year Ended June 30, |
Increase/(Decrease) | |||||||||||||||
| (Dollars in millions) |
2013 | 2012 | Change $ | Change % | ||||||||||||
| Oral Technologies |
||||||||||||||||
| Net revenue |
$ | 1,186.3 | $ | 1,220.2 | $ | (33.9 | ) | (3 | )% | |||||||
| Segment EBITDA |
315.7 | 334.6 | (18.9 | ) | (6 | )% | ||||||||||
| Medication Delivery Solutions |
||||||||||||||||
| Net revenue |
219.3 | 223.9 | (4.6 | ) | (2 | )% | ||||||||||
| Segment EBITDA |
31.5 | 27.5 | 4.0 | 15 | % | |||||||||||
| Development and Clinical Services |
||||||||||||||||
| Net revenue |
404.8 | 268.3 | 136.5 | 51 | % | |||||||||||
| Segment EBITDA |
75.0 | 53.0 | 22.0 | 42 | % | |||||||||||
| Inter-segment revenue elimination |
(10.1 | ) | (17.6 | ) | 7.5 | 43 | % | |||||||||
| Unallocated Costs(1) |
(90.6 | ) | (84.8 | ) | (5.8 | ) | 7 | % | ||||||||
| Combined Total |
||||||||||||||||
| Net revenue |
1,800.3 | 1,694.8 | 105.5 | 6 | % | |||||||||||
|
|
|
|
|
|||||||||||||
| EBITDA from continuing operations |
$ | 331.6 | $ | 330.3 | $ | 1.3 | * | |||||||||
| * | Percentage not meaningful |
| (1) | Unallocated costs includes equity-based compensation, impairment charges, certain other corporate directed costs, and other costs that are not allocated to the segments as follows: |
| Fiscal Year Ended June 30, |
||||||||
| (Dollars in millions) |
2013 | 2012 | ||||||
| Impairment charges and gain/(loss) on sale of assets |
$ | (5.2 | ) | $ | (1.8 | ) | ||
| Equity compensation |
(2.8 | ) | (3.7 | ) | ||||
| Restructuring and other special items(2) |
(29.0 | ) | (45.8 | ) | ||||
| Property and casualty losses |
— | 8.8 | ||||||
| Sponsor advisory fee |
(12.4 | ) | (11.8 | ) | ||||
| Noncontrolling interest |
0.1 | (1.2 | ) | |||||
| Other income/(expense), net(3) |
(25.1 | ) | 3.8 | |||||
| Non-allocated corporate costs, net |
(16.2 | ) | (33.1 | ) | ||||
|
|
|
|
|
|||||
| Total unallocated costs |
$ | (90.6 | ) | $ | (84.8 | ) | ||
| (2) | Segment results do not include restructuring and certain acquisition related costs |
| (3) | Primarily relates to realized and non-cash unrealized gains/(losses) related to foreign currency translation and expenses related to financing transactions during the period. |
For a reconciliation of EBITDA from continuing operations to earnings/loss from continuing operations, see “Summary—Summary Financial Data.”
Oral Technologies segment
Net revenue decreased by $33.9 million, or 3%, in fiscal 2013 as compared to the prior year. Excluding the unfavorable impact from foreign exchange fluctuation of $31.9 million, or 3%, Oral Technologies’ net revenue was relatively flat as compared to the same period a year ago. Excluding the impact of foreign exchange, revenue from our softgel offerings increased $21.3 million as research and development product participation revenue offset reduced revenues from certain customers as a result of switching to lower priced, but longer term, arrangements. These revenue increases were partially offset by lower revenue from our modified release
55
Table of Contents
technology offerings of approximately $20.4 million primarily attributable to decreased demand for certain customer products utilizing our Zydis technology platform.
Oral Technologies’ Segment EBITDA decreased by $18.9 million, or 6%, in fiscal 2013 as compared to fiscal 2012. Excluding the unfavorable impact from foreign exchange fluctuation of $9.3 million, or 3%, Oral Technologies’ Segment EBITDA decreased by $9.6 million, or 3%, as compared to the same period a year ago primarily related to decreased product demand within our Zydis technology platform as noted above and unfavorable product mix within the segment, partially offset by the research and development product participation income recorded in the first half of fiscal 2013.
Medication Delivery Solutions segment
Net revenue decreased by $4.6 million, or 2%, in fiscal 2013 as compared to fiscal 2012. Excluding the unfavorable impact from foreign exchange fluctuation of $2.6 million, or 1%, Medication Delivery Solutions’ net revenue was relatively flat as compared to the same period a year ago primarily due to reduced demand for sterile injectable products in our European pre-filled syringe business of approximately $10.6 million, partially offset by increased demand for biologics services of approximately $7.8 million.
Medication Delivery Solutions’ Segment EBITDA increased by $4.0 million, or 15%, in fiscal 2013 primarily due to cost saving initiatives enacted within the segment and increased demand for biologics services, partially offset by decreased demand for sterile injectable products as noted above. The impact of foreign exchange fluctuations did not materially impact Segment EBITDA.
Development and Clinical Services segment
Net revenues increased by $136.5 million, or 51%, in fiscal 2013 as compared to fiscal 2012 primarily due to the full year inclusion of the acquired the Aptuit CTS business, which closed in the third quarter of fiscal 2012. The acquired Aptuit CTS business accounted for approximately approximately $122 million of the year over year increase, with revenues of approximately $189 million for the period compared to $67.9 million in fiscal 2012. Foreign exchange fluctuations did not materially impact segment net revenues.
EBITDA increased by $22.0 million, or 42%, in fiscal 2013 as compared to fiscal 2012. Excluding the unfavorable impact from foreign exchange fluctuation of $0.8 million, or 2%, the Development and Clinical Services’ Segment EBITDA increased by $22.8 million, or 43%, as compared to the same period a year ago primarily due to the acquisition of the Aptuit CTS business and synergy realization across the segment, partially offset by a mix shift to lower margin services.
56
Table of Contents
Fiscal Year Ended June 30, 2012 compared to Fiscal Year Ended June 30, 2011
Results for the fiscal year ended June 30, 2012 compared to the fiscal year ended June 30, 2011 are as follows:
| Fiscal Year Ended June 30, 2012 |
Fiscal Year Ended June 30, 2011 |
Increase/(Decrease) | ||||||||||||||
| (in millions) |
Change $ | Change % | ||||||||||||||
| Net revenue |
$ | 1,694.8 | $ | 1,531.8 | $ | 163.0 | 11 | % | ||||||||
| Cost of sales |
1,136.2 | 1,029.7 | 106.5 | 10 | % | |||||||||||
|
|
|
|
|
|||||||||||||
| Gross Margin |
558.6 | 502.1 | 56.5 | 11 | % | |||||||||||
| Selling, general and administrative expense |
348.1 | 288.3 | 59.8 | 21 | % | |||||||||||
| Impairment charges and (gain)/loss on sale of assets |
1.8 | 3.6 | (1.8 | ) | * | |||||||||||
| Restructuring and other |
19.5 | 12.5 | 7.0 | 56 | % | |||||||||||
| Property and casualty gain/(loss), net |
(8.8 | ) | 11.6 | (20.4 | ) | * | ||||||||||
|
|
|
|
|
|||||||||||||
| Operating earnings/(loss) |
198.0 | 186.1 | 11.9 | 6 | % | |||||||||||
| Interest expense, net |
183.2 | 165.5 | 17.7 | 11 | % | |||||||||||
| Other (income)/expense, net |
(3.8 | ) | 26.0 | (29.8 | ) | * | ||||||||||
|
|
|
|
|
|||||||||||||
| Earnings/(loss) from continuing operations before income taxes |
18.6 | (5.4 | ) | 24.0 | * | |||||||||||
| Income tax expense/ (benefit) |
16.5 | 23.7 | (7.2 | ) | (30 | )% | ||||||||||
|
|
|
|
|
|||||||||||||
| Earnings/(loss) from continuing operations |
2.1 | (29.1 | ) | 31.2 | (107 | )% | ||||||||||
| Net earnings /(loss) from discontinued operations, net of tax |
(41.3 | ) | (21.0 | ) | (20.3 | ) | 97 | % | ||||||||
|
|
|
|
|
|||||||||||||
| Net earnings/(loss) |
(39.2 | ) | (50.1 | ) | 10.9 | (22 | )% | |||||||||
| Less: Net earnings/(loss) attributable to noncontrolling interest, net of tax |
1.2 | 3.9 | (2.7 | ) | (69 | )% | ||||||||||
|
|
|
|
|
|||||||||||||
| Net earnings/(loss) attributable to Catalent |
$ | (40.4 | ) | $ | (54.0 | ) | $ | 13.6 | (25 | )% | ||||||
|
|
|
|
|
|||||||||||||
| * | Percentage not meaningful |
Net Revenue
Net revenue increased $163.0 million, or 11%, compared to fiscal 2011. The stronger U.S. dollar unfavorably impacted revenue by 1%, or $17.2 million. Excluding the impact of foreign exchange, net revenue increased by $180.2 million, or 12%, as compared to fiscal 2011. The increase was primarily due to increased demand within the Development & Clinical Services and the Oral Technologies segments, partially offset by decreases within Medication Delivery Solutions. The Oral Technologies increase was a result of stronger demand for prescription and consumer health softgels within multiple geographies, as well as an increase for controlled release products within North America and Europe. Increased market demand for customer products using the Zydis technology also contributed to the segment’s increased revenue. The Development & Clinical Services volume increase was primarily related to strong demand for clinical and analytical services within North America and Europe, as well as due to the acquisition of the Aptuit CTS business which closed in mid-February of fiscal 2012 and contributed approximately $67.9 million to the revenue increase. Within the Medication Delivery Solutions segment, revenue was lower compared to the prior fiscal year due to decreased demand within our European injectable facilities, partially offset by increased demand for products within our blow-fill-seal offering.
Gross Margin
Gross margin increased $56.5 million, or 11%, compared to the prior fiscal year. The stronger U.S. dollar unfavorably impacted gross margin by approximately 2%, or $7.7 million. Excluding the impact of foreign
57
Table of Contents
exchange, gross margin increased by $64.2 million, or 13%, primarily due to favorable product mix related to the revenue increases within the Oral Technologies segment and the increased demand for analytical and clinical services within the Development and Clinical Services segment. The aforementioned acquisition of the Aptuit CTS business contributed approximately $18.0 million to the increase in gross margin.
Selling, General and Administrative Expense
Selling, general and administrative expense increased by $59.8 million, or 21%, compared to fiscal 2011. The increase from fiscal 2011 is primarily related to transaction related expenses incurred in connection with the acquisition of the Aptuit CTS business, the recognition of a multi-employer pension plan obligation related to an ongoing operation, incentive-based variable employee related costs and continued investments in our sales and marketing function across the global network. In addition, the acquisition of the Aptuit CTS business resulted in $15.0 million additional selling, general and administrative expenses.
Impairment charges and (gain)/loss on sale of assets
In fiscal 2012, in conjunction with our routine review of our long-lived asset portfolio, we recorded an impairment charge related to property, plant and equipment of approximately $1.8 million, net of any gains on sale of equipment. During fiscal 2012 and fiscal 2011, no goodwill or intangible asset impairment charges were recorded.
Restructuring and Other
Restructuring and other charges of $19.5 million for fiscal 2012 increased $7.0 million compared to the prior fiscal year. The charges for fiscal 2012 primarily include costs to consolidate and streamline our manufacturing footprint and employee related charges resulting from organizational changes and workforce reductions to adjust the capacity of our workforce within our business units. During fiscal 2011, restructuring and special charges of $12.5 million were primarily related to asset impairments of facilities expected to be consolidated and additional costs associated with real estate exited in a prior period.
Interest Expense, net
Interest expense, net of $183.2 million for fiscal 2012 increased $17.7 million, primarily driven by the incremental term loan borrowing of $400 million entered into in the third quarter of fiscal 2012 and the increased interest associated with the extension of approximately 80% of our original U.S. dollar and Euro denominated term loans.
Other (Income)/Expense, net
Other income, net increased to $3.8 million of income in fiscal 2012 as compared to a loss of $26.0 million in the prior fiscal year. This fluctuation primarily resulted from the non-cash unrealized foreign currency transaction losses recognized in the prior year while no such losses were recognized in fiscal 2012.
Provision/(Benefit) for Income Tax
The income tax provision/(benefit) rate relative to earnings/(loss) before income taxes, minority interest and discontinued operations was 88.8% in fiscal 2012 and an amount in excess of 100% in fiscal 2011. Generally, fluctuations in the effective tax rate are primarily due to changes in our geographic pretax income resulting from our business mix and changes in the tax impact of permanent differences, restructuring, other special items and other discrete tax items, which may have unique tax implications depending on the nature of the item. Key drivers in permanent differences year over year include the reversal of intercompany dividend income which is not includible for tax purposes, disallowed interest expense as well as a non-deductible asset impairment. Our fiscal 2012 provision for income taxes was $16.5 million, relative to income before income taxes of
58
Table of Contents
$18.6 million, and resulted in an effective tax rate of 88.8%. Our fiscal 2011 provision for income taxes was $23.7 million and relative to losses before income taxes of ($5.4) million resulted in an effective tax rate in excess of 100% due to the mix of profits and losses in various jurisdictions.
Segment Review
Our results on a segment basis for the fiscal year ended June 30, 2012 compared to the fiscal year ended June 30, 2011 are as follows:
| Fiscal Year Ended June 30, |
Increase/(Decrease) | |||||||||||||||
| (in millions) |
2012 | 2011 | Change $ | Change % | ||||||||||||
| Oral Technologies |
||||||||||||||||
| Net revenue |
$ | 1,220.2 | $ | 1,159.0 | $ | 61.2 | 5 | % | ||||||||
| Segment EBITDA |
334.6 | 308.4 | 26.2 | 8 | % | |||||||||||
| Medication Delivery Solutions |
||||||||||||||||
| Net revenue |
223.9 | 238.6 | (14.7 | ) | (6 | )% | ||||||||||
| Segment EBITDA |
27.5 | 33.5 | (6.0 | ) | (18 | )% | ||||||||||
| Development and Clinical Services |
||||||||||||||||
| Net revenue |
268.3 | 157.0 | 111.3 | 71 | % | |||||||||||
| Segment EBITDA |
53.0 | 30.1 | 22.9 | 76 | % | |||||||||||
| Inter-segment revenue elimination |
(17.6 | ) | (22.8 | ) | 5.2 | (23 | )% | |||||||||
| Unallocated Costs(1) |
(84.8 | ) | (100.3 | ) | 15.5 | (15 | )% | |||||||||
| Combined Total |
||||||||||||||||
| Net revenue |
1,694.8 | 1,531.8 | 163.0 | 11 | % | |||||||||||
|
|
|
|
|
|||||||||||||
| EBITDA from continuing operations |
$ | 330.3 | $ | 271.7 | $ | 58.6 | 22 | % | ||||||||
| (1) | Unallocated costs includes U.S. GAAP restructuring and other, equity-based compensation, impairment charges, certain other corporate directed costs, and other costs that are not allocated to the segments as follows: |
| Fiscal Year Ended June 30, |
||||||||
| (in millions) |
2012 | 2011 | ||||||
| Impairment charges and gain/(loss) on sale of assets |
$ | (1.8 | ) | $ | (3.6 | ) | ||
| Equity compensation |
(3.7 | ) | (3.9 | ) | ||||
| Restructuring and other special items |
(45.8 | ) | (24.9 | ) | ||||
| Property and casualty losses |
8.8 | (11.6 | ) | |||||
| Sponsor advisory fee |
(11.8 | ) | (10.6 | ) | ||||
| Noncontrolling interest |
(1.2 | ) | (3.9 | ) | ||||
| Other income/(expense) , net |
3.8 | (26.0 | ) | |||||
| Non-allocated corporate costs, net |
(33.1 | ) | (15.8 | ) | ||||
|
|
|
|
|
|||||
| Total unallocated costs |
$ | (84.8 | ) | $ | (100.3 | ) | ||
For a reconciliation of EBITDA from continuing operations to earnings/loss from continuing operations, see “Summary—Summary Financial Data.”
Oral Technologies segment
Net revenues increased by 5%, or $61.2 million, compared to fiscal 2011. The stronger U.S. dollar unfavorably impacted the segment’s revenue by 1%, or $13.3 million. Excluding the impact of foreign exchange rates, Oral Technologies’ net revenue increased by 6%, or $74.5 million. Excluding the impact of foreign exchange rates, the year over year fluctuation was attributable to an increase in revenue from our softgel offering of $46.1 million due primarily to increased demand in our prescription and consumer health softgel offerings and increased revenue from our modified release offerings of $31.9 million due to increased demand of our customers’ products which utilize our controlled release and Zydis technology platforms.
59
Table of Contents
Oral Technologies’ Segment EBITDA increased by 8%, or $26.2 million. Oral Technologies’ Segment EBITDA was unfavorably impacted by foreign exchange rate movements by 2%, or $6.2 million. Excluding the impact of foreign exchange rates, the increase was 10%, or $32.4 million, which was primarily related to the previously mentioned sales volume increases as well as favorable product mix and improved productivity and fixed manufacturing cost management within the segment.
Medication Delivery Solutions segment
Net revenues decreased by 6%, or $14.7 million, compared to fiscal 2011. The stronger U.S. dollar negatively impacted the segment’s revenue by approximately 1%, or $2.0 million. Excluding the impact of foreign exchange rates, net revenues decreased 5%, or $12.7 million, which was primarily driven by decreased demand for both flu and non-flu pre-filled syringe products within our European injectable facilities of approximately $14.9 million, as well as lower year-over-year revenue of $6.0 million from our biologics offering. These revenue declines were partially offset by increased demand for products utilizing our blow-fill-seal platform of $6.9 million.
Segment EBITDA decreased by 18%, or $6.0 million. The stronger U.S. dollar negatively impacted Medication Delivery Solutions’ EBITDA by approximately 2%, or $0.5 million. Excluding the impact of foreign exchange rates, the $5.5 million, or 17%, decrease was primarily due to the decreased demand for both flu and non-flu pre-filled syringe products within our European injectable facilities, as discussed above, and were partially offset by favorable product mix and manufacturing efficiency improvements within our blow-fill-seal operation.
Development and Clinical Services segment
Net revenues increased by 71%, or $111.3 million. The stronger U.S. dollar negatively impacted the segment’s revenue by 1%, or $2.0 million. Excluding the impact of foreign exchange rates, net revenues increased by 72%, or $113.3 million. The acquisition of the Aptuit CTS business, which closed in the third quarter of fiscal 2012, contributed approximately $67.9 million of the revenue increase. Excluding the impact of foreign exchange, the remaining increase was primarily related to strong demand for analytical and clinical services within North America and Europe, excluding the acquired Aptuit CTS business, of approximately $5.8 million and $42.5 million, respectively.
Segment EBITDA increased by $22.9 million, primarily due to the previously mentioned stronger demand within our clinical services and analytical offerings, as well as due to the acquisition of the Aptuit CTS business which contributed approximately $13.5 million of the EBITDA increase. The segment’s EBITDA was immaterially impacted by foreign exchange rates.
Liquidity and Capital Resources
Overview
Our principal source of liquidity has been cash flow generated from operations. The principal uses of cash are to fund planned operating and capital expenditures, interest payments on debt and any mandatory or discretionary principal payments on debt issuances. As of March 31, 2014, our financing needs were supported by a $200.3 million revolving credit facility, which was reduced by $11.8 million of outstanding letters of credit. The revolving credit facility matures April 10, 2016. The April 10, 2016 maturity date is subject to certain conditions regarding the refinancing or repayment of our term loans, the $350.0 million aggregate principal amount of 7.875% Senior Notes due October 2018 (the “7.875% Notes”), the €225.0 million aggregate principal amount of 9.75% Euro-denominated Senior Subordinated Notes due April 2017 (the “Senior Subordinated Notes”) and certain other unsecured debt. As of March 31, 2014, we had no outstanding borrowings under our revolving credit facility. On May 20, 2014, we entered into new senior secured credit facilities as described under “Description of Certain Indebtedness—New Senior Secured Credit Facilities,” which replaced our former senior secured facilities. In connection with this offering, we expect to repay all of our other existing outstanding indebtedness.
60
Table of Contents
In September 2012, we announced the commencement of a tender offer to purchase for cash up to $350.0 million aggregate principal amount of our outstanding $565.0 million aggregate principal amount of 9.5%/10.25% senior PIK election notes due April 2015 (the “Senior Toggle Notes”). On September 18, 2012, we purchased $45.9 million aggregate principal amount of Senior Toggle Notes at a price of $47.1 million plus accrued and unpaid interest pursuant to the tender offer. On November 1, 2012, we redeemed $304.1 million aggregate principal amount of Senior Toggle Notes for an aggregate price of $311.4 million plus accrued and unpaid interest.
On September 18, 2012, we issued $350.0 million aggregate principal amount of 7.875% Notes. The 7.875% Notes will mature on October 15, 2018 and interest is payable on the 7.875% Notes on April 15 and October 15 of each year, commencing April 15, 2013. The 7.875% Notes were offered in a private offering to qualified institutional buyers pursuant to Rule 144A under the Securities Act, and to non-U.S. persons in offshore transactions in accordance with Regulation S under the Securities Act. The 7.875% Notes were issued at a price of 100.0% of their principal amount. We used a portion of the net proceeds from the offering of the 7.875% Notes to finance a portion of our tender offer for the Senior Toggle Notes and partial redemption of the Senior Toggle Notes as described above. We may redeem these notes at par plus specified declining premiums set forth in the senior subordinated indenture plus any accrued and unpaid interest to the date of redemption.
On April 29, 2013, we entered into a senior unsecured term loan facility, in order to borrow an aggregate principal amount of $275.0 million of unsecured term loans (the “Unsecured Loans”) due December 31, 2017. The proceeds from the Unsecured Loans were used to redeem all $269.1 million remaining principal outstanding of our Senior Toggle Notes at par plus accrued and unpaid interest as of May 29, 2013, the date of redemption. The Unsecured Loans bear interest, at our option, at a rate equal to the Eurocurrency Rate plus 5.25%, subject to a floor of 1.25%, or the “Base Rate” plus 4.25%, subject to a floor of 2.25%. The Base Rate is equal to the higher of either the Federal Funds Rate plus 0.5% or the rate of interest per annum published by the Wall Street Journal from time to time, as the “prime lending rate.” The “Eurocurrency Rate” is determined by reference to the British Bankers Association Interest Settlement rate for deposits in dollars for the interest period relevant to such borrowing adjusted for certain additional costs. We are not required to repay installments on the Unsecured Loans and are only required to repay the Unsecured Loans on the date of maturity.
We continue to believe that our cash from operations and available borrowings under the revolving credit facility will be adequate to meet our future liquidity needs for at least the next twelve months.
Cash Flows
The following table summarizes our Consolidated Statement of Cash Flows from continuing operations:
| Nine Months Ended March 31, |
Dollar Change(1) |
|||||||||||
| 2014 | 2013 | 2014 vs. 2013 | ||||||||||
| (in millions) | ||||||||||||
| Net cash (used in)/provided by operating activities |
$ | 95.2 | $ | 84.4 | $ | 10.8 | ||||||
| Net cash (used in)/provided by investing activities |
(114.7 | ) | (84.5 | ) | (30.2 | ) | ||||||
| Net cash (used in)/provided by financing activities |
(36.3 | ) | (51.4 | ) | 15.1 | |||||||
| Year Ended June 30, |
Dollar Change(1) | |||||||||||||||||||
| 2013 | 2012 | 2011 | 2013 vs. 2012 | 2012 vs. 2011 | ||||||||||||||||
| (in millions) | ||||||||||||||||||||
| Net cash (used in)/provided by operating activities |
$ | 139.1 | $ | 87.7 | $ | 111.6 | $ | 51.4 | $ | (23.9 | ) | |||||||||
| Net cash (used in)/provided by investing activities |
(122.1 | ) | (538.2 | ) | (83.3 | ) | 416.1 | (454.9 | ) | |||||||||||
| Net cash (used in)/provided by financing activities |
(49.3 | ) | 352.9 | (26.1 | ) | (402.2 | ) | 379.0 | ||||||||||||
| (1) | Fluctuation in terms of percentage change is not meaningful. |
61
Table of Contents
Operating Activities
For the nine months ended March 31, 2014, cash provided by operating activities was $95.2 million compared to $84.4 million for the comparable prior year period. Cash provided by operating activities increased primarily due to lower interest expense, driven by the absence of interest rate swaps in the current period and an overall lower weighted average interest rate as a result of our debt refinancing activity that has occurred since December 31, 2012.
For the fiscal year ended June 30, 2013, cash provided by operating activities was $139.1 million compared to $87.7 million for the comparable prior year period. Cash provided by operating activities increased compared to the same period last year by $51.4 million, primarily due to due to favorable working capital changes, the absence of insurance proceeds related to capital purchases subsequent to the fire in Corby, U.K. in fiscal 2013 and increased call premium cash payments and financing cash fees, partially offset by higher cash interest payments on borrowings.
For the fiscal year ended June 30, 2012, cash provided by operating activities was $87.7 million compared to cash provided by operating activities of $111.6 million for the fiscal year ended June 30, 2011. The decrease was primarily driven by changes in working capital accounts and the cash payments made in connection with costs associated the sale of North American Commercial Packaging operations and the Aptuit CTS business acquisition. In addition, cash flow computations were impacted by changes in our interest rate swaps, foreign exchange rates impacting our liability accounts and the impact of our income tax provision on our accrued income tax payable balance.
Investing Activities
For the nine months ended March 31, 2014, cash used in investing activities was $114.7 million compared to $84.5 million for the comparable prior year period. Acquisitions of property, plant and equipment totaled $62.0 million for the nine months ended March 31, 2014 versus $84.8 million in the comparable prior year period which included capital investments of approximately $20 million in our biologics facility in Madsion, WI. During the nine months ended March 31, 2014, we expended $53.5 million for acquisition activities, including the purchase of 100% of a softgel manufacturing business in Brazil and a 67% controlling interest in a softgel manufacturing facility located in Haining, China. There were no acquisitions in the comparable prior year period.
For the fiscal year ended June 30, 2013, cash used in investing activities was $122.1 million, which primarily related to acquisitions of property, plant and equipment of $122.5 million. Cash used in investing activities from continuing operations for the comparable prior year period was $538.2 million, including $457.5 million of cash paid to acquire the Aptuit CTS business and the remaining 49% of our Eberbach, Germany operation in February 2012. The prior year period also included the $21.3 million of cash received from our insurance provider related to property damage claims resulting from the March 2011 plant fire at the Corby, U.K. facility. Excluding this insurance recovery and the acquisition related investments, cash used in investing activities for property, plant and equipment was approximately $82.9 million in the comparable prior year period.
For the fiscal year ended June 30, 2012, cash used in investing activities was $538.2 million, an increase of $454.9 million compared to the year ending June 30, 2011. The increased cash used in investing activities was mainly driven by the acquisition of the Aptuit CTS business and purchase of the remaining non-controlling interested in the joint venture in Eberbach Germany. Cash utilized for the purchase of property, equipment and other productive assets increased by $16.9 million as compared to the prior year, however, this increased cash outflow was offset by the collection of insurance proceeds related to capital purchases subsequent to the fire in Corby, U.K.
62
Table of Contents
Financing Activities
For the nine months ended March 31, 2014, cash used in financing activities was $36.3 million compared to cash used in financing activities of $51.4 million for the comparable prior year period. The $36.3 million of cash used in financing activities attributable to the nine months ended March 31, 2014 was comprised of $20.0 million in principal repayments primarily related to our Secured Credit Agreement and other borrowings and a net decrease of $17.2 million in short-term borrowings due primarily to the full repayment of certain indebtedness acquired in connection with two business combinations executed during the period and the repayment of other short-term borrowings outside of the United States. The year-over-year fluctuation was primarily driven by the net proceeds from borrowings of $399.3 million related to the issuance of the 7.875% Notes issued in the comparable prior year period. This cash inflow was offset by $434.3 million in principal repayments, which primarily related to the redemption of our previously outstanding Senior PIK-Election Notes. No such activity occurred in the nine months ended March 31, 2014.
For the fiscal year ended June 30, 2013, cash used in financing activities was $49.3 million compared to cash provided by financing activities of $352.9 million in fiscal 2012. The significant year-over-year fluctuation was primarily driven by borrowings, net of financing fees, related to the Aptuit CTS business acquisition in the prior year period of $393.3 million. In fiscal 2013, cash flows used in financing activities consisted largely of fees paid related to financing activity during the period, normal term loan principal payments and payment of other long term obligations as well as cash inflows and outflows associated with debt refinancing activities during the year.
For the fiscal year ended June 30, 2012, cash provided by financing activities was $352.9 million compared to cash used in financing activities of $26.1 million in fiscal 2011. The year-over-year fluctuation was primarily attributable to the proceeds from borrowing on a term loan of $393.3 million, which was offset by repayments of certain long term obligations during the year.
Debt and Financing Arrangements
We have historically used interest rate swaps to manage the economic effect of variable rate interest obligations associated with our floating rate term loans so that the interest payable on the term loans effectively becomes fixed at a certain rate, thereby reducing the impact of future interest rate changes on our future interest expense. As of March 31, 2014, we did not have any interest rate swap agreements in place.
Guarantees and Security
All obligations under the new senior secured credit facilities, the senior unsecured term loan facility, the 7.875% Notes and the Senior Subordinated Notes (together, the “notes”) are unconditionally guaranteed by each of Catalent Pharma Solutions, Inc.’s existing U.S. wholly-owned material restricted subsidiaries, other than our Puerto Rico subsidiaries, subject to certain exceptions.
All obligations under the new senior secured credit facilities, and the guarantees of those obligations, are secured by substantially all of the following assets of Catalent Pharma Solutions, Inc. and those of each guarantor, subject to certain exceptions:
| • | a pledge of 100% of Catalent Pharma Solutions, Inc.’s capital stock and 100% of the equity interests directly held by it and each guarantor in any of its wholly-owned material restricted subsidiaries or any guarantor (which pledge, in the case of any non-U.S. subsidiary of a U.S. subsidiary, does not include more than 65% of the voting stock of a first tier non-U.S. subsidiary); and |
| • | a security interest in, and mortgages on, substantially all tangible and intangible assets of Catalent Pharma Solutions, Inc. and of each guarantor, subject to certain limited exceptions. |
63
Table of Contents
Debt Covenants
The credit agreements governing the new senior secured credit facilities and the senior unsecured term loan facility and the indentures governing the notes contain a number of covenants that, among other things, restrict, subject to certain exceptions, our (and our restricted subsidiaries’) ability to incur additional indebtedness or issue certain preferred shares; create liens on assets; engage in mergers and consolidations; sell assets; pay dividends and distributions or repurchase capital stock; repay subordinated indebtedness; engage in certain transactions with affiliates; make investments, loans or advances; make certain acquisitions; and in the case of the credit agreement governing the new senior secured credit facilities, enter into sale and leaseback transactions, amend material agreements governing our subordinated indebtedness (including the Senior Subordinated Notes) and change our lines of business.
The credit agreements governing the new senior secured credit facilities and the senior unsecured term loan facility and the indentures governing the notes also contain change of control provisions and certain customary affirmative covenants and events of default. As of March 31, 2014, we were in compliance with all covenants related to our long-term obligations. Our long-term debt obligations do not contain any financial maintenance covenants.
Subject to certain exceptions, the credit agreements governing the new senior secured credit facilities and the senior unsecured term loan facility and the indentures governing the notes permit us and our restricted subsidiaries to incur certain additional indebtedness, including secured indebtedness. None of our non-U.S. or Puerto Rico subsidiaries is a guarantor of the loans or notes.
As market conditions warrant and subject to our contractual restrictions and liquidity position, we, our affiliates and/or our major equity holders, including Blackstone and its affiliates, may from time to time repurchase our outstanding debt securities, including the notes and/or our outstanding bank loans in privately negotiated or open market transactions, by tender or otherwise. Any such repurchases may be funded by incurring new debt. Any new debt may also be secured debt. We may also use available cash on our balance sheet. The amounts involved in any such transactions, individually or in the aggregate, may be material. Further, any such purchases may result in our acquiring and retiring a substantial amount of any particular series, with the attendant reduction in the trading liquidity of any such series.
As of March 31, 2014 and June 30, 2013, the amounts of cash and cash equivalents held by foreign subsidiaries were $49.6 million and $84.9 million out of the total consolidated cash and cash equivalents of $55.7 million and $106.4 million. We believe that the amount of funds held by foreign subsidiaries as of such dates not readily convertible into other foreign currencies, including U.S. dollars, was $2.3 million and $7.0 million, respectively. Based on our domestic cash flows from operations and our other sources of liquidity, we believe we have sufficient access to funds for our expected future domestic liquidity needs. Our intent is to continue to reinvest undistributed earnings of our foreign local entities and we do not currently plan to repatriate them to fund our operations in the United States. In the event we need to repatriate funds from outside of the United States, such repatriation would likely be subject to restrictions by local laws and/or tax consequences including foreign withholding taxes or U.S. income taxes. It is not feasible to estimate the amount of U.S. tax that might be payable on the remittance of such earnings.
64
Table of Contents
Contractual Obligations
The following table summarizes our significant contractual obligations as of June 30, 2013:
| Total | 1 year | 2-3 years | 4-5 years | 5+ years | ||||||||||||||||
| (in millions) | ||||||||||||||||||||
| Long-term debt obligations(1) |
$ | 2,629.1 | $ | 32.9 | $ | 41.7 | $ | 2,221.8 | $ | 332.7 | ||||||||||
| Interest on long-term obligations(2) |
668.0 | 148.3 | 293.9 | 162.0 | 63.8 | |||||||||||||||
| Capital lease obligations(3) |
62.5 | 2.1 | 4.6 | 5.5 | 50.3 | |||||||||||||||
| Operating leases(4) |
26.1 | 6.5 | 9.2 | 4.3 | 6.1 | |||||||||||||||
| Purchase obligations(5) |
24.1 | 21.3 | 2.6 | 0.2 | — | |||||||||||||||
| Other long-term liabilities(6) |
60.4 | 15.9 | 5.1 | 5.3 | 34.1 | |||||||||||||||
|
|
|
|
|
|
|
|
|
|
|
|||||||||||
| Total contractual obligations |
$ | 3,470.2 | $ | 227.0 | $ | 357.1 | $ | 2,399.1 | $ | 487.0 | ||||||||||
|
|
|
|
|
|
|
|
|
|
|
|||||||||||
| (1) | Represents maturities of our long-term debt obligations excluding capital lease obligations. |
| (2) | Represents estimated interest payments of our long-term obligations including capital lease obligations. Estimated future interest payments on our variable rate debt obligations were calculated using the interest and exchange rates as of June 30, 2013. |
| (3) | Represents maturities of our capital lease obligations included within long-term debt on our balance sheet. |
| (4) | Represents minimum rental payments for operating leases having initial or remaining non-cancelable lease terms. |
| (5) | Purchase obligations includes agreements to purchase goods or services that are enforceable and legally binding which specify all significant terms, including the following: fixed or minimum quantities to be purchased; fixed, minimum or variable price provisions; and approximate timing of the transaction. Purchase obligations disclosed above may include estimates of the time period in which cash outflows will occur. Purchase orders entered into in the normal course of business and authorizations to purchase that involve no firm commitment from either party are excluded from the above table. In addition, contracts that can be unilaterally canceled with no termination fee or with proper notice are excluded from our total purchase obligations except for the amount of the termination fee or the minimum amount of goods that must be purchased during the requisite notice period. |
| (6) | Primarily related to liabilities associated with long-term employee incentive and deferred compensation plans. |
The table excludes our retirement and other post-retirement benefits (“OPEB”) obligations. The timing and amount of contributions may be impacted by a number of factors, including the funded status of the plans. In fiscal 2014, we are not required to make contributions to our plans to satisfy regulatory funding standards. Beyond fiscal 2014, the actual amounts required to be contributed are dependent upon, among other things, interest rates, underlying asset returns and the impact of legislative or regulatory actions related to pension funding obligations. Payments due under our OPEB plans are not required to be funded in advance, but are paid as medical costs are incurred by covered retiree populations, and are principally dependent upon the future cost of retiree medical benefits under our plans. Refer to Note 11 to our audited consolidated financial statements included elsewhere in this prospectus for further discussion.
Off-Balance Sheet Arrangements
Other than operating leases, we do not have any material off-balance sheet arrangements as of March 31, 2014.
Critical Accounting Policies and Estimates
The following disclosure is provided to supplement the descriptions of our accounting policies contained in Note 1 to our audited consolidated financial statements included elsewhere in this prospectus in regard to significant areas of judgment. Management was required to make certain estimates and assumptions during the
65
Table of Contents
preparation of its Consolidated Financial Statements in accordance with generally accepted accounting principles. These estimates and assumptions impact the reported amount of assets and liabilities and disclosures of contingent assets and liabilities as of the date of our audited consolidated financial statements included elsewhere in this prospectus. They also impact the reported amount of net earnings during any period. Actual results could differ from those estimates. Because of the size of the financial statement elements to which they relate, some of our accounting policies and estimates have a more significant impact on our consolidated financial statements than others. What follows is a discussion of some of our more significant accounting policies and estimates.
Management has discussed the development and selection of these critical accounting policies and estimates with the audit committee of the board of directors.
Revenues and Expenses
Net Revenue
We sell products and services directly to our pharmaceutical, biotechnology and consumer health customers. The majority of our business is conducted through supply or development agreements. The majority of our revenue is charged on a price-per-unit basis and is recognized either upon shipment or delivery of the product or service. Revenue generated from research and development arrangements are generally priced by project and are recognized either upon completion of the required service or achievement of a specified project phase or milestone.
Our overall net revenue is generally impacted by the following factors:
| • | Fluctuations in overall economic activity within the geographic markets in which we operate; |
| • | Change in the level of competition we face from our competitors; |
| • | New intellectual property we develop and expiration of our patents; |
| • | Changes in prices of our products and services, which are generally relatively stable due to our long-term contracts; and |
| • | Fluctuations in exchange rates between foreign currencies, in which a substantial portion of our revenues and expenses are denominated, and the U.S. dollar. |
Operational Expenses
Cost of sales consists of direct costs incurred to manufacture and package products and costs associated with supplying other revenue-generating services. Cost of sales includes labor costs for employees involved in the production process and the cost of raw materials and components used in the process or product. Cost of sales also includes labor costs of employees supporting the production process, such as production management, quality, engineering, and other support services. Other costs in this category include the external research and development costs on behalf of our customers, depreciation of fixed assets, utility costs, freight, operating lease expenses and other general manufacturing expenses.
Selling, general and administration expenses consist of all expenditures incurred in connection with the sales and marketing of our products, as well as administrative expenses to support our businesses. The category includes salaries and related benefit costs of employees supporting sales and marketing, finance, human resources, information technology, research and development costs in pursuit of our own proactive development and costs related to executive management. Other costs in this category include depreciation of fixed assets, amortization of our intangible assets, professional fees, marketing and other expenses to support selling and administrative areas.
66
Table of Contents
Direct expenses incurred by a segment are included in that segment’s results. Shared sales and marketing, information technology services and general administrative costs are allocated to each segment based upon the specific activity being performed for each segment or are charged on the basis of the segment’s respective revenues or other applicable measurement. Certain corporate expenses are not allocated to the segments. We do not allocate the following costs to the segments:
| • | Impairment charges; and (gain)/loss on sale of assets; |
| • | Equity compensation; |
| • | Restructuring expenses and other special items; |
| • | Sponsor advisory fee; |
| • | Noncontrolling interest; and |
| • | Other income/(expense), net. |
Our operating expenses are generally impacted by the following factors:
| • | The utilization rate of our facilities: as our utilization rate increases, we achieve greater economies of scale as fixed manufacturing costs are spread over a larger number of units produced; |
| • | Production volumes: as volumes change, the level of resources employed also fluctuate, including raw materials, component costs, employment costs and other related expenses, and our utilization rate may also be affected; |
| • | The mix of different products or services that we sell; |
| • | The cost of raw materials, components and general expense; |
| • | Implementation of cost control measures and our ability to effect cost savings through our Operational Excellence, Lean Manufacturing and Lean Six Sigma program; |
| • | Fluctuations in exchange rates between foreign currencies, in which a substantial portion of our revenues and expenses are denominated, and the U.S. dollar. |
Allowance for Inventory Obsolescence
We write down our inventory for estimated obsolescence or unmarketable inventory equal to the difference between the cost of the inventory and the estimated market value based upon assumptions about future demand and market conditions. If actual market conditions are less favorable than those projected, additional inventory write-downs may be required resulting in a charge to income in the period such determination was made.
Long-lived and Other Definite Lived Intangible Assets
We allocate the cost of an acquired company to the tangible and identifiable intangible assets and liabilities acquired, with the remaining amount being recorded as goodwill. Certain intangible assets are amortized over their estimated useful life.
We assess the impairment of identifiable intangibles if events or changes in circumstances indicate that the carrying value of the asset may not be recoverable. Factors that we consider important which could trigger an impairment review include the following:
| • | Significant under-performance relative to historical or projected future operating results; |
| • | Significant changes in the manner of use of the acquired assets or the strategy of the overall business; |
| • | Significant negative industry or economic trends; and |
| • | Recognition of goodwill impairment charges. |
67
Table of Contents
If we determine that the carrying value of intangibles and/or long-lived assets may not be recoverable based on the existence of one or more of the above indicators of impairment, we measure any impairment based on fair value, which we derive either by the estimated cash flows expected to result from the use of the asset and its eventual disposition or on assumptions we believe marketplace participants would utilize and comparable marketplace information in similar arm’s length transactions. We then compare weighted values to the asset’s carrying amount. Any impairment loss recognized would represent the excess of the asset’s carrying value over its estimated fair value. Significant estimates and judgments are required when estimating such fair values. If it is determined that these assets are impaired, an impairment charge would be recorded and the amount could be material. See Note 4 to our audited consolidated financial statements included elsewhere in this prospectus for further discussion.
Goodwill
We account for goodwill and intangible assets with indefinite lives in accordance with Accounting Standard Codification (“ASC”) 350 Goodwill, Intangible and Other Assets. Under ASC 350, goodwill and intangible assets with indefinite lives are tested for impairment at least annually utilizing both qualitative and quantitative assessments. Our annual goodwill impairment test was conducted as of April 1, 2013. We assess goodwill for possible impairment by comparing the carrying value of our reporting units to their fair values. We determine the fair value of our reporting units utilizing estimated future discounted cash flows and incorporate assumptions that we believe marketplace participants would utilize. In addition, we use comparative market information and other factors to corroborate the discounted cash flow results. No reporting units were at risk of failing step one in the goodwill impairment test under the provisions of ASC 350 as of April 1, 2013. See Note 3 to our audited consolidated financial statements included elsewhere in this prospectus for further discussion.
Risk Management
We use derivative instruments as part of its overall strategy to manage our exposure to market risks primarily associated with fluctuations in interest rates. As a matter of policy, we do not use derivatives for trading or speculative purposes.
All derivatives are recorded at fair value either as assets or liabilities. Changes in fair value of derivatives not designated as hedging instruments are recognized currently in earnings in the statements of operations. The effective portion of changes in fair value of derivatives designated as cash flow hedging instruments is recorded as a component of other comprehensive income. The ineffective portion, if any, is reported in the statements of operations. Amounts included in other comprehensive income are reclassified into earnings in the same period during which the hedged cash flows affect earnings.
Derivative Instruments and Hedging Activities
As required by ASC 815 Derivatives and Hedging (ASC 815), we record all derivatives on the balance sheet at fair value. The accounting for changes in the fair value of derivatives depends on the intended use of the derivative, whether we have elected to designate a derivative in a hedging relationship and apply hedge accounting and whether the hedging relationship has satisfied the criteria necessary to apply hedge accounting. Derivatives designated and qualifying as a hedge of the exposure to changes in the fair value of an asset, liability, or firm commitment attributable to a particular risk, such as interest rate risk, are considered fair value hedges. Derivatives designated and qualifying as a hedge of the exposure to variability in expected future cash flows, or other types of forecasted transactions, are considered cash flow hedges. Derivatives may also be designated as hedges of the foreign currency exposure of a net investment in a foreign operation. Hedge accounting generally provides for the matching of the timing of gain or loss recognition on the hedging instrument with the recognition of the changes in the fair value of the hedged asset or liability that are attributable to the hedged risk in a fair value hedge or the earnings effect of the hedged forecasted transactions in a cash flow hedge. We may enter into derivative contracts that are intended to economically hedge certain of its risk, even though hedge accounting does not apply or we elect not to apply hedge accounting under ASC 815.
68
Table of Contents
Income Taxes
In accordance with the provisions of ASC 740 Income Taxes (ASC 740), we account for income taxes using the asset and liability method. The asset and liability method requires recognition of deferred tax assets and liabilities for expected future tax consequences of temporary differences that currently exist between tax bases and financial reporting bases of our assets and liabilities. Deferred tax assets and liabilities are measured using enacted tax rates in the respective jurisdictions in which we operate. In assessing the ability to realize deferred tax assets, we consider whether it is more likely than not that some portion or all of the deferred tax assets will not be realized. Deferred taxes are not provided on the undistributed earnings of subsidiaries outside of the United States when it is expected that these earnings are permanently reinvested. We have not made any provision for U.S. income taxes on the undistributed earnings of foreign subsidiaries as those earnings are considered permanently reinvested in the operations of those foreign subsidiaries.
ASC 740 clarifies the accounting for uncertainty in income taxes recognized in the financial statements. Elements of this standard also provides that a tax benefit from an uncertain tax position may be recognized when it is more likely than not that the position will be sustained upon examination, including resolutions of any related appeals or litigation processes, based on the technical merits. We recognized no material adjustment in the liability for unrecognized income tax benefits. As of June 30, 2013, we had a total of $42.7 million of unrecognized tax benefits, including accrued interest as applicable.
On February 17, 2012, we completed its acquisition of the Aptuit CTS business for approximately $400.0 million. The CTS acquisition was a taxable stock acquisition and was made with no Section 338 election. The acquisition created significant intangible value for book purposes, which gave rise to a large deferred tax liability (“DTL”), as there was no corresponding step-up for tax purposes. Overall, the acquisition resulted in a net DTL of about $39 million. Under the acquisition accounting rules, an amount of Goodwill equal to the $39 million net DTL was recorded on the opening balance sheet. As part of the purchase agreement, we are indemnified for tax liabilities which may arise in the future relating to periods prior to the acquisition date.
Critical and New Accounting Pronouncements
Refer to Note 1 to our audited consolidated financial statements included elsewhere in this prospectus for a description of critical accounting policies and recent accounting pronouncements.
Quantitative and Qualitative Disclosures about Market Risk
We are exposed to cash flow and earnings fluctuations as a result of certain market risks. These market risks primarily relate to changes in interest rates associated with our long-term debt obligations and foreign exchange rate changes. We sometimes utilize derivative financial instruments, such as interest rate swaps, in order to mitigate risk associated with some of our variable rate debt.
Interest Rate Risk
We have historically used interest rate swaps to manage the economic effect of variable rate interest obligations associated with our floating rate term loans so that the interest payable on the term loans effectively becomes fixed at a certain rate, thereby reducing the impact of future interest rate changes on our future interest expense. Our two U.S. dollar-denominated and one euro-denominated interest rate swap agreements, which were designated as effective cash flow hedges for financial reporting purposes, matured on April 10, 2013. Our Japanese yen interest rate swap, effective as an economic hedge but not designated as effective for financial reporting purposes, matured on May 15, 2013. As of June 30, 2013, we did not have any interest rate swap agreements in place.
On February 28, 2013, in connection with the refinancing of our €44.9 million Euro term loan, we de-designated €35.0 million of the €240.0 million notional Euribor-based interest rate swap. Prior to de-designation,
69
Table of Contents
the effective portion of the change in fair value of the derivative was recorded as a component of other comprehensive income/(loss). The other comprehensive income/(loss) balance associated with the de-designated portion of the derivative was reclassified to earnings during the second half of fiscal 2013.
Foreign Currency Exchange Risk
By nature of our global operations, we are exposed to cash flow and earnings fluctuations resulting from foreign exchange rate variation. These exposures are transactional and translational in nature. Since we manufacture and sell our products throughout the world, our foreign currency risk is diversified. Principal drivers of this diversified foreign exchange exposure include the European euro, British pound, Argentinean peso, Brazilian real and Australian dollar. Our transactional exposure arises from the purchase and sale of goods and services in currencies other than the functional currency of our operational units. We also have exposure related to the translation of financial statements of our foreign divisions into U.S. dollars, the functional currency of the parent. The financial statements of our operations outside the United States are measured using the local currency as the functional currency. Adjustments to translate the assets and liabilities of these foreign operations in U.S. dollars are accumulated as a component of other comprehensive income/(loss) utilizing period-end exchange rates. Foreign currency transaction gains and losses calculated by utilizing weighted average exchange rates for the period are included in the statements of operations in “other expense, net”. Such foreign currency transaction gains and losses include inter-company loans denominated in non-U.S. dollar currencies.
70
Table of Contents
We participate in nearly every sector of the $800 billion annual revenue global pharmaceutical industry, including but not limited to the prescription drug and biologic sectors as well as consumer health, which includes the over-the-counter and vitamins and nutritional supplement sectors. Global demand for both pharmaceutical and consumer healthcare products continues to increase, driven by: expanded access to care arising from reforms in two key large markets, China and the United States; increased life expectancy in aging and increasingly obese populations in both developed markets and emerging markets; and a rising number of affluent consumers in emerging markets. Payors, both public and private, have sought to limit the economic impact of such demand through greater use of generic drugs, access and spending controls, and health technology assessment techniques, favoring products which deliver truly differentiated patient outcomes.
The pharmaceutical industry, including the consumer health sector, is benefiting from these demand drivers. Innovative pharmaceuticals, both drugs and biologics, continue to play a critical role in the global pharmaceutical market, despite payor pressures to control spending. With a record 4,000+ compounds in active clinical development, development and launch of new chemical and biologic molecules will sustain treatment innovation and growth in the industry, with particularly strong uptake from molecules which treat specialty and orphan conditions, and in biologics overall. As a result of efforts by payors to limit overall costs, generics share of value has reached more than 25%, with a share of volume in some developed markets of more than 80%. Finally, sustained developed market demand and rapid growth in emerging economies is driving the consumer health products growth rate to more than double that of pharmaceuticals. As our customers participate in each of these sectors, including innovator companies and generics, we are well positioned to benefit from these demand dynamics.
While benefiting from this strong demand, innovator companies have been facing many challenges, including significant patent expirations and challenges, pricing pressures, increasingly complex discovery and development activities, and higher regulatory expectations. In response, many larger pharmaceutical companies have been restructuring their in-house approaches to research and development (“R&D”), manufacturing and sales, and marketing, including realigning therapeutic class focus, scaling back on idle capacity resulting from generic conversions, and accessing specialized capabilities and capacity through outsourcing arrangements. The total share of industry spend that is outsourced is estimated around 30% today, with the share of large company spend that is outsourced growing, and medium-to-smaller companies already outsourcing a significant portion of their activities due to their limited resources and more virtual business models.
Advanced Delivery Technologies Market. More than half of today’s prescription revenues come from dose forms that require more than simple, immediate release tablets and oral solutions—drugs and biologics frequently require specialized manufacturing and/or molecular profile modification to achieve expected clinical and deliver differentiated patient outcomes. Specialized manufacturing relates to products that require some type of differentiated handling, such as sterile handling, worker protection for potency, active pharmaceutical ingredient segregation, unique/specialized processing, or hard-to-fill/finish end-dosing formats. Molecular profile modification relates to the use of proprietary or conventional formulation technologies, dose form design, functional excipients, and targeted delivery approaches to enable achievement of a drug’s optimal clinical profile. While certain pharmaceutical companies have some portion of these capabilities in house, nearly all externally partner to access one or more of these capabilities as needed. An increasing share of molecules will require advanced delivery technologies, with estimates ranging from 60% to 90% of all new molecules entering development. Consumer health products also benefit from advanced delivery technologies, to enable innovative new products, or to create new formats for existing products and extend a brand franchise. We believe, based on external industry analysts, that the size of the advanced delivery technologies market will grow approximately 6-10% annually driven by these factors.
Both specialized manufacturing and molecular profile modification require sophisticated know-how, often involve proprietary technology platforms, and would typically involve both development activity, including
71
Table of Contents
clinical supply and inclusion in New Drug Application submissions, and commercial supply activity. Providers with strong regulatory track records, a history of consistent and reliable supply, and proven product approval and launch success will have a competitive advantage.
Development Solutions Market. The global pharmaceutical industry invests approximately $160 billion annually in R&D, of which an estimated 40% is outsourced (approximately 25% in large companies, with more than 50% in mid-sized and specialty companies). Approximately 50% of R&D spend is for compounds in Phase II and later stages of development; separately approximately half of R&D spend is on the combination of clinical research and chemistry, manufacturing and controls (“CMC”) work. These areas are the most common areas of outsourcing, with large global and regional clinical research organizations participating in clinical research spend (approximately 36% of R&D spend), and providers of development sciences, clinical trial supplies and logistics such as Catalent, participating in the CMC spend (approximately 14% of R&D spend).
Global development and clinical activities are increasingly complex, with evolving global standards, and more complex multi-arm trials in multiple patient populations across both developed and emerging markets. An increasing share of new molecule discovery is coming from established and emerging Asian markets, with nearly 20% of active innovator compounds originating there. The increase in biologics in development adds manufacturing and logistics complexity, requiring specialized handing capabilities. All of these factors favor increased outsourcing to specialist providers.
72
Table of Contents
General
We are the leading global provider of advanced delivery technologies and development solutions for drugs, biologics and consumer health products. Our oral, injectable, and respiratory delivery technologies address the full diversity of the pharmaceutical industry including small molecules, large molecule biologics and consumer health products. Through our extensive capabilities and deep expertise in product development, we help our customers take products to market faster, including nearly half of new drug products approved by the FDA in the last decade. Our advanced delivery technology platforms, broad and deep intellectual property, and proven formulation, manufacturing and regulatory expertise enable our customers to develop more products and better treatments. Across both development and delivery, our commitment to reliably supply our customers’ needs is the foundation for the value we provide; annually, we produce more than 70 billion doses for nearly 7,000 customer products. We believe that through our investments in growth-enabling capacity and capabilities, our ongoing focus on operational and quality excellence, the sales of existing customer products, the introduction of new customer products, our patents and innovation activities, and our entry into new markets, we will continue to benefit from attractive and differentiated margins, and realize the growth potential from these areas.
Since 2010, we have made investments to expand our sales and marketing activities, leading to growth in the number of active development programs in both strategic platforms for our customers. This has further enhanced our extensive, long-duration relationships and long-term contracts with a broad and diverse range of industry-leading customers. In the fiscal year ended June 30, 2013, we did business with 85 of the top 100 branded drug marketers, 20 of the top 25 generics marketers, 41 of the top 50 biologics marketers, and 19 of the top 20 consumer health marketers globally. Selected key customers include Pfizer, Johnson & Johnson, GlaxoSmithKline, Merck, Novartis, Roche, Actavis and Teva. We have many long-standing relationships with our customers, particularly in advanced delivery technologies, where we tend to follow a prescription molecule through all phases of its lifecycle, from the original brand prescription, development and launch to generics or over-the-counter switch. A prescription pharmaceutical product relationship with an innovator will often last for nearly two decades, extending from mid-clinical development through the end of the product’s life cycle. We serve customers who require innovative product development, superior quality, advanced manufacturing and skilled technical services to support their development and marketed product needs. Our broad and diverse range of technologies closely integrates with our customers’ molecules to yield final dose forms, and this generally results in the inclusion of Catalent in our customers’ prescription product regulatory filings. Both of these factors translate to long-duration supply relationships at an individual product level.
We believe our customers value us because our depth of development solutions and advanced delivery technologies, intellectual property, consistent and reliable supply, geographic reach, and substantial expertise enable us to create a broad range of business and product solutions that can be customized to fit their individual needs. Today we employ more than 1,000 scientists and technicians and hold approximately 1,300 patents and patent applications in advanced delivery, drug and biologics formulation and manufacturing. The aim of our offerings is to allow our customers to bring more products to market faster, and develop and market differentiated new products that improve patient outcomes. We believe our leading market position, significant global scale, and diversity of customers, offerings, regulatory categories, products, and geographies reduce our exposure to potential strategic and product shifts within the industry.
We provide a number of proprietary, differentiated technologies, products and service offerings to our customers across our advanced delivery technologies and development solutions platforms. The core technologies within our advanced delivery technologies platform include softgel capsules, our Zydis oral dissolving tablets, blow-fill-seal unit dose liquids and a range of other oral, injectable and respiratory technologies. The technologies and service offerings within our development solutions platform span the drug development process, ranging from the Optiform, GPEx and SMARTag platforms for development of small molecules, biologics and antibody-drug conjugates, or ADCs, respectively, to formulation, analytical services,
73
Table of Contents
early stage clinical development, clinical trials supply and regulatory consulting. Our offerings serve a critical need in the development and manufacturing of difficult to formulate products across a number of product types.
Our technologies and services have been assembled over more than 80 years through internal development, strategic alliances, in-licensing and acquisitions, starting with our softgel capsule technology which was initially introduced in the 1930s and has been continuously enhanced. We have continued to internally expand our technologies through the introduction of numerous new technologies including launches since fiscal 2013 such as OptiShell, OptiDose, OptiMelt, Zydis Nano and Zydis Bio. To extend the reach of our technologies and services, we have also formed a number of active partnerships, including recent partnerships with BASF (Germany), CEVEC (Germany), CTC Bio (South Korea) and ShangPharma Corporation (China), and have active relationships with research universities around the world. We have also augmented our portfolio through five acquisitions over the past three years, including significantly expanding the scale of our development and clinical services business through the acquisition of Aptuit CTS business in 2012. We believe our own internal innovation, supplemented by current and future external partnerships and acquisitions, will continue to strengthen and extend our leadership positions in the delivery and development of drugs, biologics and consumer health products.
For the fiscal year ended June 30, 2013, our revenues were $1,800 million and Adjusted EBITDA was $413 million. From the fiscal year ended June 30, 2009 to the fiscal year ended June 30, 2013, our revenues and Adjusted EBITDA grew at compound annual growth rates, or CAGRs, of 6.5% and 10.8%, respectively. For a reconciliation of Adjusted EBITDA to net income, see “Summary—Summary Financial Data.”
History
Catalent was formed in April 2007, when we were acquired by affiliates of Blackstone. Prior to that, we formed the core of the Pharmaceutical Technologies and Services (“PTS”) segment of Cardinal. PTS was in turn created by Cardinal through a series of acquisitions, with the intent of creating the world’s leading outsourcing provider of specialized, market-leading solutions to the global pharmaceutical and biotechnology industry. In 1998, R.P. Scherer Corporation, the market leader in advanced oral drug delivery technologies, was acquired by Cardinal. In 1999, Cardinal acquired Automatic Liquid Packaging, Inc., the market leader in blow-fill-seal technology for respiratory treatments, ophthalmics, and other areas. In 2001, Cardinal purchased International Processing Corporation, a provider of oral solid dose forms. In 2002, PTS entered the fee-for-service development solutions market with the acquisition of Magellan Labs, a leader in analytical sciences services for the U.S. pharmaceuticals industry. Finally, in 2003, Cardinal acquired Intercare Group PLC, through which we expanded our European injectable manufacturing network. During the period from 1996 through 2006 we also made other selective acquisitions of businesses, facilities and technologies in all segments, including our legacy pharmaceutical commercial packaging segment.
Subsequent to our 2007 acquisition, we have regularly reviewed our portfolio of offerings and operations in the context of our strategic growth plan. As a result of those ongoing assessments, since 2007 we have sold five businesses, including two injectable vial facilities in the United States, a French oral dose facility, a printed
74
Table of Contents
components business (with four facilities), and in fiscal 2012 our North American commercial packaging business. We have also consolidated operations at four other facilities, integrating them into the remaining facility network since fiscal 2009.
In fiscal 2012, we acquired the Aptuit CTS business, combining it into our existing clinical service offerings. We also purchased the remaining 49% minority share ownership of our German softgel subsidiary. Further, in calendar 2013 we entered into two joint ventures in China, which provided majority control of both a softgel manufacturer and a newly established clinical supply business, and acquired a softgel manufacturing business in Brazil.
Catalent, Inc. (formerly known as PTS Holdings Corp.) is a holding company that has owned PTS Intermediate Holdings LLC since our acquisition by Blackstone in 2007. PTS Intermediate Holdings LLC owns Catalent Pharma Solutions, Inc., which is a holding company that owns, directly or indirectly, all of our operating subsidiaries. See “Summary—Corporate Structure.”
Our Competitive Strengths
Leading Provider of Advanced Delivery Technologies and Development Solutions
We are the leading global provider of advanced delivery technologies and development solutions for drugs, biologics and consumer health products. In the last decade, we have earned revenue with respect to nearly half of the NCE products approved by the FDA, and over the past three years with respect to 80% of the top 200 largest-selling compounds globally. With over 1,000 scientists and technicians worldwide and approximately 1,300 patents and patent applications, our expertise is in providing differentiated technologies and solutions which help our customers bring more products and better treatments to market faster. For example in the high value area of NCEs, approximately 90% of NCE softgel approvals by the FDA over the last 25 years have been developed and supplied by us.
Diversified Operating Platform
We are diversified by virtue of our geographic scope, our large customer base, the extensive range of products we produce, our broad service offerings, and our ability to provide solutions at nearly every stage of product lifecycles. We produce nearly 7,000 distinct items across multiple categories, including brand and generic prescription drugs and biologics, over-the-counter, consumer health and veterinary products, medical devices and diagnostics. In fiscal 2013, our top 20 products represented approximately 25% of total revenue, with no single customer accounting for greater than 10% of revenue and with no individual product greater than 3%. We serve approximately 1,000 customers in approximately 80 countries, with a majority of our fiscal 2013 revenues coming from outside the United States. This diversity, combined with long product lifecycles and close customer relationships, has contributed to the stability of our business. It has also allowed us to reduce our exposure to potential strategic, customer and product shifts as well as to payor-driven pricing pressures experienced by our branded drug and biologic customers.
Longstanding, Extensive Relationships with Blue Chip Customers
We have longstanding, extensive relationships with leading pharmaceutical and biotechnology customers. In fiscal 2013, we did business with 85 of the top 100 branded drug marketers, 20 of the top 25 generics marketers, 41 of the top 50 biologics marketers, and 19 of the top 20 consumer health marketers globally, as well as with nearly a thousand other customers, including emerging and specialty companies, which are often more reliant on outside partners as a result of their more virtual business models. Regardless of size, our customers seek innovative product development, superior quality, advanced manufacturing and skilled technical services to support their development and marketed product needs. We believe our customers value us because our depth of advanced delivery technologies and development services, consistent and reliable supply, geographic reach and substantial expertise enable us to create a broad range of tailored solutions, many of which are unavailable from other individual providers.
75
Table of Contents
Deep, Broad and Growing Technology Foundation
Our breadth of proprietary and patented technologies and long track record of innovation substantially differentiate us from other industry participants. Within our oral technologies business, our leading softgel platforms, including Liqui-Gels, Vegicaps and OptiShell capsules, and our modified release technologies including the Zydis family, OSDrC OptiDose and OptiMelt technologies, provide formulation expertise to solve complex delivery challenges for our customers. We offer advanced technologies for delivery of small molecules and biologics via respiratory, ophthalmic and injectable routes, including the blow-fill-seal unit dose technology and prefilled syringes. We also provide advanced biologics formulation options, including Gene Product Expression (“GPEx”) cell-line and SMARTag antibody-drug conjugate technologies. We have a market leadership position within respiratory delivery, including metered dose/dry powder inhalers and nasal. We have reinforced our leadership position in advanced delivery technologies over the last three years, as we have launched nearly a dozen new technology platforms and applications. Our culture of creativity and innovation is grounded in our advanced delivery technologies, our scientists and engineers, and our patents and proprietary manufacturing processes throughout our global network. Our global Research & Development team drives focused application of resources to highest priority opportunities for both new customer product introductions and platform technology development. As of June 30, 2013, we had more than 450 product development programs in active development across our businesses.
Long-Duration Relationships Provide Sustainability
Our broad and diverse range of technologies closely integrates with our customers’ molecules to yield final dose forms, and this generally results in the inclusion of Catalent in our customers’ prescription product regulatory filings. Both of these factors translate to long-duration supply relationships at an individual product level, to which we apply our expertise in contracting to produce long-duration commercial supply agreements. These agreements typically have initial terms of three to ten years with regular renewals of one to three years (see “—Contractual Arrangements” for more detail). Nearly 70% of our fiscal 2013 advanced delivery technology platform revenues (comprised of our oral technologies and medication delivery solutions reporting segments) were covered by such long-term contractual arrangements. We believe this base provides us with a sustainable competitive advantage.
Significant Recent Growth Investments
We have made significant past investments to establish a global manufacturing network, and today hold 4.6 million square feet of manufacturing and laboratory space across five continents. We have invested approximately $439.1 million in the last five fiscal years in capital expenditures. Growth-related investments in facilities, capacity and capabilities across our businesses have positioned us for future growth in areas aligned with anticipated future demand. Through our focus on operational, quality and regulatory excellence, we drive ongoing and continuous improvements in safety, productivity and reliable supply to customer expectations, which we believe further differentiate us. Our manufacturing network and capabilities allow us the flexibility to reliably supply the changing needs of our customers while consistently meeting their quality, delivery and regulatory compliance expectations.
High Standards of Regulatory Compliance and Operational and Quality Excellence
We operate our plants in accordance with current good manufacturing practices (“cGMP”), following our own high standards which are consistent with those of many of our large global pharmaceutical and biotechnology customers. We have approximately 1,000 employees around the globe focused on quality and regulatory compliance. More than half of our facilities are registered with the FDA, with the remaining facilities registered with other applicable regulatory agencies, such as the European Medicines Agency (“EMA”). In some cases, facilities are registered with multiple regulatory agencies. In fiscal 2013, we underwent 38 regulatory audits and, over the last five fiscal years, we successfully completed more than 200 regulatory audits. We also undergo nearly 500 customer and internal audits annually. We believe our quality and regulatory track record to be a competitive differentiator for Catalent.
76
Table of Contents
Strong and Experienced Management Team
Our executive leadership team has been transformed since 2009, with most of the team in place since fiscal 2010. Today, our management team has more than 200 years of combined and diverse experience within the pharmaceutical and healthcare industries. With an average of more than 20 years of functional experience, this team possesses deep knowledge and a wide network of industry relationships.
Our Strategy
We are pursuing the following key growth initiatives:
“Follow the Molecule” by Providing Solutions to our Customers across all Phases of the Product Lifecycle
We intend to use our advanced delivery technologies and development solutions across the entire lifecycle of our customers’ products to drive future growth. Our development solutions span the drug development process, starting with our platforms for development of small molecules, biologics and antibody-drug conjugates, to formulation and analytical services, through early stage clinical development and manufacturing of clinical trials supply, to regulatory consulting. Once a molecule is ready for late-stage trials and subsequent commercialization, we provide our customers with a range of advanced delivery technologies and manufacturing expertise that allow them to deliver their molecules to the end-users in appropriate dosage forms. The relationship between a molecule and our advanced delivery technologies typically starts with developing and manufacturing the innovator product then extends throughout the molecule’s commercial life, including through potential generic launches or over-the-counter (“OTC”) conversion. For prescription products, we are typically the sole and/or exclusive provider, and are reflected in customers’ new drug applications.
Our breadth of solutions gives us multiple entry points into the lifecycle of our customers’ molecules. Our initial commercial opportunity arises during the discovery and development of a molecule, when our development solutions can be applied. Once a product reaches late-stage development, we can provide our customers with drug delivery solutions for the commercialization of their products. We then have two commercial additional entry points; upon loss-of-exclusivity and upon OTC conversion. At these points, we partner with both generic and OTC pharmaceutical manufacturers to provide them with advanced delivery technologies that can be applied to their products through these stages of the product lifecycle. Our revenues from our advanced delivery technologies are primarily driven by volumes and, as a result, the loss of exclusivity events may not have a significant negative impact if we continue to work with both branded and generic partners.
An example of this can be found in a leading over-the-counter respiratory brand, which today uses both our Zydis fast dissolve and our Liqui-Gels softgel technologies. We originally began development of the prescription format of this product for our partner multinational pharmaceutical company in 1992 to address specific patient sub-segment needs. After four years of development, we then commercially supplied the prescription Zydis product for six years, and continued to provide the Zydis form as it switched to OTC status in the United States in the early 2000s. More recently, we proactively brought a softgel product concept for the brand to the customer, which the customer elected to develop and launch as well. By following this molecule, we have built a strong, 22-year long relationship across multiple formats and markets.
Continue to Grow Through New Product Launches and Projects
We intend to grow by supplementing our existing diverse base of commercialized advanced delivery technology products with new development programs. As of June 30, 2013, our product development teams were working on approximately 450 new customer programs. Our base of active development programs has expanded in recent years from growing market demand, as well as from our investments since 2010 to expand our global sales and marketing function; once developed and approved in the future, we expect these programs to add to long-duration commercial revenues under long-term contracts and grow our existing product base. In fiscal 2013,
77
Table of Contents
we introduced 97 new products, an increase of more than 60% from the 59 new product introductions in fiscal 2012. In the nine months ended March 31, 2014, we introduced 123 new products, an increase of more than 112% from the 58 new product introductions in the nine months ended March 31, 2013. We also expect that our expanded offerings and capacity such as bioanalytical testing and metered dose inhaler production, our expanded presence in Brazil, and our market entry into China will further expand our active advanced delivery technologies development programs, and position us for future growth. Our development solutions business is driven by thousands of projects annually, ranging from individual short-duration analytical projects to multi-year clinical supply programs.
Accelerate Growth with Existing Customers through Increased Penetration and Broadening of Services
While we have a broad presence across the entire biopharmaceutical industry, we believe there are significant opportunities for additional revenue growth in our existing customer base, by providing advanced delivery solutions for new pipeline or commercial molecules, and by expanding the range and depth of development solutions used by those customers. Within our top 50 customers, nearly 75% utilize less than half of our individual offerings. In order to ensure we provide the most value to our customers, we have increased our field force by approximately 20% since fiscal 2009. We have continued to follow a targeted account strategy, designating certain accounts as global accounts, based on current materiality, partnering approach and growth potential. We have also begun to designate other accounts as growth accounts, based primarily on partnering approach and potential to become global accounts in the future. In both cases, we assign incremental business development and R&D resources to identify and pursue new opportunities to partner. Global accounts represented nearly 37% of our revenues in fiscal 2013, while growth accounts represented approximately 7% of revenues in that same period.
Enter into and Expand in Attractive Technologies and Geographies
We have made a number of internal investments in new geographies and markets, including the construction of a state-of-the-art biomanufacturing facility in Wisconsin to serve the growing global biologics development market, and the in-licensing of the SMARTag antibody-drug conjugate technology to address the growing need for improved targeted delivery of therapeutic compounds directly to tumor sites.
In addition, we intend to proactively enter into emerging/high-growth geographies and other markets where we are currently only narrowly represented, including, but not limited to, China, Brazil, Japan and the animal health market. We have made recent investments in such high-growth areas, including the formation of a China-based clinical supplies joint venture with ShangPharma Corporation, the first provider in China of end-to-end clinical supply solutions, a softgel joint venture in China focused initially on the export of cost-advantaged consumer health products, as well as our recent acquisition of a Brazilian softgel provider.
Capitalize on our Substantial Technology Platform
We have a broad and diverse technology platform that is supported by more than 1,300 patents and patent applications in 106 families across advanced delivery technologies, drug and biologics formulation and manufacturing. This platform is supported by substantial know-how and trade secrets that provide us with additional competitive advantages. For example, we have significant softgel fill and formulation databases and substantial softgel regulatory approval expertise, and as a result, more than 90% of NCE softgels approved in the last 25 years by the FDA have been developed and launched by us.
In addition to resolving product challenges for our customers’ molecules, for more than two decades we have applied our technology platforms and development expertise to proactively develop proof of concept products, whether improved versions of existing drugs, new generic formulations or innovative consumer health products. In the consumer health area, we file product dossiers with regulators in relevant jurisdictions for Catalent-created products, which help contribute sustainable growth to our consumer health business. We expect to continue to seek proactive development and other non-traditional relationships to increase demand for and value realized from our technology platforms. These activities have provided us with opportunities to capture an increased share of end-market value through out-licensing, profit-sharing and other arrangements.
78
Table of Contents
Leverage Existing Infrastructure and Operational Discipline to Drive Profitable Growth
Through our existing infrastructure, including our global network of operating locations and programs, we promote operational discipline and drive margin expansion. With our Lean Six Sigma programs, a global procurement function and conversion cost productivity metrics in place, we have created a culture of functional excellence and cost accountability. We intend to continue to apply this discipline to further leverage our operational network for profitable growth. Since fiscal 2009, we have expanded gross margin by over 400 basis points and Adjusted EBITDA margin by over 300 basis points.
Pursue Strategic Acquisitions and Licensing to Build upon our Existing Platform
We operate in highly fragmented markets in both our advanced delivery technologies and development solutions businesses. Within those markets, the five top players represent only 30% and 10% of the total market share, respectively, by revenue. Our broad platform, global infrastructure and diversified customer base provide us with a strong foundation from which to consolidate within these markets and to generate operating leverage through such acquisitions. Over the past three fiscal years, we have executed five transactions investing more than $570 million and have demonstrated an ability to efficiently and effectively integrate these acquisitions.
We intend to continue to opportunistically source and execute bolt-on acquisitions within our existing business areas, as well as to undertake transactions that provide us with expansion opportunities within new geographic markets or adjacent market segments. We have a dedicated business development team in place to identify these opportunities and have a rigorous and financially disciplined process for evaluating, executing and integrating such acquisitions.
Our Segments
Our offerings and services are summarized below by reporting segment.
| Segment |
Offerings and Services |
Fiscal 2013 Revenue* |
||||
| (Dollars in millions) | ||||||
| Oral Technologies | Formulation, development and manufacturing of prescription and consumer health products using our proprietary softgel, Liqui-Gels, Vegicaps, OptiShell, OptiDose, OptiMelt, and Zydis technologies; as well as other proprietary and conventional oral drug delivery technologies. | $ | 1,186.3 | |||
| Medication Delivery Solutions | Formulation, development, and manufacturing for prefilled syringes and other injectable formats; blow-fill-seal unit dose development and manufacturing; and biologic cell line development and manufacturing, including our GPEx and SMARTag technologies. | $ | 219.3 | |||
| Development & Clinical Services | Manufacturing, packaging, storage, distribution and inventory management for global clinical trials of drugs and biologics; analytical and bioanalytical development and testing; scientific and regulatory consulting services; development services and manufacturing for conventional oral dose forms; and development and manufacturing of products. | $ | 404.8 | |||
| * | Segment Revenue includes inter-segment revenue of $10.1 million. |
This table should be read in conjunction with Note 15 to our audited consolidated financial statements included elsewhere in this prospectus.
79
Table of Contents
Oral Technologies
Our Oral Technologies segment provides advanced oral delivery technologies, including formulation, development and manufacturing of oral dose forms for prescription and consumer health products across all phases of a molecule’s lifecycle. These oral dose forms include softgel, modified release technologies (“MRT”) and immediate release solid oral products. At certain facilities we also provide integrated primary packaging services for the products we manufacture. In fiscal 2013, we generated approximately $850 million in revenue from our softgel products and approximately $370 million in revenue from our MRT products (including intra-segment revenue of approximately $34 million).
Through our Softgel Technologies business, we provide formulation, development and manufacturing services for soft gelatin capsules, or “softgels”, which we first commercialized in the 1930s and have continually enhanced. We are the market leader in overall softgel manufacturing, and hold the leading market position in the prescription arena. Our principal softgel technologies include traditional softgel capsules (in which the shell is made from animal-derived materials) and VegiCaps and OptiShell capsules (in which the shell is made from vegetable-derived materials), which are used in a broad range of customer products including prescription drugs, over-the-counter medications, and vitamins and supplements. Softgel capsules encapsulate liquid, paste or oil-based active compounds in solution or suspension within an outer shell, filling and sealing the capsule simultaneously. We perform all encapsulation within one of our softgel facilities, with active ingredients provided by customers or sourced directly by us. Softgels have historically been used to solve formulation challenges or technical issues for a specific drug, to help improve the clinical performance of compounds, to provide important market differentiation, particularly for over-the-counter compounds, and to provide safe handling of hormonal, potent and cytotoxic drugs. We also participate in the softgel vitamin, mineral and supplement business in selected regions around the world. With the 2001 introduction of our vegetable-derived softgel shell, VegiCaps capsules, consumer health manufacturers have been able to extend the softgel dose form to a broader range of active ingredients and serve patient/consumer populations that were previously inaccessible due to religious, dietary or cultural preferences. In recent years this platform has been extended to pharmaceutical active ingredients via the OptiShell platform. Our VegiCaps and OptiShell capsules are patent protected in most major global markets. Physician and patient studies we have conducted have demonstrated a preference for softgels versus traditional tablet and hard capsule dose forms in terms of ease of swallowing, real or perceived speed of delivery, ability to remove or eliminate unpleasant odor or taste and, for physicians, perceived improved patient adherence with dosing regimens.
Through our Modified Release Technologies business we provide formulation, development and manufacturing services for fast-dissolve tablets and both proprietary and conventional controlled release products. We launched our orally dissolving tablet business in 1986 with the introduction of Zydis tablets, a unique oral dosage form that is freeze-dried in its package, can be swallowed without water, and typically dissolves in the mouth in less than three seconds. Most often used for indications, drugs and patient groups that can benefit from rapid oral disintegration, the Zydis technology is utilized in a wide range of products and indications, including treatments for a variety of central nervous system-related conditions such as migraines, Parkinsons’ Disease, schizophrenia, and pain relief. Zydis tablets continue to be used in new ways by our customers as we extend the application of the technology to new categories, such as for immunotherapies, vaccines and biologics delivery. More recently we have added three new technology platforms to the Modified Release Technologies business portfolio, including the highly flexible OptiDose tab-in-tab technology, already commercially proven in Japan; the OptiMelt hot melt extrusion technology; and the development stage LyoPan oral dissolving tablet technology. We plan to continue to expand the development pipeline of customer products for all of our Modified Release technologies.
Representative Oral Technologies business customers include Pfizer, Novartis, Merck, GlaxoSmithKline, Eli Lilly, Johnson & Johnson and Actavis.
Medication Delivery Solutions
Our Medication Delivery Solutions segment provides formulation, development and manufacturing services for delivery of drugs and biologics, administered via injection, inhalation and ophthalmic routes, using both
80
Table of Contents
traditional and advanced technologies. Our range of injectable manufacturing offerings includes filling drugs or biologics into pre-filled syringes, with flexibility to accommodate other formats within our existing network, focused increasingly on complex pharmaceuticals and biologics. With our range of technologies we are able to meet a wide range of specifications, timelines and budgets. The complexity of the manufacturing process, the importance of experience and know-how, regulatory compliance, and high start-up capital requirements create significant barriers to entry and, as a result, limit the number of competitors in the market. For example, blow-fill-seal is an advanced aseptic processing technology which uses a continuous process to form, fill with drug, and seal a plastic container in a sterile environment. Blow-fill-seal units are currently used for a variety of pharmaceuticals in liquid form, such as respiratory, ophthalmic and otic products. We are a leader in the outsourced blow-fill-seal market, and operate one of the largest capacity commercial manufacturing blow-fill-seal facilities in the world. Our sterile blow-fill-seal manufacturing has significant capacity and flexibility of manufacturing configurations. This business provides flexible and scalable solutions for unit-dose delivery of complex formulations such as suspensions and emulsions, as well as innovative design and engineering container design and manufacturing solutions related to complex container design and manufacturing. Our regulatory expertise can lead to decreased time to commercialization, and our dedicated development production lines support feasibility, stability and clinical runs. We plan to continue to expand our product line in existing and new markets, and in higher margin specialty products with additional respiratory, ophthalmic, injectable and nasal applications. Representative customers include Pfizer, Sanofi-Aventis, Novartis, Roche and Teva.
Our biologics offerings include our formulation development and cell-line manufacturing based on our advanced and patented Gene Product Expression (“GPEx”) technology, which is used to develop stable, high-yielding mammalian cell lines for both innovator and bio-similar biologic compounds. Our GPEx technology can provide rapid cell line development, high biologics production yields, flexibility and versatility. We believe our development stage SMARTag next-generation antibody-drug conjugate technology will provide more precision targeting for delivery of drugs to tumors or other locations, with improved safety versus existing technologies. In fiscal 2013, we launched our recently completed biologics facility in Madison, Wisconsin, with expanded capability and capacity to produce clinical scale biologic supplies; combined with offerings from other businesses of Catalent and external partners, we now provide the broadest range of technologies and services supporting the development and launch of new biologic entities, biosimilars or biobetters to bring a product from gene to market commercialization, faster.
Development and Clinical Services
Our Development and Clinical Services segment provides manufacturing, packaging, storage and inventory management for drugs and biologics in clinical trials. We offer customers flexible solutions for clinical supplies production, and provide distribution and inventory management support for both simple and complex clinical trials. This includes dose form manufacturing or over-encapsulation where needed; supplying placebos, comparator drug procurement and clinical packages and kits for physicians and patients; inventory management; investigator kit ordering and fulfillment; and return supply reconciliation and reporting. We support trials in all regions of the world through our facilities and distribution network. In fiscal 2012 we substantially expanded this business via the Aptuit CTS business acquisition in February 2012 (see Note 2 to our audited consolidated financial statements included elsewhere in this prospectus for further discussion), and in fiscal 2013 formed a joint venture with ShangPharma Corporation to expand our clinical supply services network into China. We are the leading provider of integrated development solutions and one of the leading providers of clinical trial supplies and respiratory products.
We also offer analytical chemical and cell-based testing and scientific services, stability testing, respiratory products formulation and manufacturing, regulatory consulting, and bioanalytical testing for biologic products. Our respiratory product capabilities include development and manufacturing services for inhaled products for delivery via metered dose inhalers, dry powder inhalers and nasal sprays. We also provide formulation development and clinical and commercial manufacturing for conventional and specialty oral dose forms. We provide global regulatory and clinical support services for our customers’ regulatory and clinical strategies during all stages of development. Demand for our offerings is driven by the need for scientific expertise and depth and breadth of services offered, as well as by the reliable supply thereof, including quality, execution and performance.
81
Table of Contents
Development and Product Supply Chain Solutions
In addition to our proprietary offerings, we are also differentiated in the market by our ability to bring together our development solutions and advanced delivery technologies to offer innovative development and product supply solutions which can be combined or tailored in many ways to enable our customers to take their drugs, biologics and consumer health products from laboratory to market. Once a product is on the market, we can provide comprehensive integrated product supply, from the sourcing of the bulk drug to comprehensive manufacturing and packaging to the testing required for release to distribution. Customer solutions we develop are flexible, scalable and creative, so that they meet the unique needs of both large and emerging companies, and for products of all sizes. We believe that our development and product supply solutions will continue to contribute to our future growth.
Sales and Marketing
Our target customers include large pharmaceutical and biotechnology companies, mid-size, emerging and specialty pharmaceutical and biotechnology companies, and consumer health companies, along with companies in other selected healthcare market segments such as animal health and medical devices. We have longstanding, extensive relationships with leading pharmaceutical and biotechnology customers. In fiscal 2013, we did business with 85 of the top 100 branded drug marketers, 20 of the top 25 generics marketers, 41 of the top 50 biologics marketers, and 19 of the top 20 consumer health marketers globally, as well as with nearly a thousand other customers. Faced with access, pricing and reimbursement pressures as well as other market challenges, large pharmaceutical and biotechnology companies have increasingly sought partners to enhance the clinical competitiveness of their drugs and biologics and improve their R&D productivity, while reducing their fixed cost base. Many mid-size, emerging and specialty pharmaceutical and biotechnology companies, while facing the same pricing and market pressures, have chosen not to build a full infrastructure, but rather to partner with other companies-through licensing agreements or outsourcing to access the critical skills, technologies and services required to bring their products to market. Consumer health companies require rapidly-developed, innovative dose forms and formulations to keep up in the fast-paced over-the-counter medication and vitamins markets. These market segments are all critically important to our growth, but require distinct solutions, marketing and sales approaches, and market strategy.
We follow a hybrid demand generation organization model, with global and growth account teams offering the full breadth of Catalent’s solutions to selected accounts, and technical specialist teams providing the in-depth technical knowledge and practical experience essential for each individual offering. All business development and field sales representatives ultimately report to a single sales head, and significant ongoing investments are made to enhance their skills and capabilities. Our sales organization currently consists of more than 150 full-time, experienced sales professionals, supported by inside sales and sales operations. We also have built a dedicated strategic marketing team, providing strategic market and product planning and management for our offerings. Supporting these marketing plans, we participate in major trade shows relevant to the offerings globally and ensure adequate visibility to our offerings and solutions through a comprehensive print and on-line advertising and publicity program. We believe that, since 2009, we have built Catalent into a strong brand with high overall awareness in our established markets and target customers, and that our brand identity has become a competitive advantage for us.
Global Accounts
We manage selected accounts globally due to their materiality and growth potential by establishing strategic plans, goals and targets. We recorded approximately 37% of our total revenue in fiscal 2013 from these global accounts. These accounts are assigned a dedicated business development professional with substantial industry experience. These account leaders, along with members of the executive leadership team, are responsible for managing and extending the overall account relationship. Growing sales, profitability, and increasing account penetration are key goals and are directly linked to compensation. Account leaders also work closely with the rest of the sales organization to ensure alignment around critical priorities for the accounts.
82
Table of Contents
Emerging, Specialty and Virtual Accounts
Emerging, specialty and virtual pharmaceutical and biotechnology companies are expected to be a critical driver of industry growth globally. Historically, many of these companies have chosen not to build a full infrastructure, but rather partner with other companies to produce their products. We expect them to continue to do so in the future, providing a critical source for future integrated solution demand. We expect to continue to increase our penetration of geographic clusters of emerging companies in North America, Europe, South America and Asia. We regularly use active pipeline and product screening and customer targeting to identify the optimal candidates for partnering based on product profiles, funding status, and relationships, to ensure that our technical sales specialists and field sales representatives develop custom solutions designed to address the specific needs of customers in the market.
Contractual Arrangements
We generally enter into a broad range of contractual arrangements with our customers, including agreements with respect to feasibility, development, supply, licenses, and quality. The terms of these contracts vary significantly depending on the offering and customer requirements. Some of our agreements may include a variety of revenue arrangements such as fee-for-service, royalties, profit-sharing and fixed fees. We generally secure pricing and contract mechanisms in our supply agreements that allow for periodic resetting of pricing terms and, in some cases, these agreements provide for our ability to renegotiate pricing in the event of certain price increases for the raw materials utilized in the products we make. Our typical supply agreements include indemnification from our customers for product liability and intellectual property matters and caps on our contractual liabilities, subject in each case to negotiated exclusions. In addition, our manufacturing supply agreement terms range from three to ten years with regular renewals of one to three years, although some of our agreements are terminable upon much shorter notice periods, such as 30 or 90 days. For our development solutions offerings, we may enter into master service agreements, which provide for standardized terms and conditions and make it easier and faster for customers with multiple development needs to access our offerings.
Backlog
While we generally have long-term supply agreements that provide for a revenue stream over a period of years, our backlog represents, as of a point in time, future service revenues from work not yet completed. For our Oral Technologies segment and Medication Delivery Solutions segment, backlog represents firm orders for manufacturing services and includes minimum volumes, where applicable. For our Development and Clinical Services segment, backlog represents estimated future service revenues from work not yet completed under signed contracts. Using these methods of reporting backlog, as of March 31, 2014, backlog was approximately $832.9 million, as compared to approximately $690.5 million as of March 31, 2013, including approximately $370.8 million and $284.2 million, respectively, related to our Development and Clinical Services segment. We expect to earn between $510 million and $525 million of revenue from the backlog in existence as of March 31, 2014 by the completion of the fiscal year ending June 30, 2014.
To the extent projects are delayed, the timing of our revenue could be affected. If a customer cancels an order, we may be reimbursed for the costs we have incurred. For orders that are placed inside a contractual firm period, we generally have a contractual right to payment in the event of cancellation. Fluctuations in our reported backlog levels also result from the timing and order pattern of our customers who often seek to manage their level of inventory on hand. Because of customer ordering patterns, our backlog reported for certain periods may fluctuate and may not be indicative of future results.
Manufacturing Capabilities
We operate manufacturing facilities, development centers and sales offices throughout the world. We have twenty-seven facilities on five continents with 4.6 million square feet of manufacturing, lab and related space. Our manufacturing capabilities include the full suite of competencies relevant to support each site’s activities, including regulatory, quality assurance and in-house validation.
83
Table of Contents
We operate our plants in accordance with cGMP. More than half of our facilities are registered with the FDA, with the remaining facilities being registered with other applicable regulatory agencies, such as the EMA. In some cases certain facilities are registered with multiple regulatory agencies.
We have invested approximately $354.7 million of cash outflows in our manufacturing facilities since fiscal 2011 through improvements and expansions in our facilities including approximately $122.5 million on capital expenditures in fiscal 2013. We believe that our facilities and equipment are in good condition, are well maintained and are able to operate at or above present levels for the foreseeable future, in all material respects.
Our manufacturing operations are focused on employee health and safety, regulatory compliance, operational excellence, continuous improvement, and process standardization across the organization. In fiscal 2013, we achieved approximately 99% on-time shipment delivery versus customer request date across our network as a result of this focus. Our manufacturing operations are structured around an enterprise management philosophy and methodology that utilizes principles and tools common to a number of quality management programs including Six Sigma and Lean Manufacturing.
Raw Materials
We use a broad and diverse range of raw materials in the design, development and manufacture of our products. This includes, but is not limited to key materials such as gelatin, starch, and iota carrageenan for the Oral Technologies segment; packaging films for our Development & Clinical Services segment, and resin for our blow-fill-seal business in our Medication Delivery Solutions segment. The raw materials that we use are sourced externally on a global basis. Globally, our supplier relationships could be interrupted due to natural disasters and international supply disruptions, including those caused by pandemics, geopolitical and other issues. For example, the supply of gelatin is obtained from a limited number of sources. In addition, much of the gelatin we use is bovine-derived. Past concerns of contamination from Bovine Spongiform Encephalopathy (“BSE”) have narrowed the number of possible sources of particular types of gelatin. If there were a future disruption in the supply of gelatin from any one or more key suppliers, there can be no assurance that we could obtain an alternative supply from our other suppliers. If future restrictions were to emerge on the use of bovine-derived gelatin from certain geographic sources due to concerns of contamination from BSE, any such restriction could hinder our ability to timely supply our customers with products and the use of alternative non-bovine-derived gelatin for specific customer products could be subject to lengthy formulation, testing and regulatory approval.
We work very closely with our suppliers to assure continuity of supply while maintaining excellence in material quality and reliability, and we have an active and effective supplier audit program. We continually evaluate alternate sources of supply, although we do not frequently pursue regulatory qualification of alternative sources for key raw materials due to the strength of our existing supplier relationships, the reliability of our current supplier base and the time and expense associated with the regulatory process. Although a change in suppliers could require significant effort or investment by us in circumstances where the items supplied are integral to the performance of our products or incorporate specialized material such as gelatin, we do not believe that the loss of any existing supply arrangement would have a material adverse effect on our business. See “Risk Factors—Risks Relating to Our Business and Industry—Our future results of operations are subject to fluctuations in the costs, availability, and suitability of the components of the products we manufacture, including active pharmaceutical ingredients, excipients, purchased components, and raw materials.”
Competition
We compete on several fronts both domestically and internationally, including with other companies that offer advanced delivery technologies or development services to pharmaceutical, biotechnology and consumer health companies based in North America, South America, Europe and the Asia-Pacific region. We also may compete with the internal operations of those pharmaceutical, biotechnology and consumer health manufacturers that choose to source these services internally, where possible.
84
Table of Contents
Competition is driven by proprietary technologies and know-how (where relevant), consistency of operational performance, quality, price, value and speed. While we do have competitors who compete with us in our individual offerings, we do not believe we have competition from any directly comparable companies.
Employees
As of March 31, 2014, we had approximately 8,000 employees in 27 facilities on five continents: eight facilities are in the United States, with certain employees at one facility being represented by a labor organization with their terms and conditions of employment being subject to a collective bargaining agreement. National works councils and/or labor organizations are active at all eleven of our European facilities consistent with labor environments/laws in European countries. Similar relationships with labor organizations or national works councils exist in our plants in Argentina, Brazil, and Australia. Our management believes that our employee relations are satisfactory.
| North America | Europe | South America | Asia Pacific | Total | ||||||||||||||||
| Approximate Number of Employees |
3,000 | 3,400 | 1,000 | 600 | 8,000 | |||||||||||||||
Intellectual Property
We rely on a combination of know-how, trade secrets, patents, copyrights and trademarks and other intellectual property laws, nondisclosure and other contractual provisions and technical measures to protect a number of our offerings, services and intangible assets. These proprietary rights are important to our ongoing operations. We operate under licenses from third parties for certain patents, software and information technology systems and proprietary technologies and in certain instances we license our technology to third parties. We also have a long track record of innovation across our lines of business and, to further encourage active innovation, we have developed incentive compensation systems linked to patent filings and other recognition and reward programs for scientists and non-scientists alike.
We have applied in the United States and certain foreign countries for registration of a number of trademarks, service marks and patents, some of which have been registered and issued, and also hold common law rights in various trademarks and service marks. We hold approximately 1,300 patents and patent applications worldwide in advanced drug delivery and biologics formulations and technologies, and manufacturing and other areas.
We hold patents and license rights relating to certain aspects of our formulations, nutritional and pharmaceutical dosage forms, mammalian cell engineering, and sterile manufacturing services. We also hold patents relating to certain processes and products. We have a number of pending patent applications in the United States and certain foreign countries, and intend to pursue additional patents as appropriate. We have enforced and will continue to enforce our intellectual property rights in the United States and worldwide.
We do not consider any particular patent, trademark, license, franchise or concession to be material to our overall business.
Regulatory Matters
The manufacture, distribution and marketing of the products of our customers in this industry are subject to extensive ongoing regulation by the FDA, other government authorities and foreign regulatory authorities. Certain of our subsidiaries may be required to register for permits and/or licenses with, and will be required to comply with operating and security standards of, the Drug Enforcement Agency (“DEA”), the FDA, the Department of Health and Human Services (“DHHS”), the European Union (“EU”) member states and various state boards of pharmacy, state health departments and/or comparable state agencies as well as foreign agencies, and certain accrediting bodies depending upon the type of operations and location of product distribution, manufacturing and sale.
85
Table of Contents
In addition, certain of our subsidiaries may be subject to the United States Federal Food, Drug, and Cosmetic Act, The Public Health Service Act, the Controlled Substances Act and comparable state and foreign regulations, and the Needlestick Safety and Prevention Act.
Laws regulating the manufacture and distribution of products also exist in most other countries where our subsidiaries conduct business. In addition, the international manufacturing operations are subject to local certification requirements, including compliance with domestic and/or foreign good manufacturing practices and quality system regulations established by the FDA and/or applicable foreign regulatory authorities.
We are also subject to various federal, state, local, foreign and transnational laws, regulations and recommendations, both in the United States and abroad, relating to safe working conditions, laboratory and manufacturing practices and the use, transportation and disposal of hazardous or potentially hazardous substances. In addition, U.S. and international import and export laws and regulations require us to abide by certain standards relating to the importation and exportation of finished goods, raw materials and supplies and the handling of information. We are also subject to certain laws and regulations concerning the conduct of our foreign operations, including the U.S. Foreign Corrupt Practices Act, the U.K. Anti-Bribery Act and other anti-bribery laws and laws pertaining to the accuracy of our internal books and records.
The costs associated with complying with the various applicable federal regulations, as well as state, local, foreign and transnational regulations, could be significant and the failure to comply with such legal requirements could have an adverse effect on our results of operations and financial condition. See “Risk Factors—Risks Relating to Our Business and Industry—Failure to comply with existing and future regulatory requirements could adversely affect our results of operations and financial condition.” for additional discussion of the costs associated with complying with the various regulations.
In fiscal 2013, we underwent 38 regulatory audits and, over the last five fiscal years, we have successfully completed more than 200 regulatory audits with more than 50% resulting in no reported observations.
Quality Assurance
We are committed to ensuring and maintaining the highest standard of regulatory compliance while providing high quality products to our customers. To meet these commitments, we have developed and implemented a Catalent wide quality management system throughout the organization that is appropriate. We have more than 1,000 employees around the globe focusing on quality and regulatory compliance. Our senior management team is actively involved in setting quality policies, standards and internal position papers as well as managing internal and external quality performance. Our quality assurance department provides quality leadership and supervises our quality systems programs. An internal audit program monitors compliance with applicable regulations, standards and internal policies. In addition, our facilities are subject to periodic inspection by the FDA and other equivalent local, state and foreign regulatory authorities and customers. All FDA, DEA and other regulatory inspectional observations have been resolved or are on track to be completed at the prescribed timeframe provided in response to the agency. We believe that our operations are in compliance in all material respects with the regulations under which our facilities are governed.
Environmental Matters
Our operations are subject to a variety of environmental, health and safety laws and regulations, including those of the Environmental Protection Agency (“EPA”) and equivalent state, local and foreign regulatory agencies in each of the jurisdictions in which we operate. These laws and regulations govern, among other things, air emissions, wastewater discharges, the use, handling and disposal of hazardous substances and wastes, soil and groundwater contamination and employee health and safety. Our manufacturing facilities use, in varying degrees, hazardous substances in their processes. These substances include, among others, chlorinated solvents, and in the past chlorinated solvents were used at one or more of our facilities, including a number we no longer own or operate. As at our current facilities, contamination at such formerly owned or operated properties can result and has resulted in liability to us, for which we have recorded appropriate reserves as needed.
86
Table of Contents
Legal Proceedings
Beginning in November 2006, we, along with several pharmaceutical companies, have been named in approximately 380 civil lawsuits. These lawsuits were filed by individuals allegedly injured by their use of the prescription acne medication Amnesteem®, a branded generic form of isotretinoin, and in some instances of isotretinoin products made and/or sold by other firms as well. All but one of these lawsuits have been dismissed or settled. We were not required to make any contribution toward any settlement to date. While it is not possible to determine the ultimate outcome of this legal proceeding, including making a determination of liability, we believe that we have meritorious defenses with respect to the claims asserted against us and intend to vigorously defend our position.
From time to time, we may be involved in legal proceedings arising in the ordinary course of business, including, without limitation, inquiries and claims concerning environmental contamination as well as litigation and allegations in connection with acquisitions, product liability, manufacturing or packaging defects and claims for reimbursement for the cost of lost or damaged active pharmaceutical ingredients, the cost of which could be significant. We intend to vigorously defend ourselves against such other litigation and do not currently believe that the outcome of any such other litigation will have a material adverse effect on our financial statements. In addition, the healthcare industry is highly regulated and government agencies continue to scrutinize certain practices affecting government programs and otherwise.
From time to time, we receive subpoenas or requests for information from various government agencies, including from state attorneys general and the U.S. Department of Justice relating to the business practices of customers or suppliers. We generally respond to such subpoenas and requests in a timely and thorough manner, which responses sometimes require considerable time and effort and can result in considerable costs being incurred by us. We expect to incur additional costs in the future in connection with existing and future requests.
87
Table of Contents
Directors and Executive Officers
The following table sets forth the names, ages and positions of our directors and the executive officers of our subsidiary, Catalent Pharma Solutions, Inc., as of March 31, 2014. We expect to add additional independent directors prior to the completion of this offering. Upon completion of this offering, the executive officers of Catalent Pharma Solutions, Inc. will also become our executive officers.
| Name |
Age |
Position | ||
| John R. Chiminski |
50 | President & Chief Executive Officer and Director | ||
| Matthew Walsh |
47 | Executive Vice President and Chief Financial Officer | ||
| Scott Houlton |
46 | President, Development and Clinical Services | ||
| Aris Gennadios |
48 | President, Softgel Technologies | ||
| Barry Littlejohns |
48 | President, Advanced Delivery Technologies | ||
| William Downie |
47 | Senior Vice President, Global Marketing & Sales | ||
| Sharon Johnson |
49 | Senior Vice President, Global Quality and Regulatory Affairs | ||
| Samrat S. Khichi |
46 | Senior Vice President, Chief Administrative Officer, General Counsel and Secretary | ||
| Stephen Leonard |
51 | Senior Vice President, Global Operations | ||
| Kurt Nielsen |
46 | Senior Vice President, Innovation & Growth and Chief Technology Officer | ||
| Lance Miyamoto |
58 | Senior Vice President, Human Resources | ||
| Chinh E. Chu |
47 | Director | ||
| Bruce McEvoy |
36 | Director | ||
| James Quella |
63 | Director | ||
| Melvin D. Booth |
68 | Director | ||
| Jack Stahl |
61 | Director Nominee | ||
| Rolf Classon |
68 | Director Nominee |
John R. Chiminski has led Catalent as President and Chief Executive Officer since March 2009. Mr. Chiminski brings to Catalent a diversified business background that includes lean manufacturing, supply chain, research and development, customer service, and global business management, with a focus on customers and growth. He joined Catalent after more than 20 years of experience at GE Healthcare in engineering, operations, and senior leadership roles. From 2007 to 2009, Mr. Chiminski was President and Chief Executive Officer of GE Medical Diagnostics, a global business with sales of $1.9 billion. From 2005 to 2007, he served as Vice President and General Manager of GE Healthcare’s Global Magnetic Resonance Business, and from 2001 to 2005, as Vice President and General Manager of Global Healthcare Services. Earlier at GE, he held a series of cross-functional leadership positions in both manufacturing and engineering, including a GE Medical Systems assignment in France. Mr. Chiminski holds a BS from Michigan State University and an M.S. from Purdue University, both in electrical engineering, as well as a Master in Management degree from the Kellogg School of Management at Northwestern University. He is on the Board of Trustees for the HealthCare Institute of New Jersey, and is also a director of DJO Global, Inc.
Matthew Walsh has served as our Executive Vice President and Chief Financial Officer since December 2012. Previously, Mr. Walsh served as our Senior Vice President and Chief Financial Officer since April 2008. Prior to joining the Company, Mr. Walsh served as President and Chief Financial Officer of Escala Group, Inc., a global collectibles network and precious metals trader. From 1996 through 2006, Mr. Walsh held positions of increasing responsibility in corporate development, accounting and finance at diversified industrial manufacturer GenTek, Inc., culminating in his appointment as Vice President and Chief Financial Officer. Prior to GenTek, he served in corporate development and other roles in banking and the chemicals industry. Mr. Walsh received a B.S. in chemical engineering and an MBA from Cornell University and is a CFA® charter holder.
88
Table of Contents
Scott Houlton has served as our Group President, Development and Clinical Services since August 2009. Previously, Mr. Houlton was most recently Chief Operating Officer of Aptuit, Inc., responsible for Scientific Operations, Business Process Improvement, Human Resources, Clinical Operations and Capital Development and served as a director for Aptuit Laurus, Inc. Prior to Aptuit, Mr. Houlton held a variety of leadership roles in other companies including Vice President of Clinical Supplies at Quintiles Transnational Corporation. Earlier in his career, he was with Cardinal Health, Inc. where he served as Director of International Business Development. Mr. Houlton holds a B.S. degree in Business Administration from The Ohio State University.
Aris Gennadios has served as our President, Softgel Technologies since September 2013. Previously, Dr. Gennadios served as Vice President and General Manager of Softgel Technologies. Dr. Gennadios has worked in the pharmaceutical industry since 1996 in roles including R&D, field sales, business development and leadership. He joined Catalent’s predecessor company, Cardinal Health, in 2002 and has held several key leadership posts within the softgel technologies business including Global Vice President of Business Development for Softgel Technologies, General Manager of the Oral Development Center in Somerset, NJ, and Vice President and General Manager for Rx Softgel and Consumer Health products. Dr. Gennadios earned his bachelor’s degree in chemical engineering from the National Technical University of Athens, Greece and his master’s degree in biological engineering from Clemson University. Dr. Gennadios holds a doctorate in engineering from the University of Nebraska and an MBA from Wake Forest University.
Barry Littlejohns was named President, Advanced Delivery Technologies in July 2013. Previously, Mr Littlejohns led Catalent’s Medication Delivery Solutions business from July 2011 to July 2013. Mr. Littlejohns has an extensive background in leading international life science businesses in both US and European organizations. He rejoins Catalent after two years as Senior Vice President of Operations and Business Development at Danish biotechnology company Genmab, where his responsibilities included strategic licensing and manufacturing oversight. Prior to Genmab, he served in a broad range of leadership roles at Catalent. These include Vice President of Global Business Operations, Vice President of Commercial Affairs for Medication Delivery Solutions, Vice President and General Manager of Injectables, and various financial, operational and leadership roles. He joined Catalent in 1989 when it was formerly the RP Scherer Corporation. Mr. Littlejohns has two degrees in business and finance from Swindon, UK.
William Downie has served as Senior Vice President, Global Sales & Marketing since June 2010. Mr. Downie joined Catalent as Group President, Medication Delivery Solutions, and Senior Vice President, Global Sales & Marketing in October 2009. Prior to joining Catalent, Mr. Downie served as Vice President and Global Leader of Molecular Imaging at GE Healthcare. Before that, he held several executive positions in other GE Healthcare units, including Vice President and General Manager, Medical Diagnostics-Europe, Middle East and Africa, and Vice President of Sales for Medical Diagnostics-Europe. Prior to GE Healthcare, Mr. Downie was with Innovex UK Limited (part of Quintiles, Inc.), where he held several positions in operations and sales/marketing. Earlier in his career, he held leadership positions with Sanofi-Synthelabo UK; Sanofi-Winthrop Limited; and Merck & Co., Inc. Mr. Downie holds a Bachelor of Science degree in biochemistry from the University of Edinburgh.
Sharon Johnson has served as our Senior Vice President, Global Quality and Regulatory Affairs since August 1, 2009. Previously, Ms. Johnson was most recently Vice President of Quality for GE Healthcare, Medical Diagnostics in Buckinghamshire, England. Prior to GE, she was Quality Director for Baxter Healthcare’s Europe operations for four years. Before that, she was with Rhone Poulenc Rorer as Quality Manager for Sterile Products and Microbiology in Essex, England. Earlier in her career, Ms. Johnson held Quality and Microbiology positions with Berk Pharmaceuticals in East Sussex, England and Medicines Testing Laboratory in Edinburgh, Scotland. Ms. Johnson holds a Post Graduate Diploma in Industrial Pharmaceutical Studies with Distinction from Brighton University and holds a B.S. Honours Degree in Biological Sciences/ Microbiology from North East Surrey College of Technology.
Samrat (“Sam”) Khichi has served as our Senior Vice President, General Counsel and Secretary since October 2007. In 2011 Mr. Khichi was also named Chief Administrative Officer. Previously Mr. Khichi was
89
Table of Contents
Counsel in the Mergers and Acquisitions and Private Equity Group at O’Melveny & Myers. Prior to O’Melveny & Myers, Mr. Khichi was appointed by President George W. Bush to serve as a White House Fellow. Prior to his appointment, Mr. Khichi was also an attorney in the Mergers and Acquisitions practice group of Shearman & Sterling and McDermott Will & Emery. Mr. Khichi’s military service includes service as an active duty field artillery officer in the U.S. Army, a reserve Lieutenant Commander, U.S. Navy and a Captain in the NJ Army National Guard. Mr. Khichi was the Deputy Director of the NY/NJ High Intensity Drug Trafficking Area while serving in NJ Army National Guard Counter Drug Program. Mr. Khichi holds a Bachelor of Science from Georgetown University, a M.B.A. from the Northwestern University’s Kellogg School of Management and a J.D. cum laude and Order of the Coif from Fordham University School of Law. On April 28, 2014, Mr. Khichi notified us of his decision to leave the Company effective July 21, 2014 to serve as Senior Vice President, General Counsel and Corporate Secretary of a multinational public company.
Stephen Leonard has served as our Senior Vice President of Global Operations since June 2009. Previously, Mr. Leonard was most recently General Manager of Global Operations for GE Healthcare’s Medical Diagnostics business, responsible for more than 10 sites in Europe, Asia and the Americas. Earlier assignments in his 22 years at GE included a variety of leadership roles, with responsibility for areas such as plant management, global sourcing and supply chain, global product quality, and global operations. Mr. Leonard received his B.S. degree in Mechanical Engineering from Drexel University.
Kurt Nielsen has served as our Chief Technology Officer and Senior Vice President—Innovation and Growth since February 2010. Prior to joining Catalent, Mr. Nielsen was with URLMutual Pharmaceutical Company in Pennsylvania as Executive Vice President—Pharmaceuticals. In his role at URLMutual, Mr. Nielsen devised the strategy and led the execution for activities in the company’s new product portfolio, employing a variety of business arrangements. Prior to that role, he was Vice President of R&D. Before joining URLMutual, Mr. Nielsen held executive positions with TEVA Pharmaceuticals USA; McNeil Consumer Products; Energy Biosystems, Inc.; Bachem Bioscience; and Hercules, Inc., Arco Chemical Company, and Chubb National Foam. He holds a Ph.D. in Chemistry from Villanova University and a B.S. in Chemistry from University of Delaware.
Lance Miyamoto was named Senior Vice President of Human Resources of Catalent in March 2011. Mr. Miyamoto has more than 25 years of experience in delivering HR systems including compensation and career structures that drive business results and growth. In addition to general HR expertise and organization development, he has experience leading in a global environment and has managed global company turnarounds, mergers and acquisitions. Prior to his own consulting business, Mr. Miyamoto held a number of HR leadership roles in other companies, including Executive Vice President of Comverse Technology Inc. He also served as Executive Vice President of HR for AOL LLC, a division of Time Warner, from 2004 to 2007. From 2001 to 2004, Mr. Miyamoto was Executive Vice President of HR for Lexis-Nexis, a $2.2 billion division of Reed Elsevier. He was also a senior executive with Dun and Bradstreet with responsibility for performance development. Mr. Miyamoto is a graduate of Harvard University, and holds an M.B.A. from the Wharton School of the University of Pennsylvania where he was a COGME (Council for Graduate Management Education) Fellow.
Chinh E. Chu has been a director since April 2007. Mr. Chu is a Senior Managing Director in the Corporate Private Equity group of The Blackstone Group. Mr. Chu has led Blackstone’s investment in Stiefel Laboratories, ReAble Therapeutics’ acquisition of DJ Orthopedics, Biomet, Alliant, ReAble Therapeutics, Celanese, Nalco, SunGard Data Systems, Nycomed, and LIFFE. He has also been involved in Blackstone’s investments in FGIC, Graham Packaging, Sirius Satellite Radio, StorageApps, Haynes International, Prime Succession/Rose Hills, Interstate Hotels, HFS and Alco Holdings. Before joining Blackstone in 1990, Mr. Chu worked at Salomon Brothers in the Mergers & Acquisitions Department. Mr. Chu received a B.S. in Finance from the University of Buffalo, where he graduated summa cum laude. He currently serves as a Director of Healthmarkets, DJO Global Inc., Bluestar, Freescale and Biomet.
Bruce McEvoy has been a director since April 2007. Mr. McEvoy is a Managing Director at The Blackstone Group. Before joining Blackstone in 2006, Mr. McEvoy worked as an Associate at General Atlantic from 2002 to
90
Table of Contents
2004, and was a consultant at McKinsey & Company from 1999 to 2002. Mr. McEvoy received an MBA from Harvard Business School in 2006. Mr. McEvoy currently serves on the boards of directors of GCA Services, Performance Food Group, RGIS Inventory Services, Sea World Parks and Entertainment and Vivint.
James Quella has been a director since December 2009. Mr. Quella was a Senior Managing Director and Senior Operating Partner in the Corporate Private Equity group of The Blackstone Group until June 30, 2013. Mr. Quella was responsible for monitoring the strategy and operational performance of Blackstone portfolio companies and providing direct assistance in the oversight of large investments. He was also a member of the firm’s Private Equity Investment Committee. Currently, James serves as a Senior Advisor to the Private Equity Group of Blackstone and continues to be involved in a few key portfolio companies as a board member and executive advisor, as well as participating in selected portfolio review processes and due diligence. Prior to joining Blackstone in 2004, Mr. Quella was a Managing Director and Senior Operating Partner with DLJ Merchant Banking Partners-CSFB Private Equity. Prior to that, Mr. Quella worked at Mercer Management Consulting and Strategic Planning Associates, its predecessor firm, where he served as a senior consultant to CEOs and senior management teams, and was Co-Vice Chairman with shared responsibility for overall management of the firm. Mr. Quella received a BA in International Studies from the University of Chicago/University of Wisconsin-Madison and an MBA with dean’s honors from the University of Chicago. He is also the co-author of Profit Patterns: 30 Ways to Anticipate and Profit from the Strategic Forces Reshaping Your Business. Mr. Quella has been a member of various private equity company boards and currently, in addition to Catalent, serves as a Director of Freescale Semiconductor, Michaels Stores, Inc., and DJO Global.
Melvin D. Booth has been a member of the board of directors of our subsidiary, Catalent Pharma Solutions, Inc. since July 2010. Most recently, Mr. Booth served as President and Chief Operating Officer of Medimmune, Inc. from 1998 through his retirement in 2003, and as a Director from 1998 through 2005. Prior to that, Mr. Booth was President, Chief Operating Officer and Director of Human Genome Sciences, Inc. from 1995 to 1998. Mr. Booth also served in a variety of senior leadership positions for Syntex Inc., including leading both Syntex Laboratories, Inc. and Syntex Pharmaceuticals Pacific. Mr. Booth also served as Lead Director for Millipore Corporation until its recent acquisition by Merck KGaA, and currently serves on the board of Ventria BioScience, Chairman of the Board for Mallinckrodt plc, Chairman of the Board for ERT (Electronic Research Technologies) and as a strategic advisor in life sciences for Genstar Capital. Mr. Booth holds an undergraduate degree and an honorary Ph.D. in Science from the Northwest Missouri State University.
Jack Stahl is a nominee to our board of directors. Mr. Stahl was the President and Chief Executive Officer of Revlon Inc. from 2002 until his retirement in 2006. Prior to joining Revlon, Mr. Stahl served as President and Chief Operating Officer of Coca-Cola Company from 2000 to 2001. He also served in various management positions at Coca-Cola from 1979 prior to becoming President and Chief Operating Officer. Mr. Stahl currently serves on the boards of Coty Inc., Delhaize Group, Dr Pepper Snapple Group and the U.S. Board of Advisors of CVC Capital. Mr. Stahl holds a bachelor’s degree in economics from Emory University and a master’s degree from the Wharton School of Business at the University of Pennsylvania.
Rolf Classon is a nominee to our board of directors. From October 2002 until his retirement in July 2004, Mr. Classon was Chairman of the Executive Committee of Bayer HealthCare AG, a subsidiary of Bayer AG. He served as President of Bayer Diagnostics from 1995 and 2002 and as Executive Vice President of Bayer Diagnostics from 1991 to 1995. Prior to 1991, Mr. Classon held various management positions with Pharmacia Corporation. Mr. Classon currently serves as Chairman of the Board of Directors of Auxilium Pharmaceuticals, Inc. and served as Vice Chairman from March 2005 to April 2005. Mr. Classon also currently serves as Chairman of the Board of Directors of Hill-Rom Corporation, where he also served as interim chief executive officer from May 2005 until March 2006. Mr. Classon currently serves as Chairman of the Board of Directors of Tecan Group Ltd. and as a member of the Board of Directors of Fresenius Medical Care. Mr. Classon previously served as a director of Millipore Corporation from December 2005 until July 2010, Prometheus Laboratories Inc. from September 2004 until 2010 and Enzon Pharmaceuticals Inc. from January 1997 until 2011. Mr. Classon received his Chemical Engineering Certificate from the Gothenburg School of Engineering and a Business Degree from the Gothenburg University.
91
Table of Contents
Our executive officers are appointed by, and serve at the discretion of, our board of directors. Our directors serve until their successor is duly elected and qualified, or until their resignation or removal. There are no family relationships between our directors and executive officers.
There are no family relationships among any of our directors or executive officers.
Our Corporate Governance
We have structured our corporate governance in a manner we believe closely aligns our interests with those of our stockholders. Notable features of our corporate governance include:
| • | Blackstone has advised us that, when it ceases to own a majority of our common stock, it will ensure that its employees will no longer constitute a majority of our board of directors; |
| • | our board of directors will be divided into three classes of directors, with the classes to be as nearly equal in number as possible, and with the directors serving three-year terms; |
| • | we will have independent director representation on our audit, compensation and nominating and corporate governance committees immediately at the time of the offering, and our independent directors will meet regularly in executive sessions without the presence of our corporate officers or non-independent directors; |
| • | we anticipate that at least one of our directors will qualify as an “audit committee financial expert” as defined by the SEC; and |
| • | we will implement a range of other corporate governance best practices, including placing limits on the number of directorships held by our directors to prevent “overboarding” and implementing a robust director education program. |
Composition of the Board of Directors after this Offering
Prior to the completion of this offering, we expect that , two additional independent directors, will be elected to our board of directors.
Our business and affairs are managed under the direction of our board of directors. In connection with this offering, we will amend and restate our certificate of incorporation to provide for a classified board of directors, with directors in Class I (expected to be ), directors in Class II (expected to be ) and directors in Class III (expected to be ). See “Description of Capital Stock—Anti-Takeover Effects of our Amended and Restated Certificate of Incorporation and Amended and Restated Bylaws and Certain Provisions of Delaware Law—Classified Board of Directors.” In addition, we intend to enter into a shareholders agreement with certain affiliates of Blackstone and other stockholders in connection with this offering. This agreement will grant Blackstone the right to designate nominees to our board of directors subject to the maintenance of certain ownership requirements in us. See “Certain Relationships and Related Party Transactions—Catalent, Inc. Shareholders Agreement.”
Background and Experience of Directors
When considering whether our directors have the experience, qualifications, attributes and skills, taken as a whole, to enable the board of directors to satisfy its oversight responsibilities effectively in light of our business and structure, the board of directors focused primarily on the information discussed in each of the board members’ or nominees’ biographical information set forth above. Each of our directors possesses high ethical standards, acts with integrity and exercises careful, mature judgment. Each is committed to employing their skills and abilities to aid the long-term interests of our stakeholders. In addition, our directors are knowledgeable and experienced in one or more business or civic endeavors, which further qualify them for service as members of our board of directors. Each of Messrs. Chu, McEvoy and Quella possesses experience in owning and managing businesses and are familiar with corporate finance and strategic business planning activities that are unique to highly-leveraged companies like us. Mr. Stahl has leadership experience with other public companies and has
92
Table of Contents
experience serving as a director. Finally, many of our directors possess substantial expertise in advising and managing companies in various segments of the healthcare industry. In particular, Mr. Chu is experienced in management, having been involved in numerous Blackstone investments, including investments in the healthcare industry, such as the Stiefel Laboratories investment and the ReAble Therapeutics’ acquisition of DJ Orthopedics. Mr. McEvoy has experience in the healthcare industry, serving as a director of DJO Incorporated, formerly known as ReAble Therapeutics. Mr. Quella is also familiar with the healthcare industry, serving as a director of Vanguard Health Systems. With respect to Mr. Booth, the board of directors considered his accounting expertise as a certified public accountant and his extensive experience in the biopharmaceutical industry, having served as the President and Chief Operating Officer, and as a director, of Medimmune, Inc. Mr. Classon has extensive experience as both an executive and a director of several global pharmaceutical companies. Finally, with regards to Mr. Chiminski, our board of directors considered his significant experience in the healthcare industry gained through his twenty-one year tenure at GE Healthcare and his service as our President & Chief Executive Officer with responsibility for the day-to-day oversight of our business operations.
Controlled Company Exception
After the completion of this offering, affiliates of Blackstone who are party to the shareholders agreement will continue to beneficially own shares representing more than 50% of the voting power of our shares eligible to vote in the election of directors. As a result, we will be a “controlled company” within the meaning of corporate governance standards. Under these corporate governance standards, a company of which more than 50% of the voting power is held by an individual, group or another company is a “controlled company” and may elect not to comply with certain corporate governance standards, including the requirements (1) that a majority of our board of directors consist of independent directors, (2) that our board of directors have a compensation committee that is comprised entirely of independent directors with a written charter addressing the committee’s purpose and responsibilities and (3) that our board of directors have a nominating and corporate governance committee that is comprised entirely of independent directors with a written charter addressing the committee’s purpose and responsibilities. For at least some period following this offering, we may utilize these exemptions. As a result, although we will have a fully independent audit committee within one year following this offering and we will have independent director representation on our compensation and nominating and corporate governance committees upon the closing of this offering, immediately following this offering the majority of our directors may not be independent and our compensation committee or nominating and corporate governance committee may not be comprised entirely of independent directors. Accordingly, although we may have fully independent compensation and nominating and corporate governance committees prior to the time we cease to be a “controlled company,” for such period of time you may not have the same protections afforded to stockholders of companies that are subject to all of these corporate governance requirements. In the event that we cease to be a “controlled company” and our shares continue to be listed on the New York Stock Exchange, we will be required to comply with these provisions within the applicable transition periods.
Committees of the Board of Directors
Our board of directors has an audit committee, a compensation committee and a nominating and corporate governance committee, each of which will have the composition and responsibilities described below. Our board of directors may also establish from time to time any other committees that it deems necessary or desirable.
Audit Committee
Upon completion of this offering, we expect our audit committee will consist of and , with serving as chair. and qualify as independent directors under the governance standards and the independence requirements of Rule 10A-3 of the Exchange Act. The audit committee has oversight responsibilities regarding:
| • | the adequacy and integrity of our financial statements and our financial reporting and disclosure practices; |
93
Table of Contents
| • | the soundness of our system of internal controls regarding finance and accounting compliance; |
| • | the annual independent audit of our consolidated financial statements; |
| • | the independent registered public accounting firm’s qualifications and independence; |
| • | the engagement of the independent registered public accounting firm; |
| • | the performance of our internal audit function and independent registered public accounting firm; |
| • | our compliance with legal and regulatory requirements in connection with the foregoing; and |
| • | compliance with our Code of Conduct. |
The audit committee shall also prepare the report of the committee required by the rules and regulations of the SEC to be included in our annual proxy statement.
Compensation Committee
Upon completion of this offering, we expect our compensation committee will consist of and , with serving as chair. The compensation committee is authorized to discharge the board’s responsibilities relating to:
| • | the establishment, maintenance and administration of compensation and benefit policies designed to attract, motivate and retain personnel with the requisite skills and abilities to contribute to our long term success; |
| • | the goals, objectives and compensation of our President and Chief Executive Officer, including evaluating the performance of the President and Chief Executive Officer in light of those goals; |
| • | the compensation of our other executives and non-management directors; |
| • | our compliance with the compensation rules, regulations and guidelines promulgated by , the SEC and other law, as applicable; and |
| • | the issuance of an annual report on executive compensation for inclusion in our annual proxy statement, once required. |
Nominating and Corporate Governance Committee
Upon completion of this offering, we expect our nominating and corporate governance committee will consist of , and , with serving as chair. The nominating and corporate governance committee is authorized to:
| • | advise the board concerning the appropriate composition of the board and its committees; |
| • | identify individuals qualified to become board members; |
| • | recommend to the board the persons to be nominated by the board for election as directors at any meeting of stockholders; |
| • | recommend to the board the members of the board to serve on the various committees of the board; |
| • | develop and recommend to the board a set of corporate governance guidelines and assist the board in complying with them; and |
| • | oversee the evaluation of the board, the board’s committees, and management. |
Compensation Committee Interlocks and Insider Participation
None of the members of our compensation committee has at any time been one of our executive officers or employees. None of our executive officers currently serves, or has served during the last completed fiscal year, on the compensation committee or board of directors of any other entity that has one or more executive officers serving as a member of our board of directors or compensation committee.
94
Table of Contents
Director Compensation
The following table provides summary information for fiscal 2013 concerning the compensation of the current members of our board of directors and for Mr. Booth, who is currently a director of our subsidiary, Catalent Pharma Solutions, Inc., and who is expected to join our board of directors in connection with this offering. The compensation paid to Mr. Chiminski, who became a member of our board of directors on March 17, 2009 and is our President and Chief Executive Officer, is presented in the Summary Compensation Table and the related explanatory tables. Our President and Chief Executive Officer is generally not entitled to receive additional compensation for his services as a director.
| Name |
Fees Earned or Paid In Cash ($)(1) |
Option Awards ($)(2)(3) |
Total ($) |
|||||||
| Bruce McEvoy(4) |
||||||||||
| James Quella(4) |
||||||||||
| Chinh Chu(4) |
||||||||||
| Melvin Booth |
125,000 | 125,000 | ||||||||
| (1) | Amount reported in the column reflects the annual retainer fee paid to Mr. Booth for services rendered in his capacity as a director of our subsidiary, Catalent Pharma Solutions, Inc. |
| (2) | None of our directors were granted options during fiscal 2013. |
| (3) | As of June 30, 2013, Mr. Booth held 725 unexercised options. |
| (4) | Employees of The Blackstone Group and its affiliates do not receive any compensation from us for their services on our board of directors. As described under “—Description of Director Compensation” below, in July 2013, as a result of Mr. Quella no longer being employed by The Blackstone Group, we approved an annual retainer for him and he was awarded 660 time-based vesting options which vest 20% per year on each of the first five anniversaries of the grant date, subject to his continued service. |
Description of Director Compensation
This section contains a description of the material terms of our compensation arrangements for Messrs. Booth and Quella. As employees of The Blackstone Group, Messrs. Chu and McEvoy do not receive any compensation from us for their services on our board of directors. All of our directors, including Messrs. Chu and McEvoy, are reimbursed for the out-of-pocket expenses they incur in connection with their service as directors.
Mr. Booth. In July 2010, we approved an annual retainer of $125,000 for Mr. Booth starting in fiscal 2011. Mr. Booth was granted an option to purchase 725 shares of our common stock on September 8, 2010 under the 2007 PTS Holdings Corp. Stock Incentive Plan (our stock incentive plan, which was adopted in 2007 prior to PTS Holdings Corp. being renamed Catalent, Inc. in January 2014) as part of his compensation. 100% of Mr. Booth’s options are time options, and they will ordinarily become vested and exercisable in five substantially equal installments on each of the first five anniversaries of the grant date, subject to his continued provision of services. Mr. Booth’s options will also become fully vested upon a change in control of the Company or BHP PTS Holdings L.L.C. (our indirect parent) and the portion of his options that would otherwise have vested within 12 months following a termination of service without cause or due to death or disability will become vested in connection with such a termination of service. Other than the vesting terms described in this paragraph, the other terms of Mr. Booth’s options are generally the same as described below for the Named Officers (other than Messrs. Chiminski and Walsh) under the heading “—Description of Equity-Based Awards.”
Mr. Quella. In July 2013, as a result of Mr. Quella no longer being employed by The Blackstone Group, we approved an annual retainer for him of $125,000 starting in fiscal 2014. Mr. Quella was also granted an option to purchase 660 shares of our common stock on July 11, 2013 under the 2007 PTS Holdings Corp. Stock Incentive Plan as part of his compensation. 100% of Mr. Quella’s options are time options, and they will ordinarily become vested and exercisable in five substantially equal installments on each of the first five anniversaries of the grant
95
Table of Contents
date, subject to his continued provision of services. Mr. Quella’s options will also become fully vested upon a change in control of the Company or BHP PTS Holdings L.L.C. and the portion of his options that would otherwise have vested within 12 months following a termination of service without cause or due to death or disability will become vested in connection with such a termination of service. Other than the vesting terms described in this paragraph, the other terms of Mr. Quella’s options are generally the same as described below for the Named Officers (other than Messrs. Chiminski and Walsh) under the heading “—Description of Equity-Based Awards.”
Following the completion of this offering, each director who is not employed by us or Blackstone will be entitled to compensation as follows:
| • | Cash retainer of $100,000, payable in quarterly installments in arrears; |
| • | Additional cash retainer payable in quarterly installments in arrears for serving on committees or as the chairperson of a committee as follows: |
| • | $15,000 annual chairman fee for the audit committee chairperson; |
| • | $10,000 annual chairman fee for each of the nominating and corporate governance committee chairperson and the compensation committee chairperson; and |
| • | $10,000 annual membership fee for audit committee members (other than the chairperson); and |
| • | $140,000 in the form of restricted stock units vesting in full after one year of service and subject to accelerated vesting in the event of a “change of control.” |
We will also adopt a stock ownership policy effective upon the consummation of this offering. Each of our non-employee directors (other than a director employed by The Blackstone Group) will be required to own stock in an amount equal to five times his or her annual cash retainer. For purposes of this requirement, a director’s holdings include shares held directly or indirectly, individually or jointly, shares underlying vested equity-based awards and shares held under a deferral or similar plan. Each non-employee director will be required to retain 100% of the shares received following exercise of options or upon settlement of vested restricted stock units (net of any shares used to satisfy any applicable tax withholding obligations) until such guidelines are met.
Executive Compensation
Compensation Discussion and Analysis
This section contains a discussion of the material elements of compensation awarded to, earned by or paid to our President and Chief Executive Officer, our Chief Financial Officer and each of our three other most highly compensated executive officers who served in such capacities at the end of our fiscal year on June 30, 2013, collectively known as the “Named Officers.”
Prior to this offering, our executive compensation program was determined and approved by the compensation committee of our subsidiary, Catalent Pharma Solutions, Inc. In connection with this offering, our board of directors will establish a compensation committee that will assume responsibility for establishing, maintaining and administering our compensation and benefit policies.
Except where the context requires otherwise, the terms “compensation committee” and “board of directors” as used in this “Executive Compensation” section refer to the board of directors and compensation committee of Catalent Pharma Solutions, Inc.
Over the course of the year our President and Chief Executive Officer provided written assessments of his performance against his specific annual performance goals and objectives to the board of directors at each quarterly meeting of the board of directors. The compensation committee then took into account the Chief Executive Officer’s recommendations regarding the compensatory arrangements for our executive officers other than himself. Our President and Chief Executive Officer provided the final compensation recommendations for
96
Table of Contents
our Named Officers (NEOs) to the compensation committee for review and approval. The other NEOs do not have any role in determining or recommending the form or amount of compensation paid to our NEOs. Our President and Chief Executive Officer was not a member of the compensation committee.
Executive Compensation Program Objectives and Overview
Our current executive compensation program is intended to achieve two fundamental objectives: (1) attract, motivate and retain high caliber talent; and (2) align executive compensation with achievement of our overall business goals, adherence to our core values and stockholder interests. In structuring our current executive compensation program, we are guided by the following basic philosophies:
Competitive Compensation. Our executive compensation program should provide a fair and competitive compensation opportunity that enables us to attract and retain high caliber executive talent. Executives should be appropriately rewarded for their contributions to our successful performance.
“Pay for Performance.” A significant portion of each executive’s compensation should be “at risk” and tied to overall company, business unit and individual performance.
Alignment with Stockholder Interests. Executive compensation should be structured to include variable elements that link executives’ financial rewards to stockholder return. The equity portion of each executive’s compensation should be significant.
As described in more detail below, the material elements of our executive compensation program for NEOs include base salary, cash bonus opportunities, a long-term equity incentive opportunity, a deferred compensation opportunity and other retirement benefits and welfare benefits. The NEOs may also receive severance payments and other benefits in connection with certain terminations of employment or a change in control of the Company or BHP PTS Holdings L.L.C. We believe that each element of our executive compensation program helps us to achieve one or more of our compensation objectives, as illustrated by the table below.
| Compensation Element |
Compensation Objectives Designed to be Achieved | |
| Base Salary | Attract, motivate and retain high caliber talent | |
| Cash Bonus Opportunity | Compensation “at risk” and tied to achievement of business goals and individual performance | |
| Long-Term Equity Incentive Opportunity | Align compensation with the creation of stockholder value and achievement of business goals | |
| Deferred Compensation Opportunity and Other Retirement Benefits | Attract, motivate and retain high caliber talent | |
| Severance and other Benefits Potentially Payable Upon Certain Terminations of Employment or a Change in Control | Attract, motivate and retain high caliber talent | |
| Welfare Benefits | Attract, motivate and retain high caliber talent | |
These individual compensation elements are intended to create a total compensation package for each NEO that we believe achieves our compensation objectives and provides competitive compensation opportunities.
Independent Compensation Consultant
As part of an executive compensation review, in fiscal 2013 our compensation committee retained Compensation Advisory Partners (“CAP”) as their independent executive compensation consultant. CAP provided our compensation committee with a comprehensive competitive review of each of our executive officers’ total direct compensation. CAP does not provide any other services to us and has not had any prior relationship with any of our executive officers.
97
Table of Contents
For the review, CAP developed a competitive peer group using compensation data from a combination of industry specific companies with median revenue of $2.2 billion along with a blend of general industry and industry specific survey data from several providers with revenue approximating $1.8 billion. The peer group companies consisted of the following companies: Watson Pharmaceuticals Inc., Forest Laboratories Inc, Hospira Inc., Perrigo Co., Covenance Inc., Steris Corp., West Pharmaceuticals Services Inc., Par Pharmaceuticals Companies Inc., and Patheon Inc. The survey providers included Mercer, Towers Watson, Radford, Kenexa, and SIRS. The peer group compensation data generally informed the compensation committee regarding competitive pay levels.
In connection with this offering, we have engaged Frederic W. Cook & Co., Inc., an independent compensation consulting firm, to assist in evaluating the elements and levels of our executive compensation. See “—Compensation Actions Taken in Fiscal 2014” below.
Employment Agreements
For retention purposes, we have entered into employment agreements with Messrs. Chiminski and Walsh. A full description of the material terms of these agreements is presented below in the narrative section following the Grants of Plan Based Awards in Fiscal 2013 table.
Executive Compensation Program Elements
Base Salaries
Base salaries are an important element of compensation because they provide the Named Officers with a base level of income. Generally our NEOs are eligible for an adjustment to their base salaries on an 18-month cycle. Adjustments may occur earlier or later depending on performance and market competitiveness. During fiscal 2013, in recognition of his performance, we adjusted Mr. Walsh’s salary. The Summary Compensation Table below shows the base salary paid to each NEO along with base salary adjustments, in the corresponding footnotes, during fiscal 2013.
Cash Bonus Opportunities
Annual Cash Bonus Opportunity
We sponsor a management incentive plan (the “MIP”), which is not set forth in a formal plan document. All of our NEOs are eligible to participate in the MIP. The primary purpose of the MIP is to focus management on key measures that drive financial performance and provide competitive bonus opportunities tied to the achievement of our financial and strategic growth objectives.
Fiscal 2013 MIP
A target annual bonus, expressed as a percentage of base salary (other than with respect to Mr. Chiminski, whose employment agreement provides for a target annual bonus of $1,000,000), is established within certain NEO’s employment agreements or offer letters and may be adjusted from time to time by the compensation committee in connection with an NEO’s promotion. The MIP award, which is a cash bonus, is tied to our overall financial results (the Business Performance Factor) and a combination of individual financial and/or strategic goals appropriate for each position (the Individual Performance Factor).
In fiscal 2012, the compensation committee accepted a recommendation by our senior management to make certain changes to the MIP formula for fiscal years beginning with fiscal 2013. The recommendations as they related to the NEOs were as follows: (1) the hurdle point at which the MIP pool begins to fund has been raised from 90% of achievement against financial targets to 95% achievement; and (2) the pre-established payout percentage scale has been adjusted only with respect to financial performance greater than 105% and up to 110%
98
Table of Contents
of financial target achievement. For fiscal 2013, the financial performance payout percentages increased by 7.5% for each 1.0% increase in specified financial performance target attainment between 105% and 110% achievement of our financial goals. Previously, the specified financial performance payout percentages increased by 5.0% for each 1% of specified financial performance target attainment. As a result of this change in the pre-established scale, the maximum financial performance payout percentage attainable at 110% achievement of financial targets was increased from 150% to 162.5%. The compensation committee accepted the recommendations as a way to more closely align incentive payouts with the achievement of financial targets and to enhance the value created through incremental achievement above financial targets.
The actual fiscal 2013 MIP award for the NEOs (other than Mr. Chiminski) was the product of their target annual bonus multiplied by the sum of (1) the Business Performance Factor achievement percentage (20% multiplied by the revenue payout percentage plus 60% multiplied by the internally-adjusted EBITDA payout percentage) and (2) their Individual Performance Factor achievement percentage (20% multiplied by the individual performance payout percentage). The actual fiscal 2013 MIP award for the NEOs (other than Mr. Chiminski) was capped at 150% of the NEO’s target annual bonus. For Mr. Chiminski, his actual fiscal 2013 MIP award was the product of his target annual bonus multiplied by the sum of (1) the Business Performance Factor achievement percentage (25% multiplied by the revenue payout percentage plus 75% multiplied by the internally-adjusted EBITDA payout percentage) and (2) his Individual Performance Factor and could not exceed 200% of his target annual bonus.
With respect to the NEOs, financial performance is measured 100% at the company-wide level. Financial performance relative to specified financial performance targets set by the board of directors determines the aggregate funding level and the Business Performance Factor for the MIP. As a result of the changes made to the MIP formula for fiscal 2013, in order for there to be any payment under the MIP, financial performance with respect to the internally-adjusted EBITDA target must meet or exceed 95% of target. If the financial performance targets set by the board of directors are met, the aggregate bonus pool amount will be set at 100% of the target amount in the annual operating budget and the specified financial performance target payout percentages will be set at 100%, subject to the compensation committee’s discretion. If financial performance exceeds the targets, the aggregate bonus pool amount and the specified financial performance target payout percentages are increased above 100%, up to a maximum of 162.5%, based on a pre-established scale. If financial performance does not meet target, the bonus pool amount and the specified financial performance target payout percentages are decreased from 100% based on the pre-established scale. Pursuant to the pre-established scale, each 1% change in the specified financial performance results in relation to the target amount equates to a 5% change in the applicable financial performance payout percentages when the financial performance is 95% or greater up to 105%. As a result of the changes made to the MIP formula for fiscal 2013, for financial performance target attainment above 105% and up to 110% the change in financial performance payout percentage is 7.5% (for example, exceeding the financial performance target by 6% equates to a payout percentage of 132.5% and financial performance at 95% of the specified financial performance target equates to a payout percentage of 75%). The compensation committee has the discretion to adjust the MIP aggregate bonus pool amount and the Business Performance Factor determined by reference to the pre-established scale upwards or downwards to address special situations.
We believe that tying the NEOs’ bonuses to company-wide performance goals encourages collaboration across the executive leadership team. We attempt to establish the financial performance target(s) at challenging levels that are reasonably attainable if we meet our performance objectives. For fiscal 2013, we used internally-adjusted EBITDA and revenue as measures of financial performance because we believe that they provide a reliable indicator of our strategic growth and the strength of our cash flow and overall financial results. Internally-adjusted EBITDA is generally calculated in the same manner as Adjusted EBITDA is calculated for purposes of the indentures governing our notes and the credit agreement governing our senior unsecured term loan facility, except for the impact of foreign exchange and other non-operational matters. In determining the actual Business Performance Factor, the achievement of internally-adjusted EBITDA against target is weighted 75% while the achievement of revenue against target is weighted 25%. The fiscal 2013 internally-adjusted
99
Table of Contents
EBITDA performance target was $436.7 million and our actual internally-adjusted EBITDA performance for fiscal 2013 was $412.7 million. The fiscal 2013 revenue performance goal was $1.9 billion and our revenue performance for fiscal 2013 was $1.8 billion. Based on this financial performance and pursuant to the pre-established scale, the internally-adjusted EBITDA payout percentage was 75% and the revenue payout percentage was also 75%, which therefore resulted in a Business Performance achievement percentage of 75%. The internally-adjusted EBITDA shortfall was driven primarily by unforeseen key product demand fluctuations partially offset by exceptional performance leading to growth and synergistic opportunities in our other lines of business. Based on the exceptional performance in our other lines of business, the compensation committee determined to set the funding levels for the MIP at a Business Performance Factor achievement percentage of 79%, which was slightly above the achievement factor percentage based on actual performance. The Business Performance Factor determines the funding for 80% of the MIP pool.
After setting the Business Performance Factor, the compensation committee determines the actual bonuses paid to the NEOs based on an assessment of each NEO’s Individual Performance Factor. Other than with respect to Mr. Chiminski, the Individual Performance Factor payout percentage (which only impacts 20% of an NEO’s MIP award) can range from 0% to 150%. Mr. Chiminski’s Individual Performance Factor (which is not weighted and impacts his entire MIP award) can range from 0% to 100% and is based on the compensation committee’s overall assessment of his individual performance based on the achievement of his personal strategic and financial objectives that are set at the beginning of the fiscal year. For fiscal 2013, Mr. Chiminski’s individual goals and objectives for his individual performance factor related to the following five areas and were assigned the following weightings: revenue and strategic growth initiatives (30%), in-organic growth initiatives (20%), cash management and margin objectives (10%), operational excellence/quality compliance objectives (20%) and Chief Executive Officer leadership and organization vitality objectives (20%). The fiscal 2013 goals and objectives for the other Named Officers related to the following five categories, but were not assigned numerical weightings: quality and compliance; operational excellence; customer innovation/growth; organizational vitality/leadership and financial accountability. Each fiscal year, the Named Officers typically have between twenty and thirty individual goals and objectives established within the broader categories.
The compensation committee performed the assessment of Mr. Chiminski’s Individual Performance Factor after reviewing the written assessments of his performance against his specific goals and objectives that Mr. Chiminski provided at each quarterly meeting of the board of directors. The Chief Executive Officer together with the Senior Vice President, Human Resources performed the assessment of the other Named Officer’s Individual Performance Factors and made a recommendation to the compensation committee.
The following table illustrates the calculation of the fiscal 2013 MIP award earned by each of our NEOs. Actual fiscal 2013 MIP awards are also presented in the Summary Compensation Table below.
| 2013 Salary |
MIP Award Potential Percentage |
MIP Award Potential Target |
Achievement Factor |
Actual MIP Award Paid |
||||||||||||||||
| John Chiminski |
$ | 850,000 | n/a | $ | 1,000,000 | 155 | % | $ | 1,550,000 | |||||||||||
| Matthew Walsh |
$ | 612,397 | 75 | % | $ | 459,298 | 93.2 | % | $ | 428,042 | ||||||||||
| William Downie |
$ | 395,000 | 75 | % | $ | 296,250 | 89.2 | % | $ | 264,255 | ||||||||||
| Samrat Khichi |
$ | 439,000 | 75 | % | $ | 329,250 | 93.2 | % | $ | 306,861 | ||||||||||
| Stephen Leonard |
$ | 415,000 | 75 | % | $ | 311,250 | 93.2 | % | $ | 290,085 | ||||||||||
Sign-on Bonuses
From time to time, our compensation committee may award sign-on bonuses in connection with the commencement of an NEO’s employment with us. Sign-on bonuses are used only when necessary to attract highly skilled officers to the Company. Generally they are used to incentivize candidates to leave their current employers, or may be used to offset the loss of unvested compensation they may forfeit as a result of leaving their current employers. Sign-on bonuses are typically subject to a claw-back obligation if the officer voluntarily terminates his employment with us within twelve months of the employment commencement date.
100
Table of Contents
Discretionary Bonuses
From time to time, our compensation committee may award discretionary bonuses in addition to any annual bonus payable under the MIP in recognition of extraordinary performance. For fiscal 2013, our compensation committee awarded Messrs. Walsh, Khichi and Leonard discretionary bonuses in recognition of their superior performance in fiscal 2013. The discretionary bonus amounts are reported in the “Bonus” column in the Summary Compensation Table below.
Long-Term Equity Incentive Awards
We believe that the NEOs’ long-term compensation should be directly linked to the value we deliver to our stockholders. Equity awards to the NEOs are designed to provide long-term incentive opportunities over a period of several years. Stock options have been our preferred equity award because the options will not have any value unless the underlying shares of common stock appreciate in value following the grant date. Accordingly, awarding stock options causes more compensation to be “at risk” and further aligns our executive compensation with our long term profitability and the creation of shareholder value. The 2007 PTS Holdings Corp. Stock Incentive Plan also permits us to grant other types of equity-based awards, such as restricted stock units, stock appreciation rights, restricted stock and other “full value” awards. For example, we granted Mr. Chiminski 3,000 restricted stock units (“RSUs”) and Mr. Walsh 500 RSUs (see “Description of Equity-Based Awards” below) to align Messrs. Chiminski’s and Walsh’s interests with those of our stockholders.
Another key component of our long-term equity incentive program is that NEOs and other eligible employees have been provided with the opportunity to invest in our common stock on the same general terms as our existing owners. We considered this investment opportunity an important part of our equity program because it encouraged stock ownership and aligned the NEOs’ financial interests with those of our stockholders.
The amounts of each NEO’s investment opportunity and stock option and/or RSU award, as applicable, were determined based on several factors, including: (1) each NEO’s position and expected contribution to our future growth; (2) dilution effects on our stockholders and the need to maintain the availability of an appropriate number of shares for option awards to less-senior employees; and (3) ensuring that the NEOs were provided with appropriate and competitive total long-term equity compensation and total compensation amounts.
Generally, options are granted to senior level officers based on their position in the Company. Historically, grants have not been made on an annual basis, and instead are made upon an executive’s commencement of employment with us or when an executive receives promotions into more senior level positions. Effective June 25, 2013, our board of directors approved a new option grant framework pursuant to which employees who are holders of options to acquire shares of our common stock would be eligible for new biennial option awards beginning on the fourth anniversary of the date of their original option grant. In connection with the adoption of the new option grant framework, on June 25, 2013, our board of directors granted new option awards to each of the Named Officers. These new option awards were granted in recognition of the Named Officers’ exceptional performance as well to continue to retain and motivate them given the extended period of time since their original option grants were made. We do not intend to make any further grants under the new option framework after the completion of this offering.
The options previously granted under the new framework are divided into two tranches for vesting purposes: one-half of the options are subject to performance-based vesting restrictions and one-half of the options are subject to exit event-based vesting restrictions. The performance-based options will vest and become exercisable on each of the first five anniversaries of the applicable vesting reference date if we achieve specified EBITDA performance targets (subject to a cumulative catch-up). The EBITDA performance targets were established at levels that are reasonably attainable but challenging to achieve. Fiscal 2014 budgeted EBITDA serves as the base line target for the first fiscal year in the vesting schedule and the targets for the remaining four fiscal years of the vesting schedule are based on eight percent (8%) year over year increases thereafter. The exit event-based options will vest and become exercisable on the date, if any, when The Blackstone Group achieves a specified multiple on its investment
101
Table of Contents
in us. Vesting under both the performance-based options and the exit event-based options is generally subject to continued employment with us through the applicable vesting dates. In addition, in the event of a change of control (as defined in the 2007 PTS Holdings Corp. Stock Incentive Plan or the option agreement, as applicable) in which the exit event-based options vest, any outstanding unvested performance-based options will also vest. Unlike the terms of the option holder’s existing options, the options granted under the framework have no time-vesting tranche as the compensation committee determined it was appropriate to more strongly incentivize the achievement of business goals and the creation of stockholder value under the new option framework. All other terms of the options granted under the new option framework, including any continued vesting following termination, are substantially similar to the terms of the option holder’s existing options.
The number of options granted to the Named Officers during fiscal 2013 and the grant date fair value of these options as determined under FASB ASC Topic 718 are presented in the Grants of Plan-Based Awards in Fiscal 2013 table below. A description of the material terms of both the new stock option awards and the existing stock option awards is presented below under the heading “Description of Equity-Based Awards.”
Deferred Compensation Opportunity and Other Retirement Benefits
Catalent Pharma Solutions, LLC Deferred Compensation Plan
Our NEOs are eligible to participate in our 401(k) plan and our non-qualified deferred compensation plan. The non-qualified deferred compensation plan generally allows participants to defer on a pre-tax basis up to 20% of their base salaries and 100% of their annual cash bonuses. We believe that providing the NEOs with deferred compensation opportunities is a market based benefit plan necessary for us to deliver competitive benefit packages. This plan allows its participants to receive the tax benefits associated with delaying the income tax event on the compensation deferred even though our related deduction is also deferred. The non-qualified deferred compensation plan also provides for three types of discretionary company contributions to supplement the amounts deferred by the NEOs and other eligible employees, subject to certain limits. In January 2009, we elected to suspend our employer non-matching contributions and, in February 2009, we elected to suspend our employer matching contribution. Effective February 1, 2010, we reinstated our employer matching contribution based on the strength of our financial results; however we did not reinstate the other employer contributions. We currently match 50% of the first 6% of eligible pay that employees contribute to the non-qualified deferred compensation plan up to the first $100,000 above the IRS qualified plan limits. The Nonqualified Deferred Compensation—Fiscal 2013 table and related narrative section below describe our non-qualified deferred compensation plan and the benefits it provides.
Chiminski RSU Bonus Election; Obligation to Purchase Common Stock
Pursuant to the terms of Mr. Chiminski’s employment agreement, in addition to the shares of our common stock that he has already purchased, Mr. Chiminski was required to use 50% of the after-tax proceeds of any payment he received as an annual MIP bonus while employed paid in respect of fiscal 2010 or 2011, in each case, to promptly purchase shares of our common stock.
On June 30, 2010, we, Catalent Pharma Solutions, Inc. and Mr. Chiminski entered into a letter agreement, which modified certain terms of Mr. Chiminski’s employment agreement. The primary purpose of the letter agreement was to provide Mr. Chiminski with a more tax-advantaged mechanism to satisfy his employment agreement obligation to purchase additional shares of our common stock. Specifically, the letter agreement permits Mr. Chiminski to irrevocably elect on an annual basis, prior to the beginning of each fiscal year, commencing with fiscal 2011, in lieu of receiving a portion of his annual MIP bonus in cash, to receive a grant of fully vested RSUs to be settled in shares of our common stock, which RSUs will be granted on the bonus payment date. Mr. Chiminski made such an election for fiscal 2011, and received 50% of his annual MIP bonus in respect of such fiscal year in the form of a grant of RSUs. For elections in respect of any fiscal year after fiscal 2011, Mr. Chiminski may elect to receive no less than 20% of his annual MIP bonus, if any, in the form of a
102
Table of Contents
grant of RSUs. The number of RSUs Mr. Chiminski receives will be based on the value of the portion of the annual MIP bonus he elects to defer into RSUs and the fair market value of a share of our common stock on the bonus payment date. For each of fiscal 2012, 2013 and 2014, Mr. Chiminski did not elect to receive fully vested RSUs in lieu of a portion of his annual MIP bonus.
All grants made in connection with an annual MIP bonus election will be subject to a separate RSU agreement, which provides that the RSUs will be 100% vested on the date of grant (which will be the bonus payment date) and will be settled in shares of our common stock on the earlier to occur of a change in control of the Company or BHP PTS Holdings L.L.C. and the sixth anniversary of the date of grant.
Other Retirement Benefits
In addition to our 401(k) plan and non-qualified deferred compensation plan, we have three frozen defined-benefit pension plans. These pension plans were originally established by R.P. Scherer Corporation and its affiliates, which was a predecessor corporation that was acquired by Cardinal Health. In connection with the Acquisition, we agreed with Cardinal Health to assume liability for benefits provided under these pension plans, subject to receiving certain asset transfers from Cardinal Health and its benefit plans. All three plans are currently closed to new participants and frozen with respect to benefit accruals. None of the NEOs are currently eligible to participate in the frozen defined-benefit pension plans. In connection with his relocation to the United States, we agreed to permit Mr. Downie’s continued his participation in the Catalent Pharma Solutions UK Pension Plan. The Catalent Pharma Solutions UK Pension Plan is a defined contribution plan open to all employees of our Catalent Pharma Solutions Limited UK entity. The plan provides for an employer matching contribution of between 5% and 8% of eligible base salary compensation dependent upon the participant contributing between 3% and 6% of eligible base salary compensation.
Severance and Other Benefits
We believe that severance protections can play a valuable role in attracting and retaining high caliber talent. In the competitive market for executive talent, we believe severance payments and other termination benefits are an effective way to offer executives financial security to offset the risk of foregoing an opportunity with another company. For example, we offer each NEO an enhanced outplacement benefit. Consistent with our objective of using severance payments and benefits to attract and retain executives, we generally provide each NEO with amounts and types of severance payments and benefits that we believe will permit us to attract and/or continue to employ the individual NEO.
The severance benefits under these agreements are generally more favorable than the benefits payable under our general severance policy. For example, we offer each NEO a severance benefit payable upon a termination by the NEO for good reason or by us without cause. The good reason definition in these agreements would only be triggered by adverse circumstances that we believe would give rise to a constructive termination of employment.
At our discretion, we may also provide certain executives with enhancements to our existing benefits that are not available to other employees, such as relocation assistance. As part of Mr. Chiminski’s amended employment contract he is eligible to receive reimbursement (on a tax grossed-up basis), on an annual basis during each calendar year of the employment term, for the reasonable cost of (1) premiums for an executive life insurance policy (not to exceed $15,000) and (2) financial services/planning (not to exceed $15,000).
Section 162(m) of the Internal Revenue Code
Following this offering, we expect to be able to claim the benefit of a special exemption rule that applies to compensation paid (or compensation in respect of equity awards such as stock options or restricted stock granted) during a specified transition period. This transition period may extend until the first annual stockholders meeting that occurs after the close of the third calendar year following the calendar year in which this offering occurs, unless the transition period is terminated earlier under the Section 162(m) post-offering transition rules. At such
103
Table of Contents
time as we are subject to the deduction limitations of Section 162(m), we expect that the compensation committee will take the deductibility limitations of Section 162(m) into account in its compensation decisions; however, the compensation committee may, in its judgment, authorize compensation payments that are not exempt under Section 162(m) when it believes that such payments are appropriate to attract or retain talent.
Compensation Actions Taken in Fiscal 2014
Our compensation committee has retained Frederic W. Cook & Co., Inc., an independent compensation consulting firm, to provide guidance on executive compensation in connection with this offering and to provide information and guidance for our compensation program going forward.
In connection with Mr. Khichi’s decision to leave the Company to serve as Senior Vice President, General Counsel and Corporate Secretary of a multinational public company, Mr. Khichi has agreed to continue to serve in his various capacities for a transition period ending on July 21, 2014. In connection therewith, we agreed to increase Mr. Khichi’s base salary $25,000 per month, effective May 1, 2014. In addition, Mr. Khichi will also be eligible to receive a retention bonus in the amount of $100,000 upon the satisfactory completion of specified projects as determined by the Chief Executive Officer.
In May 2014, our board of directors awarded Mr. Walsh a grant of 420 restricted stock units in accordance with and pursuant to the terms of the 2007 PTS Holdings Corp. Stock Incentive Plan, as amended from time to time. Subject to Mr. Walsh’s continued employment, 100% of the restricted stock units will vest on May 7, 2016. In the event of a change of control, subject to Mr. Walsh’s continued employment, all unvested restricted stock units will become fully vested as of the change of control. In the event of any termination of Mr. Walsh’s employment, all unvested restricted stock units which remain outstanding will immediately be forfeited without consideration as of the termination date. All vested restricted stock units will be settled on the date on which they vest, but in no event later than the 30th day following such date. We intend to value the restricted stock units based on the initial public offering price per share in this offering for purposes of calculating the compensation expense associated with the grant.
In connection with this offering, we expect to make initial long term incentive grants under the 2014 Omnibus Incentive Plan to certain officers and employees, including all of our named executive officers (other than Mr. Khichi), which will be structured as follows: 50% of the value of each grant will be comprised of performance share units, 30% will be comprised of time-based stock options, and the remaining 20% will be comprised of time-based restricted stock units. Subject to the recipient’s continued service with the Company through each applicable vesting date, one-fourth of the shares subject to stock options will vest on each one-year anniversary following our initial public offering and the restricted stock units will be fully vested on the third anniversary of our initial public offering. The performance share units are not expected to be granted until the beginning of fiscal 2015 and, therefore, the vesting terms have not yet been determined.
On a “change in control,” any outstanding and unvested stock options and restricted stock units will become fully vested to the extent the acquiring or successor entity does not assume, continue or substitute for the stock options and restricted stock units. If the recipient’s employment is terminated by us without cause within eighteen (18) months following a “change in control”, any outstanding and unvested stock options and restricted stock units will become fully vested (to the extent the acquiring or successor entity assumes, continues or substitutes for the stock options and restricted stock units). Any outstanding and unvested stock options and restricted stock units will continue to vest on the originally scheduled vesting date(s) (subject to continued compliance with post-employment restrictive covenants through the originally scheduled vesting date(s) and the recipient executing a release of claims) in the event of the recipient’s termination of employment by the recipient due to retirement or due to disability. Any outstanding and unvested stock options and restricted stock units will become fully vested in the event of the recipient’s termination of employment due to the recipient’s death. Upon any other termination of employment, all unvested stock options and restricted stock units will be forfeited.
104
Table of Contents
The following table illustrates the total grant value of the above described initial long term incentive grants for each of our named executive officers, which will be translated into a number of performance share units, stock options, and restricted stock units (in the proportions set forth above) by taking such dollar amount and dividing it by the per share “fair value” that will be used for reporting the compensation expense associated with the grant under applicable accounting guidance, which “fair value” will be based in part on the per share price to public in this offering on the cover page of this prospectus:
| Total Grant Value (100% of base salary) |
50% Performance Share Units |
30% Stock Options |
20% Restricted Stock Units |
|||||||||||||
| John Chiminski |
$ | 850,000 | $ | 425,000 | $ | 255,000 | $ | 170,000 | ||||||||
| Matthew Walsh |
$ | 625,000 | $ | 312,500 | $ | 187,500 | $ | 125,000 | ||||||||
| Stephen Leonard |
$ | 455,000 | $ | 227,500 | $ | 136,500 | $ | 91,000 | ||||||||
| William Downie |
$ | 415,000 | $ | 207,500 | $ | 124,500 | $ | 83,000 | ||||||||
In connection with this offering, our compensation committee approved a new annual long term incentive program which is expected to commence in fiscal 2016. Awards under this new program will reflect market based compensation, subject to the discretion of our compensation committee, and will be granted during our standard performance evaluation and compensation planning calendar following the end of each applicable fiscal year.
Summary Compensation Table
The following table provides summary information concerning the compensation of our Chief Executive Officer, our Chief Financial Officer and each of our other NEOs.
| Name and Principal Position |
Year | Salary ($)(1) |
Bonus ($)(2) |
Stock Awards ($) |
Option Awards ($)(4) |
Non-Equity Incentive Plan Compensation ($)(5) |
Change
in Pension Value and Nonqualified Deferred Compensation Earnings ($) |
All Other Compensation ($)(6) |
Total ($) |
|||||||||||||||||||||||||||
| John Chiminski |
2013 | 850,000 | — | — | 2,904,100 | 1,550,000 | — | 33,048 | 5,337,148 | |||||||||||||||||||||||||||
| President & Chief Executive Officer and Director |
2012 | 801,923 | — | — | — | 2,000,000 | — | 63,064 | 2,864,987 | |||||||||||||||||||||||||||
| 2011 | 750,000 | 500,000 | — | — | 1,500,000 | — | 75,096 | 2,825,096 | ||||||||||||||||||||||||||||
| Matthew Walsh |
2013 | 612,397 | 114,698 | — | 396,825 | 413,344 | — | 10,697 | 1,547,961 | |||||||||||||||||||||||||||
| Executive Vice President & Chief Financial Officer |
2012 | 571,650 | 185,000 | 520,000 | (3) | 346,380 | 526,097 | — | 23,572 | 2,172,699 | ||||||||||||||||||||||||||
| 2011 | 494,700 | 100,000 | — | — | 560,000 | — | 9,921 | 1,164,621 | ||||||||||||||||||||||||||||
| William Downie(7) |
2013 | 395,000 | 9,480 | — | 257,303 | 254,775 | — | 208,581 | 1,125,139 | |||||||||||||||||||||||||||
| Senior Vice President, Sales & Marketing |
2012 | 385,000 | — | — | — | 335,520 | — | 178,798 | 899,318 | |||||||||||||||||||||||||||
| Samrat Khichi |
2013 | 439,000 | 85,536 | — | 557,712 | 296,325 | — | 10,598 | 1,389,171 | |||||||||||||||||||||||||||
| Senior Vice President, Chief Administrative Officer and General Counsel |
2012 | 412,192 | 150,000 | — | — | 378,310 | — | 10,343 | 950,845 | |||||||||||||||||||||||||||
| 2011 | 386,692 | 100,000 | — | — | 352,000 | — | 7,821 | 846,513 | ||||||||||||||||||||||||||||
| Stephen Leonard |
2013 | 415,000 | 84,960 | — | 270,207 | 280,125 | — | 10,759 | 1,061,051 | |||||||||||||||||||||||||||
| Senior Vice President, Global Operations |
2012 | 392,500 | 100,000 | — | — | 375,000 | — | 10,540 | 878,040 | |||||||||||||||||||||||||||
| 2011 | 380,962 | 75,000 | — | — | 460,000 | — | 7,875 | 923,837 | ||||||||||||||||||||||||||||
| (1) | Amounts reported include any compensation an NEO elected to defer under our non-qualified deferred compensation plan. Our practice is to review executive compensation on an 18 month cycle. Actual changes in compensation may occur earlier based on performance and market competitiveness. As a result, Mr. Walsh’s base salary was increased from $600,000 to $625,000, effective January 1, 2013. |
| (2) | Amounts reported for fiscal 2013 reflect the discretionary portion of the annual MIP bonus. Amounts reported for Messrs. Walsh, Khichi and Leonard for fiscal 2013 also represent additional discretionary bonuses awarded in recognition of their superior performance in fiscal 2013 as follows: Mr. Walsh $100,000; Mr. Khichi $75,000; and Mr. Leonard $75,000. |
105
Table of Contents
| (3) | Reflects RSUs we granted to Mr. Walsh on October 11, 2011 pursuant to the terms of his new employment agreement. Amounts reported for these RSUs reflect the aggregate grant date fair value computed in accordance with FASB ASC Topic 718. |
| (4) | Reflects options we granted to the NEOs to acquire shares of our common stock. Amounts reported reflect the aggregate grant date fair value computed in accordance with FASB ASC Topic 718. For a discussion of the assumptions and methodologies used to calculate the amounts reported, please see the discussion of non-qualified stock option awards contained in Note 16 to our audited consolidated financial statements included elsewhere in this prospectus. |
| (5) | Mr. Chiminski was required, per his employment agreement, to use 50% of the after-tax proceeds of his annual MIP bonus paid in respect of fiscal 2010 or 2011, in each case, to promptly purchase shares of our common stock at a purchase price of $750 or he had the ability to elect to defer a portion of his fiscal 2011 annual MIP bonus to satisfy this stock purchase requirement. The amount reported for fiscal 2011 includes an annual MIP bonus amount of $1,500,000 of which $750,000 was paid in cash and 721.15 fully vested RSUs with a grant date fair value of $750,000 were awarded to Mr. Chiminski on September 16, 2011 pursuant to his election to defer 50% of his annual MIP bonus to satisfy his stock purchase requirement. The amount reported for Mr. Chiminski for fiscal 2012 reflects a correction of the original amount reported for his 2012 MIP bonus. |
| (6) | The supplemental table below sets forth the details of amounts reported as “All Other Compensation” for fiscal 2013. |
| (7) | Certain amounts in “All Other Compensation” were paid to Mr. Downie in pounds sterling. These amounts were converted to U.S. dollars at an exchange rate of 1.57 which represents the average end of month rates during our fiscal year ending June 30, 2013. |
| Name |
Employer 401(k) Matching Contributions ($)(1) |
Employer Non- Qualified Deferred Compensation Matching Contributions ($)(2) |
Employer Qualified UK DC Plan Contributions ($)(3) |
Car Allowance ($)(4) |
Housing Allowance ($)(5) |
Financial Services Reimbursement ($)(6) |
Life Insurance Policy Reimbursement ($)(7) |
Total ($)(8) |
||||||||||||||||||||||||
| (a) | (b) | (c) | (d) | (e) | (f) | (g) | (h) | (i) | ||||||||||||||||||||||||
| John Chiminski |
981 | 2,850 | 14,464 | 14,753 | 33,048 | |||||||||||||||||||||||||||
| Matthew Walsh |
7,500 | 3,196 | 10,696 | |||||||||||||||||||||||||||||
| William Downie |
31,769 | 19,900 | 122,264 | 208,581 | ||||||||||||||||||||||||||||
| Samrat Khichi |
7,598 | 3,000 | 10,598 | |||||||||||||||||||||||||||||
| Stephen Leonard |
7,759 | 3,000 | 10,759 | |||||||||||||||||||||||||||||
| (1) | Our 401(k) plan provides for a 50% matching contribution on the first 6% of participants’ pre-tax contributions up to IRS limits. |
| (2) | The Catalent Pharma Solutions, LLC Deferred Compensation Plan provides for a 50% matching contribution on the first 6% of eligible pay that employees contribute to the plan up to the first $100,000 above the IRS qualified plan limits. |
| (3) | On October 11, 2010, Mr. Downie transferred from Swindon U.K. to our corporate offices in the United States for his assignment as Senior Vice President, Global Sales & Marketing. As part of the terms of his November 18, 2010 letter agreement, Mr. Downie was allowed to maintain his continued participation in the Catalent Pharma Solutions UK Pension Plan with an employer contribution of 8%. |
| (4) | Per the terms of our Long-Term International Assignment Policy, if an International Assignee was provided a car or car allowance in their home country then a comparable benefit will be provided at the assignment location. Per the terms of Mr. Downie’s 2010 letter agreement, he is eligible for his car and fuel allowance from the effective date of his assignment. Mr. Downie is responsible for any tax due on the taxable portion of this benefit. Mr. Downie’s agreement was extended with the same terms in fiscal 2013 for an additional 24 months. |
| (5) | As part of Mr. Downie’s relocation, we agreed to pay for certain housing expenses for a period of 24 months from the effective date of his assignment. We also paid for taxes due as a result of providing this benefit during the rental period. The amount reported in column (f) includes the Federal tax gross-up of $39,794 and state tax gross-up of $10,472. |
| (6) | Pursuant to the terms of Mr. Chiminski’s December 2011 letter agreement, with respect to each calendar year during the employment term, he is entitled to be reimbursed by us (on a tax-grossed-up basis) for the reasonable cost of financial services/planning, subject to an aggregate cap of $15,000 for such service/planning. Mr. Chiminski received financial services/planning reimbursement in May 2013 totaling $3,270 and in March 2013 totaling $7,042. The amount in column (g) includes an aggregate tax gross-up of $4,152 with respect to Mr. Chiminski’s financial services reimbursement benefit. |
| (7) | Pursuant to the terms of Mr. Chiminski’s December 2011 letter agreement, with respect to each calendar year during the employment term, he is entitled to be reimbursed by us (on a tax-grossed-up basis) for the reasonable cost of premiums for an executive life insurance policy subject to an aggregate cap of $15,000. For fiscal 2013, Mr. Chiminski received reimbursement in the amount of $8,775 in December 2012. The amount in column (h) includes a tax gross-up of $5,978 with respect to Mr. Chiminski’s life insurance policy benefit. |
| (8) | In fiscal 2013, we also agreed to reimburse Mr. Downie $5,250, which is included in the amount reported in column (i), for miscellaneous expenses related to his children’s educational needs. Mr. Downie is responsible for any tax due on the taxable portion of this benefit. In addition, the amount reported in column (i) includes $29,398 related to Mr. Downie’s relocation. |
106
Table of Contents
Grants of Plan-Based Awards in Fiscal 2013
The following table provides supplemental information relating to grants of plan-based awards made during fiscal 2013 to help explain information provided above in our Summary Compensation Table. This table presents information regarding all grants of plan-based awards occurring during fiscal 2013.
| Name |
Grant Date |
Estimated Possible Payouts Under Non-equity Incentive Plan Awards(1) |
Estimated Future Payouts Under Equity Incentive Plan Awards(2) |
All Other Stock Awards: Number of Shares of Stock or Units (#) |
All Other Option Awards: Number of Securities Underlying Options (#) |
Exercise or Base Price of Option Awards ($/Sh) |
Grant Date Fair Value of Stock and Option Awards ($)(3) |
|||||||||||||||||||||||||||||||||
| Threshold ($) |
Target ($) |
Maximum ($) |
Threshold (#) |
Target (#) |
Maximum (#) |
|||||||||||||||||||||||||||||||||||
| John Chiminski |
562,500 | 1,000,000 | 2,000,000 | |||||||||||||||||||||||||||||||||||||
| 6/25/2013 | 1,000 | 10,000 | 10,000 | 1,310 | 2,904,100 | |||||||||||||||||||||||||||||||||||
| Matthew Walsh |
206,684 | 459,298 | 688,947 | |||||||||||||||||||||||||||||||||||||
| 6/25/2013 | 136 | 1,367 | 1,367 | 1,310 | 396,825 | |||||||||||||||||||||||||||||||||||
| William Downie |
133,313 | 296,250 | 444,375 | |||||||||||||||||||||||||||||||||||||
| 6/25/2013 | 88 | 886 | 886 | 1,310 | 257,303 | |||||||||||||||||||||||||||||||||||
| Samrat Khichi |
148,163 | 329,250 | 493,875 | |||||||||||||||||||||||||||||||||||||
| 6/25/2013 | 192 | 1,921 | 1,921 | 1,310 | 557,712 | |||||||||||||||||||||||||||||||||||
| Stephen Leonard |
140,062 | 311,250 | 466,875 | |||||||||||||||||||||||||||||||||||||
| 6/25/2013 | 93 | 931 | 931 | 1,310 | 270,207 | |||||||||||||||||||||||||||||||||||
| (1) | Figures represent awards payable under our Management Incentive Plan (MIP). See “Compensation Discussion and Analysis-Executive Compensation Program Elements-Cash Bonus Opportunities-Annual Cash Bonus Opportunity” above for a description of our MIP. |
| (2) | As described in more detail under the heading “Description of Equity-Based Awards” that follows below, the option awards reported above are divided into two tranches for vesting purposes: one-half are performance-based options and one-half are exit event-based options. The performance-based and exit event-based options are reported as an equity incentive plan award in the “Estimated Future Payouts Under Equity Incentive Plan Awards” column. Threshold amount assumes that only 20% of the performance-based options vest. |
| (3) | The grant date fair values for the option awards granted reflect the grant date fair values computed in accordance with FASB ASC Topic 718 based upon the probable outcome of performance conditions. |
Summary of Certain Named Officer Employment Agreements
This section describes employment agreements in effect for our NEOs during fiscal 2013. In addition, the terms with respect to grants of RSUs and stock options described above under “Long-Term Equity Incentive Awards” are further described below for our NEOs in the section entitled “Description of Equity-Based Awards.” Severance agreements and arrangements are described below in the section entitled “Potential Payments upon Termination or Change in Control.”
Employment Agreement of John R. Chiminski
On December 12, 2011, we, Catalent Pharma Solutions, Inc. and John Chiminski, our President and Chief Executive Officer, entered into a letter agreement (the “Letter Agreement”), effective as of December 12, 2011 (the “Effective Date”), which modifies certain terms of Mr. Chiminski’s employment agreement with us and Catalent Pharma Solutions, Inc., dated February 23, 2009, as amended by the letter agreements among us, Catalent Pharma Solutions, Inc. and Mr. Chiminski, dated October 30, 2009 and June 29, 2010 (the “Employment Agreement”).
The letter agreement provides for a new three-year employment term commencing on December 12, 2011, which initial term will be automatically extended for successive one-year periods thereafter unless one of the parties provides the other with written notice of non-renewal at least sixty days prior to the end of the applicable term.
The financial terms of the letter agreement include (1) an increased annual base salary of $850,000, subject to discretionary increases from time to time and (2) continued participation in our management incentive plan,
107
Table of Contents
with an increased target annual cash bonus amount equal to $1,000,000 and a maximum of 200% of such target amount. Any payment under the management incentive plan with respect to fiscal 2012 was pro-rated to reflect the increase in Mr. Chiminski’s target bonus amount.
In addition to the foregoing, we have also agreed to reimburse Mr. Chiminski (on a tax grossed-up basis), on an annual basis during each calendar year of the employment term, for the reasonable cost of (1) premiums for an executive life insurance policy (not to exceed $15,000) and (2) financial services/planning (not to exceed $15,000).
The financial terms of Mr. Chiminski’s employment agreement dated February 23, 2009 included (1) a cash payment of $375,000 paid on June 30, 2010, in lieu of any annual cash bonus in respect of fiscal 2009, and (2) a cash sign-on bonus of $1,000,000 paid on his employment commencement date of which $250,000 was to be invested by Mr. Chiminski in our common stock at a purchase price of $1,000 per share (he invested $100,000 on his commencement date and the remaining portion was to be invested on a later date as mutually agreed upon by the parties. Mr. Chiminski was required to repay the entire portion of the sign-on bonus that was not used to purchase our common stock within thirty days following any termination of employment by him without good reason (and not due to death or disability) or by Catalent Pharma Solutions, Inc. or us for cause, in either case, prior to the second anniversary of his commencement date. In addition to the requirement to purchase $250,000 worth of our common stock, Mr. Chiminski was required, pursuant to his employment agreement, to use 50% of the after-tax proceeds of his annual MIP bonus paid in respect of fiscal 2010 or 2011, in each case, to promptly purchase shares of our common stock. Mr. Chiminski’s total investment in our common stock is subject to a cap of $2,500,000.
On October 23, 2009, we and Catalent Pharma Solutions, Inc. entered into a letter agreement with Mr. Chiminski, which modified Mr. Chiminski’s obligation to purchase shares of our common stock by reducing the purchase price from $1,000 per share to $750 per share. This reduced purchase price was also applied to the 100 shares that he purchased on March 17, 2009. Accordingly, Mr. Chiminski was refunded $25,000 and then immediately used such amount to purchase an additional 33.333 shares of our common stock. On October 5, 2009, Mr. Chiminski used 50% of the after-tax proceeds of his 2009 bonus payment (which was a gross amount of $375,000) to purchase 124 shares of our common stock at $750 per share for $93,000. Mr. Chiminski purchased 150 shares of our common stock in July 2010 and an additional 500 shares in September 2010. The shares were purchased at $750 per share pursuant to the terms of the October 23, 2009 letter agreement. However, subsequent to these purchases, we determined that the actual market value of the shares was $850 per share as of June 30, 2011. Therefore, since the shares were purchased at a $65,000 discount to their market value, the amounts reported in the “All Other Compensation” column for fiscal 2011 of the Summary Compensation Table reflected the compensation cost computed in accordance with FASB Topic 718 with respect to the purchases.
In addition, on June 30, 2010, we, Catalent Pharma Solutions, Inc. and Mr. Chiminski entered into a second letter agreement, which permits Mr. Chiminski to irrevocably elect on an annual basis, prior to the beginning of each fiscal year, in lieu of receiving a portion of his annual MIP bonus, if any, in cash, to receive a grant of fully vested RSUs settleable in shares of our common stock, which RSUs will be granted on the bonus payment date (see “Compensation Discussion and Analysis-Deferred Compensation Opportunity—Chiminski RSU Bonus Election”).
In addition to the foregoing, Mr. Chiminski is entitled to participate in all group health, life, disability, and other employee benefit and perquisite plans and programs in which our other senior executives generally participate.
Employment Agreement of Matthew Walsh
On October 11, 2011, we entered into a new employment agreement with Mr. Walsh, effective as of September 26, 2011. The employment agreement replaced the offer letter and severance agreement that Mr. Walsh entered into in 2008 in connection with the commencement of his employment with us.
108
Table of Contents
The employment agreement provides for an initial term of three years commencing on September 26, 2011, which will be automatically extended for successive one-year terms thereafter unless one of the parties provides the other with notice of non-renewal.
The financial terms of the employment agreement include (1) an increased annual base salary of $600,000, effective as of September 26, 2011, subject to discretionary increases from time to time and (2) and continued participation in our management incentive plan, with a target annual cash bonus amount equal to 75% of Mr. Walsh’s annual base salary. Any payment under the management incentive plan with respect to fiscal 2012 was pro-rated to reflect the increase in Mr. Walsh’s annual base salary.
Pursuant to the terms of the employment agreement, Mr. Walsh is subject to a covenant not to (x) compete with us while employed and for two years following his termination of employment for any reason and (y) solicit our employees, consultants and certain actual and prospective clients while employed and for two years following his termination of employment for any reason, in each case, subject to certain specified exclusions. The employment agreement also contains a covenant not to disclose confidential information.
In addition to the foregoing, Mr. Walsh’s employment agreement provides for the grant to Mr. Walsh, in accordance with and pursuant to the terms of the 2007 PTS Holdings Corp. Stock Incentive Plan, of 500 RSUs and non-qualified stock options to purchase 1,500 shares of our common stock.
A description of the terms of the awards is included below in the “Description of Equity-Based Awards” section.
Relocation Agreement for William Downie
In connection with Mr. Downie’s November 1, 2010 relocation assignment from our facility in Swindon, U.K. to our corporate offices in the United States, he was afforded certain benefits that are generally included in our international relocation program for a period of 24 months from the effective date of his assignment, which were extended for an additional 24 months in fiscal 2013. These benefits include shipment of household goods, eligibility to participate in our U.S. health and welfare benefit plans, continued participation in the Catalent Pharma Solutions UK Pension plan and the U.K. National Insurance Contribution program (the U.K. statutory retirement plan), housing costs (grossed up for U.S. taxes), continuation of his U.K. car allowance, and tax preparation.
Description of Equity-Based Awards
Effective June 25, 2013, our board of directors approved a new option grant framework pursuant to which employees who are holders of options to purchase our common stock would be eligible for new biennial option awards beginning on the fourth anniversary of the date of their original option grant. In connection with the adoption of the new option grant framework, on June 25, 2013, our board of directors granted new option awards to each of our Named Officers in the amounts set forth in the “Grants of Plan-Based Awards in Fiscal 2013” table above.
The options granted under the new framework are divided into two tranches for vesting purposes: one-half of the options are subject to performance-based vesting restrictions and one-half of the options are subject to exit event-based vesting restrictions. The performance-based options will vest and become exercisable on each of the first five anniversaries of the applicable vesting reference date if we achieve specified EBITDA performance targets (subject to a cumulative catch-up). The EBITDA performance targets were established at levels that are reasonably attainable but challenging to achieve. Fiscal 2014 budgeted EBITDA serves as the base line target for the first fiscal year in the vesting schedule and the targets for the remaining four fiscal years of the vesting schedule are based on eight percent (8%) year over year increases thereafter. The exit event-based options will vest and become exercisable on the date, if any, when The Blackstone Group will have received cash proceeds or marketable securities from the sale of its investment in us aggregating in excess of 2.0 times the amount of its
109
Table of Contents
initial investment in us. Vesting under both the performance-based options and the exit event-based options is generally subject to continued employment with us through the applicable vesting dates. In addition, in the event of a change of control (as defined in the 2007 PTS Holdings Corp. Stock Incentive Plan or the option agreement, as applicable) in which the exit event-based options vest, any outstanding unvested performance-based options will also vest. All other terms of the options granted under the new option framework, including any continued vesting following termination, are substantially similar to the terms of the option holder’s existing options, the material terms of which are described below.
In connection with the commencement of his employment, on March 17, 2009, we granted Mr. Chiminski 2,000 RSUs and, on October 23, 2009, we granted Mr. Chiminski an additional 1,000 RSUs in connection with his election to participate in the option exchange offer. Subject to Mr. Chiminski’s continued employment on the applicable vesting dates, 20% of the RSUs will vest on each of the first five anniversaries of the grant date. All vested RSUs will be settled on the earlier to occur of (x) the seventh anniversary of his commencement date or (y) the date that a change in control of the Company or our parent, BHP PTS Holdings L.L.C., occurs.
On September 18, 2009, we commenced an offer to all eligible option holders, including Messrs. Chiminski, Walsh and Khichi, to exchange their existing unvested options for new options with a lower per-share exercise price and new vesting terms. The number of shares of common stock underlying the new options was either more than, less than or equal to the number of shares of common stock underlying the option holder’s then-existing options. All of the option holders who were eligible for the option exchange elected to participate in the exchange and were required to enter into a new option agreement that reflected the revised terms and an amendment to their then-existing option agreement that reflected the cancellation and forfeiture of their original unvested options. The exchange offer was completed on October 23, 2009.
Mr. Downie also received a grant of options on October 23, 2009 in recognition of his promotion to Senior Vice President of Global Sales and Marketing that have the same per-share exercise price and vesting terms as the new options granted to Messrs. Walsh and Khichi in connection with the option exchange.
The options granted to Mr. Leonard in fiscal 2011 were granted in connection with his offer of employment with us and have the same per-share exercise price and vesting terms as the new options granted to Messrs. Walsh and Khichi in connection with the option exchange.
In connection with entering into Mr. Walsh’s new employment agreement, on October 11, 2011, we granted Mr. Walsh 500 RSUs and an additional 1,500 options. Subject to Mr. Walsh’s continued employment on the applicable vesting dates, the RSUs will vest as follows: 167 of the RSUs will vest on September 26, 2012, 166 of the RSUs will vest on September 26, 2013 and the remaining 166 RSUs will vest on September 26, 2014. All vested RSUs will be settled on the earlier to occur of (x) March 26, 2015 and (y) the date that a change in control of the Company or our parent, BHP PTS Holdings L.L.C., occurs. Similar to Mr. Walsh’s previously-granted options, the additional options are divided into three tranches for vesting purposes: one-half of the options are subject to time-based vesting restrictions, one-sixth of the options are subject to performance-based vesting restrictions and one-third of the options are subject to exit event-based vesting restrictions. The time-based options are scheduled to vest based on a three year vesting schedule (as opposed to the five year vesting schedule that Mr. Walsh’s previously-granted time-based options are subject to) and, subject to continued employment with us through the applicable vesting reference dates, one-third of the options subject to time-based vesting will vest and become exercisable on each of September 26, 2012, September 26, 2013 and September 26, 2014. The performance-based vesting options are scheduled to vest and become exercisable with respect to one-sixth of the options subject to performance-based vesting on each of September 26, 2012, September 26, 2013 and September 26, 2014 (as opposed to the five year vesting schedule Mr. Walsh’s previously-granted performance-based options are subject to), if we achieve specified EBITDA performance targets (subject to cumulative catch-up). Similar to Mr. Walsh’s existing exit options, the exit event-based vesting options will vest and become exercisable in two tiers if either the specified internal rate of return or multiple of investment targets are achieved. In the event of any termination of Mr. Walsh’s employment, all unvested RSUs and options which remain outstanding will be immediately forfeited without consideration as of the termination date; however, in
110
Table of Contents
the event of a termination of Mr. Walsh’s employment (1) by us without cause, (2) by Mr. Walsh for good reason, (3) due to death or disability or (4) due to our election not to extend the employment term, Mr. Walsh will be deemed vested as of the termination date in any portion of the time-based option that would have otherwise vested if he had remained employed by us through the first anniversary of the termination date. In the event of a change in control of the Company or our parent, BHP PTS Holdings L.L.C., all unvested RSUs and time-based options will become fully vested as of the change in control (or immediately prior to the change in control with respect to the options).
Each option may be exercised to purchase one share of our common stock at an exercise price equal to the fair market value of the underlying common stock on the grant date. Each NEO’s stock option award has an ordinary term of ten years. The NEOs are not entitled to any dividends or equivalent rights on their stock option awards.
Generally all NEO’s option awards, other than those granted on June 25, 2013 as part of the new option framework awards, are divided into three tranches for vesting purposes: a time option, a performance option and an exit option.
As noted above, one-half of the options are subject to time-based vesting restrictions, one-sixth of the options are subject to performance-based vesting restrictions and one-third of the options are subject to exit event-based vesting restrictions. However, to the extent any option holder had vested time options at the time of the exchange offer, the number of time options granted in the exchange offer was adjusted so that after the exchange offer one-half of the option holder’s aggregate options would be time-based. The time-based options are scheduled to vest based on a five year vesting schedule. Accordingly, other than with respect to Mr. Walsh’s most-recently granted options as noted above, subject to continued employment with us through the applicable vesting dates, 20% of the options subject to time-based vesting will vest and become exercisable on each of the first five anniversaries of the date of grant or vesting reference date, as applicable (or the date of commencement of employment, in the case of Mr. Chiminski). In addition, solely for Mr. Chiminski, to the extent that all or a fraction of the exit event-based vesting options vest, a proportionate amount of each tranche of unvested time-based options will vest. Subject to continued employment with us through the applicable vesting dates, the performance-based vesting options will vest and become exercisable with respect to 20% of the options subject to performance-vesting option on each of the first five anniversaries of the date of grant or vesting reference date, as applicable (which date is either before or after the end of the applicable fiscal year, depending on the grant date of the options), if we achieve specified EBITDA performance targets (subject to a cumulative catch-up). The EBITDA performance targets were established at levels that are reasonably attainable but challenging to achieve. Fiscal 2010 budgeted EBITDA served as the base line target for the first fiscal year in the vesting schedule and the targets for the remaining four fiscal years of the vesting schedule are based on eight percent (8%) year over year increases thereafter. The exit event-based vesting options will vest and become exercisable in two tiers if either specified internal rate of return or multiple of investment targets are achieved as follows:
| • | One-half of the shares subject to the exit event-vesting options will vest on the date, if any, when either (1) The Blackstone Group will have received cash proceeds or marketable securities from the sale of its investment in us aggregating in excess of 2.5 times the amount of its initial investment in us or (2) The Blackstone Group will have received a cash internal rate of return of at least 20% on its initial investment in us; and |
| • | One-half of the shares subject to the exit event-vesting options will vest on the date, if any, when either (1) The Blackstone Group will have received cash proceeds or marketable securities from the sale of its investment in us aggregating in excess of 1.75 times the amount of its initial investment in us or (2) The Blackstone Group will have received a cash internal rate of return of at least 15% on its initial investment in us. |
However, subject to continued employment through the applicable vesting date, in the event that the 2.5 multiple hurdle or the 20% internal rate of return hurdle is not met, but the 1.75 multiple hurdle or the 15%
111
Table of Contents
internal rate of return hurdle is met, the first tier of options will vest based on straight line interpolation between the two points.
Except as otherwise specifically provided for in the stock option agreement, any part of a NEO’s stock option award that is not vested and exercisable upon his termination of employment will be immediately cancelled. With the exception of Mr. Chiminski, any part of an NEO’s stock option award that is vested upon termination of employment will generally remain outstanding and exercisable for three months after termination of employment (or, if later, until the 90th day following the date on which the options vest), although this period is extended to 12 months (or, if later, the first anniversary of the date on which the option vests) if the termination of employment is due to death or disability, and vested options will immediately terminate if the NEO’s employment is terminated by us for cause. Any vested options that are not exercised within the applicable post-termination exercise window will terminate. Any part of Mr. Chiminski’s stock option award that is vested upon termination of employment will generally remain outstanding and exercisable for three months after termination of employment or the date on which such portion of the option vests in the event of a termination other than a “good termination” or a termination by us or Catalent Pharma Solutions, Inc. for cause or one year after termination of employment in the case of a “good termination” and vested options will immediately terminate if Mr. Chiminski’s employment is terminated by us or Catalent Pharma Solutions, Inc. for cause. Please see “Potential Payments Upon Termination or Change in Control” section below for a description of the potential vesting of the NEOs’ stock option and RSU awards that may occur in connection with a change in control of the Company or our parent, BHP PTS Holdings L.L.C., or certain terminations of employment.
As a condition to receiving his equity-based awards, each NEO was required to enter into a subscription agreement with us, and to become a party to our securityholders agreement. These agreements generally govern the NEO’s rights with respect to any shares of our common stock acquired on exercise of vested stock options or settlement of RSUs, to the extent applicable. The subscription agreement also contains certain restrictive covenants. While employed and for one year (two years for Messrs. Chiminski and Walsh as it relates to the covenant not to solicit) following their termination of employment, NEOs are prohibited from competing with us and from soliciting our employees, consultants and certain actual and prospective clients. The subscription agreement also contains an indefinite restriction on the NEO’s disclosure of our confidential information. If an NEO materially breaches any of these restrictive covenants and is unable to cure the breach, we have the right to “clawback” and recover any gains the Named Officer may have realized with respect to his shares (and with respect to Mr. Chiminski only the shares acquired upon exercise of the options or settlement of RSUs).
Each NEO’s equity-based award was granted under, and is subject to the terms of, the 2007 PTS Holdings Corp. Stock Incentive Plan. The material terms of the 2007 PTS Holdings Corp. Stock Incentive Plan are described below under the heading “Equity Incentive Plans.”
112
Table of Contents
The following table provides information regarding outstanding equity awards held by each NEO as of June 30, 2013.
Outstanding Equity Awards at 2013 Fiscal-Year End
| Name |
Grant Date |
Number of Securities Underlying Unexercised Options (#) Exercisable(1) |
Number of Securities Underlying Unexercised Options (#) Unexercisable |
Equity Incentive Plan Awards: Number of Securities Underlying Unexercised Unearned Options (#) |
Option Exercise Price ($) |
Option Expiration Date(2) |
Number of Shares of Units of Stock that Have Not Vested (#)(3) |
Market Value of Shares or Units of Stock that Have Not Vested ($)(4) |
Equity Incentive Plan Awards: Number of Unearned Shares, Units or Other Rights That Have Not Vested (#) |
Equity Incentive Plan Awards or Payout Value of Unearned Shares, Units or Other Rights That have not Vested ($) |
||||||||||||||||||||||||||||||
| (a) | (b) | (c) | (d) | (e) | (f) | (g) | (h) | (i) | (j) | |||||||||||||||||||||||||||||||
| John Chiminski |
6/25/2013 | 10,000 | 1,310 | 6/25/2023 | ||||||||||||||||||||||||||||||||||||
| 10/23/2009 | 6,750 | 1,350 | 5,400 | 750 | 10/23/2019 | — | — | — | — | |||||||||||||||||||||||||||||||
| 3/17/2009 | 400 | 524,000 | ||||||||||||||||||||||||||||||||||||||
| 10/23/2009 | 400 | 524,000 | ||||||||||||||||||||||||||||||||||||||
| Matthew Walsh |
6/25/2013 | 1,367 | 1,310 | 6/25/2023 | ||||||||||||||||||||||||||||||||||||
| 10/11/2011 | 333 | 500 | 667 | 1,040 | 10/11/2021 | — | — | — | — | |||||||||||||||||||||||||||||||
| 10/11/2011 | 333 | 436,230 | ||||||||||||||||||||||||||||||||||||||
| 10/23/2009 | 1,439 | 694 | 1,600 | 750 | 10/23/2019 | — | — | — | — | |||||||||||||||||||||||||||||||
| 4/17/2008 | 267 | — | — | 1,000 | 4/17/2018 | — | — | — | — | |||||||||||||||||||||||||||||||
| William Downie |
6/25/2013 | 886 | 1,310 | 6/25/2023 | ||||||||||||||||||||||||||||||||||||
| 10/23/2009 | 1,200 | 600 | 1,200 | 750 | 10/23/2019 | — | — | — | — | |||||||||||||||||||||||||||||||
| Samrat Khichi |
6/25/2013 | 1,921 | 1,310 | 6/25/2023 | ||||||||||||||||||||||||||||||||||||
| 10/23/2009 | 1,120 | 547 | 1,200 | 750 | 10/23/2019 | — | — | — | — | |||||||||||||||||||||||||||||||
| 11/27/2007 | 133 | — | — | 1,000 | 11/27/2017 | — | — | — | — | |||||||||||||||||||||||||||||||
| Stephen Leonard |
6/25/2013 | 931 | 1,310 | 6/25/2023 | ||||||||||||||||||||||||||||||||||||
| 10/23/2009 | 1,600 | 800 | 1,600 | 750 | 10/23/2019 | — | — | — | — | |||||||||||||||||||||||||||||||
| (1) | The number of outstanding time-vesting and performance-vesting options vested and exercisable are reported in column (b) above. Unvested outstanding time options are reported in column (c) above and ordinarily become vested pursuant to the vesting schedule for time options described in the “Description of Equity-Based Awards” section above. Unvested outstanding performance options and exit options are reported in column (d) above and ordinarily become vested pursuant to the vesting schedule for performance options and exit options, as applicable, described in the “Description of Equity-Based Awards” section above. Other than with respect to the options granted to Mr. Walsh in fiscal 2012, which have a vesting reference date, all vesting of options granted to the NEOs occurs on the applicable anniversary of the grant date. The first 20% of the performance-based options granted in fiscal 2010 vested on October 23, 2010, the second 20% vested on October 23, 2011, the third 20% vested on October 23, 2012, and none of the outstanding performance exit options have vested. As described in the “Potential Payments Upon Termination or Change in Control” section below, all or a portion of each option grant may vest earlier in connection with a change in control of the Company or BHP PTS Holdings L.L.C. or certain terminations of employment. |
| (2) | The expiration date shown is the normal expiration date occurring on the tenth anniversary of the grant date. Options may terminate earlier in certain circumstances, such as in connection with an NEO’s termination of employment or in connection with certain corporate transactions, including a change in control of the Company or BHP PTS Holdings L.L.C. |
| (3) | The number of outstanding RSUs reported for Mr. Chiminski in column (g) above represents two separate grants: 2,000 RSUs granted on March 17, 2009 and 1,000 RSUs granted on October 23, 2009. Each RSU grant vests 20% per year from the date of grant, subject to the executive’s continued employment through the applicable vesting date. Once vested, the RSUs will be settled on the earlier to occur of (1) the seventh anniversary of Mr. Chiminski’s employment commencement date (March 17, 2009), or (2) the date a change in control of the Company or BHP PTS Holdings L.L.C. occurs. For Mr. Walsh, the number of outstanding RSUs in column (g) above represents 500 RSUs granted on October 11, 2011. The RSUs for Mr. Walsh will vest as follows: 166 RSUs will vest on September 26, 2013; and 166 RSUs will vest on September 26, 2014, subject to the executive’s continued employment through the applicable vesting date. Once vested, the RSUs will be settled on the earlier of (i) March 26, 2015 or (ii) the date of a change in control. |
| (4) | Based upon a market value of $1,310 per share as of June 30, 2013. |
113
Table of Contents
Option Exercises and Stock Vested in Fiscal 2013
On March 17, 2013, Mr. Chiminski vested in an additional 20% of the 2,000 RSUs granted to him on March 17, 2009 and on October 23, 2012, he vested in an additional 20% of the 1,000 RSUs granted to him on October 23, 2009. The following table provides information regarding this vesting. During fiscal 2013, the other NEOs did not exercise any options or similar instruments or vest in any stock or similar instruments.
| Option Awards | Stock Awards(1) | |||||||||||||||
| Name |
Number of Shares Acquired on Exercise (#) |
Value Realized on Exercise ($) |
Number of Shares Acquired on Vesting (#) |
Value Realized on Vesting ($)(2) |
||||||||||||
| (a) | (b) | (c) | (d) | (e) | ||||||||||||
| John Chiminski |
— | — | 600 | 780,000 | ||||||||||||
| Matthew Walsh |
— | — | 167 | 217,100 | ||||||||||||
| William Downie |
— | — | — | — | ||||||||||||
| Stephen Leonard |
— | — | — | — | ||||||||||||
| Samrat Khichi |
— | — | — | — | ||||||||||||
| (1) | For Mr. Chiminski the vested shares includes the vesting of 200 RSUs on October 23, 2012 with a value realized on vesting of $260,000 that were originally granted on October 23, 2009 and the vesting of 400 RSUs on March 17, 2013 with a value realized on vesting of $520,000 that were originally granted on March 17, 2009. The 200 RSUs that vested on October 23, 2012 and the 400 RSUs that vested on March 17, 2013 will be settled on the earlier to occur of (1) the seventh anniversary of Mr. Chiminski’s employment commencement date (March 17, 2009), or (2) the date a change in control of the Company or BHP PTS Holdings L.L.C. occurs. For Mr. Walsh the vested shares include the vesting of 167 RSUs on September 26, 2012 with a value realized on vesting of $217,100. These vested RSUs will be settled on the earlier to occur of (x) March 26, 2015 and (y) the date that a change in control of the Company or BHP PTS Holdings L.L.C. occurs. |
| (2) | Based on a market value of $1,300 per share on September 26, 2012, October 23, 2012 and March 17, 2013, the applicable vesting dates. |
Non-qualified Deferred Compensation-Fiscal 2013
The following table provides information regarding contributions, earnings and balances for our NEOs under our deferred compensation plan.
| Name |
Executive Contributions in Last FY ($)(1) |
Registrant Contributions in Last FY ($)(3) |
Aggregate Earnings in Last FY ($)(4) |
Aggregate Withdrawals/ Distributions ($) |
Aggregate Balance at Last FYE ($)(5) |
|||||||||||||||
| (a) | (b) | (c) | (d) | (e) | (f) | |||||||||||||||
| John Chiminski |
||||||||||||||||||||
| Deferred Compensation |
110,500 | 2,850 | 23,754 | — | 219,122 | |||||||||||||||
| Vested but Undelivered RSUs(2) |
780,000 | — | 29,212 | — | 3,826,707 | |||||||||||||||
| Total |
890,500 | 2,850 | 52,966 | — | 4,045,829 | |||||||||||||||
| Matthew Walsh |
||||||||||||||||||||
| Deferred Compensation |
95,418 | 3,196 | 53,716 | — | 478,454 | |||||||||||||||
| Vested but Undelivered RSUs(2) |
217,100 | — | 1,670 | — | 218,770 | |||||||||||||||
| Total |
312,518 | 3,196 | 55,386 | — | 697,224 | |||||||||||||||
| William Downie |
||||||||||||||||||||
| Deferred Compensation |
— | — | — | — | — | |||||||||||||||
| Samrat Khichi |
||||||||||||||||||||
| Deferred Compensation |
28,535 | 3,000 | 20,292 | — | 153,037 | |||||||||||||||
| Stephen Leonard |
||||||||||||||||||||
| Deferred Compensation |
24,900 | 3,000 | 8,416 | — | 75,979 | |||||||||||||||
114
Table of Contents
| (1) | The amounts under “Deferred Compensation” are reported as compensation for fiscal 2013 under “Salary” in the Summary Compensation Table. |
| (2) | The amount reported for Mr. Chiminski in column (b) reflects the value of 600 vested and undelivered RSUs as of the vesting date of which 200 RSUs vested on October 23, 2012 and 400 RSUs vested on March 17, 2013. The 200 RSUs that vested on October 23, 2012 and the 400 RSUs that vested on March 17, 2013 will be settled on the earlier to occur of (1) the seventh anniversary of Mr. Chiminski’s employment commencement date (March 17, 2009), or (2) the date a change in control of the Company or BHP PTS Holdings L.L.C. occurs. The amount reported for Mr. Walsh in column (b) reflects the value of 167 vested and undelivered RSUs as of the September 26, 2012 vesting date. The 167 RSUs that vested on September 26, 2012 will be settled on the earlier to occur of (x) March 26, 2015 and (y) the date that a change in control of the Company or BHP PTS Holdings L.L.C. occurs. |
| (3) | The amount reported for Messrs. Chiminski, Walsh, Khichi and Leonard are reported as compensation for fiscal 2013 under “All Other Compensation” in the Summary Compensation Table. |
| (4) | Amount reported for Mr. Chiminski under “Vested but Undelivered RSUs” reflects the increase in fair market value between October 23, 2012 and June 30, 2013 with respect to 200 of the vested RSUs reported in column (b), and between March 17, 2013 and June 30, 2013 with respect to the 400 RSUs reported in column (b). The amount reported also reflects the increase in fair market value between July 1, 2012 and June 30, 2013 with respect to the 400 RSUs that vested on March 17, 2010 and that were reported in column (b) in the fiscal 2010 Non-Qualified Deferred Compensation Table and 600 RSUs in which 200 vested on October 23, 2010 and 400 vested on March 17, 2011 and that were reported in column (b) in the fiscal 2011 Non-Qualified Deferred Compensation Table and 600 RSUs in which 200 vested on October 23, 2011 and 400 vested on March 17, 2012 and that were reported in column (b) in the fiscal 2012 Non-Qualified Deferred Compensation Table and the 721.15 RSUs which were fully vested on the grant date of September 16, 2011 pursuant to Mr. Chiminski’s election to defer 50% of his annual MIP bonus for fiscal 2011 to satisfy his stock purchase requirement for fiscal 2011 and that were reported in column (b) in the fiscal 2012 Non-Qualified Deferred Compensation Table. The amount reported for Mr. Walsh under “Vested but Undelivered RSUs” reflects the increase in fair market value between September 26, 2012 and June 30, 2013 with respect to the 167 vested RSUs reported in column (b). The amounts reported are not considered compensation reportable in the Summary Compensation Table. |
| (5) | Includes $70,616 previously reported as compensation to Mr. Chiminski in the columns “Salary” and “All Other Compensation” in the Summary Compensation Table in previous years. Includes $260,924 previously reported as compensation to Mr. Walsh in the columns “Salary” and “All Other Compensation” in the Summary Compensation Table in previous years. Includes $80,633 previously reported as compensation to Mr. Khichi in the columns “Salary” and “All Other Compensation” in the Summary Compensation Table in previous years. Includes $35,031 previously reported as compensation to Mr. Leonard in the columns “Salary” and “All Other Compensation” in the Summary Compensation Table in previous years. Aggregate balance for Mr. Chiminski under “Vested but Undelivered RSUs” reflects the value of 2,921.15 RSUs as of June 30, 2013 based upon a market value of $1,310 per share as of such date. 2,200 of these RSUs were previously reported as “Stock Awards” in the Summary Compensation Table and with respect to the 721.15 fully vested RSUs granted to Mr. Chiminski pursuant to his election to defer 50% of his annual MIP bonus for fiscal 2011, $750,000 has been previously reported in the “Non-Equity Incentive Plan Compensation” column in the Summary Compensation Table. Aggregate balance for Mr. Walsh under “Vested but Undelivered RSUs” reflects the value of 167 RSUs as of June 30, 2013 based upon a market value of $1,310 per share as of such date. These RSUs were previously reported as “Stock Awards” in the Summary Compensation Table. |
Non-qualified Deferred Compensation Plan
We offer a non-qualified deferred compensation plan for a select group of our management and highly compensated employees. Eligible employees selected to participate in the plan may elect to defer on a pre-tax basis up to 20% of their base salaries and 100% of their annual cash bonuses. Participating directors may elect to defer between 20% and 100% of their fees for service on our board of directors (including meeting fees) into the plan each year.
115
Table of Contents
In our discretion, each year we may elect to make one or more company contributions to participants under the plan; however, the plan does not require us to make any such contributions. Company contributions can be matching contributions or one or more contributions equal to a percentage of a participant’s compensation (regardless of the amount deferred), which includes a contribution designed to supplement social security benefits. Any matching contributions are made with respect to base salary only for all participants with the exception of sales people who are eligible to receive a company matching contribution on base salary, bonuses and commissions. Any company contributions, however, are generally only made with respect to the first $100,000 of a participant’s eligible compensation in excess of the annual compensation limit under the Internal Revenue Code for each year (the limit is $255,000 for calendar year 2013).
Participants are always 100% vested in their elective deferrals, and in any company matching contributions (including related earnings in each case). Participants become vested in other company contributions and related earnings after three years of service with us or upon retirement, death, total disability or a change in control of us. We have not made any company contributions other than matching contributions since 2009.
Under the plan, we have the discretion to either credit participants’ accounts with a hypothetical earnings rate, or to credit the accounts with earnings and/or losses based on the deemed investment of the accounts in investment alternatives selected by us, which investment alternatives generally include the investment funds available under our 401(k) plan. During fiscal 2013, participants were permitted to select the investment alternatives in which they wanted their accounts to be deemed to be invested and were credited with earnings and/or losses based on the performance of the relevant investments. Participants were able to change the investment elections for their accounts on a daily basis during fiscal 2013. For fiscal 2013, participants were able to choose from among a total of 24 investment options, however, the Named Officers were only invested in the following twelve investment options in fiscal 2013:
| Name of Investment Fund |
1-Year Rate of Return % (as of 6/30/13) |
|||
| Spartan 500 Index Fund—Institutional Class |
20.57 | % | ||
| Spartan Extended Market Index Fund—Fidelity Advantage Class |
25.39 | % | ||
| Spartan Intermediate Treasury Bond Index Fund—Fund Fidelity Advantage Class |
(2.72 | )% | ||
| CRM Mid Cap Value Fund Class Investor |
23.43 | % | ||
| PIMCO Total Return Fund—Institutional Class |
1.20 | % | ||
| Columbia Acorn USA Class Z |
20.18 | % | ||
| Fidelity Growth Company Fund—Class K |
18.18 | % | ||
| Fidelity Diversified International Fund—Class K |
18.51 | % | ||
| Fidelity Freedom K 2000 Fund |
3.59 | % | ||
| Fidelity Freedom K 2025 Fund |
11.37 | % | ||
| Fidelity Freedom K 2035 Fund |
13.87 | % | ||
| Fidelity Balanced |
12.57 | % | ||
Participants’ accounts that are paid out in a lump-sum cash payment are paid on the 15th day of the month immediately following the month during which the six month anniversary of the participant’s separation from service (other than due to death) with us (within the meaning of Section 409A of the Internal Revenue Code) occurs. In the event of the death of a participant prior to the commencement of the distribution of benefits under the plan, such benefits will be paid no later than the later of (x) December 31 of the year in which the participant’s death occurs and (y) the ninetieth (90th) day following the date of the participant’s death. Participants may also elect to receive a payout of their accounts in annual installments over a period of five or 10 years after their separation from service (including death), although notwithstanding any such elections, the participant’s account will be paid in a lump-sum cash payment in connection with a participant’s separation from service within two years following a change in control of us. Participants may also elect to receive a distribution in connection with an unforeseeable emergency, in accordance with the requirements of Section 409A of the Internal Revenue Code. Salary deferrals, company contributions and any applicable gains are held in a “rabbi”
116
Table of Contents
trust. “Rabbi” trust assets are ultimately controlled by us. Operating the deferred compensation plan this way is required by federal tax law in order to defer the taxation benefits from the plan until they are paid to the participants.
Potential Payments Upon Termination or Change in Control
The following section describes the payments and benefits that may become payable to the NEOs in connection with their termination of employment and/or a change in control. All such payments and benefits will be paid or provided by us or Catalent Pharma Solutions, Inc. For purposes of this section, we have assumed that (1) the price per share of our common stock on June 28, 2013, the last business day of fiscal 2013 is equal to its fair market value as determined in good faith by our board of directors because there has never been a public market for our common stock prior to this offering, (2) we do not exercise any discretion to accelerate the vesting of outstanding options or restricted stock units in connection with a change in control of Catalent Pharma Solutions, Inc. and (3) the value of any stock options that may be accelerated is equal to the full value of such awards (i.e., the full “spread” value for stock options on June 28, 2013). The 2007 PTS Holdings Corp. Stock Incentive Plan gives our board of directors considerable discretion with respect to the treatment of outstanding options and restricted stock units in the event of a change in control. If our board of directors exercises its discretion to fully vest outstanding options and RSUs, the NEOs may receive benefits in addition to those described below.
In addition to the amounts presented below, the NEOs will also be entitled to the benefits quantified and described under the “Non-Qualified Deferred Compensation—Fiscal 2013” section above. Please see “Compensation Discussion and Analysis—Current Compensation Program Elements—Severance and Other Benefits” for a discussion of how the amounts of the payments and benefits presented below were determined.
Mr. Chiminski
Mr. Chiminski’s employment agreement, the 2007 PTS Holdings Corp. Stock Incentive Plan and the related stock option agreement and restricted stock unit agreements each provide for certain benefits to be paid to him upon termination under the terms described below. If Mr. Chiminski’s employment terminates due to his disability or death, he would be entitled to (1) a pro-rata portion of any annual cash bonus he would have earned for the year of termination and (2) accelerated vesting of the portion of his time vesting options and restricted stock units that would otherwise have vested within 12 months following his termination of employment. In addition, Mr. Chiminski will retain the opportunity through the ten year term to vest, subject only to attaining the specified internal rate of return or multiple of investment targets, in a portion of the unvested exit options equal to a fraction, the numerator of which is the number of days elapsing from his commencement date through the termination date and the denominator of which is the number of days elapsing from his commencement date through the date of the event that triggers additional exit option vesting. Any pro-rata bonus payment would have been paid in a lump-sum within two and one-half (2-1/2) months after the end of the fiscal year in which Mr. Chiminski’s termination of employment occurred. Should Mr. Chiminski’s employment terminate due to death, his beneficiaries would also be entitled to a death benefit equal to 1.5 times his base salary ($1,275,000) under a company provided group life insurance benefit program which covers all eligible active employees.
The employment agreement provides that upon any good termination or due to Mr. Chiminski’s election not to extend the term, he will be entitled to receive a pro-rata portion of any annual cash bonus he would have earned for the year of termination based on Catalent’s actual performance in respect of the full fiscal year in which Mr. Chiminski’s employment terminates.
The employment agreement further provides that if Mr. Chiminski’s employment is terminated by us or Catalent Pharma Solutions, Inc. without cause, by Mr. Chiminski for good reason or due to our or Catalent Pharma Solutions, Inc.’s election not to extend the term, then, subject to his execution, delivery and non-revocation of a release of claims with respect to Catalent and its affiliates, Mr. Chiminski will be entitled to receive, in addition to certain accrued amounts and a pro-rata bonus, as discussed above, an amount equal to two times the sum of (x) Mr. Chiminski’s annualized then-current base salary (which salary, for purposes of
117
Table of Contents
calculating severance amounts, will in no event be less than $850,000) and (y) his annual target bonus, payable in equal monthly installments over a two year period; provided, however, that if such termination occurs within the two year period following a change in control such payment will instead be made in a single lump sum payment within thirty days following the termination date. Notwithstanding the foregoing, Catalent’s obligation to make such payments will cease in the event of a material breach by Mr. Chiminski of the restrictive covenants contained in the employment agreement (described below), if such breach remains uncured for a period of ten days following written notice of such breach. Pursuant to the terms of the employment agreement, Mr. Chiminski is subject to a covenant not to (x) compete with us while employed and for one year following his termination of employment for any reason and (y) solicit our employees, consultants and certain actual and prospective clients while employed and for two years following his termination of employment for any reason, in each case, subject to certain specified exclusions. The employment agreement also contains a covenant not to disclose confidential information, an assignment of property rights provision and customary indemnification provisions.
In addition to the payments described above, if Mr. Chiminski’s employment is terminated by us or Catalent Pharma Solutions, Inc. without cause, by Mr. Chiminski for good reason or due to our or Catalent Pharma Solutions, Inc.’s election not to extend the term, Mr. Chiminski (and his spouse and eligible dependents, to the extent applicable) will also be entitled to continued participation in Catalent’s group health plans for up to two years (for the final six months of this period if coverage cannot be continued he will be paid an amount on a grossed up basis for the company’s cost of such coverage).
At the end of fiscal 2013, Mr. Chiminski would have had a good reason to terminate employment if any of the following had occurred without his consent: (a) any material diminution in his duties, authorities, or responsibilities, or the assignment to him of duties that are materially inconsistent with, or that significantly impair his ability to perform, his duties as Chief Executive Officer of Catalent Pharma Solutions, Inc. or us; (b) any material adverse change in his positions or reporting structures, including ceasing to be the Chief Executive Officer of Catalent Pharma Solutions, Inc. or us or ceasing to be a member of the board of directors of Catalent Pharma Solutions, Inc. or our board of directors; (c) any reduction in his base salary or target annual bonus opportunity (other than a general reduction in base salary or target annual bonus opportunity that affects all members of senior management proportionately); (d) any material failure by us to pay compensation or benefits when due under his employment agreement; (e) any relocation of our principal office or of his principal place of employment to a location more than 50 miles from its location in Somerset, New Jersey, as of his commencement date; or (f) any failure by Catalent Pharma Solutions, Inc. or us, as applicable, to obtain the assumption in writing of its obligation to perform his employment agreement by any successor to all or substantially all of the assets of Catalent Pharma Solutions, Inc. or us, as applicable. No termination of his employment based on a specified good reason event will be effective as a termination for good reason unless (x) Mr. Chiminski gives notice to Catalent Pharma Solutions, Inc. and us of such event within 90 days after he learns that such event has occurred (or, in the case of any event described in clauses (e) or (f), within 30 days after he learns that such event has occurred), (y) such good reason event is not fully cured within 30 days after such notice, and (z) Mr. Chiminski’s employment terminates within 60 days following the end of the cure period.
In the event of any termination of Mr. Chiminski’s employment other than a good termination, all unvested RSUs and options which remain outstanding will be immediately forfeited without consideration as of the termination date. In the event of a good termination, Mr. Chiminski will be deemed vested as of the termination date in any portion of the RSUs and time options that would have otherwise vested if he had remained employed by us or Catalent Pharma Solutions, Inc. through the first anniversary of the termination date and he will also retain the opportunity through the ten year term to vest, subject only to attaining the specified internal rate of return or multiple of investment targets, in a portion of the unvested exit options equal to a fraction, the numerator of which is the number of days elapsing from his commencement date through the termination date and the denominator of which is the number of days elapsing from his commencement date through the date of the event that triggers additional exit option vesting.
To the extent that all or a fraction of the exit options vest, a proportionate amount of each tranche of unvested RSUs and time options which remain outstanding will also vest.
118
Table of Contents
In the event of (x) a change in control or (y) a good termination that occurs within the six month period prior to a change in control, all unvested RSUs and time options will become fully vested as of the change in control (or immediately prior to the change in control, with respect to the options). Any portion of the exit options that remain unvested upon a change in control will remain outstanding and remain eligible for potential future vesting in accordance with the terms of the stock option agreement.
In the event of a change of control in which the exit event-based options granted under the new framework vest, any outstanding unvested performance-based options will also vest.
Unless otherwise specifically provided for in the stock option agreement, any options that are not vested and exercisable upon Mr. Chiminski’s termination of employment will be immediately cancelled. Any options that are vested upon a good termination will remain outstanding and exercisable generally for one year from the termination date or the date on which the option became vested, as applicable, although the period is reduced to 90 days in the case of a termination of employment that is not a good termination and vested options will terminate immediately if Mr. Chiminski’s employment is terminated by Catalent Pharma Solutions, Inc. or us for cause. Any vested options that are not exercised within the applicable post-termination exercise period will terminate.
All shares of our common stock acquired by Mr. Chiminski, including without limitation, shares settled following vesting of the RSUs and shares acquired upon the exercise of the options will be subject to the terms of a subscription agreement. In addition, in connection with the purchase of the shares of our common stock and the grant of the RSUs and options, Mr. Chiminski became a party to our securityholders agreement. These documents generally govern Mr. Chiminski’s rights with respect to all such shares.
If any payments to Mr. Chiminski are subject to golden parachute excise taxes in connection with a change in control and are eligible for exemption under the shareholder approval exemption, we and Catalent Pharma Solutions, Inc. agree to use commercially reasonable efforts to seek the requisite stockholder vote. However, if such exemption is not available and Mr. Chiminski is subject to such taxes, he will also be entitled to receive a tax-gross up payment, provided that such payment will not exceed $1 million.
The following table lists the payments and benefits that would have been triggered for Mr. Chiminski under the circumstances described below assuming that the applicable triggering event occurred on June 28, 2013.
| Triggering Event |
Value of Option/RSU Acceleration(1) |
Value of Base Salary and Target Bonus Payment(2) |
Value of Continued Benefits Participation(3) |
Total ($) |
||||||||||||
| Death or Disability |
1,542,000 | 1,542,000 | ||||||||||||||
| Termination by Us Without Cause or by Mr. Chiminski for Good Reason |
1,542,000 | 3,700,000 | 22,791 | 5,264,791 | ||||||||||||
| Change in Control |
1,804,000 | 1,804,000 | ||||||||||||||
| Death or Disability Within Six months Prior to a change in Control |
1,804,000 | 1,804,000 | ||||||||||||||
| Termination by Us Without Cause or by Mr. Chiminski for Good Reason in Connection With a Change in Control |
1,804,000 | 3,700,000 | 22,791 | 5,526,791 | ||||||||||||
| (1) | The amounts reported represent partial or full accelerated vesting of RSUs and options and are based on our common stock having a fair market value of $1,310 per share on June 28, 2013. The amounts reported reflect the “spread” value of $560 per share for the options granted on October 23, 2009 with an exercise price of $750 and no “spread” value for the options granted on June 25, 2013 with an exercise price of $1,310, in each case representing the difference between the fair market value and the exercise price, to the extent applicable. Amounts reported assume that the exit event options do not vest upon a change in control. |
119
Table of Contents
| (2) | The amount reported consists of two times the sum of Mr. Chiminski’s annual salary and target annual MIP bonus. |
| (3) | The amount reported represents income attributable to the health care premiums paid by us with respect to Mr. Chiminski’s participation in our employee benefit plans for a two year period. Mr. Chiminski would also be entitled to be paid out for any unused paid time off days accrued during 2013 and up to five unused days from the prior year. |
Mr. Walsh
On October 11, 2011, we and Mr. Walsh entered into an employment agreement which replaced the offer letter and severance agreement that Mr. Walsh entered into in 2008 in connection with the commencement of his employment with us. Mr. Walsh’s employment agreement, the 2007 PTS Holdings Corp. Stock Incentive Plan and the related stock option agreement and RSU agreements each provide for certain benefits to be paid to him upon termination.
The employment agreement also provides that if Mr. Walsh’s employment is terminated by us without cause, due to death or disability, by Mr. Walsh for good reason or due to our election not to extend the term, then Mr. Walsh will be entitled to receive, in addition to certain accrued amounts, a pro-rated annual cash bonus. In addition, if Mr. Walsh’s employment is terminated by Catalent without cause (other than by reason of death or disability), by Mr. Walsh for good reason, or due to Catalent’s election not to extend the term, Mr. Walsh will also be entitled to receive, an amount equal to two (2) times the sum of (x) Mr. Walsh’s then annualized base salary and (y) his target bonus (75%), payable in equal monthly installments over a two-year severance period.
In addition to the payments described above, if Mr. Walsh’s employment is terminated by Catalent without cause, by Mr. Walsh for good reason or due to Catalent’s election not to extend the term, Mr. Walsh (and his spouse and eligible dependents, to the extent applicable) will also be entitled to continued participation in Catalent’s group health plans for up to two years (for the final six months of this period, if coverage cannot be continued he will be paid an amount on a grossed up basis for the company’s cost of such coverage).
At the end of fiscal 2013, Mr. Walsh would have had a good reason to terminate employment if any of the following had occurred without his consent, (1) any substantial diminution in his position or duties, adverse change in reporting lines, up and down, or the assignment to him of duties that are materially inconsistent with his position, (2) any reduction in his base salary, (3) any failure of Catalent to pay compensation or benefits when due, (4) Catalent’s failure to provide him with an annual bonus opportunity that is at the same level as established in his offer letter, dated February 29, 2008, or (5) he is required to move his principal business location more than fifty (50) miles. No termination of Mr. Walsh’s employment based on a specified good reason event will be effective as a termination for good reason unless (x) he gives notice to Catalent of such event within thirty (30) days after he learns that such event has occurred, (y) such good reason event is not fully cured within thirty (30) days after such notice (such period, the “Cure Period”), and (z) his employment terminates within sixty (60) days following the end of the Cure Period.
In the event of any termination of Mr. Walsh’s employment, all unvested RSUs and options which remain outstanding will be immediately forfeited without consideration as of the termination date; however, that in the event of a termination of Mr. Walsh’s employment (1) by us without cause, (2) by Mr. Walsh for good reason, (3) due to death or disability or (4) due to our election not to extend the employment term, Mr. Walsh will be deemed vested as of the termination date in any portion of the time-based option that would have otherwise vested if he had remained by us through the first anniversary of the termination date. In the event of a change in control of the Company or BHP PTS Holdings L.L.C., all unvested RSUs and time-based options will become fully vested as of the change in control (or immediately prior to the change in control, with respect to the options).
In the event of a change of control in which the exit event-based options granted under the new framework vest, any outstanding unvested performance-based options will also vest.
120
Table of Contents
The following table lists the payments and benefits that would have been triggered for Mr. Walsh under the circumstances described below assuming that the applicable triggering event occurred on June 28, 2013.
| Triggering Event |
Value of Option/RSU Acceleration(1) |
Value of Base Salary and Target Bonus Payment(2) |
Value of Continued Benefits Participation(3) |
Total ($) |
||||||||||||
| Death or Disability |
261,260 | 261,260 | ||||||||||||||
| Termination by Us Without Cause or by Mr. Walsh for Good Reason |
261,260 | 2,187,500 | 22,791 | 2,471,551 | ||||||||||||
| Change in Control |
959,870 | 959,870 | ||||||||||||||
| (1) | The amounts reported are based on our common stock having a fair market value of $1,310 per share on June 28, 2013. The amounts reported reflect the “spread” value of the options of $560 per share for the options granted on October 23, 2009, $270 per share for the options granted on October 11, 2011 and no “spread” value for options granted on June 25, 2013, in each case representing the difference between the fair market value and the exercise price to the extent applicable. Amounts reported assume that the exit event options do not vest upon a change in control. The amount reported for Mr. Walsh for a change in control of the Company or BHP PTS Holdings L.L.C. also includes the vesting of 333 RSUs having a fair market value of $1,310 per share on June 28, 2013. |
| (2) | The amount reported for Mr. Walsh represents the two times the sum of (x) Mr. Walsh’s current base salary and (y) his target annual cash bonus. |
| (3) | Per Mr. Walsh’s employment agreement which became effective on September 26, 2011, the amount for Mr. Walsh includes 18 months of coverage plus 6 months (on a tax grossed-up basis). Mr. Walsh would also be entitled to be paid out for any unused paid time off days accrued during 2013 and up to five unused days from the prior year. |
Messrs. Downie, Khichi, and Leonard
Messrs. Downie, Khichi, and Leonard were not covered by employment agreements at the end of fiscal 2013. However, Mr. Downie’s, Mr. Khichi’s and Mr. Leonard’s severance agreements, the 2007 PTS Holdings Corp. Stock Incentive Plan, and the related stock option agreements provide for certain benefits to be paid to each of them if their employment terminates for one of the reasons described below. If the employment of Messrs. Downie, Khichi, or Leonard terminates due to death or disability, each will be entitled to accelerated vesting of the portion of their time options that would otherwise have vested within 12 months following a termination of employment (like Mr. Chiminski, they will not be entitled to any similar accelerated vesting for performance options and exit options). Should Mr. Downie’s, Mr. Khichi’s, or Mr. Leonard’s employment terminate due to death, their beneficiaries will receive a death benefit equal to 1.5 times their current base salary ($592,500, $658,500, and $622,500, respectively) under a company provided group life insurance program which covers all eligible active employees.
If the employment of Messrs. Downie, Khichi, or Leonard was terminated by us without cause or by the executive for good reason, in each case at the end of fiscal 2013, each would have been entitled to a severance payment equal to one times the sum of their annual base salary and target annual bonus, payable in equal installments over the one period following the date of their termination of employment. Each would also be entitled to continued participation in our group health plans (to the extent the executives were receiving such coverage as of the termination date), at the same premium rates as may be charged from time to time for employees of Catalent generally, which coverage would be provided until the earlier of (1) the expiration of the one year period following the date of termination of employment and (2) the date the executive becomes eligible for coverage under group health plan (s) of any other employer. Each Named Officer is required to enter into a binding general release of claims as a condition to receiving most severance payments and benefits.
Under the stock option agreements entered into in connection with the 2007 PTS Holdings Corp. Stock Incentive Plan, if the employment of Messrs. Downie, Khichi, or Leonard is terminated by us without cause or by
121
Table of Contents
the Named Officer for good reason, each will be entitled to receive accelerated vesting of the portion of his time options that would otherwise have vested within 12 months following termination of employment (there is no similar accelerated vesting for performance options and exit options). At the end of fiscal 2013, each of Messrs. Downie, Khichi, and Leonard would have had a good reason to terminate employment if, without his consent (a) there had been a substantial diminution in his position or duties or an adverse change in his reporting lines, (b) he was assigned duties that were materially inconsistent with his position, (c) his base salary had been reduced or other earned compensation was not paid when due, (d) our headquarters were relocated by more than 50 miles, or (e) he was not provided with the same annual bonus opportunity specified in his offer letter, in each case, which was not cured within 30 days following our receipt of written notice from him describing the event constituting good reason.
In the event of a change of control in which the exit event-based options granted under the new framework vest, any outstanding unvested performance-based options will also vest.
In the event of a change in control of the Company or BHP PTS Holdings L.L.C., each of Messrs. Downie, Khichi, and Leonard will be entitled to full vesting of their time options. As with Mr. Chiminski, their exit options and performance options will not automatically become fully vested in connection with a change in control; however, the exit options and performance options may become vested in connection with the transaction if the applicable performance targets are attained. Messrs. Downie, Khichi, and Leonard, are each subject to the restrictive covenants contained in the subscription agreement, which covenants are described in the “Description of Equity-Based Awards” section above.
The following table lists the payments and benefits that would have been triggered for Messrs. Downie, Khichi, and Leonard under the circumstances described below assuming that the applicable triggering event occurred on June 28, 2013.
| Triggering Event |
Value of Option Acceleration ($)(1) |
Value of Severance Payment ($)(2) |
Value of Continued Benefits Participation ($)(3) |
Total ($) |
||||||||||||
| Death or Disability |
||||||||||||||||
| William Downie |
168,000 | 168,000 | ||||||||||||||
| Samrat Khichi |
152,880 | 152,880 | ||||||||||||||
| Stephen Leonard |
224,000 | 224,000 | ||||||||||||||
| Termination by Us Without Cause or by the Executive for Good Reason |
||||||||||||||||
| William Downie |
168,000 | 691,250 | 11,376 | 870,626 | ||||||||||||
| Samrat Khichi |
152,880 | 768,250 | 9,967 | 931,097 | ||||||||||||
| Stephen Leonard |
224,000 | 726,250 | 9,967 | 960,217 | ||||||||||||
| Change in Control |
||||||||||||||||
| William Downie |
336,000 | 336,000 | ||||||||||||||
| Samrat Khichi |
306,320 | 306,320 | ||||||||||||||
| Stephen Leonard |
448,000 | 448,000 | ||||||||||||||
| (1) | The amounts reported are based on our common stock having a fair market value of $1,310 per share on June 28, 2013. The amounts reported reflect the “spread” value of $560 per share with respect to options granted in fiscal 2010 and no “spread” value with respect to options granted in fiscal 2013, in each case representing the difference between the fair market value and the exercise price. Amounts reported assume that the exit event options do not vest upon a change in control. |
| (2) | The amounts reported for Messrs. Downie, Khichi and Leonard represent the sum of each executive’s annual base salary and target annual bonus. |
| (3) | The amounts reported represent income attributable to the health care premiums paid by us with respect to each Named Officer’s continued participation in our employee benefit plans for a one year period. |
122
Table of Contents
Compensation Committee Interlocks and Insider Participation
Our compensation committee comprises . is the Chairman of the Compensation Committee. The compensation committee is responsible for determining, reviewing, approving and overseeing our executive compensation program.
No member of the compensation committee was at any time during fiscal 2013, or at any other time, one of our officers or employees. We are parties to certain transactions with The Blackstone Group described in the “Certain Relationships and Related Transactions” section below. None of our executive officers has served as a director or member of the compensation committee, or other committee serving an equivalent function, of any entity, whose executive officers served as a director of our company or member of our compensation committee.
Equity Incentive Plans
2007 Stock Incentive Plan
On May 7, 2007, we adopted the 2007 PTS Holdings Corp. Stock Incentive Plan (the “2007 Stock Incentive Plan”), which was approved by our shareholders on May 7, 2007. We amended the 2007 Stock Incentive Plan, effective September 8, 2010 and further amended it, effective June 25, 2013.
Following the offering, we will no longer grant equity-based awards under the 2007 Stock Incentive Plan; however, any outstanding stock options and restricted stock units granted under the 2007 Stock Incentive Plan prior to the offering will remain outstanding in accordance with the terms of the 2007 Stock Incentive Plan. New equity-based awards will be granted under the 2014 Omnibus Incentive Plan, which we intend to adopt in connection with this offering. The following description sets forth the material terms of the 2007 Stock Incentive Plan, which is incorporated herein by reference.
General Information
The purpose of the 2007 Stock Incentive Plan is to aid us and our affiliates in recruiting and retaining key employees, directors, other service providers, or independent contractors and to motivate such employees, directors, other service providers, or independent contractors to exert their best efforts on behalf of us and our affiliates by providing incentives through the granting of awards. We expect that we will benefit from the added interest which such key employees, directors, other service providers, or independent contractors will have in our welfare as a result of their proprietary interest in our success.
Administration
The 2007 Stock Incentive Plan is administered by the compensation committee of our board of directors, or such other committee of our board of directors (including, without limitation, our full board of directors) to which our board of directors has delegated power to act under or pursuant to the provisions of the 2007 Stock Incentive Plan (the “2007 Plan Committee”), which may delegate its duties and powers in whole or in part to any subcommittee of the 2007 Plan Committee. In addition, the 2007 Plan Committee may delegate the authority to grant awards under the 2007 Stock Incentive Plan to any employee or group of our or any of our affiliates’ employees; provided that such delegation and grants are consistent with applicable law and guidelines established by our board of directors from time to time. Awards may, in the discretion of the 2007 Plan Committee, be made under the 2007 Stock Incentive Plan in assumption of, or in substitution for, outstanding awards previously granted by us or any of our affiliates or a company acquired by us or with which we combine. The 2007 Plan Committee is authorized to interpret the 2007 Stock Incentive Plan, to establish, amend and rescind any rules and regulations relating to the 2007 Stock Incentive Plan, and to make any other determinations that it deems necessary or desirable for the administration of the 2007 Stock Incentive Plan. The 2007 Plan Committee may correct any defect or supply any omission or reconcile any inconsistency in the 2007 Stock Incentive Plan in the manner and to the extent the 2007 Plan Committee deems necessary or desirable. Any decision of the 2007 Plan Committee in the interpretation and administration of the 2007 Stock Incentive Plan
123
Table of Contents
lies within its sole and absolute discretion and will be final, conclusive and binding on all parties concerned (including, but not limited to, participants under the 2007 Stock Incentive Plan and their beneficiaries or successors). The 2007 Plan Committee has the full power and authority to establish the terms and conditions of any award issued pursuant to the 2007 Stock Incentive Plan, consistent with the provisions of the 2007 Stock Incentive Plan, and to waive any such terms and conditions at any time (including, without limitation, accelerating or waiving any vesting conditions). The 2007 Plan Committee will require payment of any amount it may determine to be necessary to withhold for federal, state, local or other taxes as a result of the exercise, grant or vesting of an award issued pursuant to the 2007 Stock Incentive Plan, and we or our affiliates will have the right and are authorized to withhold any applicable withholding taxes with respect to any award issued pursuant to the 2007 Stock Incentive Plan, its exercise, or any payment or transfer under or with respect to such award and to take such other action as may be necessary in the opinion of the 2007 Plan Committee to satisfy all obligations for the payment of such withholding taxes. Unless the 2007 Plan Committee specifies otherwise, the participant may elect to pay a portion or all of such withholding taxes by (a) delivery in shares, provided that such shares have been held by the participant for more than six (6) months (or such other period established by the 2007 Plan Committee from time to time in order to avoid adverse accounting treatment applying generally accepted accounting principles) or (b) with respect to minimum withholding amounts only, having shares with a “Fair Market Value” (as such term is defined in the 2007 Stock Incentive Plan) equal to the amount withheld by us from any shares that would have otherwise been received by the participant.
Eligibility
The 2007 Stock Incentive Plan permits the grant of stock options, stock appreciation rights, or certain other stock-based awards such as restricted stock, restricted stock units, performance shares, common stock, performance units, or cash settled awards to our and our affiliates’ employees, directors, other service providers, or independent contractors. Participants are selected from time to time by the 2007 Plan Committee, in its sole discretion, from among those eligible to participate in the 2007 Stock Incentive Plan.
Stock Subject to the 2007 Stock Incentive Plan
Subject to adjustment as discussed below, a maximum of 104,114 shares of our common stock may be issued pursuant to awards under the 2007 Stock Incentive Plan. The issuance of shares or the payment of cash upon the exercise of an award or in consideration of the cancellation or termination of an award will reduce the total number of shares available under the 2007 Stock Incentive Plan, as applicable. Shares which are subject to awards or portions of awards which are forfeited without being exercised or terminate or lapse without the payment of consideration may be granted again under the 2007 Stock Incentive Plan. No award may be granted under the 2007 Stock Incentive Plan after the tenth anniversary of the effective date of the 2007 Stock Incentive Plan, but awards granted prior to such date may extend beyond that date. As of March 1, 2014, 95,072 stock options and 4,221 restricted stock units have been granted and are outstanding under the 2007 Stock Incentive Plan.
Options
Options granted under the 2007 Stock Incentive Plan will be non-qualified stock options, and will be subject to the foregoing and the following terms and conditions and to such other terms and conditions that are not inconsistent therewith, as the 2007 Plan Committee determines:
(1) Price. The option price per share will be determined by the 2007 Plan Committee, but will not be less than 100% of the Fair Market Value of a share on the date an option is granted (other than in the case of options granted in substitution of previously granted awards).
(2) Exercisability. Options granted under the 2007 Stock Incentive Plan will be exercisable at such time and upon such terms and conditions as may be determined by the 2007 Plan Committee, but in no event will an option be exercisable more than ten years after the date it is granted.
124
Table of Contents
(3) Exercise of Options. Except as otherwise provided in the 2007 Stock Incentive Plan or in an award agreement, an option may be exercised for all, or from time to time any part, of the shares for which it is then exercisable. The purchase price for the shares underlying the option being exercised will be paid to us (1) in cash or its equivalent, (2) in shares having a Fair Market Value equal to the aggregate exercise price for the shares being purchased and satisfying such other requirements as may be imposed by the 2007 Plan Committee, provided that such shares have been held for more than six months or such other period as established from time to time by the 2007 Plan Committee to avoid adverse accounting treatment applying generally accepted accounting principles, (3) partly in cash and partly in such shares, (4) if there is a public market for the shares at such time, to the extent permitted by the 2007 Plan Committee and subject to such rules as may be established by the 2007 Plan Committee, through the delivery of irrevocable instructions to a broker to sell shares obtained upon the exercise of the option and to deliver promptly to us an amount out of the proceeds of such sale equal to the aggregate exercise price for the shares being purchased, or (5) using a net settlement mechanism whereby the number of shares delivered upon the exercise of the option will be reduced by a number of shares that has a Fair Market Value equal to the exercise price, provided that the participant tenders cash or its equivalent to pay any applicable withholding taxes. No participant has any rights to dividends or other rights of a stockholder with respect to shares subject to an option until the participant has given written notice of exercise of the option, paid in full for such shares and, if applicable, has satisfied any other conditions imposed by the 2007 Plan Committee pursuant to the 2007 Stock Incentive Plan.
Stock Appreciation Rights
The 2007 Plan Committee may grant (1) a stock appreciation right independent of an option or (2) a stock appreciation right in connection with an option, or a portion thereof. The exercise price per share of a stock appreciation right will be an amount determined by the 2007 Plan Committee but in no event will such amount be less than the Fair Market Value of a share on the date the stock appreciation right is granted (other than in the case of stock appreciation rights granted in substitution of previously granted awards); provided, however, that in the case of a stock appreciation right granted in conjunction with an option, or a portion thereof, the exercise price may not be less than the exercise price of the related option. Each stock appreciation right granted independent of an option will entitle a participant upon exercise to an amount equal to the excess of the Fair Market Value on the exercise date of one share over the exercise price per share, multiplied by the number of shares covered by the stock appreciation right. The 2007 Plan Committee may impose, in its discretion, such conditions upon the exercisability or transferability of stock appreciation rights as it may deem fit, but in no event will a stock appreciation right be exercisable more than ten years after the date it is granted.
Other Stock-Based Awards
The 2007 Plan Committee, in its sole discretion, may grant or sell awards of shares, awards of restricted shares and awards that are valued in whole or in part by reference to, or are otherwise based on the Fair Market Value of, shares (“Other Stock-Based Awards”). Such Other Stock-Based Awards will be in such form, and dependent on such conditions, as the 2007 Plan Committee determines, including, without limitation, the right to receive, or vest with respect to, one or more shares (or the equivalent cash value of such shares) upon the completion of a specified period of service, the occurrence of an event and/or the attainment of performance objectives. Other Stock-Based Awards may be granted alone or in addition to any other awards granted under the 2007 Stock Incentive Plan. Subject to the provisions of the 2007 Stock Incentive Plan, the 2007 Plan Committee determines to whom and when Other Stock-Based Awards will be made, the number of shares to be awarded under (or otherwise related to) such Other Stock-Based Awards, whether such Other Stock-Based Awards will be settled in cash, shares or a combination of cash and shares, and all other terms and conditions of such awards (including, without limitation, the vesting provisions thereof and provisions ensuring that all shares so awarded and issued will be fully paid and non-assessable).
Adjustments
In the event of any change in the outstanding shares by reason of any share dividend or split, reorganization, recapitalization, merger, consolidation, spin-off, combination, or transaction or exchange of shares or other
125
Table of Contents
corporate exchange, or any distribution to shareholders other than regular cash dividends or any transaction similar to the foregoing, the 2007 Plan Committee, in its sole discretion and without liability to any person, will make such substitution or adjustment, if any, as it deems to be equitable (to the extent permissible under Section 409A of the Code), as to (1) the number or kind of shares or other securities issued or reserved for issuance pursuant to the 2007 Stock Incentive Plan or pursuant to outstanding awards, (2) the exercise price of any stock option or award and/or (3) any other affected terms of such awards.
Change of Control
Under the 2007 Stock Incentive Plan, a change of control means: (i) the sale or disposition, in one or a series of related transactions, of all or substantially all of our assets or the assets of BHP PTS Holdings, L.L.C. to any “Person” or “Group” (as such terms are defined in the 2007 Stock Incentive Plan) other than The Blackstone Group or its affiliates (as defined in Rule 501(b) of the Securities Act), or (ii) any “Person” or “Group”, other than The Blackstone Group or its affiliates, is or becomes the Beneficial Owner (as such term is defined under Rules 13d-3 and 13d-5 of the Exchange Act) directly or indirectly, of more than 50% of the total voting power of our voting equity or the voting equity of BHP PTS Holdings, L.L.C., including by way of merger, consolidation or otherwise and The Blackstone Group ceases to directly or indirectly control our board of directors.
In the event of a change of control, (1) if determined by the 2007 Plan Committee in the applicable award agreement or otherwise, any outstanding awards issued pursuant to the 2007 Stock Incentive Plan then held by participants which are unexercisable or otherwise unvested or subject to lapse restrictions will automatically be deemed exercisable or otherwise vested or no longer subject to lapse restrictions, as the case may be, as of immediately prior to such change of control and (2) the 2007 Plan Committee may, but will not be obligated to, to the extent permissible under Section 409A of the Code, (A) accelerate, vest or cause the restrictions to lapse with respect to all or any portion of an award, (B) cancel such awards for fair value (as determined in the sole discretion of the 2007 Plan Committee) which, in the case of options and stock appreciation rights, may equal the excess, if any, of value of the consideration to be paid in the change of control transaction to holders of the same number of shares subject to such options or stock appreciation rights (or, if no consideration is paid in any such transaction, the Fair Market Value of the shares subject to such options or stock appreciation rights) over the aggregate exercise price of such options or stock appreciation rights, (C) provide for the issuance of substitute awards that will substantially preserve the otherwise applicable terms of any affected award previously granted under the 2007 Stock Incentive Plan as determined by the 2007 Plan Committee in its sole discretion, or (D) provide that for a period of at least 15 days prior to the change of control, such awards will be exercisable, to the extent applicable, as to all shares subject thereto and the 2007 Plan Committee may further provide that upon the occurrence of the change of control, such awards will terminate and be of no further force and effect.
Amendment and Termination
Our board of directors may amend, alter or discontinue the 2007 Stock Incentive Plan, but no amendment, alteration or discontinuation can be made, (a) without the approval of our shareholders, if such action would (except as is provided in the adjustment provisions under the 2007 Stock Incentive Plan, discussed above), increase the total number of shares reserved for purposes of the 2007 Stock Incentive Plan or (b) without the consent of a participant, if such action would diminish any of the rights of the participant under any award granted prior to such date to such participant under the 2007 Stock Incentive Plan; provided, however, that the 2007 Plan Committee may amend the 2007 Stock Incentive Plan in such manner as it deems necessary to permit the granting of awards meeting the requirements of the Code or other applicable laws (including, without limitation, to avoid adverse tax consequences to us or to participants).
Non-Transferability
Unless otherwise determined by the 2007 Plan Committee, an award is not transferable or assignable by the participant otherwise than by will or by the laws of descent and distribution. An award issued pursuant to the 2007 Stock Incentive Plan exercisable after the death of a participant may be exercised by the legatees, personal representatives or distributees of the participant.
126
Table of Contents
No Right to Employment
The granting of an award under the 2007 Stock Incentive Plan imposes no obligation on us or any of our affiliates to continue the employment of a participant and does not lessen or affect our or our affiliate’s right to terminate the employment of such participant.
2014 Omnibus Incentive Plan
In connection with this offering, our board of directors expects to adopt, and our stockholders expect to approve, the 2014 Omnibus Incentive Plan prior to the completion of the offering.
Purpose
The purpose of the 2014 Omnibus Incentive Plan is to provide a means through which to attract and retain key personnel and to provide a means whereby our directors, officers, employees, consultants and advisors (and prospective directors, officers, employees, consultants and advisors) can acquire and maintain an equity interest in us, or be paid incentive compensation, including incentive compensation measured by reference to the value of our common stock, thereby strengthening their commitment to our welfare and aligning their interests with those of our stockholders.
Administration
The 2014 Omnibus Incentive Plan will be administered by the compensation committee of our board of directors or such other committee of our board of directors to which it has delegated power, or if no such committee or subcommittee thereof exists, the board of directors (as applicable, the “Committee”). The Committee has the sole and plenary authority to establish the terms and conditions of any award consistent with the provisions of the 2014 Omnibus Incentive Plan. The Committee is authorized to interpret, administer, reconcile any inconsistency in, correct any defect in and/or supply any omission in the 2014 Omnibus Incentive Plan and any instrument or agreement relating to, or any award granted under, the 2014 Omnibus Incentive Plan; establish, amend, suspend, or waive any rules and regulations and appoint such agents as the Committee deems appropriate for the proper administration of the 2014 Omnibus Incentive Plan; and to make any other determination and take any other action that the Committee deems necessary or desirable for the administration of the 2014 Omnibus Incentive Plan. Except to the extent prohibited by applicable law or the applicable rules and regulations of any securities exchange or inter-dealer quotation system on which our securities are listed or traded, the Committee may allocate all or any portion of its responsibilities and powers to any one or more of its members and may delegate all or any part of its responsibilities and powers to any person or persons selected by it in accordance with the terms of the 2014 Omnibus Incentive Plan. Any such allocation or delegation may be revoked by the Committee at any time. Unless otherwise expressly provided in the 2014 Omnibus Incentive Plan, all designations, determinations, interpretations, and other decisions under or with respect to the 2014 Omnibus Incentive Plan or any award or any documents evidencing awards granted pursuant to the 2014 Omnibus Incentive Plan are within the sole discretion of the Committee, may be made at any time and are final, conclusive and binding upon all persons or entities, including, without limitation, us, any holder or beneficiary of any award, and any of our stockholders.
Shares Subject to the 2014 Omnibus Incentive Plan
The 2014 Omnibus Incentive Plan provides that the total number of shares of common stock that may be issued under the 2014 Omnibus Incentive Plan is . Of this amount, the maximum number of shares for which incentive stock options may be granted is ; the maximum number of shares for which options or stock appreciation right may be granted to any individual participant during any single fiscal year is ; the maximum number of shares for which performance compensation awards denominated in shares may be granted to any individual participant in respect of a single fiscal year is (or if any such awards are settled in cash, the maximum amount may not exceed the fair market value of such shares on the last day of the performance period
127
Table of Contents
to which such award relates); the maximum number of shares of common stock granted during a single fiscal year to any non-employee director, taken together with any cash fees paid to such non-employee director during the fiscal year, will not exceed $ in total value; and the maximum amount that may be paid to any individual for a single fiscal year under a performance compensation award denominated in cash is $ . Except for substitute awards (as described below), in the event any award terminates, lapses, or is settled without the payment of the full number of shares subject to such award, including as a result of net settlement of the award or as a result of the award being settled in cash, the undelivered shares may be granted again under the 2014 Omnibus Incentive Plan, unless the shares are surrendered after the termination of the 2014 Omnibus Incentive Plan, and only if stockholder approval is not required under the then-applicable rules of the exchange on which the shares of common stock are listed. Awards may, in the sole discretion of the Committee, be granted in assumption of, or in substitution for, outstanding awards previously granted by an entity directly or indirectly acquired by us or with which we combine (referred to as “substitute awards”), and such substitute awards will not be counted against the total number of shares that may be issued under the 2014 Omnibus Incentive Plan, except that substitute awards intended to qualify as “incentive stock options” will count against the limit on incentive stock options described above. No award may be granted under the 2014 Omnibus Incentive Plan after the tenth anniversary of the effective date of the plan, but awards theretofore granted may extend beyond that date.
Options
The Committee may grant non-qualified stock options and incentive stock options under the 2014 Omnibus Incentive Plan, with terms and conditions determined by the Committee that are not inconsistent with the 2014 Omnibus Incentive Plan; provided that all stock options granted under the 2014 Omnibus Incentive Plan are required to have a per share exercise price that is not less than 100% of the fair market value of our common stock underlying such stock options on the date an option is granted (other than in the case of options that are substitute awards), and all stock options that are intended to qualify as incentive stock options must be granted pursuant to an award agreement expressly stating that the option is intended to qualify as an incentive stock option, and will be subject to the terms and conditions that comply with the rules as may be prescribed by Section 422 of the Code. The maximum term for stock options granted under the 2014 Omnibus Incentive Plan will be ten years from the initial date of grant, or with respect to any stock options intended to qualify as incentive stock options, such shorter period as prescribed by Section 422 of the Code. However, if a non-qualified stock option would expire at a time when trading of shares of common stock is prohibited by our insider trading policy (or Company-imposed “blackout period”), the term will automatically be extended to the 30th day following the end of such period. The purchase price for the shares as to which a stock option is exercised may be paid to us, to the extent permitted by law (1) in cash or its equivalent at the time the stock option is exercised, (2) in shares having a fair market value equal to the aggregate exercise price for the shares being purchased and satisfying any requirements that may be imposed by the Committee, or (3) by such other method as the Committee may permit in its sole discretion, including without limitation (A) in other property having a fair market value on the date of exercise equal to the purchase price, (B) if there is a public market for the shares at such time, through the delivery of irrevocable instructions to a broker to sell the shares being acquired upon the exercise of the stock option and to deliver to us the amount of the proceeds of such sale equal to the aggregate exercise price for the shares being purchased, or (C) through a “net exercise” procedure effected by withholding the minimum number of shares needed to pay the exercise price and all applicable required withholding taxes. Any fractional shares of common stock will be settled in cash.
Stock Appreciation Rights
The Committee may grant stock appreciation rights, with terms and conditions determined by the Committee that are not inconsistent with the 2014 Omnibus Incentive Plan. Generally, each stock appreciation right will entitle the participant upon exercise to an amount (in cash, shares or a combination of cash and shares, as determined by the Committee) equal to the product of (1) the excess of (A) the fair market value on the exercise date of one share of common stock, over (B) the strike price per share, times (2) the numbers of shares of common stock covered by the stock appreciation right. The strike price per share of a stock appreciation right will be determined by the Committee at the time of grant, but in no event may such amount be less than the fair
128
Table of Contents
market value of a share of common stock on the date the stock appreciation right is granted (other than in the case of stock appreciation rights granted in substitution of previously granted awards). The Committee may in its sole discretion substitute, without the consent of the holder or beneficiary of such stock appreciation rights, stock appreciation rights settled in shares of common stock (or settled in shares or cash in the sole discretion of the Committee) for nonqualified stock options.
Restricted Shares and Restricted Stock Units
The Committee may grant restricted shares of our common stock or restricted stock units, representing the right to receive, upon the expiration of the applicable restricted period, one share of common stock for each restricted stock unit, or, in its sole discretion of the Committee, the cash value thereof (or any combination thereof). As to restricted shares of our common stock, subject to the other provisions of the 2014 Omnibus Incentive Plan, the holder will generally have the rights and privileges of a stockholder as to such restricted shares of common stock, including, without limitation, the right to vote such restricted shares of common stock (except, that if the lapsing of restrictions with respect to such restricted shares of common stock is contingent on satisfaction of performance conditions other than or in addition to the passage of time, any dividends payable on such restricted shares of common stock will be retained, and delivered without interest to the holder of such shares within 15 days following the date on which the restrictions on such shares lapse). To the extent provided in the applicable award agreement, the holder of outstanding restricted stock units will be entitled to be credited with dividend equivalent payments (upon the payment by us of dividends on shares of common stock) either in cash or, at the sole discretion of the Committee, in shares of common stock having a value equal to the amount of such dividends (and interest may, at the sole discretion of the Committee, be credited on the amount of cash dividend equivalents at a rate and subject to such terms as determined by the Committee), which will be payable at the same time as the underlying restricted stock units are settled following the release of restrictions on such restricted stock units.
Other Stock-Based Awards
The Committee may issue unrestricted common stock, rights to receive grants of awards at a future date, or other awards denominated in shares of common stock (including, without limitation, performance shares or performance units), under the 2014 Omnibus Incentive Plan, including performance-based awards.
Performance Compensation Awards
The Committee may also designate any award as a “performance compensation award” intended to qualify as “performance-based compensation” under Section 162(m) of the Code. The Committee also has the authority to make an award of a cash bonus to any participant and designate such award as a performance compensation award under the 2014 Omnibus Incentive Plan. The Committee has the sole discretion to select the length of any applicable performance periods, the types of performance compensation awards to be issued, the applicable performance criteria and performance goals, and the kinds and/or levels of performance goals that are to apply. The performance criteria that will be used to establish the performance goals may be based on our attainment of specific levels of performance (and/or one or more affiliates, divisions or operational and/or business units, product lines, brands, business segments, administrative departments, or any combination of the foregoing) and are limited to the following: (1) net earnings or net income (before or after taxes); (2) basic or diluted earnings per share (before or after taxes); (3) net revenue or net revenue growth; (4) gross revenue or gross revenue growth, gross profit or gross profit growth; (5) net operating profit (before or after taxes); (6) return measures (including, but not limited to, return on investment, assets, capital, employed capital, invested capital, equity, or sales); (7) cash flow measures (including, but not limited to, operating cash flow, free cash flow, and cash flow return on capital), which may but are not required to be measured on a per share basis; (8) earnings before or after interest, taxes, depreciation, amortization and/or rent (including EBIT, EBITDA and EBITDAR); (9) gross or net operating margins; (10) productivity ratios; (11) share price (including, but not limited to, growth measures and total stockholder return); (12) expense targets or cost reduction goals, general and administrative expense savings; (13) operating efficiency; (14) objective measures of customer satisfaction; (15) working capital targets;
129
Table of Contents
(16) measures of economic value added or other ‘value creation’ metrics; (17) inventory control; (18) enterprise value; (19) sales; (20) stockholder return; (21) client retention; (22) competitive market metrics; (23) employee retention; (24) timely completion of new product rollouts; (25) timely launch of new facilities; (26) measurements related to a new purchasing “co-op”; (27) objective measures of personal targets, goals or completion of projects (including but not limited to succession and hiring projects, completion of specific acquisitions, reorganizations or other corporate transactions or capital-raising transactions, expansions of specific business operations and meeting divisional or project budgets); (28) system-wide revenues; (29) royalty income; (30) comparisons of continuing operations to other operations; (31) market share; (32) cost of capital, debt leverage year-end cash position or book value; (33) strategic objectives and related revenue, sales and margin targets, co-branding or international operations; or (34) any combination of the foregoing. Any one or more of the performance criteria may be stated as a percentage of another performance criteria, or used on an absolute or relative basis to measure our performance as a whole or any of our divisions or operational and/or business units, product lines, brands, business segments, administrative departments or any combination thereof as the Committee may deem appropriate, or any of the above performance criteria may be compared to the performance of a selected group of comparison companies or a published or special index that the Committee, in its sole discretion, deems appropriate, or as compared to various stock market indices. Unless otherwise determined by the Committee at the time a performance compensation award is granted, the Committee will, during the first 90 days of a performance period (or, within any other maximum period allowed under Section 162(m) of the Code) or at any time thereafter to the extent the exercise of such authority at such time would not cause the performance compensation awards granted to any participant for such performance period to fail to qualify as “performance-based compensation” under Section 162(m) of the Code, specify adjustments or modifications to be made to the calculation of a performance goal for such performance period, based on and to appropriately reflect the following events: (1) asset write-downs; (2) litigation or claim judgments or settlements; (3) the effect of changes in tax laws, accounting principles, or other laws or regulatory rules affecting reported results; (4) any reorganization and restructuring programs; (5) extraordinary nonrecurring items as described in Accounting Standards Codification Topic 225-20 (or any successor pronouncement thereto) and/or in management’s discussion and analysis of financial condition and results of operations appearing in our annual report to stockholders for the applicable year; (6) acquisitions or divestitures; (7) any other specific, unusual or nonrecurring events, or objectively determinable category thereof; (8) foreign exchange gains and losses; (9) discontinued operations and nonrecurring charges; and (10) a change in our fiscal year.
Following the completion of a performance period, the Committee will review and certify in writing whether, and to what extent, the performance goals for the performance period have been achieved and, if so, calculate and certify in writing that amount of the performance compensation awards earned for the period based upon the performance formula. In determining the actual amount of an individual participant’s performance compensation award for a performance period, the Committee has the discretion to reduce or eliminate the amount of the performance compensation award consistent with Section 162(m) of the Code. Unless otherwise provided in the applicable award agreement, the Committee does not have the discretion to (A) grant or provide payment in respect of performance compensation awards for a performance period if the performance goals for such performance period have not been attained; or (B) increase a performance compensation award above the applicable limitations set forth in the 2014 Omnibus Incentive Plan.
Effect of Certain Events on 2014 Omnibus Incentive Plan and Awards
In the event of (a) any dividend (other than regular cash dividends) or other distribution (whether in the form of cash, shares of common stock, other securities or other property), recapitalization, stock split, reverse stock split, reorganization, merger, consolidation, split-up, split-off, spin-off, combination, repurchase or exchange of our shares of common stock or other securities, issuance of warrants or other rights to acquire our shares of common stock or other securities, or other similar corporate transaction or event (including, without limitation, a change in control, as defined in the 2014 Omnibus Incentive Plan) that affects the shares of common stock, or (b) unusual or nonrecurring events (including, without limitation, a change in control) affecting us, any affiliate, or the financial statements of us or any affiliate, or changes in applicable rules, rulings, regulations or
130
Table of Contents
other requirements of any governmental body or securities exchange or inter-dealer quotation system, accounting principles or law, such that in either case an adjustment is determined by the Committee in its sole discretion to be necessary or appropriate, then the Committee must make any such adjustments in such manner as it may deem equitable, including without limitation, any or all of: (i) adjusting any or all of (A) the share limits applicable under the 2014 Omnibus Incentive Plan with respect to the number of awards which may be granted hereunder, (B) the number of our shares of common stock or other securities which may be delivered in respect of awards or with respect to which awards may be granted under the 2014 Omnibus Incentive Plan and (C) the terms of any outstanding award, including, without limitation, (1) the number of shares of common stock subject to outstanding awards or to which outstanding awards relate (with any increase requiring the approval of our board of directors), (2) the exercise price or strike price with respect to any award or (3) any applicable performance measures; (ii) providing for a substitution or assumption of awards, accelerating the exercisability of, lapse of restrictions on, or termination of, awards or providing for a period of time for participants to exercise outstanding awards prior to the occurrence of such event; and (iii) cancelling any one or more outstanding awards and causing to be paid to the holders holding vested awards (including any awards that would vest as a result of the occurrence of such event but for such cancellation) the value of such awards, if any, as determined by the Committee (which if applicable may be based upon the price per share of common stock received or to be received by other of our stockholders in such event), including without limitation, in the case of options and stock appreciation rights, a cash payment equal to the excess, if any, of the fair market value of the shares of common stock subject to the option or stock appreciation right over the aggregate exercise price thereof. For the avoidance of doubt, the Committee may cancel any stock option or stock appreciation right for no consideration if the fair market value of the shares subject to such option or stock appreciation right is less than or equal to the aggregate exercise price or strike price of such stock option or stock appreciation right.
Nontransferability of Awards
An award will not be transferable or assignable by a participant other than by will or by the laws of descent and distribution and any such purported assignment, alienation, pledge, attachment, sale, transfer or encumbrance will be void and unenforceable against us or any affiliate. However, the Committee may, in its sole discretion, permit awards (other than incentive stock options) to be transferred, including transfers to a participant’s family members, any trust established solely for the benefit of participant or such participant’s family members, any partnership or limited liability company of which participant, or participant and participant’s family members, are the sole member(s), and a beneficiary to whom donations are eligible to be treated as “charitable contributions” for tax purposes.
Amendment and Termination
The board of directors may amend, alter, suspend, discontinue, or terminate the 2014 Omnibus Incentive Plan or any portion thereof at any time; provided, that no such amendment, alteration, suspension, discontinuation or termination may be made without stockholder approval if (1) such approval is necessary to comply with any regulatory requirement applicable to the 2014 Omnibus Incentive Plan or for changes in GAAP to new accounting standards, (2) it would materially increase the number of securities which may be issued under the 2014 Omnibus Incentive Plan (except for adjustments in connection with certain corporate events), or (3) it would materially modify the requirements for participation in the 2014 Omnibus Incentive Plan; provided, further, that any such amendment, alteration, suspension, discontinuance or termination that would materially and adversely affect the rights of any participant or any holder or beneficiary of any award will not to that extent be effective without such individual’s consent. The Committee may also, to the extent consistent with the terms of any applicable award agreement, waive any conditions or rights under, amend any terms of, or alter, suspend, discontinue, cancel or terminate, any award granted or the associated award agreement, prospectively or retroactively, subject to the consent of the affected participant if any such waiver, amendment, alteration, suspension, discontinuance, cancellation or termination would materially and adversely affect the rights of any participant with respect to such award; provided, further, that without stockholder approval, except as otherwise permitted in the 2014 Omnibus Incentive Plan, (1) no amendment or modification may reduce the exercise price of any option or the strike price of any stock appreciation right, (2) the Committee may not cancel any
131
Table of Contents
outstanding option or stock appreciation right and replace it with a new option or stock appreciation right (with a lower exercise price or strike price, as the case may be) or other award or cash payment that is greater than the intrinsic value (if any) of the cancelled option or stock appreciation right, and (3) the Committee may not take any other action which is considered a “repricing” for purposes of the stockholder approval rules of any securities exchange or inter-dealer quotation system on which our securities are listed or quoted.
Dividends and Dividend Equivalents
The Committee in its sole discretion may provide part of an award with dividends or dividend equivalents, on such terms and conditions as may be determined by the Committee in its sole discretion; provided, that no dividend equivalents will be payable in respect of outstanding (1) options or stock appreciation rights or (2) unearned performance compensation awards or other unearned awards subject to performance conditions (other than or in addition to the passage of time) (although dividend equivalents may be accumulated in respect of unearned awards and paid within 15 days after such awards are earned and become earned, payable or distributable).
Clawback/Forfeiture
An award agreement may provide that the Committee may in its sole discretion cancel such award if the participant violates a non-competition, non-solicitation or non-disclosure covenant or agreement or otherwise has engaged in or engages in other detrimental activity that is in conflict with or adverse to our interests or the interests of any affiliate, including fraud or conduct contributing to any financial restatements or irregularities, as determined by the Committee in its sole discretion. The Committee may also provide in an award agreement that if the participant otherwise has engaged in or engages in any activity referred to in the preceding sentence, the participant will forfeit any gain realized on the vesting or exercise of such award, and must repay the gain to us. The Committee may also provide in an award agreement that if the participant receives any amount in excess of what the participant should have received under the terms of the award for any reason (including without limitation by reason of a financial restatement, mistake in calculations or other administrative error), then the participant will be required to repay any such excess amount to us. Without limiting the foregoing, all awards will be subject to reduction, cancellation, forfeiture or recoupment to the extent necessary to comply with applicable law.
United States Federal Income Tax Consequences
The following is a general summary of certain material United States federal income tax consequences of the grant, vesting, settlement and exercise of certain awards under the 2007 Stock Incentive Plan and the 2014 Omnibus Incentive Plan and the disposition of shares acquired pursuant to the exercise of such awards. The summary is intended to reflect the current provisions of the Internal Revenue Code and the regulations thereunder and is neither intended to be a complete statement of applicable law, nor does it address foreign, state, local or payroll tax considerations. This summary assumes that all awards granted under the 2007 Stock Incentive Plan and the 2014 Omnibus Incentive Plan are exempt from, or comply with, the rules under Section 409A of the Code related to nonqualified deferred compensation. Moreover, the United States federal income tax consequences to any particular holder may differ from those described herein by reason of, among other things, the particular circumstances of such holder.
Incentive Stock Options
An option granted as an “incentive stock option” (“ISO”) under Section 422 of the Code may qualify for special tax treatment. The Code requires that, for treatment of an option as an ISO, common stock acquired through the exercise of the option cannot be disposed of before the later of: (i) two years from the date of grant of the option or (ii) one year from the date of exercise. Holders of ISOs will generally incur no federal income tax liability at the time of grant or upon exercise of those options. However, the option “spread value” at the time of
132
Table of Contents
exercise will be an “item of tax preference,” which may give rise to “alternative minimum tax” liability for the taxable year in which the exercise occurs. If the holder does not dispose of the shares before two years following the date of grant and one year following the date of exercise, the difference between the exercise price and the amount realized upon disposition of the shares will constitute long-term capital gain or loss, as applicable. Assuming both holding periods are satisfied, we will not be allowed a deduction for federal income tax purposes in connection with the grant or exercise of the ISO. If, within two years following the date of grant or within one year following the date of exercise, the holder of shares acquired through the exercise of an ISO disposes of those shares, the holder will generally realize ordinary income at the time of such disposition equal to the difference between the exercise price the fair market value of a share on the date of exercise and that amount will generally be deductible by us for federal income tax purposes, subject to the possible limitations on deductibility under Sections 280G and 162(m) of the Code for compensation paid to executives designated in those Sections. Any additional gain or loss recognized upon a subsequent sale or exchange of the shares is treated as capital gain or loss, as applicable, for which we are not entitled to a deduction. Finally, if an otherwise qualified ISO first becomes exercisable in any one year for shares having an aggregate value in excess of $100,000 (based on the grant date value), the portion of the ISO in respect of those excess shares will be treated as a non-qualified stock option for federal income tax purposes.
Nonqualified Options
In general, in the case of a nonqualified stock option, the holder has no federal income tax liability at the time of grant but realizes ordinary income upon exercise of the option in an amount equal to the excess, if any, of the fair market value of the shares acquired upon exercise over the exercise price. We will be able to deduct this same amount for federal income tax purposes, but such deduction may be limited under Sections 280G and 162(m) of the Code for compensation paid to certain executives designated in those Sections. Any gain or loss recognized upon a subsequent sale or exchange of the shares is treated as capital gain or loss, as applicable, for which we are not entitled to a deduction.
Stock Appreciation Rights
No federal income tax liability will be realized by a holder upon the grant of a stock appreciation right (“SAR”). Upon the exercise of a SAR, the holder will recognize ordinary income in an amount equal to the fair market value of the shares of stock or cash payment received in respect of the SAR. We will be able to deduct this same amount for federal income tax purposes, but such deduction may be limited under Sections 280G and 162(m) of the Code for compensation paid to certain executives designated in those Sections. Any gain or loss recognized upon a subsequent sale or exchange of the shares is treated as capital gain or loss, as applicable, for which we are not entitled to a deduction.
Restricted Stock
A holder will not have any federal income tax liability upon the grant of an award of restricted stock unless the holder otherwise elects to be taxed at the time of grant pursuant to Section 83(b) of the Code. On the date an award of restricted stock becomes transferable or is no longer subject to a substantial risk of forfeiture, the holder will have ordinary income equal to the difference between the fair market value of the shares on that date over the amount the holder paid for such shares, if any, unless the holder made an election under Section 83(b) of the Code to be taxed at the time of grant. If the holder makes an election under Section 83(b) of the Code, the holder will have ordinary income at the time of grant equal to the difference between the fair market value of the shares on the date of grant over the amount the holder paid for such shares, if any. Special rules apply to the receipt and disposition of restricted stock received by officers and directors who are subject to Section 16(b) of the Exchange Act. Any future appreciation in the common stock will be taxable to the holder at capital gains rates. However, if the restricted stock award is later forfeited, the holder will not be able to recover the tax previously paid pursuant to his Section 83(b) election. We will be able to deduct, at the same time as it is recognized by the holder, the amount of ordinary income to the holder for federal income tax purposes, but such deduction may be limited under Sections 280G and 162(m) of the Code for compensation paid to certain executives designated in those Sections.
133
Table of Contents
Restricted Stock Units
A holder will not have any federal income tax liability at the time a restricted stock unit is granted. Rather, upon the delivery of shares (or cash) pursuant to a restricted stock unit award, the holder will have ordinary income equal to the fair market value of the number of shares (or the amount of cash) the holder actually receives with respect to the award. We will be able to deduct the amount of ordinary income to the holder for federal income tax purposes, but the deduction may be limited under Sections 280G and 162(m) of the Code for ordinary income paid to certain executives designated in those Sections. Any gain or loss recognized upon a subsequent sale or exchange of the stock (if settled in stock) is treated as capital gain or loss for which we are not entitled to a deduction.
Stock Bonus Awards
A holder will have ordinary income equal to the difference between the fair market value of the shares on the date the common stock subject to the award is transferred to the holder over the amount the holder paid for such shares, if any. We will be able to deduct, at the same time as it is recognized by the holder, the amount of ordinary income to the holder for federal income tax purposes, but such deduction may be limited under Sections 280G and 162(m) of the Code for compensation paid to certain executives designated in those Sections. Any gain or loss recognized upon a subsequent sale or exchange of the stock is treated as capital gain or loss for which we are not entitled to a deduction.
Cash-Based Performance Awards
A holder will not have any federal income tax liability, and we will not be allowed a tax deduction, at the time a cash-based performance award is granted (for example, when the performance goals are established). Upon receipt of cash in settlement of the award, the holder will recognize ordinary income equal to the cash received, and we will be allowed a corresponding federal income tax deduction at that time, but such deduction may be limited under Sections 280G and 162(m) of the Code for compensation paid to certain executives designated in those Sections.
Section 162(m)
In general, Section 162(m) of the Code denies a publicly held corporation a deduction for federal income tax purposes for compensation in excess of $1 million per year per person to its principal executive officer, and the three other officers (other than the principal executive officer and principal financial officer) whose compensation is disclosed in its prospectus or proxy statement as a result of their total compensation, subject to certain exceptions. Subject to obtaining approval of the 2014 Omnibus Incentive Plan by our stockholders prior to the payment of any awards thereunder, the 2014 Omnibus Incentive Plan is intended to satisfy an exception with respect to grants of options to covered employees. In addition, the 2014 Omnibus Incentive Plan is designed to permit certain awards of restricted stock, restricted stock units, cash bonus awards and other awards to be awarded as performance compensation awards intended to qualify under the “performance-based compensation” exception to Section 162(m) of the Code. Finally, under a special Code Section 162(m) exception, any compensation paid pursuant to a compensation plan in existence before the effective date of this offering will not be subject to the $1,000,000 limitation until the earliest of: (i) the expiration of the compensation plan, (ii) a material modification of the compensation plan (as determined under Code Section 162(m)), (iii) the issuance of all the employer stock and other compensation allocated under the compensation plan, or (iv) the first meeting of stockholders at which directors are elected after the close of the third calendar year following the year in which the offering occurs.
134
Table of Contents
CERTAIN RELATIONSHIPS AND RELATED PARTY TRANSACTIONS
Agreements with Our Parent Companies
BHP PTS Holdings L.L.C. Securityholders Agreement
In connection with the closing of the acquisition from Cardinal and the related financings, BHP PTS Holdings L.L.C. entered into a Securityholders Agreement with the investors. The BHP PTS Holdings L.L.C. Securityholders Agreement governs the economic and voting characteristics of the units representing limited liability company membership interests in BHP PTS Holdings L.L.C. (which owns all of the equity interests of Phoenix Charter LLC, which is our majority stockholder), including with respect to restrictions on the issuance or transfer of shares, including tagalong rights and drag-along rights, other special corporate governance provisions and registration rights (including customary indemnification provisions). We expect that BHP PTS Holdings L.L.C. and Phoenix Charter LLC will be dissolved in connection with this offering and that the shares of our common stock held by Phoenix Charter LLC will be distributed to the members of BHP PTS Holdings L.L.C.
Catalent, Inc. Securityholders Agreement
Following the consummation of the acquisition from Cardinal and related financings, we issued shares of our common stock and granted stock option awards and RSUs to certain of our officers, directors and key employees (collectively, “Executives”) pursuant to the 2007 PTS Holdings Corp. Stock Incentive Plan, as amended (our stock incentive plan, which was adopted in 2007 prior to PTS Holding Corp. being renamed Catalent, Inc. in January 2014). As a condition to acquiring such shares of common stock and receiving such options and RSUs, the Executives were required to become a party, or agree to become a party, to the security holders’ agreement among us, BHP PTS Holdings L.L.C. and Blackstone Healthcare Partners LLC. BHP PTS Holdings L.L.C. owns all of the equity interests of Phoenix Charter LLC, which is our majority stockholder. Blackstone Healthcare Partners LLC is the managing member and controls approximately 87% of BHP PTS Holdings L.L.C. Under the securityholders agreement each party agrees, among other things, to elect or cause to be elected to our board of directors and the boards of directors of each of our subsidiaries such individuals as are designated by BHP PTS Holdings L.L.C. Each party also agrees to vote their shares in the manner in which BHP PTS Holdings L.L.C. directs in connection with amendments to our organizational documents (except for changes that would have a material adverse effect on our management), the merger, security exchange, combination or consolidation of the Company with any other person, the sale, lease or exchange of all or substantially all of the property and assets of the Company and its subsidiaries on a consolidated basis, and the reorganization, recapitalization, liquidation, dissolution or winding-up of the Company. The security holders agreement also includes certain restrictions on the transfer of shares, “tag along” and “drag along” rights, and rights of first refusal in favor of the Company. See “Management—Executive Compensation—Description of Stock Option Awards.” We expect to terminate this agreement in connection with this offering.
Catalent, Inc. Shareholders Agreement
In connection with our initial public offering, we expect to enter into a stockholders agreement with Phoenix Charter LLC. This agreement grants Blackstone the right to nominate to our Board of Directors a number of designees equal to: (i) at least a majority of the total number of directors comprising our Board of Directors as long as Blackstone and its affiliates beneficially own at least 50% of the shares of our common stock entitled to vote generally in the election of our directors; (ii) at least 40% of the total number of directors comprising our Board of Directors at such time as long as Blackstone and its affiliates beneficially own at least 40% but less than 50% of the shares of our common stock entitled to vote generally in the election of our directors; (iii) at least 30% of the total number of directors comprising our board of directors at such time as long as Blackstone and its affiliates beneficially own at least 30% but less than 40% of the shares of our common stock entitled to vote generally in the election of our directors; (iv) at least 20% of the total number of directors comprising our board of directors at such time as long as Blackstone and its affiliates beneficially own at least 20% but less 30% of the
135
Table of Contents
shares of our common stock entitled to vote generally in the election of our directors; and (v) at least 10% of the total number of directors comprising our board of directors at such time as long as Blackstone and its affiliates beneficially own at least 5% but less than 20% of the shares of our common stock entitled to vote generally in the election of our directors. For purposes of calculating the number of directors that Blackstone is entitled to nominate pursuant to the formula outlined above, any fractional amounts would be rounded up to the nearest whole number (e.g., one and one quarter directors shall equate to two directors) and the calculation would be made on a pro forma basis after taking into account any increase in the size of our board of directors.
In addition, in the event a vacancy on the board of directors is caused by the death, retirement or resignation of Blackstone’s director-designee, Blackstone shall, to the fullest extent permitted by law, have the right to have the vacancy filled by Blackstone’s new director-designee.
Registration Rights Agreement
In connection with this offering, we expect to enter into a registration rights agreement with certain affiliates of Blackstone and certain other investors and members of management. This agreement will provide to Blackstone an unlimited number of “demand” registrations and to both Blackstone and such other investors and members of management party thereto customary “piggyback” registration rights. The registration rights agreement will also provide that we will pay certain expenses relating to such registrations and indemnify Blackstone, such other investors and the members of management party thereto against certain liabilities which may arise under the Securities Act of 1933, as amended.
Transaction and Advisory Fee Agreement
We and one or more of our parent companies entered into a transaction and advisory fee agreement with the affiliates of Blackstone and certain of the other investors pursuant to which such entities or their affiliates provide certain strategic and structuring advice and assistance to us. In addition, under this agreement, affiliates of Blackstone and certain of the other Investors provide certain monitoring, advisory and consulting services to us for an aggregate annual management fee equal to the greater of $10 million or 3.0% of Consolidated Adjusted EBITDA (as defined in the Secured Credit Agreement) per year. Affiliates of Blackstone and certain of the other investors also receive reimbursement for out-of-pocket expenses incurred by them or their affiliates in connection with the provision of services pursuant to the agreement.
Pursuant to the terms of the transaction and advisory fee agreement with respect to acquisitions, each of Blackstone and an affiliate of Blackstone is entitled to a 1% transaction fee based on the transaction purchase price.
Upon a change of control in our ownership, a sale of all of our assets, or an initial public offering of our equity, and in recognition of facilitation of such change of control, asset sale or public offering by affiliates of Blackstone, these affiliates of Blackstone may elect to receive, in lieu of annual payments of the management fee, a single lump sum cash payment equal to the then-present value of all then current and future management fees payable under the agreement. The lump sum payment would only be payable to the extent that it is permitted under other agreements governing our indebtedness.
In connection with this offering, the parties intend to terminate the transaction and advisory fee agreement. Upon completion of this offering, we will pay a lump sum termination fee as described above equal to approximately $ million to Blackstone and certain of the other investors.
136
Table of Contents
Other Related-Party Transactions
Acquisition of Non-controlling Interest
In February 2012, we acquired the remaining 49% minority share of the R.P. Scherer business in Eberbach, Germany from Gelita AG. The purchase was comprised of a cash payment and note which is payable over a three year period. The cash paid is reflected in the investing section of our statement of cash flows within the caption “cash paid for acquisitions”. The transaction was accounted for as a transaction between shareholders and is reflected as such within our statement of stockholders’ equity. Concurrent with the completion of the transaction, Gelita AG is no longer considered a related party.
Employer Health Program
We participate in an employer health program agreement with Equity Healthcare LLC (“Equity Healthcare”). Equity Healthcare negotiates with providers of standard administrative services for health benefit plans and other related services for cost discounts and quality of service monitoring capability by Equity Healthcare. Because of the combined purchasing power of its client participants, Equity Healthcare is able to negotiate pricing terms for providers that are believed to be more favorable than the companies could obtain for themselves on an individual basis. In consideration for these services, we paid Equity Healthcare a fee of $2.50 and $2.60 per participating employee per month in calendar year 2012 and 2013, respectively. As of June 30, 2013, we had approximately 2,360 employees enrolled in our health benefit plans in the United States. Equity Healthcare is an affiliate of Blackstone.
In addition, we do business with a number of other companies affiliated with Blackstone; we believe that all such arrangements have been entered into in the ordinary course of our business and have been conducted on an arm’s length basis.
Statement of Policy Regarding Transactions with Related Persons
Prior to the completion of this offering, our board of directors will adopt a written statement of policy regarding transactions with related persons, which we refer to as our “related person policy.” Our related person policy requires that a “related person” (as defined as in paragraph (a) of Item 404 of Regulation S-K) must promptly disclose to our General Counsel any “related person transaction” (defined as any transaction that we anticipate would be reportable by us under Item 404(a) of Regulation S-K in which we were or are to be a participant and the amount involved exceeds $120,000 and in which any related person had or will have a direct or indirect material interest) and all material facts with respect thereto. The General Counsel will then promptly communicate that information to our board of directors. No related person transaction will be executed without the approval or ratification of our board of directors or a duly authorized committee of our board of directors. It is our policy that directors interested in a related person transaction will recuse themselves from any vote on a related person transaction in which they have an interest.
137
Table of Contents
SECURITY OWNERSHIP OF CERTAIN BENEFICIAL OWNERS AND MANAGEMENT
The following table sets forth information regarding the beneficial ownership of shares of our common stock immediately after this offering by (1) each person known to us to beneficially own more than 5% of our outstanding common stock, (2) each of our directors and named executive officers and (3) all of our directors and executive officers as a group.
The amounts and percentages of shares beneficially owned are reported on the basis of SEC regulations governing the determination of beneficial ownership of securities. Under SEC rules, a person is deemed to be a “beneficial owner” of a security if that person has or shares voting power or investment power, which includes the power to dispose of or to direct the disposition of such security. A person is also deemed to be a beneficial owner of any securities of which that person has a right to acquire beneficial ownership within 60 days. Securities that can be so acquired are deemed to be outstanding for purposes of computing such person’s ownership percentage, but not for purposes of computing any other person’s percentage. Under these rules, more than one person may be deemed to be a beneficial owner of the same securities and a person may be deemed to be a beneficial owner of securities as to which such person has no economic interest.
Except as otherwise indicated in the footnotes below, each of the beneficial owners has, to our knowledge, sole voting and investment power with respect to the indicated shares. Unless otherwise noted, the address of each beneficial owner is 14 Schoolhouse Road, Somerset, New Jersey, 08873.
As of April 15, 2014, there were 71 holders of record of our common stock.
| Shares Beneficially Owned Prior to the Offering |
Percentage of Shares Beneficially Owned After the Offering | |||||||||||
| Name of Beneficial Owner |
Number(1) | Percent | Assuming Underwriters’ Option is Exercised in Full |
Assuming Underwriters’ Option is Not Exercised | ||||||||
| Blackstone(2) |
1,053,979 | 98.63 | % | |||||||||
| John R. Chiminski(3)(4) |
9,457 | * | ||||||||||
| Matthew Walsh(3)(4) |
3,253 | * | ||||||||||
| William Downie(4) |
1,860 | * | ||||||||||
| Samrat S. Khichi(4) |
1,726 | * | ||||||||||
| Stephen Leonard(4) |
2,466 | * | ||||||||||
| Chinh E. Chu(5) |
— | * | ||||||||||
| Bruce McEvoy(6) |
— | * | ||||||||||
| James Quella(7) |
— | * | ||||||||||
| Melvin D. Booth(4) |
435 | * | ||||||||||
| Directors and executive officers as a group |
27,157 | 2.49 | % | |||||||||
| * | Represents less than 1%. |
| (1) | Fractional shares beneficially owned have been rounded down to the nearest whole share. |
| (2) | Shares shown as beneficially owned by Blackstone were held directly by Phoenix Charter LLC as of April 15, 2014. 100% of the limited liability company interests of Phoenix Charter LLC are held directly by BHP PTS Holdings L.L.C. Blackstone Healthcare Partners LLC is the managing member and controls approximately 87% of BHP PTS Holdings L.L.C. On the date of this prospectus, Phoenix Charter LLC and BHP PTS Holdings L.L.C. will be dissolved and the shares held by Phoenix Charter LLC will be distributed to the members of BHP PTS Holdings L.L.C. Blackstone Capital Partners V L.P. is the managing member of Blackstone Healthcare Partners LLC. Blackstone Management Associates V L.L.C. (“BMA”) is the general partner of Blackstone Capital Partners V L.P. BMA V L.L.C. is the sole member of BMA. Blackstone Holdings III L.P. is the managing member and majority in interest owner of BMA V L.L.C. Blackstone Holdings III GP L.P. is the general partner of Blackstone Holdings III L.P. Blackstone |
138
Table of Contents
| Holdings III GP Management L.L.C. is the general partner of Blackstone Holdings III GP L.P. The Blackstone Group L.P. is the sole member of Blackstone Holdings III GP Management L.L.C. The Blackstone Group L.P. is controlled by its general partner, Blackstone Group Management L.L.C. Blackstone Group Management L.L.C. is wholly owned by Blackstone’s senior managing directors and controlled by its founder, Stephen A. Schwarzman. Each of BHP PTS Holdings L.L.C., Blackstone Healthcare Partners LLC, Blackstone Capital Partners V L.P., BMA, BMA V L.L.C., Blackstone Holdings III L.P., Blackstone Holdings III GP L.P., Blackstone Holdings III GP Management L.L.C., The Blackstone Group L.P., Blackstone Group Management L.L.C., Mr. Schwarzman, Mr. Chu and Mr. McEvoy disclaims beneficial ownership of the shares of our common stock directly held by Phoenix Charter LLC. Mr. Chu and Mr. McEvoy, our directors, are employees of affiliates of Blackstone. Additionally, pursuant to the terms of our shareholders agreement, Blackstone may be deemed to have shared voting and dispositive power over the remaining 1.37% of our common stock held by our senior management. The address of each of the entities listed in this footnote is c/o The Blackstone Group L.P., 345 Park Avenue, New York, New York 10154. |
| (3) | Does not include 3,721.15 vested and unvested non-voting restricted stock units, none of which Mr. Chiminski has the right to have settled in shares of our common stock within 60 days. Does not include 500 unvested non-voting restricted stock units, none of which Mr. Walsh has the right to have settled in shares of our common stock within 60 days. |
| (4) | The number of shares beneficially owned includes shares of common stock issuable upon exercise of options that are currently exercisable and/or will be exercisable within 60 days after April 15, 2014, as follows: Mr. Chiminski (8,550), Mr. Walsh (2,853), Mr. Downie (1,600), Mr. Leonard (2,134), Mr. Khichi (1,626) and Mr. Booth (435). |
| (5) | Mr. Chu is a Senior Managing Director of Blackstone. Mr. Chu disclaims beneficial ownership of any shares owned directly or indirectly by Blackstone. Mr. Chu’s address is c/o The Blackstone Group L.P., 345 Park Avenue, New York, New York 10154. |
| (6) | Mr. McEvoy is a Principal of Blackstone. Mr. McEvoy disclaims beneficial ownership of any shares owned directly or indirectly by Blackstone. Mr. McEvoy’s address is c/o The Blackstone Group L.P., 345 Park Avenue, New York, New York 10154. |
| (7) | Mr. Quella was a Senior Managing Director and Senior Operating Partner in the Corporate Private Equity group of Blackstone. Mr. Quella disclaims beneficial ownership of any shares owned directly or indirectly by Blackstone. Mr. Quella’s address is c/o The Blackstone Group L.P., 345 Park Avenue, New York, New York 10154. |
| (8) | Includes 24,053 shares of common stock issuable upon exercise of options that are currently exercisable and/or exercisable within 60 days after April 15, 2014. |
139
Table of Contents
DESCRIPTION OF CERTAIN INDEBTEDNESS
New Senior Secured Credit Facilities
Overview
On May 20, 2014, we entered into new senior secured term loan facilities and a new senior secured revolving credit facility, which refinanced our existing senior secured credit facilities. The new senior secured credit facilities are governed by our secured credit agreement, which was amended and restated in connection therewith.
The credit facilities (the “new senior secured credit facilities”) provide for senior secured financing of approximately $1,942.0 million consisting of a seven-year (or earlier under certain circumstances described below) $1,400.0 million dollar term loan, a seven-year (or earlier under certain circumstances described below) €250.0 million euro term loan and a five-year (or earlier under certain circumstances described below) $200.0 million revolving credit facility.
Catalent Pharma Solutions, Inc. is the borrower under the new senior secured credit facilities. The revolving credit facility includes borrowing capacity available for letters of credit and for short-term borrowings, referred to as the swing line borrowings.
Interest Rate and Fees
Borrowings under the term loans and the revolving credit facility bear interest, at our option, at a rate equal to a margin over either (a) a base rate determined by reference to the higher of (1) the rate of interest published by The Wall Street Journal as its “prime lending rate” and (2) the federal funds rate plus 1/2 of 1% or (b) a LIBOR rate determined by reference to the London Interbank Offered Rate set by ICE Benchmark Administration (or any successor thereto). The applicable margin for the term loans and borrowings under the revolving facility may be reduced subject to our attaining a certain total net leverage ratio. The applicable margin for borrowings will be 3.50% for loans based on a LIBOR rate and 2.50% for loans based on the base rate. The LIBOR rate for term loans is subject to a 1.00% floor and the base rate for term loans is subject to a floor of 2.00%.
In addition to paying interest on outstanding principal under the new senior secured credit facilities, we are also required to pay a commitment fee to the lenders under the revolving credit facility in respect of the unutilized commitments thereunder. The initial commitment fee rate is 0.50% per annum. The commitment fee rate may be reduced subject to our attaining a certain total net leverage ratio. We are also required to pay customary letter of credit fees.
Prepayments
The amended and restated credit agreement requires us to prepay term loans, subject to certain exceptions, with:
| • | 50% (which percentage will be reduced to 25% and 0% subject to our attaining certain first lien net leverage ratios) of our annual excess cash flow; |
| • | 100% (which percentage will be reduced to 75% subject to attaining a certain total net leverage ratio) of the net cash proceeds of all non-ordinary course asset sales or other dispositions of property by the borrower and its restricted subsidiaries (including insurance and condemnation proceeds, subject to de minimis thresholds), (a) if we do not reinvest those net cash proceeds in assets to be used in our business or to make certain other permitted investments, within 15 months of the receipt of such net cash proceeds or (b) if we commit to reinvest such net cash proceeds within 15 months of the receipt thereof, within the later of 15 months of the receipt thereof or 180 days of the date of such commitment; and |
| • | 100% of the net proceeds of any issuance or incurrence of debt by the borrower or any of its restricted subsidiaries, other than permitted debt. |
140
Table of Contents
We may voluntarily repay outstanding loans at any time without premium or penalty, other than a prepayment premium on voluntary prepayment of term loans in connection with a repricing transaction on or prior to the date that is twelve months after the closing date of the new senior secured credit facilities and customary “breakage” costs with respect to LIBOR loans.
Amortization and Maturity
We are required to repay installments on the term loans in quarterly installments in aggregate annual amounts equal to 1.00% of their respective funded total principal amount, with the remaining amount payable on the maturity date for the applicable term loan facility. The maturity date of the term loans is the seventh anniversary of the closing date of the new senior secured credit facilities. Principal amounts outstanding under the revolving credit facility are due and payable in full at maturity on the fifth anniversary of the closing date of the new senior secured credit facilities.
Principal amounts outstanding under the term loan facilities and revolving credit facility may mature on an earlier date if on the 91st day prior to the maturity of any of the unsecured term loan, Senior Subordinated Notes or 7.875% Notes, the aggregate principal amount outstanding under the unsecured term loan, Senior Subordinated Notes and 7.875% Notes exceeds $150.0 million.
Guarantee and Security
All obligations under the new senior secured credit facilities are unconditionally guaranteed by PTS Intermediate Holdings LLC, our subsidiary and the direct parent of the borrower, and, subject to certain exceptions, each of the borrower’s material current and future U.S. wholly owned restricted subsidiaries.
All obligations under the new senior secured credit facilities, and the guarantees of those obligations, are secured by substantially all of the following assets of the borrower and each guarantor, subject to certain exceptions:
| • | a pledge of 100% of the capital stock of the borrower and 100% of the equity interests directly held by the borrower and each guarantor in any wholly-owned material restricted subsidiary of the borrower or any guarantor (which pledge, in the case of any first tier non-U.S. subsidiary of a U.S. subsidiary, will not include more than 65% of the voting stock of such first tier non-U.S. subsidiary); and |
| • | a security interest in, and mortgages on, substantially all tangible and intangible assets of the borrower and each guarantor, subject to certain limited exceptions. |
Certain Covenants and Events of Default
The amended and restated credit agreement contains a number of covenants that, among other things, will restrict, subject to certain exceptions, the ability of the borrower and its restricted subsidiaries to:
| • | incur additional indebtedness; |
| • | create liens on assets; |
| • | engage in mergers or consolidations; |
| • | sell assets; |
| • | pay dividends and distributions or repurchase our capital stock; |
| • | make investments, loans or advances; |
| • | repay subordinated indebtedness; |
| • | make certain acquisitions; |
| • | engage in certain transactions with affiliates; |
| • | amend material agreements governing subordinated indebtedness; and |
| • | change our lines of business. |
In addition, if on the last day of any period of four consecutive quarters on or after September 30, 2014, the aggregate principal amount of revolving credit loans, swing line loans and/or letters of credit (excluding up to
141
Table of Contents
$30.0 million of letters of credit and certain other letters of credit that have been cash collateralized or backstopped) that are issued and/or outstanding is greater than 30% of the revolving credit facility, the amended and restated credit agreement will require us to maintain a consolidated first lien net leverage ratio not to exceed 6.50 to 1.0.
During the period in which the borrower’s corporate issuer rating is equal to or higher than Baa3 (or the equivalent) according to Moody’s Investors Service, Inc. or BBB- (or the equivalent) according to Standard and Poor’s Ratings Services and no default has occurred and is continuing, the restrictions in the new senior secured credit facilities regarding incurring additional indebtedness, dividends and distributions or repurchases of capital stock and transactions with affiliates will not apply to the borrower and its restricted subsidiaries during such period.
The amended and restated credit agreement also contains certain customary affirmative covenants and events of default (including change of control).
Senior Unsecured Credit Facilities
Overview
On April 29, 2013, we entered into a $275.0 million term loan (the “unsecured term loan”) maturing December 31, 2017 pursuant to a senior unsecured credit agreement (as amended, the “Senior Unsecured Credit Agreement”) with Morgan Stanley Senior Funding, Inc., as administrative agent and the lenders from time to time party thereto. Catalent Pharma Solutions, Inc. is the borrower under the unsecured term loan.
We expect to repay all or a portion of the outstanding borrowings under the Senior Unsecured Credit Agreement using a portion of the proceeds of this offering and our new senior secured credit facilities.
Interest Rate and Fees
Borrowings under the unsecured term loan bear interest, at our option, at a rate equal to a margin over either (a) a base rate determined by reference to the higher of (1) the rate of interest published by The Wall Street Journal as its “prime lending rate” and (2) the federal funds rate plus 1/2 of 1% or (b) a LIBOR rate determined by reference to the costs of funds for deposits in the currency of such borrowing for the interest period relevant to such borrowing adjusted for certain additional costs. The applicable margin is 5.25% for loans based on a LIBOR rate and 4.25% for loans based on the base rate. The LIBOR rate is subject to a floor of 1.25% and the base rate is subject to a floor of 2.25%.
Prepayments
The Senior Unsecured Credit Agreement requires us to prepay the outstanding term loan, subject to certain exceptions, with:
| • | the net cash proceeds of an asset sale under certain circumstances; and |
| • | 100% of the net proceeds of any issuance or incurrence of debt by the borrower or any of its restricted subsidiaries, other than debt permitted under the Secured Credit Agreement. |
We are not otherwise required to make any principal payments on the term loan until maturity.
142
Table of Contents
Voluntarily repayments of outstanding loans under certain circumstances will be subject to a 2.00% prepayment premium prior to April 29, 2014 and a 1.00% prepayment premium thereafter but prior to April 29, 2015.
Guarantee
All obligations under the Senior Unsecured Credit Agreement are unconditionally guaranteed on a senior unsecured basis by the parent guarantor and, subject to certain exceptions, each of our material current and future U.S. wholly owned restricted subsidiaries.
Certain Covenants and Events of Default
The Senior Unsecured Credit Agreement contains a number of covenants that, among other things, restrict, subject to certain exceptions, the ability of the borrower and its restricted subsidiaries to:
| • | incur additional indebtedness and issue certain preferred stock; |
| • | pay certain dividends and make distributions in respect of or repurchase capital stock; |
| • | place limitations on distributions from restricted subsidiaries; |
| • | guarantee certain indebtedness; |
| • | sell or exchange assets; |
| • | enter into transactions with affiliates; |
| • | create certain liens; and |
| • | consolidate, merge or transfer all or substantially all of our assets and the assets of our subsidiaries on a consolidated basis. |
The Senior Unsecured Credit Agreement also contains certain customary events of default.
Senior Subordinated Notes
As of March 31, 2014, we had outstanding €215.4 million euro principal amount (equal to $297.1 million based on exchange rate of approximately €1=$1.38) of 9 3⁄4% Senior Subordinated Notes due 2017 (the “Senior Subordinated Notes”), which bear interest at a rate of 9 3⁄4% and are due April 15, 2017. The Senior Subordinated Notes are guaranteed by all of the subsidiaries that guarantee our new senior secured credit facilities on a senior subordinated basis.
The Senior Subordinated Notes are redeemable (1) at any time in the twelve-month period beginning April 15, 2014 at a price of 101.625% of the principal amount of the Senior Subordinated Notes redeemed plus accrued and unpaid interest to the date of redemption and (2) at any time beginning April 15, 2015 at a price of 100.00% of the principal amount of the Senior Subordinated Notes redeemed plus accrued and unpaid interest to the date of redemption.
The indenture governing the Senior Subordinated Notes, among other things, limits our ability and the ability of our restricted subsidiaries to:
| • | incur additional indebtedness and issue certain preferred stock; |
| • | pay certain dividends and make distributions in respect of or repurchase capital stock; |
| • | place limitations on distributions from restricted subsidiaries; |
143
Table of Contents
| • | guarantee certain indebtedness; |
| • | sell or exchange assets; |
| • | enter into transactions with affiliates; |
| • | create certain liens; and |
| • | consolidate, merge or transfer all or substantially all of our assets and the assets of our subsidiaries on a consolidated basis. |
The indenture governing the Senior Subordinated Notes also includes customary events of default.
We expect to redeem all or a portion of the outstanding Senior Subordinated Notes using a portion of the proceeds of this offering.
7.875% Notes
As of March 31, 2014, we had outstanding $350.0 million principal amount of 7 7⁄8% Senior Notes due 2018, which bear interest at a rate of 7 7⁄8% and are due October 15, 2018 (the “7.875% Notes”). The 7.875% Notes are guaranteed by all of the subsidiaries that guarantee our new senior secured credit facilities.
The 7.875% Notes are redeemable (1) at any time until October 14, 2014 at a price of 101.50% of the principal amount of the 7.875% Notes redeemed plus accrued and unpaid interest to the date of redemption, (2) at any time in the twelve-month period beginning October 15, 2014 at a price of 103.938% of the principal amount of the 7.875% Notes redeemed plus accrued and unpaid interest to the date of redemption, (3) at any time in the twelve-month period beginning October 15, 2015 at a price of 101.969% of the principal amount of the 7.875% Notes redeemed plus accrued and unpaid interest to the date of redemption and (4) at any time beginning October 15, 2015 at a price of 100.00% of the principal amount of the 7.875% Notes redeemed plus accrued and unpaid interest to the date of redemption.
The indenture governing the 7.875% Notes, among other things, limits our ability and the ability of our restricted subsidiaries to:
| • | incur additional indebtedness and issue certain preferred stock; |
| • | pay certain dividends and make distributions in respect of or repurchase capital stock; |
| • | place limitations on distributions from restricted subsidiaries; |
| • | guarantee certain indebtedness; |
| • | sell or exchange assets; |
| • | enter into transactions with affiliates; |
| • | create certain liens; and |
| • | consolidate, merge or transfer all or substantially all of our assets and the assets of our subsidiaries on a consolidated basis. |
The indenture governing the 7.875% Notes also includes customary events of default.
We expect to redeem all or a portion of the outstanding 7.875% Notes using a portion of the proceeds of this offering.
144
Table of Contents
The following is a description of the material terms of, and is qualified in its entirety by, our amended and restated certificate of incorporation and amended and restated bylaws, each of which will be in effect upon the consummation of this offering, the forms of which are filed as exhibits to the registration statement of which this prospectus is a part.
Our purpose is to engage in any lawful act or activity for which corporations may now or hereafter be organized under the General Corporation Law of the State of Delaware (the “DGCL”). Upon the consummation of this offering, our authorized capital stock will consist of 1,000,000,000 shares of common stock, par value $0.01 per share, and 100,000,000 shares of preferred stock, par value $0.01 per share. No shares of preferred stock will be issued or outstanding immediately after the public offering contemplated by this prospectus. Unless our board of directors determines otherwise, we will issue all shares of our capital stock in uncertificated form.
Common Stock
Holders of our common stock are entitled to one vote for each share held of record on all matters submitted to a vote of stockholders, including the election or removal of directors. The holders of our common stock do not have cumulative voting rights in the election of directors. Upon our liquidation, dissolution or winding up and after payment in full of all amounts required to be paid to creditors and to the holders of preferred stock having liquidation preferences, if any, the holders of our common stock will be entitled to receive pro rata our remaining assets available for distribution. Holders of our common stock do not have preemptive, subscription, redemption or conversion rights. The common stock will not be subject to further calls or assessment by us. There will be no redemption or sinking fund provisions applicable to the common stock. All shares of our common stock that will be outstanding at the time of the completion of the offering will be fully paid and non-assessable. The rights, powers, preferences and privileges of holders of our common stock will be subject to those of the holders of any shares of our preferred stock we may authorize and issue in the future.
Preferred Stock
Our amended and restated certificate of incorporation authorizes our board of directors to establish one or more series of preferred stock (including convertible preferred stock). Unless required by law or by the New York Stock Exchange, the authorized shares of preferred stock will be available for issuance without further action by you. Our board of directors may determine, with respect to any series of preferred stock, the powers including preferences and relative participations, optional or other special rights, and the qualifications, limitations or restrictions thereof, of that series, including, without limitation:
| • | the designation of the series; |
| • | the number of shares of the series, which our board of directors may, except where otherwise provided in the preferred stock designation, increase (but not above the total number of authorized shares of the class) or decrease (but not below the number of shares then outstanding); |
| • | whether dividends, if any, will be cumulative or non-cumulative and the dividend rate of the series; |
| • | the dates at which dividends, if any, will be payable; |
| • | the redemption rights and price or prices, if any, for shares of the series; |
| • | the terms and amounts of any sinking fund provided for the purchase or redemption of shares of the series; |
| • | the amounts payable on shares of the series in the event of any voluntary or involuntary liquidation, dissolution or winding-up of our affairs; |
| • | whether the shares of the series will be convertible into shares of any other class or series, or any other security, of us or any other corporation, and, if so, the specification of the other class or series or other |
145
Table of Contents
| security, the conversion price or prices or rate or rates, any rate adjustments, the date or dates as of which the shares will be convertible and all other terms and conditions upon which the conversion may be made; |
| • | restrictions on the issuance of shares of the same series or of any other class or series; and |
| • | the voting rights, if any, of the holders of the series. |
We could issue a series of preferred stock that could, depending on the terms of the series, impede or discourage an acquisition attempt or other transaction that some, or a majority, of the holders of our common stock might believe to be in their best interests or in which the holders of our common stock might receive a premium for your common stock over the market price of the common stock. Additionally, the issuance of preferred stock may adversely affect the rights of holders of our common stock by restricting dividends on the common stock, diluting the voting power of the common stock or subordinating the liquidation rights of the common stock. As a result of these or other factors, the issuance of preferred stock could have an adverse impact on the market price of our common stock.
Dividends
The DGCL permits a corporation to declare and pay dividends out of “surplus” or, if there is no “surplus,” out of its net profits for the fiscal year in which the dividend is declared and/or the preceding fiscal year. “Surplus” is defined as the excess of the net assets of the corporation over the amount determined to be the capital of the corporation by the board of directors. The capital of the corporation is typically calculated to be (and cannot be less than) the aggregate par value of all issued shares of capital stock. Net assets equals the fair value of the total assets minus total liabilities. The DGCL also provides that dividends may not be paid out of net profits if, after the payment of the dividend, capital is less than the capital represented by the outstanding stock of all classes having a preference upon the distribution of assets.
Declaration and payment of any dividend will be subject to the discretion of our board of directors. The time and amount of dividends will be dependent upon our financial condition, operations, cash requirements and availability, debt repayment obligations, capital expenditure needs and restrictions in our debt instruments, industry trends, the provisions of Delaware law affecting the payment of distributions to stockholders and any other factors our board of directors may consider relevant.
We have no current plans to pay dividends on our common stock. Any decision to declare and pay dividends in the future will be made at the sole discretion of our board of directors and will depend on, among other things, our results of operations, cash requirements, financial condition, contractual restrictions and other factors that our board of directors may deem relevant. Because we are a holding company and have no direct operations, we will only be able to pay dividends from funds we receive from our subsidiaries. In addition, our ability to pay dividends will be limited by covenants in our existing indebtedness and may be limited by the agreements governing other indebtedness we or our subsidiaries incur in the future. See “Description of Certain Indebtedness.”
Annual Stockholder Meetings
Our amended and restated bylaws provide that annual stockholder meetings will be held at a date, time and place, if any, as exclusively selected by our board of directors. To the extent permitted under applicable law, we may conduct meetings by remote communications, including by webcast.
Anti-Takeover Effects of Our Amended and Restated Certificate of Incorporation and Amended and Restated Bylaws and Certain Provisions of Delaware Law
Our amended and restated certificate of incorporation, amended and restated bylaws and the DGCL contain provisions, which are summarized in the following paragraphs, that are intended to enhance the likelihood of continuity and stability in the composition of our board of directors. These provisions are intended to avoid
146
Table of Contents
costly takeover battles, reduce our vulnerability to a hostile change of control and enhance the ability of our board of directors to maximize stockholder value in connection with any unsolicited offer to acquire us. However, these provisions may have an anti-takeover effect and may delay, deter or prevent a merger or acquisition of the Company by means of a tender offer, a proxy contest or other takeover attempt that a stockholder might consider in its best interest, including those attempts that might result in a premium over the prevailing market price for the shares of common stock held by stockholders.
Authorized but Unissued Capital Stock
Delaware law does not require stockholder approval for any issuance of authorized shares. However, the listing requirements of the New York Stock Exchange, which would apply if and so long as our common stock remains listed on the New York Stock Exchange, require stockholder approval of certain issuances equal to or exceeding 20% of the then outstanding voting power or then outstanding number of shares of common stock. Additional shares that may be used in the future may be issued for a variety of corporate purposes, including future public offerings, to raise additional capital or to facilitate acquisitions.
Our board of directors may generally issue preferred shares on terms calculated to discourage, delay or prevent a change of control of the Company or the removal of our management. Moreover, our authorized but unissued shares of preferred stock will be available for future issuances without stockholder approval and could be utilized for a variety of corporate purposes, including future offerings to raise additional capital, to facilitate acquisitions and employee benefit plans.
One of the effects of the existence of unissued and unreserved common stock or preferred stock may be to enable our board of directors to issue shares to persons friendly to current management, which issuance could render more difficult or discourage an attempt to obtain control of the Company by means of a merger, tender offer, proxy contest or otherwise, and thereby protect the continuity of our management and possibly deprive our stockholders of opportunities to sell their shares of common stock at prices higher than prevailing market prices.
Classified Board of Directors
Our amended and restated certificate of incorporation provides that our board of directors will be divided into three classes of directors, with the classes to be as nearly equal in number as possible, and with the directors serving three-year terms. As a result, approximately one-third of our board of directors will be elected each year. The classification of directors will have the effect of making it more difficult for stockholders to change the composition of our board of directors. Our amended and restated certificate of incorporation and amended and restated bylaws provide that, subject to any rights of holders of preferred stock to elect additional directors under specified circumstances, the number of directors will be fixed from time to time exclusively pursuant to a resolution adopted by the board of directors.
Business Combinations
We have opted out of Section 203 of the DGCL; however, our amended and restated certificate of incorporation contains similar provisions providing that we may not engage in certain “business combinations” with any “interested stockholder” for a three-year period following the time that the stockholder became an interested stockholder, unless:
| • | prior to such time, our board of directors approved either the business combination or the transaction which resulted in the stockholder becoming an interested stockholder; |
| • | upon consummation of the transaction that resulted in the stockholder becoming an interested stockholder, the interested stockholder owned at least 85% of our voting stock outstanding at the time the transaction commenced, excluding certain shares; or |
| • | at or subsequent to that time, the business combination is approved by our board of directors and by the affirmative vote of holders of at least 66 2⁄3% of our outstanding voting stock that is not owned by the interested stockholder. |
147
Table of Contents
Generally, a “business combination” includes a merger, asset or stock sale or other transaction resulting in a financial benefit to the interested stockholder. Subject to certain exceptions, an “interested stockholder” is a person who, together with that person’s affiliates and associates, owns, or within the previous three years owned, 15% or more of our outstanding voting stock. For purposes of this section only, “voting stock” has the meaning given to it in Section 203 of the DGCL.
Under certain circumstances, this provision will make it more difficult for a person who would be an “interested stockholder” to effect various business combinations with us for a three-year period. This provision may encourage companies interested in acquiring us to negotiate in advance with our board of directors because the stockholder approval requirement would be avoided if our board of directors approves either the business combination or the transaction which results in the stockholder becoming an interested stockholder. These provisions also may have the effect of preventing changes in our board of directors and may make it more difficult to accomplish transactions which stockholders may otherwise deem to be in their best interests.
Our amended and restated certificate of incorporation provides that Blackstone and its affiliates, and any of their respective direct or indirect transferees and any group as to which such persons are a party, do not constitute “interested stockholders” for purposes of this provision.
Removal of Directors; Vacancies
Under the DGCL, unless otherwise provided in our amended and restated certificate of incorporation, directors serving on a classified board may be removed by the stockholders only for cause. Our amended and restated certificate of incorporation provides that directors may be removed with or without cause upon the affirmative vote of a majority in voting power of all outstanding shares of stock entitled to vote generally in the election of directors, voting together as a single class; provided, however, at any time when Blackstone and its affiliates beneficially own in the aggregate, less than 40% of the voting power of all outstanding shares of our stock entitled to vote generally in the election of directors, directors may only be removed for cause, and only upon the affirmative vote of holders of at least 66 2⁄3% of the voting power of all the then outstanding shares of stock entitled to vote generally in the election of directors, voting together as a single class. In addition, our amended and restated certificate of incorporation also provides that, subject to the rights granted to one or more series of preferred stock then outstanding or the rights granted under the stockholders agreement with Blackstone, any vacancies on our board of directors will be filled only by the affirmative vote of a majority of the remaining directors, even if less than a quorum, by a sole remaining director or by the stockholders; provided, however, at any time when Blackstone and its affiliates beneficially own, in the aggregate, less than 40% of voting power of the stock of the Company entitled to vote generally in the election of directors, any newly created directorship on the board of directors that results from an increase in the number of directors and any vacancy occurring in the board of directors may only be filled by a majority of the directors then in office, although less than a quorum, or by a sole remaining director (and not by the stockholders).
No Cumulative Voting
Under Delaware law, the right to vote cumulatively does not exist unless the certificate of incorporation specifically authorizes cumulative voting. Our amended and restated certificate of incorporation does not authorize cumulative voting. Therefore, stockholders holding a majority of the shares of our stock entitled to vote generally in the election of directors will be able to elect all our directors.
Special Stockholder Meetings
Our amended and restated certificate of incorporation provides that special meetings of our stockholders may be called at any time only by or at the direction of the board of directors or the chairman of the board of directors; provided, however, at any time when Blackstone and its affiliates beneficially own, in the aggregate, at least 40% in voting power of the stock entitled to vote generally in the election of directors, special meetings of
148
Table of Contents
our stockholders shall also be called by the board of directors or the chairman of the board of directors at the request of Blackstone and its affiliates. Our amended and restated bylaws prohibit the conduct of any business at a special meeting other than as specified in the notice for such meeting. These provisions may have the effect of deferring, delaying or discouraging hostile takeovers, or changes in control or management of the Company.
Director Nominations and Stockholder Proposals
Our amended and restated bylaws establish advance notice procedures with respect to stockholder proposals and the nomination of candidates for election as directors, other than nominations made by or at the direction of the board of directors or a committee of the board of directors. In order for any matter to be “properly brought” before a meeting, a stockholder will have to comply with advance notice requirements and provide us with certain information. Generally, to be timely, a stockholder’s notice must be received at our principal executive offices not less than 90 days nor more than 120 days prior to the first anniversary date of the immediately preceding annual meeting of stockholders. Our amended and restated bylaws also specify requirements as to the form and content of a stockholder’s notice. These provisions will not apply to Blackstone and its affiliates so long as the stockholders agreement remains in effect. Our amended and restated bylaws allow the chairman of the meeting at a meeting of the stockholders to adopt rules and regulations for the conduct of meetings which may have the effect of precluding the conduct of certain business at a meeting if the rules and regulations are not followed. These provisions may also defer, delay or discourage a potential acquirer from conducting a solicitation of proxies to elect the acquirer’s own slate of directors or otherwise attempting to influence or obtain control of the Company.
Stockholder Action by Written Consent
Pursuant to Section 228 of the DGCL, any action required to be taken at any annual or special meeting of the stockholders may be taken without a meeting, without prior notice and without a vote if a consent or consents in writing, setting forth the action so taken, is or are signed by the holders of outstanding stock having not less than the minimum number of votes that would be necessary to authorize or take such action at a meeting at which all shares of our stock entitled to vote thereon were present and voted, unless our amended and restated certificate of incorporation provides otherwise. Our amended and restated certificate of incorporation will preclude stockholder action by written consent at any time when Blackstone and its affiliates own, in the aggregate, less than 40% in voting power of our stock entitled to vote generally in the election of directors.
Supermajority Provisions
Our amended and restated certificate of incorporation and amended and restated bylaws provide that the board of directors is expressly authorized to make, alter, amend, change, add to, rescind or repeal, in whole or in part, our bylaws without a stockholder vote in any matter not inconsistent with the laws of the State of Delaware or our amended and restated certificate of incorporation. For as long as Blackstone and its affiliates beneficially own, in the aggregate, at least 40% in voting power of our stock entitled to vote generally in the election of directors, any amendment, alteration, change, addition or repeal of our bylaws by our stockholders requires the affirmative vote of a majority in voting power of the outstanding shares of our stock present in person or represented by proxy and entitled to vote on such amendment, alteration, rescission or repeal. At any time when Blackstone and its affiliates beneficially own, in the aggregate, less than 40% in voting power of our stock entitled to vote generally in the election of directors, any amendment, alteration, rescission or repeal of our bylaws by our stockholders requires the affirmative vote of the holders of at least 66 2⁄3% in voting power of all the then outstanding shares of stock entitled to vote thereon, voting together as a single class.
The DGCL provides generally that the affirmative vote of a majority of the outstanding shares entitled to vote thereon, voting together as a single class, is required to amend a corporation’s certificate of incorporation, unless the certificate of incorporation requires a greater percentage.
149
Table of Contents
Our amended and restated certificate of incorporation provides that at any time when Blackstone and its affiliates beneficially own, in the aggregate, less than 40% in voting power of our stock entitled to vote generally in the election of directors, the following provisions in our amended and restated certificate of incorporation may be amended, altered, repealed or rescinded only by the affirmative vote of the holders of at least 66 2⁄3% in voting power all the then outstanding shares of our stock entitled to vote thereon, voting together as a single class:
| • | the provision requiring a 66 2⁄3% supermajority vote for stockholders to amend our bylaws; |
| • | the provisions providing for a classified board of directors (the election and term of our directors); |
| • | the provisions regarding resignation and removal of directors; |
| • | the provisions regarding competition and corporate opportunities; |
| • | the provisions regarding entering into business combinations with interested stockholders; |
| • | the provisions regarding stockholder action by written consent; |
| • | the provisions regarding calling special meetings of stockholders; |
| • | the provisions regarding filling vacancies on our board of directors and newly created directorships; |
| • | the provisions eliminating monetary damages for breaches of fiduciary duty by a director; and |
| • | the amendment provision requiring that the above provisions be amended only with a 66 2⁄3% supermajority vote. |
The combination of the classification of our board of directors, the lack of cumulative voting and the supermajority voting requirements will make it more difficult for our existing stockholders to replace our board of directors as well as for another party to obtain control of us by replacing our board of directors. Because our board of directors has the power to retain and discharge our officers, these provisions could also make it more difficult for existing stockholders or another party to effect a change in management.
These provisions may have the effect of deterring hostile takeovers or delaying or preventing changes in control of our management or the Company, such as a merger, reorganization or tender offer. These provisions are intended to enhance the likelihood of continued stability in the composition of our board of directors and its policies and to discourage certain types of transactions that may involve an actual or threatened acquisition of the Company. These provisions are designed to reduce our vulnerability to an unsolicited acquisition proposal. The provisions are also intended to discourage certain tactics that may be used in proxy fights. However, such provisions could have the effect of discouraging others from making tender offers for our shares and, as a consequence, they also may inhibit fluctuations in the market price of our shares that could result from actual or rumored takeover attempts. Such provisions may also have the effect of preventing changes in management.
Dissenters’ Rights of Appraisal and Payment
Under the DGCL, with certain exceptions, our stockholders will have appraisal rights in connection with a merger or consolidation of us. Pursuant to the DGCL, stockholders who properly request and perfect appraisal rights in connection with such merger or consolidation will have the right to receive payment of the fair value of their shares as determined by the Delaware Court of Chancery.
Stockholders’ Derivative Actions
Under the DGCL, any of our stockholders may bring an action in our name to procure a judgment in our favor, also known as a derivative action, provided that the stockholder bringing the action is a holder of our shares at the time of the transaction to which the action relates or such stockholder’s stock thereafter devolved by operation of law.
150
Table of Contents
Exclusive Forum
Our amended and restated certificate of incorporation provides that unless we consent to the selection of an alternative forum, the Court of Chancery of the State of Delaware shall, to the fullest extent permitted by law, be the sole and exclusive forum for any (i) derivative action or proceeding brought on behalf of our Company, (ii) action asserting a claim of breach of a fiduciary duty owed by any director or officer of our Company to the Company or the Company’s stockholders, creditors or other constituents, (iii) action asserting a claim against the Company or any director or officer of the Company arising pursuant to any provision of the DGCL or our amended and restated certificate of incorporation or our amended and restated bylaws, or (iv) action asserting a claim against the Company or any director or officer of the Company governed by the internal affairs doctrine, in each such case subject to said Court of Chancery having personal jurisdiction over the indispensable parties named as defendants therein. Any person or entity purchasing or otherwise acquiring any interest in shares of capital stock of our Company shall be deemed to have notice of and consented to the forum provisions in our amended and restated certificate of incorporation. However, the enforceability of similar forum provisions in other companies’ certificates of incorporation has been challenged in legal proceedings, and it is possible that a court could find these types of provisions to be unenforceable.
Conflicts of Interest
Delaware law permits corporations to adopt provisions renouncing any interest or expectancy in certain opportunities that are presented to the corporation or its officers, directors or stockholders. Our amended and restated certificate of incorporation will, to the maximum extent permitted from time to time by Delaware law, renounce any interest or expectancy that we have in, or right to be offered an opportunity to participate in, specified business opportunities that are from time to time presented to our officers, directors or stockholders or their respective affiliates, other than those officers, directors, stockholders or affiliates who are our or our subsidiaries’ employees. Our amended and restated certificate of incorporation will provide that, to the fullest extent permitted by law, none of Blackstone or any of its affiliates or any director who is not employed by us (including any non-employee director who serves as one of our officers in both his director and officer capacities) or his or her affiliates will have any duty to refrain from (i) engaging in a corporate opportunity in the same or similar lines of business in which we or our affiliates now engage or propose to engage or (ii) otherwise competing with us or our affiliates. In addition, to the fullest extent permitted by law, in the event that Blackstone or any non-employee director acquires knowledge of a potential transaction or other business opportunity which may be a corporate opportunity for itself or himself or its or his affiliates or for us or our affiliates, such person will have no duty to communicate or offer such transaction or business opportunity to us or any of our affiliates and they may take any such opportunity for themselves or offer it to another person or entity. Our amended and restated certificate of incorporation will not renounce our interest in any business opportunity that is expressly offered to a non-employee director solely in his or her capacity as a director or officer of the Company. To the fullest extent permitted by law, no business opportunity will be deemed to be a potential corporate opportunity for us unless we would be permitted to undertake the opportunity under our amended and restated certificate of incorporation, we have sufficient financial resources to undertake the opportunity and the opportunity would be in line with our business.
Limitations on Liability and Indemnification of Officers and Directors
The DGCL authorizes corporations to limit or eliminate the personal liability of directors to corporations and their stockholders for monetary damages for breaches of directors’ fiduciary duties, subject to certain exceptions. Our amended and restated certificate of incorporation includes a provision that eliminates the personal liability of directors for monetary damages for any breach of fiduciary duty as a director, except to the extent such exemption from liability or limitation thereof is not permitted under the DGCL. The effect of these provisions is to eliminate the rights of us and our stockholders, through stockholders’ derivative suits on our behalf, to recover monetary damages from a director for breach of fiduciary duty as a director, including breaches resulting from grossly negligent behavior. However, exculpation does not apply to any director if the director has acted in bad faith, knowingly or intentionally violated the law, authorized illegal dividends or redemptions or derived an improper benefit from his or her actions as a director.
151
Table of Contents
Our amended and restated bylaws provide that we must indemnify and advance expenses to our directors and officers to the fullest extent authorized by the DGCL. We also are expressly authorized to carry directors’ and officers’ liability insurance providing indemnification for our directors, officers and certain employees for some liabilities. We believe that these indemnification and advancement provisions and insurance are useful to attract and retain qualified directors and executive officers.
The limitation of liability, advancement and indemnification provisions in our amended and restated certificate of incorporation and amended and restated bylaws may discourage stockholders from bringing a lawsuit against directors for breach of their fiduciary duty. These provisions also may have the effect of reducing the likelihood of derivative litigation against directors and officers, even though such an action, if successful, might otherwise benefit us and our stockholders. In addition, your investment may be adversely affected to the extent we pay the costs of settlement and damage awards against directors and officers pursuant to these indemnification provisions.
We currently are party to indemnification agreements with certain of our directors and officers. These agreements require us to indemnify these individuals to the fullest extent permitted under Delaware law against liabilities that may arise by reason of their service to us, and to advance expenses incurred as a result of any proceeding against them as to which they could be indemnified. In connection with this offering, we intend to enter into indemnification agreements with each of our current directors and executive officers. These agreements will require us to indemnify these individuals to the fullest extent permitted under Delaware law against liabilities that may arise by reason of their service to us, and to advance expenses incurred as a result of any proceeding against them as to which they could be indemnified.
There is currently no pending material litigation or proceeding involving any of our directors, officers or employees for which indemnification is sought.
Transfer Agent and Registrar
The transfer agent and registrar for our common stock is Computershare Trust Company, N.A.
Listing
We have applied to have our common stock approved for listing on the New York Stock Exchange under the symbol “CTLT.”
152
Table of Contents
SHARES ELIGIBLE FOR FUTURE SALE
Prior to this offering, there has been no public market for shares of our common stock. We cannot predict the effect, if any, future sales of shares of common stock, or the availability for future sale of shares of common stock, will have on the market price of shares of our common stock prevailing from time to time. The sale of substantial amounts of shares of our common stock in the public market, or the perception that such sales could occur, could harm the prevailing market price of shares of our common stock and could impair our future ability to raise capital through the sale of our equity or equity-related securities at a time and price that we deem appropriate. See “Risk Factors—Risks Related to this Offering and Ownership of Our Common Stock—Future sales, or the perception of future sales, by us or our existing stockholders in the public market following this offering could cause the market price for our common stock to decline.”
Upon completion of this offering we will have a total of shares of our common stock outstanding (or shares if the underwriters exercise in full their option to purchase additional shares). Of the outstanding shares, the shares sold in this offering (or shares if the underwriters exercise in full their option to purchase additional shares) will be freely tradable without restriction or further registration under the Securities Act, except that any shares held by our affiliates, as that term is defined under Rule 144 of the Securities Act, may be sold only in compliance with the limitations described below. The remaining outstanding shares of common stock held by Blackstone and certain of our directors and officers after this offering will be deemed restricted securities under the meaning of Rule 144 and may be sold in the public market only if registered or if they qualify for an exemption from registration, including the exemptions pursuant to Rule 144 under the Securities Act, which we summarize below.
We intend to file one or more registration statements on Form S-8 under the Securities Act to register all shares of our common stock subject to outstanding stock options and the shares of stock subject to issuance under the 2014 Omnibus Incentive Plan to be adopted in connection with this offering. Any such Form S-8 registration statements will automatically become effective upon filing. Accordingly, shares registered under such registration statements will be available for sale in the open market. We expect that the initial registration statement on Form S-8 will cover shares.
Registration Rights
In connection with this offering, we intend to enter into a registration rights agreement that will provide Blackstone an unlimited number of “demand” registrations and certain other investors and members of management customary “piggyback” registration rights. The registration rights agreement also provides that we will pay certain expenses relating to such registrations and indemnify the registration rights holders against certain liabilities which may arise under the Securities Act. Securities registered under any such registration statement will be available for sale in the open market unless restrictions apply. See “Certain Relationships and Related Person Transactions—Registration Rights Agreement.”
Lock-Up Agreements
We have agreed, subject to enumerated exceptions, that we will not offer, sell, contract to sell, pledge, grant any option to purchase, make any short sale or otherwise dispose of, directly or indirectly, or file with the SEC a registration statement under the Securities Act relating to, any shares of our common stock or securities convertible into or exchangeable or exercisable for any shares of our common stock, or publicly disclose the intention to make any such offer, sale, pledge, disposition or filing, without the prior written consent of Morgan Stanley & Co. LLC and J.P. Morgan Securities LLC for a period of 180 days after the date of this prospectus. However, in the event that either (1) during the last 17 days of the “lock-up” period, we release earnings results or material news or a material event relating to us occurs or (2) prior to the expiration of the “lock-up” period, we announce that we will release earnings results during the 15-day period beginning on the last day of the “lock-up” period, then in either case the expiration of the “lock-up” will be extended until the
153
Table of Contents
expiration of the 18-day period beginning on the date of the release of the earnings results or the occurrence of the material news or event, as applicable, unless Morgan Stanley & Co. LLC and J.P. Morgan Securities LLC waive, in writing, such an extension.
Our officers, directors, Blackstone and certain other existing owners have agreed, subject to enumerated exceptions, that they will not offer, sell, contract to sell, pledge, grant any option to purchase, make any short sale or otherwise dispose of, directly or indirectly, any shares of our common stock or securities convertible into or exchangeable or exercisable for any shares of our common stock, enter into a transaction that would have the same effect, or enter into any swap, hedge or other arrangement that transfers, in whole or in part, any of the economic consequences of ownership of our common stock, whether any of these transactions are to be settled by delivery of our common stock or other securities, in cash or otherwise, or publicly disclose the intention to make any such offer, sale, pledge or disposition, or to enter into any transaction, swap, hedge or other arrangement, without, in each case, the prior written consent of Morgan Stanley & Co. LLC and J.P. Morgan Securities LLC for a period of 180 days after the date of this prospectus. However, in the event that either (1) during the last 17 days of the “lock-up” period, we release earnings results or material news or a material event relating to us occurs or (2) prior to the expiration of the “lock-up” period, we announce that we will release earnings results during the 15-day period beginning on the last day of the “lock-up” period, then in either case the expiration of the “lock-up” will be extended until the expiration of the 18-day period beginning on the date of the release of the earnings results or the occurrence of the material news or event, as applicable, unless Morgan Stanley & Co. LLC and J.P. Morgan Securities LLC waive, in writing, such an extension.
Rule 144
In general, under Rule 144, as currently in effect, a person who is not deemed to be our affiliate for purposes of the Securities Act or to have been one of our affiliates at any time during the three months preceding a sale and who has beneficially owned the shares of common stock proposed to be sold for at least six months, including the holding period of any prior owner other than our affiliates, is entitled to sell those shares of common stock without complying with the manner of sale, volume limitation or notice provisions of Rule 144, subject to compliance with the public information requirements of Rule 144. If such a person has beneficially owned the shares of common stock proposed to be sold for at least one year, including the holding period of any prior owner other than our affiliates, then that person is entitled to sell those shares of common stock without complying with any of the requirements of Rule 144. In general, under Rule 144, as currently in effect, our affiliates or persons selling shares of common stock on behalf of our affiliates are entitled to sell, within any three-month period, a number of shares of common stock that does not exceed the greater of (1) 1% of the number of shares of common stock then outstanding and (2) the average weekly trading volume of the shares of common stock during the four calendar weeks preceding the filing of a notice on Form 144 with respect to that sale. Sales under Rule 144 by our affiliates or persons selling shares of common stock on behalf of our affiliates are also subject to certain manner of sale provisions and notice requirements and to the availability of current public information about us.
154
Table of Contents
MATERIAL U.S. FEDERAL INCOME AND ESTATE TAX CONSEQUENCES TO
NON-U.S. HOLDERS OF OUR COMMON STOCK
The following is a summary of the material U.S. federal income and estate tax consequences to a non-U.S. holder (as defined below) of the purchase, ownership and disposition of our common stock as of the date hereof. Except where noted, this summary deals only with common stock that is held as a capital asset (i.e., generally, an asset held for investment purposes).
A “non-U.S. holder” means a person (other than a partnership) that is not for U.S. federal income tax purposes any of the following:
| • | an individual citizen or resident of the United States; |
| • | a corporation (or any other entity treated as a corporation for U.S. federal income tax purposes) created or organized in or under the laws of the United States, any state thereof or the District of Columbia; |
| • | an estate if its income is subject to U.S. federal income taxation regardless of its source; or |
| • | a trust if it (1) is subject to the primary supervision of a court within the United States and one or more United States persons have the authority to control all substantial decisions of the trust or (2) has a valid election in effect under applicable U.S. Treasury regulations to be treated as a United States person. |
This summary is based upon provisions of the Internal Revenue Code of 1986, as amended (the “Code”), and U.S. Treasury regulations, administrative rulings and judicial decisions as of the date hereof. Those authorities may be changed, perhaps retroactively, and are subject to differing interpretations, so as to result in U.S. federal income and estate tax consequences different from those summarized below. This summary does not address all aspects of U.S. federal income and estate taxes and does not deal with foreign, state, local or other tax considerations that may be relevant to non-U.S. holders in light of their particular circumstances. In addition, it does not represent a detailed description of the U.S. federal income tax consequences applicable to you if you are subject to special treatment under the U.S. federal income tax laws (including if you are a U.S. expatriate, “controlled foreign corporation,” “passive foreign investment company” or a partnership or other pass-through entity for U.S. federal income tax purposes). We cannot assure you that a change in law will not alter significantly the tax considerations that we describe in this summary.
If a partnership holds our common stock, the tax treatment of a partner will generally depend upon the status of the partner and the activities of the partnership. If you are a partner of a partnership holding our common stock, you should consult your tax advisors.
If you are considering the purchase of our common stock, you should consult your own tax advisors concerning the particular U.S. federal income and estate tax consequences to you of the purchase, ownership or disposition of our common stock, as well as the consequences to you arising under the laws of any other taxing jurisdiction or any applicable income tax treaty.
Dividends
Distributions of cash or property that we pay on our common stock (if any) will be treated as taxable dividends for U.S. federal income tax purposes to the extent paid from our current or accumulated earnings and profits (as determined under U.S. federal income tax principles). If the amount of a distribution exceeds our current and accumulated earnings and profits, such excess will be allocated ratably among each share of common stock with respect to which the distribution is paid and will be treated first as a tax-free return of capital to the extent of the non-U.S. holder’s adjusted tax basis in our common stock, and thereafter will be treated as capital gain from a sale or other disposition of our common stock as described below in “—Gain on Disposition of Common Stock.” Your adjusted tax basis is generally the purchase price of the shares, reduced by any such tax-free returns of capital. Dividends paid to a non-U.S. holder of our common stock generally will be subject to withholding of U.S. federal income tax at a 30% rate
155
Table of Contents
or such lower rate as may be specified by an applicable income tax treaty. However, dividends that are effectively connected with the conduct of a trade or business by the non-U.S. holder within the United States (and, if required by an applicable income tax treaty, are attributable to a U.S. permanent establishment of the non-U.S. holder) are not subject to withholding, provided certain certification and disclosure requirements are satisfied. Instead, such dividends are subject to U.S. federal income tax on a net income basis in the same manner as if the non-U.S. holder were a United States person as defined under the Code. Any such effectively connected dividends received by a foreign corporation may be subject to an additional “branch profits tax” on its effectively connected earnings and profits at a 30% rate or such lower rate as may be specified by an applicable income tax treaty.
A non-U.S. holder of our common stock who wishes to claim the benefit of an applicable income tax treaty rate and avoid backup withholding, as discussed below, for dividends will be required (a) to complete Internal Revenue Service (“IRS”) Form W-8BEN (or other applicable form) and certify under penalty of perjury that such holder is not a United States person as defined under the Code and is eligible for treaty benefits or (b) if our common stock is held through certain foreign intermediaries, to satisfy the relevant certification requirements of applicable U.S. Treasury regulations.
A non-U.S. holder of our common stock eligible for a reduced rate of U.S. withholding tax pursuant to an income tax treaty may obtain a refund of any excess amounts withheld by timely filing an appropriate claim for refund with the IRS.
Gain on Disposition of Common Stock
Any gain realized on the sale, exchange or other taxable disposition of our common stock generally will not be subject to U.S. federal income tax unless:
| • | the gain is effectively connected with a trade or business of the non-U.S. holder in the United States (and, if required by an applicable income tax treaty, is attributable to a U.S. permanent establishment of the non-U.S. holder); |
| • | the non-U.S. holder is an individual who is present in the United States for 183 days or more in the taxable year of that disposition, and certain other conditions are met; or |
| • | we are or have been a “United States real property holding corporation” for U.S. federal income tax purposes. |
A non-U.S. holder described in the first bullet point immediately above will be subject to tax on the net gain derived from the sale under regular graduated U.S. federal income tax rates applicable to such holder if it were a United States person as defined under the Code. In addition, if a non-U.S. holder described in the first bullet point immediately above is a corporation for U.S. federal income tax purposes, it may be subject to the branch profits tax equal to 30% of its effectively connected earnings and profits or at such lower rate as may be specified by an applicable income tax treaty.
An individual non-U.S. holder described in the second bullet point immediately above will be subject to a flat 30% tax on the gain derived from the sale, which may be offset by U.S. source capital losses, even though the individual is not considered a resident of the United States.
We believe we are not and do not anticipate becoming a “United States real property holding corporation” for U.S. federal income tax purposes. In general, a corporation is a “United States real property holding corporation” if the fair market value of its “United States real property interests” equals or exceeds 50% of the sum of the fair market values of its worldwide (domestic and foreign) real property interests and its other assets used or held for use in a trade or business (all as determined for U.S. federal income tax purposes). For this purpose, real property interests include land, improvements and associated personal property. If we are or become a “United States real property holding corporation,” so long as our common stock continues to be regularly traded on an established securities market (within the meaning of applicable U.S. Treasury regulations), only a non-U.S. holder who holds or held directly, indirectly or constructively (at any time during the shorter of
156
Table of Contents
the five year period preceding the date of disposition or the holder’s holding period) more than 5% of our common stock will be subject to U.S. federal income tax on the disposition of our common stock in the same manner as gain that is effectively connected with a trade or business of the non-U.S. holder in the United States, except that the branch profits tax generally will not apply.
Federal Estate Tax
Common stock held by an individual non-U.S. holder at the time of death will be included in such holder’s gross estate for U.S. federal estate tax purposes, and may be subject to U.S. federal estate tax, unless an applicable estate tax treaty provides otherwise.
Information Reporting and Backup Withholding
We must report annually to the IRS and to each non-U.S. holder the amount of dividends paid to such holder and the tax withheld with respect to such dividends, regardless of whether withholding was required. Copies of the information returns reporting such dividends and withholding may also be made available to the tax authorities in the country in which the non-U.S. holder resides under the provisions of an applicable income tax treaty.
A non-U.S. holder will be subject to backup withholding for dividends paid to such holder unless such holder certifies under penalty of perjury that it is a non-U.S. holder (and the payor does not have actual knowledge or reason to know that such holder is a United States person as defined under the Code) on a properly executed IRS Form W-8, or such holder otherwise establishes an exemption.
Information reporting and, depending on the circumstances, backup withholding will apply to the proceeds of a sale of our common stock within the United States or conducted through certain U.S.-related financial intermediaries, unless the beneficial owner certifies under penalty of perjury that it is a non-U.S. holder (and the payor does not have actual knowledge or reason to know that the beneficial owner is a United States person as defined under the Code), or such owner otherwise establishes an exemption.
Backup withholding is not an additional tax. Any amounts withheld under the backup withholding rules may be allowed as a refund or a credit against a non-U.S. holder’s U.S. federal income tax liability provided the required information is timely furnished to the IRS.
Non-U.S. holders should consult their own tax advisors regarding the application of information reporting and backup withholding in their particular circumstances, including the procedure for claiming any applicable exemption.
Additional Withholding Requirements
Under legislation enacted in 2010, regulations and administrative guidance, a 30% U.S. federal withholding tax may apply to any dividends paid after June 30, 2014, and to the gross proceeds from a disposition of our common stock occurring after December 31, 2016, in each case paid to (i) a “foreign financial institution” (as specifically defined in the legislation), whether such foreign financial institution is the beneficial owner or an intermediary, unless such foreign financial institution agrees to verify, report and disclose its United States “account” holders (as specifically defined in the legislation) and meets certain other specified requirements or (ii) a non-financial foreign entity, whether such non-financial foreign entity is the beneficial owner or an intermediary, unless such entity provides a certification that the beneficial owner of the payment does not have any substantial United States owners, which generally includes any United States person that directly or indirectly owns more than 10% of the entity, or provides the name, address and taxpayer identification number of each such substantial United States owner and certain other specified requirements are met. In certain cases, the relevant foreign financial institution or non-financial foreign entity may qualify for an exemption from, or be deemed to be in compliance with, these rules. You should consult your own tax advisor regarding this legislation and whether it may be relevant to your ownership and disposition of our common stock.
157
Table of Contents
UNDERWRITING (CONFLICT OF INTEREST)
Under the terms and subject to the conditions in an underwriting agreement dated the date of this prospectus, the underwriters named below, for whom Morgan Stanley & Co. LLC and J.P. Morgan Securities LLC are acting as representatives, have severally agreed to purchase, and we have agreed to sell to them, severally, the number of shares indicated below:
| Name |
Number of | |
| Morgan Stanley & Co. LLC |
||
| J.P. Morgan Securities LLC |
||
| Merrill Lynch, Pierce, Fenner & Smith Incorporated |
||
| Deutsche Bank Securities Inc. |
||
| Goldman, Sachs & Co. |
||
| Jefferies LLC |
||
| Blackstone Advisory Partners LP |
||
| Piper Jaffray & Co. |
||
| Raymond James & Associates, Inc. |
||
| Wells Fargo Securities, LLC |
||
| William Blair & Company, L.L.C. |
||
| Evercore Group LLC |
||
|
| ||
| Total: |
||
|
|
The underwriters and the representatives are collectively referred to as the “underwriters” and the “representatives,” respectively. The underwriters are offering the shares of common stock subject to their acceptance of the shares from us. The underwriting agreement provides that the obligations of the several underwriters to pay for and accept delivery of the shares of common stock offered by this prospectus are subject to the approval of certain legal matters by their counsel and to certain other conditions. The underwriters are obligated to take and pay for all of the shares of common stock offered by this prospectus if any such shares are taken. The underwriting agreement also provides that if an underwriter defaults, the purchase commitments of non-defaulting underwriters may also be increased or the offering may be terminated. However, the underwriters are not required to take or pay for the shares covered by the underwriters’ over-allotment option to purchase additional shares described below.
The underwriters initially propose to offer part of the shares of common stock directly to the public at the offering price listed on the cover page of this prospectus and part to certain dealers. After the initial offering of the shares of common stock, the offering price and other selling terms may from time to time be varied by the representatives. Sales of shares made outside of the United States may be made by affiliates of the underwriters. The offering of the shares by the underwriters is subject to receipt and acceptance and subject to the underwriters’ right to reject any order in whole or in part.
We have granted to the underwriters an option, exercisable for 30 days from the date of this prospectus, to purchase up to additional shares of common stock at the public offering price listed on the cover page of this prospectus, less underwriting discounts and commissions. The underwriters may exercise this option solely for the purpose of covering over-allotments, if any, made in connection with the offering of the shares of common stock offered by this prospectus. To the extent the option is exercised, each underwriter will become obligated, subject to certain conditions, to purchase about the same percentage of the additional shares of common stock as the number listed next to the underwriter’s name in the preceding table bears to the total number of shares of common stock listed next to the names of all underwriters in the preceding table.
158
Table of Contents
The following table shows the per share and total public offering price, underwriting discounts and commissions, and proceeds before expenses to us and the selling stockholders. These amounts are shown assuming both no exercise and full exercise of the underwriters’ option to purchase up to an additional shares of common stock.
| Total | ||||||||||||
| Per Share |
No Exercise |
Full Exercise |
||||||||||
| Public offering price |
$ | $ | $ | |||||||||
| Underwriting discounts and commissions to be paid by us |
$ | $ | $ | |||||||||
| Proceeds, before expenses, to us |
$ | $ | $ | |||||||||
The estimated offering expenses payable by us, exclusive of the underwriting discounts and commissions, are approximately $ . We have agreed to reimburse the underwriters for certain out-of-pocket expenses of the underwriters payable by us, in an aggregate amount not to exceed $50,000.
The underwriters have informed us that they do not intend sales to discretionary accounts to exceed 5% of the total number of shares of common stock offered by them.
We have applied to list our shares of common stock on the New York Stock Exchange under the trading symbol “CTLT”.
We and all directors and executive officers and certain holders of our outstanding stock and stock options have agreed that, without the prior written consent of Morgan Stanley & Co. LLC and J.P. Morgan Securities LLC, we and they will not, during the period ending 180 days after the date of this prospectus (the “restricted period”):
| • | offer, sell, contract to sell, pledge, grant any option to purchase, make any short sale or otherwise transfer or dispose of, directly or indirectly, any shares of common stock or any securities convertible into or exercisable or exchangeable for shares of common stock; |
| • | file any registration statement with the Securities and Exchange Commission relating to the offering of any shares of common stock or any securities convertible into or exercisable or exchangeable for common stock; or |
| • | enter into any hedging or other transaction which is designed to or which reasonably could be expected to lead to or result in a sale or disposition of such person’s shares even if such shares would be disposed by someone other than such person. |
whether any such transaction described above is to be settled by delivery of common stock or such other securities, in cash or otherwise.
The restrictions described in the immediately preceding paragraph to do not apply to:
| • | the sale of shares pursuant to the underwriting agreement; or |
| • | the issuance by the Company of shares of common stock upon the exercise of an option or a warrant or the conversion of a security outstanding on the date of this prospectus of which the underwriters have been advised in writing; or |
| • | the issuance by the Company of shares or any such substantially similar securities pursuant to employee incentive plans existing as of the date of the underwriting agreement (including, for the avoidance of doubt, the 2014 Omnibus Incentive Plan); or |
| • | the issuance by the Company of up to 5% of the outstanding shares of the common stock or any such substantially similar securities in connection with the acquisition of, a joint venture with or a merger with, another company, and the filing of a registration statement with respect thereto; or |
159
Table of Contents
| • | the establishment of a trading plan pursuant to Rule 10b5-1 under the Exchange Act, provided that no transfers occur under such plan during the restricted period and no public announcement or filing shall be required or voluntarily made by any person in connection therewith other than general disclosure in Company periodic reports to the effect that Company directors and officers may enter into such trading plans from time to time; or |
| • | the transfer by a security holder of shares of common stock or any securities convertible into, exchangeable for, exerciseable for, or that represent the right to receive common stock (i) by will or intestacy, (ii) as a bona fide gift or gifts, (iii) to any trust, partnership, limited liability company or other entity for the direct or indirect benefit of such holder or the immediate family of such holder (for purposes of this subclause, “immediate family” shall mean any relationship by blood, current or former marriage or adoption, not more remote than first cousin), (iv) to any immediate family member or other dependent, (v) as a distribution to limited partners, members or stockholders of such holder, (vi) to such holder’s affiliates or to any investment fund or other entity controlled or managed by such holder, (vii) to a nominee or custodian of a person or entity to whom a disposition or transfer would be permissible under clauses (i) through (vi) above, (viii) pursuant to an order of a court or regulatory agency, (ix) from an executive officer to the Company or its parent entities upon death, disability or termination of employment, in each case, of such executive officer, (x) in connection with transactions by any person other than us relating to common stock acquired in open market transactions after the completion of the offering provided that in the case of this clause (x) no public reports or filings (including filings under Section 16(a) of the Exchange Act) reporting a reduction in beneficial ownership of the common stock shall be required or shall be voluntarily made during the restricted period or any extension thereof, (xi) to us (1) pursuant to the exercise, in each case on a “cashless” or “net exercise” basis, of any option to purchase shares of stock granted by us pursuant to any employee benefit plans or arrangements described herein, where any shares of stock received by such person upon any such exercise will be subject to the terms of the lock-up agreement, or (2) for the purpose of satisfying any withholding taxes (including estimated taxes) due as a result of the exercise of any option to purchase shares of stock or the vesting of any restricted stock awards granted by us pursuant to employee benefit plans or arrangements described herein, in each case on a “cashless” or “net exercise” basis, where any shares of stock received by such holder upon any such exercise or vesting will be subject to the terms of the lock-up agreement, (xii) transfers from such holder to such holder’s general partner, to certain officers of the general partner in connection with such officers’ donation to charitable organizations, family foundations or donor-advised funds at sponsoring organizations, provided that the aggregate number of shares donated by such officers pursuant to this clause (xii), together with the aggregate number of shares donated pursuant to any similar clauses in any other lock-up agreements entered into by affiliates of the undersigned in connection with the public offering of the shares, shall not exceed shares and/or (xiii) with the prior written consent of Morgan Stanley & Co. LLC and J.P. Morgan Securities LLC; provided that: (1) in the case of each transfer or distribution pursuant to clauses (ii) through (viii) and clauses (ix) and (xii) above, (a) each donee, trustee, distributee or transferee, as the case may be, agrees to be bound in writing by the restrictions set forth herein; and (b) any such transfer or distribution shall not involve a disposition for value, other than with respect to any such transfer or distribution for which the transferor or distributor receives (x) equity interests of such transferee or (y) such transferee’s interests in the transferor; and (2) in the case of each transfer or distribution pursuant to clauses (ii) through (vii) and clause (xi), if any public reports or filings (including filings under Section 16(a) of the Exchange Act) reporting a reduction in beneficial ownership of common stock shall be required or shall be voluntarily made during the restricted period or any extension thereof (a) such holder will provide prior written notice informing it of such report or filing and (b) such report or filing shall disclose that such donee, trustee, distributee or transferee, as the case may be, agrees to be bound in writing by the restrictions set forth herein; or |
| • | if the security holder is a corporation, the corporation may transfer our capital stock to any wholly owned subsidiary of such corporation; provided, however, that in any such case, it shall be a condition to the transfer that the transferee execute an agreement stating that the transferee is receiving and |
160
Table of Contents
| holding such capital stock subject to the provisions of the lock-up agreement and there shall be no further transfer of such capital stock except in accordance with the lock-up agreement, and provided further that any such transfer shall not involve a disposition for value. |
The restricted period described in the preceding paragraph will be extended if:
| • | during the last 17 days of the restricted period we issue an earnings release or material news event relating to us occurs, or |
| • | prior to the expiration of the restricted period, we announce that we will release earnings results during the 15-day period beginning on the last day of the restricted period or provide notification to of any earnings release or material news or material event that may give rise to an extension of the initial restricted period, |
in which case the restrictions described in the preceding paragraph will continue to apply until the expiration of the 18-day period beginning on the issuance of the earnings release or the occurrence of the material news or material event.
Morgan Stanley & Co. LLC and J.P. Morgan Securities LLC, in their sole discretion, may release the common stock and other securities subject to the lock-up agreements described above in whole or in part at any time with or without notice.
In order to facilitate the offering of the common stock, the underwriters may engage in transactions that stabilize, maintain or otherwise affect the price of the common stock. Specifically, the underwriters may sell more shares than they are obligated to purchase under the underwriting agreement, creating a short position. A short sale is covered if the short position is no greater than the number of shares available for purchase by the underwriters under the over-allotment option. The underwriters can close out a covered short sale by exercising the over-allotment option or purchasing shares in the open market. In determining the source of shares to close out a covered short sale, the underwriters will consider, among other things, the open market price of shares compared to the price available under the over-allotment option. The underwriters may also sell shares in excess of the over-allotment option, creating a naked short position. The underwriters must close out any naked short position by purchasing shares in the open market. A naked short position is more likely to be created if the underwriters are concerned that there may be downward pressure on the price of the common stock in the open market after pricing that could adversely affect investors who purchase in this offering. As an additional means of facilitating this offering, the underwriters may bid for, and purchase, shares of common stock in the open market to stabilize the price of the common stock. These activities may raise or maintain the market price of the common stock above independent market levels or prevent or retard a decline in the market price of the common stock. The underwriters are not required to engage in these activities and may end any of these activities at any time.
In connection with the offering of the shares of our common stock, Morgan Stanley & Co. LLC or any person acting for it may over-allot or effect transactions with a view to supporting the market price of the shares of our common stock at a level higher than that which might otherwise prevail for a limited period after the issue date. However, there may be no obligation on the stabilizing manager or any of its agents to do this. Such stabilizing, if commenced, may be discontinued at any time, and must be brought to an end after a limited period.
We and the underwriters have agreed to indemnify each other against certain liabilities, including liabilities under the Securities Act.
A prospectus in electronic format may be made available on websites maintained by one or more underwriters, or selling group members, if any, participating in this offering. The representatives may agree to allocate a number of shares of common stock to underwriters for sale to their online brokerage account holders. Internet distributions will be allocated by the representatives to underwriters that may make internet distributions on the same basis as other allocations.
161
Table of Contents
The underwriters and their respective affiliates are full service financial institutions engaged in various activities, which may include securities trading, commercial and investment banking, financial advisory, investment management, investment research, principal investment, hedging, financing and brokerage activities. Certain of the underwriters and their respective affiliates have, from time to time, performed, and may in the future perform, various financial advisory and investment banking services for us, for which they received or will receive customary fees and expenses.
In addition, in the ordinary course of their various business activities, the underwriters and their respective affiliates may make or hold a broad array of investments and actively trade debt and equity securities (or related derivative securities) and financial instruments (including bank loans) for their own account and for the accounts of their customers and may at any time hold long and short positions in such securities and instruments. Such investment and securities activities may involve our securities and instruments. The underwriters and their respective affiliates may also make investment recommendations or publish or express independent research views in respect of such securities or instruments and may at any time hold, or recommend to clients that they acquire, long or short positions in such securities and instruments.
Pricing of the Offering
Prior to this offering, there has been no public market for our common stock. The initial public offering price was determined by negotiations between us and the representatives. Among the factors considered in determining the initial public offering price were our future prospects and those of our industry in general, our sales, earnings and certain other financial and operating information in recent periods, and the price-earnings ratios, price-sales ratios, market prices of securities, and certain financial and operating information of companies engaged in activities similar to ours. Neither we nor the underwriters can assure investors that an active trading market will develop for our common stock or that the shares will trade in the public market at or above the initial offering price.
Other than in the United States, no action has been taken by us or the underwriters that would permit a public offering of the securities offered by this prospectus in any jurisdiction where action for that purpose is required. The securities offered by this prospectus may not be offered or sold, directly or indirectly, nor may this prospectus or any other offering material or advertisements in connection with the offer and sale of any such securities be distributed or published in any jurisdiction, except under circumstances that will result in compliance with the applicable rules and regulations of that jurisdiction. Persons into whose possession this prospectus comes are advised to inform themselves about and to observe any restrictions relating to the offering and the distribution of this prospectus. This prospectus does not constitute an offer to sell or a solicitation of an offer to buy any securities offered by this prospectus in any jurisdiction in which such an offer or a solicitation is unlawful.
Conflict of Interest
Because Blackstone Advisory Partners L.P., one of the participating underwriters, is an affiliate of Blackstone Group L.P., which owns in excess of 10% of our outstanding common shares, Blackstone Advisory Partners L.P. is deemed to have a “conflict of interest” under Rule 5121 (“Rule 5121”) of the Financial Industry Regulatory Authority, Inc. Accordingly, this offering is being made in compliance with the requirements of FINRA Rule 5121. Pursuant to FINRA Rule 5121, Blackstone Advisory Partners L.P. will not sell to an account holder with a discretionary account any security with respect to which the conflict exists, unless Blackstone Advisory Partners L.P. has received specific written approval of the transaction from the account holder and retains documentation of the approval in its records.
162
Table of Contents
Selling Restrictions
European Economic Area
This prospectus has been prepared on the basis that any offer of shares of our common stock in any Member State of the European Economic Area which has implemented the Prospectus Directive (each, a “Relevant Member State”) will be made pursuant to an exemption under the Prospectus Directive from the requirement to publish a prospectus for offers of shares of our common stock. Accordingly any person making or intending to make an offer in that Relevant Member State of shares of our common stock which are the subject of the offering contemplated in this prospectus may only do so (i) in circumstances in which no obligation arises for us or any of the underwriters to publish a prospectus pursuant to Article 3 of the Prospectus Directive in relation to such offer. Neither we nor the underwriters have authorized, nor do we or they authorize, the making of any offer of shares of our common stock in circumstances in which an obligation arises for us or the underwriters to publish a prospectus for such offer. The expression “Prospectus Directive” means Directive 2003/71/EC (and amendments thereto, including the 2010 PD Amending Directive, to the extent implemented in the Relevant Member State), and includes any relevant implementing measure in the Relevant Member State and the expression “2010 PD Amending Directive” means Directive 2010/73/EU.
In relation to each Relevant Member State , each of the underwriters has represented and agreed that with effect from and including the date on which the Prospectus Directive is implemented in that Relevant Member State (the “Relevant Implementation Date”) it has not made and will not make an offer of shares of our common stock which are the subject of the offering contemplated by this prospectus to the public in that Relevant Member State, except that it may, with effect from and including the Relevant Implementation Date, make an offer of such shares of our common stock to the public in that Relevant Member State:
| (a) | to any legal entity which is a qualified investor as defined in the Prospectus Directive; |
| (b) | to fewer than 100 or, if the Relevant Member State has implemented the relevant provision of the 2010 PD Amending Directive, 150, natural or legal persons (other than qualified investors as defined in the Prospectus Directive), as permitted under the Prospectus Directive, subject to obtaining the prior consent of the representatives for any such offer; or |
| (c) | in any other circumstances falling within Article 3(2) of the Prospectus Directive, |
provided that no such offer of shares of our common stock shall result in a requirement for the publication by us or any underwriter of a prospectus pursuant to Article 3 of the Prospectus Directive.
Each person in a Relevant Member State who receives any communication in respect of, or who acquires any shares of our common stock under, the offers to the public contemplated in this prospectus will be deemed to have represented, warranted and agreed to and with each underwriter that:
| (a) | it is a qualified investor within the meaning of the law in that Relevant Member State implementing Article 2(1)(e) of the Prospectus Directive; and |
| (b) | in the case of any shares of our common stock acquired by it as a financial intermediary, as that term is used in Article 3(2) of the Prospectus Directive, (i) the shares of our common stock acquired by it in the offer have not been acquired on behalf of, nor have they been acquired with a view to their offer or resale to, persons in any Relevant Member State other than qualified investors, as that term is defined in the Prospectus Directive, or in circumstances in which the prior consent of the underwriters has been given to the offer or resale; or (ii) where shares of our common stock have been acquired by it on behalf of persons in any Relevant Member State other than qualified investors, the offer of those shares of our common stock to it is not treated under the Prospectus Directive as having been made to such persons. |
For the purposes of this provision, the expression an “offer to the public” in relation to any shares of our common stock in any Relevant Member State means the communication in any form and by any means of
163
Table of Contents
sufficient information on the terms of the offer and any shares of our common stock to be offered so as to enable an investor to decide to purchase any shares of our common stock, as the same may be varied in that Member State by any measure implementing the Prospectus Directive in that Member State.
United Kingdom
Each underwriter has represented and agreed that:
| (a) | it has only communicated or caused to be communicated and will only communicate or cause to be communicated an invitation or inducement to engage in investment activity (within the meaning of Section 21 of the Financial Services and Markets Act 2000 (“FSMA”) received by it in connection with the issue or sale of the shares of our common stock in circumstances in which Section 21(1) of the FSMA does not apply to us; and |
| (b) | it has complied and will comply with all applicable provisions of the FSMA with respect to anything done by it in relation to the shares of our common stock in, from or otherwise involving the United Kingdom. |
This prospectus is for distribution only to persons who (i) have professional experience in matters relating to investments falling within Article 19(5) of the Financial Services and Markets Act 2000 (Financial Promotion) Order 2005 (as amended, the “Financial Promotion Order”), (ii) are persons falling within Article 49(2)(a) to (d) (“high net worth companies, unincorporated associations etc”) of the Financial Promotion Order, (iii) are outside the United Kingdom, or (iv) are persons to whom an invitation or inducement to engage in investment activity (within the meaning of section 21 of the Financial Services and Markets Act 2000) in connection with the issue or sale of any securities may otherwise lawfully be communicated or caused to be communicated (all such persons together being referred to as “relevant persons”). This prospectus is directed only at relevant persons and must not be acted on or relied on by persons who are not relevant persons. Any investment or investment activity to which this document relates is available only to relevant persons and will be engaged in only with relevant persons.
Hong Kong
The shares may not be offered or sold by means of any document other than (i) in circumstances which do not constitute an offer to the public within the meaning of the Companies Ordinance (Cap.32, Laws of Hong Kong), or (ii) to “professional investors” within the meaning of the Securities and Futures Ordinance (Cap.571, Laws of Hong Kong) and any rules made thereunder, or (iii) in other circumstances which do not result in the document being a “prospectus” within the meaning of the Companies Ordinance (Cap.32, Laws of Hong Kong), and no advertisement, invitation or document relating to the shares may be issued or may be in the possession of any person for the purpose of issue (in each case whether in Hong Kong or elsewhere), which is directed at, or the contents of which are likely to be accessed or read by, the public in Hong Kong (except if permitted to do so under the laws of Hong Kong) other than with respect to shares which are or are intended to be disposed of only to persons outside Hong Kong or only to “professional investors” within the meaning of the Securities and Futures Ordinance (Cap. 571, Laws of Hong Kong) and any rules made thereunder.
Singapore
This prospectus has not been registered as a prospectus with the Monetary Authority of Singapore. Accordingly, this prospectus and any other document or material in connection with the offer or sale, or invitation for subscription or purchase, of the shares may not be circulated or distributed, nor may the shares be offered or sold, or be made the subject of an invitation for subscription or purchase, whether directly or indirectly, to persons in Singapore other than (i) to an institutional investor under Section 274 of the Securities and Futures Act, Chapter 289 of Singapore (the “SFA”), (ii) to a relevant person, or any person pursuant to Section 275(1A), and in accordance with the conditions, specified in Section 275 of the SFA or (iii) otherwise pursuant to, and in accordance with the conditions of, any other applicable provision of the SFA.
164
Table of Contents
Where the shares are subscribed or purchased under Section 275 by a relevant person which is: (a) a corporation (which is not an accredited investor) the sole business of which is to hold investments and the entire share capital of which is owned by one or more individuals, each of whom is an accredited investor; or (b) a trust (where the trustee is not an accredited investor) whose sole purpose is to hold investments and each beneficiary is an accredited investor, shares, debentures and units of shares and debentures of that corporation or the beneficiaries’ rights and interest in that trust shall not be transferable for 6 months after that corporation or that trust has acquired the shares under Section 275 except: (1) to an institutional investor under Section 274 of the SFA or to a relevant person, or any person pursuant to Section 275(1A), and in accordance with the conditions, specified in Section 275 of the SFA; (2) where no consideration is given for the transfer; or (3) by operation of law.
Japan
The securities have not been and will not be registered under the Financial Instruments and Exchange Law of Japan (the Financial Instruments and Exchange Law) and each underwriter has agreed that it will not offer or sell any securities, directly or indirectly, in Japan or to, or for the benefit of, any resident of Japan (which term as used herein means any person resident in Japan, including any corporation or other entity organized under the laws of Japan), or to others for re-offering or resale, directly or indirectly, in Japan or to a resident of Japan, except pursuant to an exemption from the registration requirements of, and otherwise in compliance with, the Financial Instruments and Exchange Law and any other applicable laws, regulations and ministerial guidelines of Japan.
Notice to Prospective Investors in Switzerland
The shares may not be publicly offered in Switzerland and will not be listed on the SIX Swiss Exchange (“SIX”) or on any other stock exchange or regulated trading facility in Switzerland. This document has been prepared without regard to the disclosure standards for issuance prospectuses under art. 652a or art. 1156 of the Swiss Code of Obligations or the disclosure standards for listing prospectuses under art. 27 ff. of the SIX Listing Rules or the listing rules of any other stock exchange or regulated trading facility in Switzerland. Neither this document nor any other offering or marketing material relating to the shares or the offering may be publicly distributed or otherwise made publicly available in Switzerland.
Neither this document nor any other offering or marketing material relating to the offering, the Company, the shares have been or will be filed with or approved by any Swiss regulatory authority. In particular, this document will not be filed with, and the offer of shares will not be supervised by, the Swiss Financial Market Supervisory Authority FINMA (FINMA), and the offer of shares has not been and will not be authorized under the Swiss Federal Act on Collective Investment Schemes (“CISA”). The investor protection afforded to acquirers of interests in collective investment schemes under the CISA does not extend to acquirers of shares.
Notice to Prospective Investors in the Dubai International Financial Centre
This prospectus relates to an Exempt Offer in accordance with the Offered Securities Rules of the Dubai Financial Services Authority (“DFSA”). This prospectus is intended for distribution only to persons of a type specified in the Offered Securities Rules of the DFSA. It must not be delivered to, or relied on by, any other person. The DFSA has no responsibility for reviewing or verifying any documents in connection with Exempt Offers. The DFSA has not approved this prospectus nor taken steps to verify the information set forth herein and has no responsibility for the prospectus. The shares to which this prospectus relates may be illiquid and/or subject to restrictions on their resale. Prospective purchasers of the shares offered should conduct their own due diligence on the shares. If you do not understand the contents of this prospectus you should consult an authorized financial advisor.
165
Table of Contents
Notice to Prospective Investors in Australia
No placement document, prospectus, product disclosure statement or other disclosure document has been lodged with the Australian Securities and Investments Commission (“ASIC”), in relation to the offering. This prospectus does not constitute a prospectus, product disclosure statement or other disclosure document under the Corporations Act 2001 (the “Corporations Act”), and does not purport to include the information required for a prospectus, product disclosure statement or other disclosure document under the Corporations Act.
Any offer in Australia of the shares may only be made to persons (the “Exempt Investors”) who are “sophisticated investors” (within the meaning of section 708(8) of the Corporations Act), “professional investors” (within the meaning of section 708(11) of the Corporations Act) or otherwise pursuant to one or more exemptions contained in section 708 of the Corporations Act so that it is lawful to offer the shares without disclosure to investors under Chapter 6D of the Corporations Act.
The shares applied for by Exempt Investors in Australia must not be offered for sale in Australia in the period of 12 months after the date of allotment under the offering, except in circumstances where disclosure to investors under Chapter 6D of the Corporations Act would not be required pursuant to an exemption under section 708 of the Corporations Act or otherwise or where the offer is pursuant to a disclosure document which complies with Chapter 6D of the Corporations Act. Any person acquiring shares must observe such Australian on-sale restrictions.
This prospectus contains general information only and does not take account of the investment objectives, financial situation or particular needs of any particular person. It does not contain any securities recommendations or financial product advice. Before making an investment decision, investors need to consider whether the information in this prospectus is appropriate to their needs, objectives and circumstances, and, if necessary, seek expert advice on those matters.
166
Table of Contents
The validity of the share of common stock will be passed upon for us by Simpson Thacher & Bartlett LLP, New York, New York. Certain legal matters in connection with the offering will be passed upon for the underwriters by Shearman & Sterling LLP, New York, New York. An investment vehicle comprised of selected partners of Simpson Thacher & Bartlett LLP, members of their families, related persons and others owns an interest representing less than 1% of the capital commitments of funds affiliated with The Blackstone Group L.P.
The consolidated financial statements of Catalent, Inc. and subsidiaries as of June 30, 2013 and 2012 and for each of the three years in the period ended June 30, 2013, appearing in this Prospectus and Registration Statement have been audited by Ernst & Young LLP, independent registered public accounting firm, as set forth in their report thereon appearing elsewhere herein, and are included in reliance upon such report given on the authority of such firm as experts in accounting and auditing.
WHERE YOU CAN FIND MORE INFORMATION
We have filed with the SEC a registration statement on Form S-1 under the Securities Act with respect to the shares of common stock offered by this prospectus. This prospectus, filed as part of the registration statement, does not contain all of the information set forth in the registration statement and its exhibits and schedules, portions of which have been omitted as permitted by the rules and regulations of the SEC. For further information about us and shares of our common stock, we refer you to the registration statement and to its exhibits and schedules. Statements in this prospectus about the contents of any contract, agreement or other document are not necessarily complete and in each instance we refer you to the copy of such contract, agreement or document filed as an exhibit to the registration statement. Anyone may inspect the registration statement and its exhibits and schedules without charge at the public reference facilities the SEC maintains at 100 F Street, N.E., Washington, D.C. 20549. You may obtain copies of all or any part of these materials from the SEC upon the payment of certain fees prescribed by the SEC. You may obtain further information about the operation of the SEC’s Public Reference Room by calling the SEC at 1-800-SEC-0330. You may also inspect these reports and other information without charge at a website maintained by the SEC. The address of this site is http://www.sec.gov.
Upon completion of this offering, we will become subject to the informational requirements of the Exchange Act, and will be required to file reports and other information with the SEC. You will be able to inspect and copy these reports and other information at the public reference facilities maintained by the SEC at the address noted above. You also will be able to obtain copies of this material from the Public Reference Room of the SEC as described above, or inspect them without charge at the SEC’s website. We intend to make available to our common stockholders annual reports containing consolidated financial statements audited by an independent registered public accounting firm.
167
Table of Contents
| Audited Consolidated Financial Statements as of June 30, 2013 and 2012 and for the years ended June 30, 2013, 2012 and 2011 |
||||
| F-2 | ||||
| F-3 | ||||
| F-4 | ||||
| F-5 | ||||
| Consolidated Statements of Changes in Shareholders’ Equity (Deficit) |
F-6 | |||
| F-7 | ||||
| F-8 | ||||
| Unaudited Consolidated Financial Statements as of March 31, 2014 and June 30, 2013 and for the nine months ended March 31, 2014 and 2013 |
||||
| F-50 | ||||
| F-51 | ||||
| F-52 | ||||
| Consolidated Statement of Changes in Shareholders’ Equity (Deficit) |
F-53 | |||
| F-54 | ||||
| F-55 | ||||
F-1
Table of Contents
REPORT OF INDEPENDENT REGISTERED PUBLIC ACCOUNTING FIRM
The Board of Directors and Shareholders
Catalent, Inc.
We have audited the accompanying consolidated balance sheets of Catalent, Inc. and subsidiaries (the Company) as of June 30, 2013 and 2012, and the related consolidated statements of operations, consolidated statements of comprehensive income/(loss), consolidated statement of changes in shareholders’ equity (deficit), and consolidated statements of cash flows for each of the three years in the period ended June 30, 2013. These consolidated financial statements are the responsibility of the Company’s management. Our responsibility is to express an opinion on these consolidated financial statements based on our audits.
We conducted our audits in accordance with the standards of the Public Company Accounting Oversight Board (United States). Those standards require that we plan and perform the audit to obtain reasonable assurance about whether the financial statements are free of material misstatement. We were not engaged to perform an audit of the Company’s internal control over financial reporting. Our audits included consideration of internal control over financial reporting as a basis for designing audit procedures that are appropriate in the circumstances, but not for the purpose of expressing an opinion on the effectiveness of the Company’s internal control over financial reporting. Accordingly, we express no such opinion. An audit also includes examining, on a test basis, evidence supporting the amounts and disclosures in the financial statements, assessing the accounting principles used and significant estimates made by management, and evaluating the overall financial statement presentation. We believe that our audits provide a reasonable basis for our opinion.
In our opinion, the consolidated financial statements referred to above present fairly, in all material respects, the consolidated financial position of Catalent, Inc. and subsidiaries at June 30, 2013 and 2012 and the consolidated results of their operations and their cash flows for each of the three years in the period ended June 30, 2013, in conformity with U.S. generally accepted accounting principles.
/s/ Ernst & Young LLP
MetroPark, New Jersey
January 24, 2014,
except for Note 16, as to which the date is
April 9, 2014
F-2
Table of Contents
CATALENT, INC. AND SUBSIDIARIES
CONSOLIDATED STATEMENTS OF OPERATIONS
(Dollars in millions, except per share data)
| Year Ended June 30, | ||||||||||||
| 2013 | 2012 | 2011 | ||||||||||
| Net revenue |
$ | 1,800.3 | $ | 1,694.8 | $ | 1,531.8 | ||||||
| Cost of products sold |
1,231.7 | 1,136.2 | 1,029.7 | |||||||||
|
|
|
|
|
|
|
|||||||
| Gross margin |
568.6 | 558.6 | 502.1 | |||||||||
| Selling, general and administrative expenses |
340.6 | 348.1 | 288.3 | |||||||||
| Impairment charges and (gain)/loss on sale of assets |
5.2 | 1.8 | 3.6 | |||||||||
| Restructuring and other |
18.4 | 19.5 | 12.5 | |||||||||
| Property and casualty (gain)/loss, net |
— | (8.8 | ) | 11.6 | ||||||||
|
|
|
|
|
|
|
|||||||
| Operating earnings/(loss) |
204.4 | 198.0 | 186.1 | |||||||||
| Interest expense, net |
203.2 | 183.2 | 165.5 | |||||||||
| Other (income)/expense, net |
25.1 | (3.8 | ) | 26.0 | ||||||||
|
|
|
|
|
|
|
|||||||
| Earnings/(loss) from continuing operations before income taxes |
(23.9 | ) | 18.6 | (5.4 | ) | |||||||
| Income tax expense/(benefit) |
24.1 | 16.5 | 23.7 | |||||||||
|
|
|
|
|
|
|
|||||||
| Earnings/(loss) from continuing operations |
(48.0 | ) | 2.1 | (29.1 | ) | |||||||
| Earnings/(loss) from discontinued operations, net of tax |
1.2 | (41.3 | ) | (21.0 | ) | |||||||
|
|
|
|
|
|
|
|||||||
| Net earnings/(loss) |
(46.8 | ) | (39.2 | ) | (50.1 | ) | ||||||
| Less: Net earnings/(loss) attributable to noncontrolling interest, net of tax |
(0.1 | ) | 1.2 | 3.9 | ||||||||
|
|
|
|
|
|
|
|||||||
| Net earnings/(loss) attributable to Catalent |
$ | (46.7 | ) | $ | (40.4 | ) | $ | (54.0 | ) | |||
|
|
|
|
|
|
|
|||||||
| Amounts attributable to Catalent: |
||||||||||||
| Earnings/(loss) from continuing operations less net income (loss) attributable to noncontrolling interest |
$ | (47.9 | ) | $ | 0.9 | $ | (33.0 | ) | ||||
| Net earnings/(loss) attributable to Catalent |
$ | (46.7 | ) | $ | (40.4 | ) | $ | (54.0 | ) | |||
| Earnings per share attributable to Catalent: |
||||||||||||
| Basic |
||||||||||||
| Continuing operations |
$ | (44.72 | ) | $ | 0.84 | $ | (30.93 | ) | ||||
| Net earnings/(loss) |
$ | (43.60 | ) | $ | (37.77 | ) | $ | (50.61 | ) | |||
| Diluted |
||||||||||||
| Continuing operations |
$ | (44.72 | ) | $ | 0.84 | $ | (30.93 | ) | ||||
| Net earnings/(loss) |
$ | (43.60 | ) | $ | (37.51 | ) | $ | (50.61 | ) | |||
The accompanying notes are an integral part of these consolidated financial statements.
F-3
Table of Contents
CATALENT, INC. AND SUBSIDIARIES
CONSOLIDATED STATEMENTS OF COMPREHENSIVE INCOME/(LOSS)
(Dollars in millions)
| Year Ended June 30, | ||||||||||||
| 2013 | 2012 | 2011 | ||||||||||
| Net earnings/(loss) |
$ | (46.8 | ) | $ | (39.2 | ) | $ | (50.1 | ) | |||
| Other comprehensive income/(loss), net of tax |
||||||||||||
| Foreign currency translation adjustments |
(47.9 | ) | (27.3 | ) | 62.4 | |||||||
| Defined benefit pension plan |
8.7 | (26.5 | ) | 18.7 | ||||||||
| Deferred compensation/(benefit) |
0.8 | 0.1 | 0.9 | |||||||||
| Earnings/(loss) on derivatives for the period |
21.6 | 15.2 | 12.5 | |||||||||
|
|
|
|
|
|
|
|||||||
| Other comprehensive income/(loss), net of tax |
(16.8 | ) | (38.5 | ) | 94.5 | |||||||
| Comprehensive income/(loss) |
(63.6 | ) | (77.7 | ) | 44.4 | |||||||
| Comprehensive income/(loss) attributable to noncontrolling interest |
0.1 | (1.9 | ) | 7.9 | ||||||||
| Comprehensive income/(loss) attributable to Catalent |
$ | (63.7 | ) | $ | (75.8 | ) | $ | 36.5 | ||||
The accompanying notes are an integral part of these consolidated financial statements.
F-4
Table of Contents
CATALENT, INC. AND SUBSIDIARIES
(Dollars in millions except per share data)
| June 30, 2013 |
June 30, 2012 |
|||||||
| ASSETS |
||||||||
| Current assets: |
||||||||
| Cash and cash equivalents |
$ | 106.4 | $ | 139.0 | ||||
| Trade receivables, net |
358.0 | 338.3 | ||||||
| Inventories |
124.9 | 118.7 | ||||||
| Prepaid expenses and other |
88.6 | 108.7 | ||||||
|
|
|
|
|
|||||
| Total current assets |
677.9 | 704.7 | ||||||
| Property, plant, and equipment, net |
814.5 | 809.7 | ||||||
| Other assets: |
||||||||
| Goodwill |
1,023.4 | 1,029.9 | ||||||
| Other intangibles, net |
372.2 | 417.7 | ||||||
| Deferred income taxes, net |
132.2 | 135.2 | ||||||
| Other |
36.6 | 41.8 | ||||||
|
|
|
|
|
|||||
| Total assets |
$ | 3,056.8 | $ | 3,139.0 | ||||
|
|
|
|
|
|||||
| LIABILITIES AND SHAREHOLDERS’ DEFICIT |
||||||||
| Current liabilities: |
||||||||
| Current portion of long-term obligations and other short-term borrowings |
$ | 35.0 | $ | 43.2 | ||||
| Accounts payable |
150.8 | 134.2 | ||||||
| Other accrued liabilities |
224.5 | 261.9 | ||||||
|
|
|
|
|
|||||
| Total current liabilities |
410.3 | 439.3 | ||||||
| Long-term obligations, less current portion |
2,656.6 | 2,640.3 | ||||||
| Pension liability |
134.1 | 140.3 | ||||||
| Deferred income taxes |
219.1 | 219.9 | ||||||
| Other liabilities |
47.0 | 49.9 | ||||||
| Commitment and contingencies (see Note 14) |
||||||||
| Shareholders’ equity/(deficit): |
||||||||
| Common stock $0.01 par value; 1,200,000 and 1,150,000 shares authorized in 2013 and 2012, respectively; 1,068,516 and 1,067,945 shares issued and outstanding in 2013 and 2012, respectively |
— | — | ||||||
| Additional paid in capital |
1,027.4 | 1,023.9 | ||||||
| Accumulated deficit |
(1,428.8 | ) | (1,382.1 | ) | ||||
| Accumulated other comprehensive income/(loss) |
(9.3 | ) | 7.5 | |||||
| Total Catalent shareholders’ equity/(deficit) |
(410.7 | ) | (350.7 | ) | ||||
| Noncontrolling interest |
0.4 | — | ||||||
| Total shareholders’ deficit |
(410.3 | ) | (350.7 | ) | ||||
|
|
|
|
|
|||||
| Total liabilities and shareholders’ deficit |
$ | 3,056.8 | $ | 3,139.0 | ||||
|
|
|
|
|
|||||
The accompanying notes are an integral part of these consolidated financial statements
F-5
Table of Contents
CATALENT, INC. AND SUBSIDIARIES
CONSOLIDATED STATEMENT OF CHANGES IN SHAREHOLDERS’ EQUITY/(DEFICIT)
(Dollars in millions, except share data in thousands)
| Shares of Common Stock |
Common Stock |
Additional Paid in Capital |
Accumulated Deficit |
Accumulated Other Comprehensive (Loss)/Income |
Noncontrolling Interest |
Total Shareholders’ Deficit |
||||||||||||||||||||||
| Balance at June 30, 2010 |
1,063.0 | $ | — | 1,074.2 | (1,287.7 | ) | (48.5 | ) | (1.5 | ) | (263.5 | ) | ||||||||||||||||
| Equity contribution |
4.6 | 3.9 | 3.9 | |||||||||||||||||||||||||
| Equity compensation |
3.9 | 3.9 | ||||||||||||||||||||||||||
| Net earnings/(loss) |
(54.0 | ) | 3.9 | (50.1 | ) | |||||||||||||||||||||||
| Distribution related to noncontrolling interest |
(2.6 | ) | (2.6 | ) | ||||||||||||||||||||||||
| Foreign currency translation adjustments |
(0.4 | ) | (0.4 | ) | ||||||||||||||||||||||||
| Net change in minimum pension liability, net of tax |
4.4 | 4.4 | ||||||||||||||||||||||||||
| Other comprehensive income /(loss), net of tax |
94.5 | 94.5 | ||||||||||||||||||||||||||
|
|
|
|
|
|
|
|
|
|
|
|
|
|
|
|||||||||||||||
| Balance at June 30, 2011 |
1,067.6 | $ | — | 1,082.0 | (1,341.7 | ) | 46.0 | 3.8 | (209.9 | ) | ||||||||||||||||||
| Equity contribution |
0.3 | 1.1 | 1.1 | |||||||||||||||||||||||||
| Equity compensation |
3.7 | 3.7 | ||||||||||||||||||||||||||
| Acquisition of noncontrolling interest |
(62.9 | ) | (1.9 | ) | (64.8 | ) | ||||||||||||||||||||||
| Net earnings/(loss) |
(40.4 | ) | 1.2 | (39.2 | ) | |||||||||||||||||||||||
| Net change in minimum pension liability, net of tax |
(3.1 | ) | (3.1 | ) | ||||||||||||||||||||||||
| Other comprehensive income /(loss), net of tax |
(38.5 | ) | (38.5 | ) | ||||||||||||||||||||||||
|
|
|
|
|
|
|
|
|
|
|
|
|
|
|
|||||||||||||||
| Balance at June 30, 2012 |
1,067.9 | $ | — | 1,023.9 | (1,382.1 | ) | 7.5 | — | (350.7 | ) | ||||||||||||||||||
| Equity contribution |
0.6 | 0.7 | 0.5 | 1.2 | ||||||||||||||||||||||||
| Equity compensation |
2.8 | 2.8 | ||||||||||||||||||||||||||
| Net earnings/(loss) |
(46.7 | ) | (0.1 | ) | (46.8 | ) | ||||||||||||||||||||||
| Other comprehensive income /(loss), net of tax |
(16.8 | ) | (16.8 | ) | ||||||||||||||||||||||||
|
|
|
|
|
|
|
|
|
|
|
|
|
|
|
|||||||||||||||
| Balance at June 30, 2013 |
1,068.5 | $ | — | 1,027.4 | (1,428.8 | ) | (9.3 | ) | 0.4 | (410.3 | ) | |||||||||||||||||
|
|
|
|
|
|
|
|
|
|
|
|
|
|
|
|||||||||||||||
The accompanying notes are an integral part of these consolidated financial statements
F-6
Table of Contents
CATALENT, INC. AND SUBSIDIARIES
CONSOLIDATED STATEMENTS OF CASH FLOWS
(Dollars in millions)
| Fiscal Year Ended June 30, |
||||||||||||
| 2013 | 2012 | 2011 | ||||||||||
| CASH FLOWS FROM OPERATING ACTIVITIES: |
||||||||||||
| Net earnings/(loss) |
$ | (46.8 | ) | $ | (39.2 | ) | $ | (50.1 | ) | |||
| Net earnings/(loss) from discontinued operations |
1.2 | (41.3 | ) | (21.0 | ) | |||||||
|
|
|
|
|
|
|
|||||||
| Earnings/(loss) from continuing operations |
(48.0 | ) | 2.1 | (29.1 | ) | |||||||
| Adjustments to reconcile (loss)/earnings from continued operations to net cash from operations: |
||||||||||||
| Depreciation and amortization |
152.2 | 129.7 | 115.5 | |||||||||
| Non-cash foreign currency transaction (gains)/losses, net |
6.6 | (3.7 | ) | 13.2 | ||||||||
| Amortization and write off of debt financing costs |
19.0 | 14.7 | 10.0 | |||||||||
| Asset impairments and (gain)/loss on sale of assets |
5.2 | 9.8 | 3.6 | |||||||||
| Proceeds from insurance related to long lived assets |
— | (21.3 | ) | — | ||||||||
| Call premium and financing fees paid |
10.8 | — | — | |||||||||
| Equity compensation |
2.8 | 3.7 | 3.9 | |||||||||
| Provision/(benefit) for deferred income taxes |
5.4 | (2.8 | ) | 6.5 | ||||||||
| Provision for bad debts and inventory |
10.4 | 9.5 | 9.5 | |||||||||
| Change in operating assets and liabilities: |
— | |||||||||||
| Decrease/(increase) in trade receivables |
(23.6 | ) | (64.9 | ) | (18.9 | ) | ||||||
| Decrease/(increase) in inventories |
(10.5 | ) | 1.4 | (2.0 | ) | |||||||
| Increase/(decrease) in accounts payable |
17.9 | 7.7 | (3.5 | ) | ||||||||
| Other accrued liabilities and operating items, net |
(9.1 | ) | 1.8 | 2.9 | ||||||||
|
|
|
|
|
|
|
|||||||
| Net cash provided by/(used in) operating activities from continuing operations |
139.1 | 87.7 | 111.6 | |||||||||
| Net cash provided by/(used in) operating activities from discontinued operations |
(1.4 | ) | 0.2 | (11.9 | ) | |||||||
|
|
|
|
|
|
|
|||||||
| Net cash provided by/(used in) operating activities |
137.7 | 87.9 | 99.7 | |||||||||
|
|
|
|
|
|
|
|||||||
| CASH FLOWS FROM INVESTING ACTIVITIES: |
||||||||||||
| Acquisition of property and equipment and other productive assets |
(122.5 | ) | (104.2 | ) | (87.3 | ) | ||||||
| Proceeds from sale of property and equipment |
2.9 | 2.2 | 4.0 | |||||||||
| Proceeds from insurance related to long lived assets |
— | 21.3 | — | |||||||||
| Payment for acquisitions, net |
(2.5 | ) | (457.5 | ) | — | |||||||
|
|
|
|
|
|
|
|||||||
| Net cash provided by/(used in) investing activities from continuing operations |
(122.1 | ) | (538.2 | ) | (83.3 | ) | ||||||
| Net cash provided by/(used in) investing activities from discontinued operations |
— | 43.7 | 32.9 | |||||||||
|
|
|
|
|
|
|
|||||||
| Net cash provided by/(used in) investing activities |
(122.1 | ) | (494.5 | ) | (50.4 | ) | ||||||
|
|
|
|
|
|
|
|||||||
| CASH FLOWS FROM FINANCING ACTIVITIES: |
||||||||||||
| Net change in short-term borrowings |
(3.9 | ) | (2.9 | ) | (3.3 | ) | ||||||
| Payments related to revolver credit facility fees |
— | (1.6 | ) | — | ||||||||
| Proceeds from Borrowing, net |
672.7 | 393.3 | — | |||||||||
| Payments related to long-term obligations |
(708.5 | ) | (37.0 | ) | (24.1 | ) | ||||||
| Call premium and financing fees paid |
(10.8 | ) | — | (2.6 | ) | |||||||
| Distribution to noncontrolling interest holder |
— | — | — | |||||||||
| Equity contribution/(redemption) |
1.2 | 1.1 | 3.9 | |||||||||
|
|
|
|
|
|
|
|||||||
| Net cash (used in)/provided by financing activities from continuing operations |
(49.3 | ) | 352.9 | (26.1 | ) | |||||||
| Net cash (used in)/provided by financing activities from discontinued operations |
— | — | — | |||||||||
|
|
|
|
|
|
|
|||||||
| Net cash (used in)/provided by financing activities |
(49.3 | ) | 352.9 | (26.1 | ) | |||||||
|
|
|
|
|
|
|
|||||||
| Effect of foreign currency on cash |
1.1 | (12.4 | ) | 17.9 | ||||||||
| NET INCREASE/(DECREASE) IN CASH AND EQUIVALENTS |
(32.6 | ) | (66.1 | ) | 41.1 | |||||||
| CASH AND EQUIVALENTS AT BEGINNING OF PERIOD |
139.0 | 205.1 | 164.0 | |||||||||
|
|
|
|
|
|
|
|||||||
| CASH AND EQUIVALENTS AT END OF PERIOD |
$ | 106.4 | $ | 139.0 | $ | 205.1 | ||||||
|
|
|
|
|
|
|
|||||||
| SUPPLEMENTARY CASH FLOW INFORMATION: |
||||||||||||
| Interest paid |
$ | 200.1 | $ | 172.4 | $ | 157.6 | ||||||
| Income taxes paid, net |
$ | 14.2 | $ | 23.9 | $ | 20.6 | ||||||
The accompanying notes are an integral part of these consolidated financial statements
F-7
Table of Contents
CATALENT, INC. AND SUBSIDIARIES
NOTES TO CONSOLIDATED FINANCIAL STATEMENTS
(Dollars in millions, except per share amounts)
1. BASIS OF PRESENTATION AND SUMMARY OF SIGNIFICANT ACCOUNTING POLICIES
Business
Catalent, Inc. (“Catalent” or the “Company” or the “Parent”) directly and wholly owns PTS Intermediate Holdings LLC (“Intermediate Holdings”). Intermediate Holdings directly and wholly owns Catalent Pharma Solutions, Inc. (“Operating Company”). Parent is 100% owned by Phoenix Charter LLC (“Phoenix”) and certain members of the Company’s senior management. Phoenix is wholly-owned by BHP PTS Holdings L.L.C., an entity controlled by affiliates of The Blackstone Group L.P. (“Blackstone”), a global private investment and advisory firm.
The Company is the leading global provider of development solutions and advanced delivery technologies for drugs, biologics and consumer health products. Through the Company’s extensive capabilities and deep expertise in product development, the Company helps its customers bring more products to market, faster. The Company’s advanced delivery technology platforms, the broadest and most diverse combination of intellectual property and proven formulation, manufacturing and regulatory expertise available to the industry, enable the Company’s customers to bring more products and better treatments to the market. Across both development and delivery, the Company’s commitment to reliably supply its customers’ needs serves as the foundation for the value the Company provides. The Company operates through four businesses: Development & Clinical Services, Softgel Technologies, Modified Release Technologies, and Medication Delivery Solutions. The Company believes that through its prior and ongoing investments in growth-enabling capacity and capabilities, its entry into new markets, its ongoing focus on operational and quality excellence, its innovation activities, the sales of existing customer products, and the introduction of new customer products, the Company will continue to benefit from attractive margins and realize the growth potential from these areas.
For financial reporting purposes, the Company presents three distinct financial reporting segments based on criteria established by U.S. GAAP: Development & Clinical Services, Oral Technologies and Medication Delivery Solutions. The Oral Technologies segment includes the Softgel Technologies and Modified Release Technologies businesses.
Oral Technologies
The Company’s Oral Technologies segment provides advanced oral delivery technologies, including formulation, development and manufacturing of oral dose forms for prescription and consumer health products across all phases of a molecule’s lifecycle. These oral dose forms include softgel, modified release technology (“MRT”) and immediate release solid oral technology products. At certain facilities the Company also provides integrated primary packaging services for the products the Company manufactures. In fiscal 2013, the Company generated approximately $850 million in revenue from its softgel products and approximately $370 million in revenue from or MRT products.
Through the Softgel Technologies business, the Company provides formulation, development and manufacturing services for soft gelatin capsules, or “softgels”, which the Company first commercialized in the 1930s. The Company is the market leader in overall softgel manufacturing and holds the leading market position in the prescription arena. The Company’s principal softgel technologies include traditional softgel capsules (in which the shell is made from animal-derived materials) and VegiCaps and OptiShell capsules (in which the shell is made from vegetable-derived materials), which are used in a broad range of customer products including prescription drugs, over-the-counter medications, and vitamins and supplements. Softgel capsules encapsulate liquid, paste or oil-based active compounds in solution or suspension within an outer shell, filling and sealing the capsule simultaneously. The Company performs all encapsulation within one of the Company’s softgel facilities,
F-8
Table of Contents
with active ingredients provided by customers or sourced directly by the Company. Softgels have historically been used to solve formulation challenges or technical issues for a specific drug, to help improve the clinical performance of compounds, to provide important market differentiation, particularly for over-the-counter compounds, and to provide safe handling of hormonal, potent and cytotoxic drugs. The Company also participates in the softgel over-the-counter and vitamin, mineral and supplement business in selected regions around the world. With the 2001 introduction of the Company’s vegetable-derived softgel shell, VegiCaps capsules, consumer health manufacturers have been able to extend the softgel dose form to a broader range of active ingredients and serve patient/consumer populations that were previously inaccessible due to religious, dietary or cultural preferences. In recent years this platform has been extended to pharmaceutical active ingredients via the OptiShell platform. The Company’s VegiCaps and OptiShell capsules are patent protected in most major global markets. Physician and patient studies that the Company has conducted have demonstrated a preference for softgels versus traditional tablet and hard capsule dose forms in terms of ease of swallowing, real or perceived speed of delivery, ability to remove or eliminate unpleasant odor or taste and, for physicians, perceived improved patient adherence with dosing regimens.
Through the Company’s Modified Release Technologies business, the Company provides formulation, development and manufacturing services for fast-dissolve tablets and both proprietary and conventional controlled release products. The Company launched its orally dissolving tablet business in 1986 with the introduction of Zydis tablets, a unique oral dosage form that is freeze-dried in its package, can be swallowed without water, and typically dissolves in the mouth in less than three seconds. Most often used for indications, drugs and patient groups that can benefit from rapid oral disintegration, the Zydis technology is utilized in a wide range of products and indications, including treatments for a variety of central nervous system-related conditions such as migraines, Parkinsons’ Disease, schizophrenia, and pain relief. Zydis tablets continue to be used in new ways by its customers as the Company extends the application of the technology to new categories, such as for immunotherapies, vaccines and biologics delivery. More recently the Company has added three new technology platforms to the Modified Release business portfolio, including the highly flexible OptiDose tab-in-tab technology, already commercially proven in Japan; the OptiMelt hot melt extrusion technology; and the development stage LyoPan oral dissolving tablet technology. The Company plans to continue to expand the development pipeline of customer products for all of its Modified Release technologies.
Representative Oral Technologies business customers include Pfizer, Novartis, Merck, GlaxoSmithKline, Eli Lilly, Johnson & Johnson and Actavis.
Medication Delivery Solutions
The Company’s Medication Delivery Solutions segment provides formulation, development and manufacturing services for delivery of drugs and biologics, administered via injection, inhalation and ophthalmic routes, using both traditional and advanced technologies. The Company’s range of injectable manufacturing offerings includes filling drugs or biologics into pre-filled syringes, with flexibility to accommodate other formats within its existing network, focused increasingly on complex pharmaceuticals and biologics. With the Company’s range of technologies, it is able to meet a wide range of specifications, timelines and budgets. The complexity of the manufacturing process, the importance of experience and know-how, regulatory compliance, and high start-up capital requirements create significant barriers to entry and, as a result, limit the number of competitors in the market. For example, blow-fill-seal is an advanced aseptic processing technology which uses a continuous process to form, fill with drug, and seal a plastic container in a sterile environment. Blow-fill-seal units are currently used for a variety of pharmaceuticals in liquid form, such as respiratory, ophthalmic and optic products. The Company is a leader in the outsourced blow-fill-seal market, and operate one of the largest capacity commercial manufacturing blow-fill-seal facilities in the world. The Company’s sterile blow-fill-seal business provides flexible and scalable solutions for unit-dose delivery of complex formulations such as suspensions and emulsions, as well as innovative design and engineering container design and manufacturing solutions. The Company’s regulatory expertise can lead to decreased time to commercialization, and its dedicated development production lines support feasibility, stability and clinical runs. The Company plans to continue to
F-9
Table of Contents
expand the Company’s product line in existing and new markets, and in higher margin specialty products with additional respiratory, ophthalmic, and injectable applications. Representative customers include Pfizer, Sanofi-Aventis, Novartis, Roche and Teva.
The Company’s biologics offerings include its formulation development and cell-line manufacturing based on its advanced and patented Gene Product Expression (“GPEx”) technology, which is used to develop stable, high-yielding mammalian cell lines for both innovator and bio-similar biologic compounds. The Company’s GPEx technology can provide rapid cell line development, high biologics production yields, flexibility and versatility. The Company believes its development stage SMARTag next-generation antibody-drug conjugate technology will provide more precision targeting for delivery of drugs to tumors or other locations, with improved safety versus existing technologies. In fiscal 2013, the Company launched its recently completed biologics facility in Madison, Wisconsin, with expanded capability and capacity to produce clinical scale biologic supplies; combined with offerings from other businesses of Catalent and external partners, the Company now provides the broadest range of technologies and services supporting the development and launch of new biologic entities, biosimilars or biobetters to bring a product from gene to market commercialization, faster.
Development and Clinical Services
The Company’s Development & Clinical Services segment provides manufacturing, packaging, storage and inventory management for drugs and biologics in clinical trials. The Company offers customers flexible solutions for clinical supplies production, and provide distribution and inventory management support for both simple and complex clinical trials. This includes dose form manufacturing or over-encapsulation where needed; supplying placebos, comparator drug procurement and clinical packages and kits for physicians and patients; inventory management; investigator kit ordering and fulfillment; and return supply reconciliation and reporting. The Company supports trials in all regions of the world through its facilities and distribution network. In fiscal 2012 the Company substantially expanded this business via the Aptuit CTS business acquisition in February 2012 (see Note 2 for further discussion), and in fiscal 2013 formed a joint venture with ShangPharma Corporation to expand its clinical supply services network into China. The Company is the leading provider of integrated development solutions and one of the leading providers of clinical trial supplies and respiratory products.
The Company also offers analytical chemical and cell-based testing and scientific services, stability testing, respiratory products formulation and manufacturing, regulatory consulting, and bioanalytical testing for biologic products. The Company’s respiratory product capabilities include development and manufacturing services for inhaled products for delivery via metered dose inhalers, dry powder inhalers and nasal sprays. The Company also provides formulation development and clinical and commercial manufacturing for conventional and specialty oral dose forms. The Company provides global regulatory and clinical support services for the Company’s customers’ regulatory and clinical strategies during all stages of development. Demand for the Company’s offerings is driven by the need for scientific expertise and depth and breadth of services offered, as well as by the reliable supply thereof, including quality, execution and performance.
Basis of Presentation
These financial statements include all of the Company’s subsidiaries, including those operating outside the United States (U.S) and are prepared in accordance with accounting principles generally accepted in the United States of America (U.S. GAAP). All significant transactions among the Company’s businesses have been eliminated.
Use of Estimates
The preparation of financial statements in conformity with generally accepted accounting principles in the United States requires management to make estimates and assumptions that affect amounts reported in the financial statements and accompanying notes. Such estimates include, but are not limited to, allowance for
F-10
Table of Contents
doubtful accounts, inventory and long-lived asset valuation, goodwill and other intangible asset valuation and impairment, equity-based compensation, income taxes, derivative financial instruments and pension plan asset and liability valuation. Actual amounts may differ from these estimated amounts.
Foreign Currency Translation
The financial statements of the Company’s operations outside the U.S. are generally measured using the local currency as the functional currency. Adjustments to translate the assets and liabilities of these foreign operations into U.S. dollars are accumulated as a component of other comprehensive income/(loss) utilizing period-end exchange rates. The currency fluctuation related to certain long-term inter-company loans deemed to not be repayable in the foreseeable future have been recorded within the cumulative translation adjustment, a component of other comprehensive income/(loss). In addition, the currency fluctuation associated with the portion of the Company’s euro-denominated debt designated as a net investment hedge is included as a component of other comprehensive income/(loss). Foreign currency transaction gains and losses calculated by utilizing weighted average exchange rates for the period are included in the statements of operations in “other expense, net”. Such foreign currency transaction gains and losses include inter-company loans that are long-term in nature.
Revenue Recognition
In accordance with Accounting Standard Codification (“ASC”) 605 Revenue Recognition, the Company recognizes revenue when persuasive evidence of an arrangement exists, product delivery has occurred or the services have been rendered, the price is fixed or determinable and collectability is reasonably assured. In cases where the Company has multiple contracts with the same customer, the Company evaluates those contracts to assess if the contracts are linked or are separate arrangements. Factors the Company considers include the timing of negotiation, interdependency with other contracts or elements and payment terms. The Company and its customers generally view each contract discussion as a separate arrangement.
Manufacturing and packaging service revenue is recognized upon delivery of the product in accordance with the terms of the contract, which specify when transfer of title and risk of loss occurs. Some of the Company’s manufacturing contracts with its customers have annual minimum purchase requirements. At the end of the contract year, revenue is recognized for the unfilled purchase obligation in accordance with the contract terms. Development service contracts generally take the form of a fee-for-service arrangement. After the Company has evidence of an arrangement, the price is determinable and there is a reasonable expectation regarding payment, the Company recognizes revenue at the point in time the service obligation is completed and accepted by the customer. Examples of output measures include a formulation report, analytical and stability testing, clinical batch production or packaging and the storage and distribution of a customer’s clinical trial material. Development service revenue is primarily driven by the Company’s Development and Clinical Services segment.
Arrangements containing multiple elements, including service arrangements, are accounted for in accordance with the provisions of ASC 605-25, Revenue Recognition: Multiple-Element Arrangements. The Company determines the separate units of account in accordance with ASC 605-25. If the deliverable meets the criteria of a separate unit of accounting, the arrangement consideration is allocated to each element based upon its relative selling price. In determining the best evidence of selling price of a unit of account the Company utilizes vendor-specific objective evidence (“VSOE”), which is the price the Company charges when the deliverable is sold separately. When VSOE is not available, management uses relevant third-party evidence (“TPE”) of selling price, if available. When neither VSOE nor TPE of selling price exists, management uses its best estimate of selling price.
Cash and Cash Equivalents
All liquid investments purchased with an original maturity of three months or less are considered to be cash and equivalents. The carrying value of these cash equivalents approximates fair value.
F-11
Table of Contents
Receivables and Allowance for Doubtful Accounts
Trade receivables are primarily comprised of amounts owed to the Company through its operating activities and are presented net of an allowance for doubtful accounts. The Company monitors past due accounts on an ongoing basis and establishes appropriate reserves to cover probable losses. An account is considered past due on the first day after its due date. The Company makes judgments as to its ability to collect outstanding receivables and provide allowances when it is assessed that all or a portion of the receivable will not be collected. The Company determines its allowance by considering a number of factors, including the length of time accounts receivable are past due, the Company’s previous loss history, the specific customer’s ability to pay its obligation to the Company, and the condition of the general economy and the customer’s industry. The Company writes off accounts receivable when they become uncollectible.
Concentrations of Credit Risk and Major Customers
Concentration of credit risk, with respect to accounts receivable, is limited due to the large number of customers and their dispersion across different geographic areas. The customers are primarily concentrated in the pharmaceutical and healthcare industry. The Company normally does not require collateral or any other security to support credit sales. The Company performs ongoing credit evaluations of its customers’ financial conditions and maintains reserves for credit losses. Such losses historically have been within the Company’s expectations. During fiscal year 2013 and 2012, no single customer exceeded 10% of revenue or accounts receivable.
Inventories
Inventory is stated at the lower of cost or market, using the first-in, first-out (“FIFO”) method. The Company provides reserves for excess, obsolete or slow-moving inventory based on changes in customer demand, technology developments or other economic factors. Inventory consists of costs associated with raw material, labor and overhead.
Goodwill
The Company accounts for purchased goodwill and intangible assets with indefinite lives in accordance with Codification Statement ASC 350 Intangibles—Goodwill and Other (“ASC 350”). Under ASC 350, goodwill and intangible assets with indefinite lives are not amortized, but instead are tested for impairment at least annually. The Company’s annual goodwill impairment test was conducted as of April 1, 2013. The Company assesses goodwill for possible impairment by comparing the carrying value of its reporting units to their fair values. The Company determines the fair value of its reporting units utilizing estimated future discounted cash flows and incorporates assumptions that it believes marketplace participants would utilize. In addition, the Company uses comparative market information and other factors to corroborate the discounted cash flow results.
Property and Equipment and Other Definite Lived Intangible Assets
Property and equipment are stated at cost. Depreciation expense is computed using the straight-line method over the estimated useful lives of the assets, including capital lease assets that are amortized over the shorter of their useful lives or the terms of the respective leases. The Company generally uses the following range of useful lives for its property and equipment categories: buildings and improvements—5 to 50 years; machinery and equipment—3 to 10 years; and furniture and fixtures—3 to 7 years. Depreciation expense was $108.8 million for the fiscal year ended June 30, 2013, $95.7 million for the fiscal year ended June 30, 2012, and $86.7 million for the fiscal year ended June 30, 2011. The Company charges repairs and maintenance costs to expense as incurred. The amount of capitalized interest was immaterial for all periods presented.
Intangible assets with finite lives, primarily including customer relationships and patents and trademarks continue to be amortized over their useful lives. The Company generally uses the following range of useful lives
F-12
Table of Contents
for its intangible assets with finite lives categories: product relationships—12 years; customer relationships—12 to 14 years; and core technology—10 to 20 years. The Company evaluates the recoverability of its other long-lived assets, including amortizing intangible assets, if circumstances indicate impairment may have occurred pursuant to Codification Standard ASC 360 Property, Plant and Equipment (“ASC 360”). This analysis is performed by comparing the respective carrying values of the assets to the current and expected future cash flows, on an un-discounted basis, to be generated from such assets. If such analysis indicates that the carrying value of these assets is not recoverable, the carrying value of such assets is reduced to fair value through a charge to the Consolidated Statements of Operations. Fair value is determined based on assumptions the Company believes marketplace participants would utilize and comparable marketplace information in similar arms length transactions. The Company recorded an impairment charge related to property, plant and equipment of approximately $5.2 million and $1.8 million, net of any gains on sale of equipment, as of June 30, 2013 and June 30, 2012, respectively. During fiscal years 2013 and 2012, no intangible asset impairment charges were recorded.
Post-Retirement and Pension Plans
The Company sponsors various retirement and pension plans, including defined benefit retirement plans and defined contribution retirement plans. The measurement of the related benefit obligations and the net periodic benefit costs recorded each year are based upon actuarial computations, which require management’s judgment as to certain assumptions. These assumptions include the discount rates used in computing the present value of the benefit obligations and the net periodic benefit costs, the expected future rate of salary increases (for pay-related plans) and the expected long-term rate of return on plan assets (for funded plans). The discount rates are derived based on a hypothetical yield curve represented by a series of annualized individual discount rates. The expected long-term rate of return on plan assets is based on the target asset allocation and the average expected rate of growth for the asset classes invested. The average expected rate of growth is derived from a combination of historic returns, current market indicators, the expected risk premium for each asset class and the opinion of professional advisors. The Company uses a measurement date of June 30 for all its retirement and postretirement benefit plans.
Derivative Instruments, Hedging Activities, and Fair Value
Derivatives Instruments
The Company is exposed to certain risks arising from both its business operations and economic conditions. The Company principally manages its exposures to a wide variety of business and operational risks through management of its core business activities. The Company manages economic risks, including interest rate, liquidity, and credit risk primarily by managing the amount, sources and duration of its debt funding and the use of derivative financial instruments. Specifically, the Company enters into derivative financial instruments to manage exposures that arise from business activities that result in the receipt or payment of future known and uncertain cash amounts, the value of which are determined by interest rates. The Company’s derivative financial instruments are used to manage differences in the amount, timing, and duration of the Company’s known or expected cash receipts and its known or expected cash payments principally related to the Company’s borrowings. The Company does not net any of its derivative positions under master netting arrangements.
Hedging Activities
The Company’s objectives in using interest rate derivatives are to add stability to interest expense and to manage its exposure to interest rate movements. To accomplish this objective, the Company has primarily used interest rate swaps as part of its interest rate risk management strategy. Interest rate swaps designated as cash flow hedges involve the receipt of variable-rate amounts from a counterparty in exchange for the Company making fixed-rate payments over the life of the agreements without exchange of the underlying notional amount.
The effective portion of changes in the fair value of derivatives designated and that qualify as cash flow hedges for financial reporting purposes is recorded in Accumulated Other Comprehensive Income on the balance sheet and is subsequently reclassified into earnings in the period that the hedged forecasted transaction affects
F-13
Table of Contents
earnings. During fiscal years 2013, 2012 and 2011, such derivatives were used to hedge the variable cash flows associated with existing variable-rate debt; however, as of June 30, 2013, the Company did not have any such derivatives in place. The ineffective portion of the change in fair value of the derivatives is recognized directly in earnings.
The Company is exposed to fluctuations in the EUR-USD exchange rate on its investments in foreign operations in Europe. While the Company does not actively hedge against changes in foreign currency, it has mitigated the exposure of investments in its European operations through a net-investment hedge by denominating a portion of the debt in Euros.
Fair Value
The Company is required to measure certain assets and liabilities at fair value, either upon initial measurement or for subsequent accounting or reporting. The Company uses fair value extensively in the initial measurement of net assets acquired in a business combination and when accounting for and reporting on certain financial instruments. The Company estimates fair value using an exit price approach, which requires, among other things, that it determine the price that would be received to sell an asset or paid to transfer a liability in an orderly market. The determination of an exit price is considered from the perspective of market participants, considering the highest and best use of assets and, for liabilities, assuming the risk of non-performance will be the same before and after the transfer. A single estimate of fair value results from a complex series of judgments about future events and uncertainties and relies heavily on estimates and assumptions. When estimating fair value, depending on the nature and complexity of the assets or liability, the Company may use one or all of the following approaches:
| • | Market approach, which is based on market prices and other information from market transactions involving identical or comparable assets or liabilities. |
| • | Cost approach, which is based on the cost to acquire or construct comparable assets less an allowance for functional and/or economic obsolescence. |
| • | Income approach, which is based on the present value of the future stream of net cash flows. |
These fair value methodologies depend on the following types of inputs:
| • | Quoted prices for identical assets or liabilities in active markets (called Level 1 inputs). |
| • | Quoted prices for similar assets or liabilities in active markets or quoted prices for identical or similar assets or liabilities in markets that are directly or indirectly observable (called Level 2 inputs). |
| • | Unobservable inputs that reflect estimates and assumptions (called level 3 inputs). |
Self Insurance
The Company is partially self-insured for certain employee health benefits and partially self-insured for product liability and workers compensation claims. Accruals for losses are provided based upon claims experience and actuarial assumptions, including provisions for incurred but not reported losses.
Shipping and Handling
Shipping and handling costs are included in cost of products sold in the Consolidated Statements of Operations. Shipping and handling revenue received was immaterial for all periods presented and is presented within net revenues.
Accumulated Other Comprehensive Income/(Loss)
Accumulated other comprehensive income/(loss), which is reported in the accompanying Consolidated Statements of Changes in Shareholders’ Equity, consists of net earnings/(loss), foreign currency translation, deferred compensation, dividend distribution, minimum pension liability and unrealized gains and losses from derivatives.
F-14
Table of Contents
Research and Development Costs
The Company expenses research and development costs as incurred. Costs incurred in connection with the development of new offerings and manufacturing process improvements are recorded within selling, general, and administrative expenses. Such research and development costs included in selling, general, and administrative expenses amounted to $14.5 million, $16.9 million and $26.5 million for fiscal years ended June 30, 2013, June 30, 2012 and June 30, 2011, respectively. Costs incurred in connection with research and development services the Company provides to customers and services performed in support of the commercial manufacturing process for customers are recorded within cost of sales. Such research and development costs included in cost of sales amounted to $35.0 million for, $33.5 million and $31.8 million for fiscal years ended June 30, 2013, June 30, 2012 and June 30, 2011, respectively.
Earnings / (loss) per share
The Company reports net earnings (loss) per share in accordance with the standard codification of ASC “Earnings per Share” (“ASC 260”). Under ASC 260, basic earnings per share, which excludes dilution, is computed by dividing net earnings or loss available to common stockholders by the weighted average number of common shares outstanding for the period. Diluted earnings per share reflects the potential dilution of securities that could be exercised or converted into common shares, and is computed by dividing net earnings or loss available to common stockholders by the weighted average of common shares outstanding plus the dilutive potential common shares. Diluted earnings per share includes in-the-money stock options, restricted stock units, and restricted stock using the treasury stock method. During a loss period, the assumed exercise of in-the-money stock options has an anti-dilutive effect and therefore, these instruments are excluded from the computation of dilutive earnings per share.
Income Taxes
In accordance with the standard codification of ASC 740 Income Taxes (“ASC 740”) the Company accounts for income taxes using the asset and liability method. The asset and liability method requires recognition of deferred tax assets and liabilities for expected future tax consequences of temporary differences that currently exist between tax bases and financial reporting bases of the Company’s assets and liabilities. Deferred tax assets and liabilities are measured using enacted tax rates in the respective jurisdictions in which the Company operates. In assessing the ability to realize deferred tax assets, the Company considers whether it is more likely than not that some portion or all of the deferred tax assets will not be realized. The calculation of the Company’s tax liabilities involves dealing with uncertainties in the application of complex tax regulations in each of its tax jurisdictions. The number of years with open tax audits varies depending on the tax jurisdiction. A number of years may lapse before a particular matter is audited and finally resolved. The Company applies the accounting guidance issued to address the accounting for uncertain tax positions. This guidance clarifies the accounting for income taxes, by prescribing a minimum recognition threshold a tax position is required to meet before being recognized in the financial statements as well as provides guidance on derecognition, measurement, classification, interest and penalties, accounting in interim periods, disclosure and transition.
Equity-Based Compensation
The Company accounts for its equity-based compensation awards in accordance with Accounting Standard Codification ASC 718 Compensation—Stock Compensation (“ASC 718”). ASC 718 requires companies to recognize compensation expense using a fair value based method for costs related to share-based payments including stock options and restricted stock units. The expense is measured based on the grant date fair value of the awards that are expected to vest, and the expense is recorded over the applicable requisite service period. In the absence of an observable market price for a share-based award, the fair value is based upon a valuation methodology that takes into consideration various factors, including the exercise price of the award, the expected term of the award, the current price of the underlying shares, the expected volatility of the underlying share price based on peer companies, the expected dividends on the underlying shares and the risk-free interest rate.
F-15
Table of Contents
Recent Financial Accounting Standards
In July 2013, the Financial Accounting Standards Board (the “FASB”) issued Accounting Standards Update No. 2013-11, “Presentation of an Unrecognized Tax Benefit When a Net Operating Loss Carryforward, a Similar Tax Loss, or a Tax Credit Carryforward Exists” (“ASU 2013-11”). ASU 2013-11 resolves the diversity in practice concerning unrecognized tax benefits when a net operating loss carryforward, a similar tax loss, or a tax credit carryforward exists. The guidance is effective for fiscal years and interim reporting periods within those fiscal years beginning after December 15, 2013. Early adoption is permitted. The amendments should be applied prospectively to all unrecognized tax benefits that exist at the effective date. Retrospective application is permitted. Catalent is currently evaluating the impact of this standard on its consolidated results of operations and financial position.
In July 2013, the Financial Accounting Standards Board (the “FASB”) issued Accounting Standards Update No. 2013-10, “Inclusion of the Fed Funds Effective Swap Rate (or Overnight Index Swap Rate) as a Benchmark Interest Rate for Hedge Accounting Purposes” (“ASU 2013-10”). ASU 2013-10 allows the Federal Funds Effective Swap Rate (which is the Overnight Index Swap rate, or OIS rate, in the U.S.) to be designated as a benchmark interest rate for hedge accounting purposes under the derivatives and hedging guidance. The amendments also allow for the use of different benchmark rates for similar hedges. The amendments are effective prospectively for qualifying new or redesignated hedging relationships entered into on or after July 17, 2013. The initial adoption has no impact on the Company’s consolidated results of operations and financial position.
In March 2013, the Financial Accounting Standards Board (the “FASB”) issued Accounting Standards Update No. 2013-05, “Parent’s Accounting for the Cumulative Translation Adjustment upon Derecognition of Certain Subsidiaries or Groups of Assets within a Foreign Entity or of an Investment in a Foreign Entity” (“ASU 2013-05”). ASU 2013-05 resolves the diversity in practice concerning the release of the cumulative translation adjustment into net income when a parent either sells a part or all of its investment in a foreign entity or no longer holds a controlling financial interest in a subsidiary or group of assets within a foreign entity. The guidance is effective for fiscal years and interim reporting periods within those fiscal years beginning after December 15, 2013. The amendments described in the ASU are to be applied prospectively to derecognition events occurring after the effective date; prior periods are not to be adjusted. Catalent is currently evaluating the impact of this standard on its consolidated results of operations and financial position.
In February 2013, the FASB issued Accounting Standards Update No. 2013-04, “Obligations Resulting from Joint and Several Liability Arrangements” (“ASU 2013-04”). ASU 2013-04 provides guidance for the recognition, measurement, and disclosure resulting from joint and several liability arrangements. Examples of obligations that fall within the scope of the ASU include certain debt arrangements, other contractual obligations, and settled litigation. The new guidance is effective on a retrospective basis for fiscal years and interim periods within those fiscal years beginning after December 15, 2013. Catalent is currently evaluating the impact of this standard and does not expect a material impact on the disclosures included in its consolidated financial statements.
In February 2013, the FASB issued Accounting Standards Update No. 2013-02, “Reporting of Amounts Reclassified out of Accumulated Other Comprehensive Income” (“ASU 2013-02”). ASU 2013-02 requires enhanced disclosures about items reclassified out of accumulated other comprehensive income (“AOCI”). For items reclassified to net income in their entirety, the ASU requires information about the effect of significant reclassification items to appear on separate line items of net income. For those items where direct reclassification to net income is not required, companies must provide cross-references to other disclosures that provide details about the effects of the reclassification out of AOCI. Expanded disclosures concerning current period changes in AOCI balances are also required for each component of OCI on the face of the financial statements or in the notes. ASU 2013-02 is effective prospectively for fiscal years beginning after December 15, 2012, and interim periods within those fiscal years. Catalent is currently evaluating the impact of this standard on the disclosures and presentation of its consolidated results of operations and financial position included in its consolidated financial statements.
F-16
Table of Contents
In December 2011, the FASB issued Accounting Standards Update No. 2011-11, “Disclosures about Offsetting Assets and Liabilities” (“ASU 2011-11”). ASU 2011-11 will require disclosure of information about offsetting and related arrangements to enable users of the Company’s financial statements to understand the effect of those arrangements on its financial position. In January 2013, the FASB issued Accounting Standards Update No. 2013-01, “Clarifying the Scope of Disclosures about Offsetting Assets and Liabilities” (“ASU 2013-01”). ASU 2013-01 limits the scope of the new balance sheet offsetting disclosure requirements to derivatives (including bifurcated embedded derivatives), repurchase agreements and reverse repurchase agreements, and certain securities borrowing and lending arrangements. The new guidance is effective for annual reporting periods beginning on or after January 1, 2013, and interim periods within those annual periods. The disclosures required are to be applied retrospectively for all comparative periods presented. Upon adoption, the Company does not expect that this standard will materially impact its disclosures included in its consolidated financial statements.
In June 2011, the FASB issued Accounting Standards Update No. 2011-05, “Presentation of Comprehensive Income” (“ASU 2011-05”). ASU 2011-05 eliminates the option to present the components of other comprehensive income as part of the statement of changes in stockholders’ equity and requires an entity to present items of net income, other comprehensive income and total comprehensive income either in a single continuous statement of comprehensive income or in two separate but consecutive statements. During the first quarter of fiscal 2013, the Company adopted ASU 2011-05 and ASU 2011-12 and has elected to present the items of and total other comprehensive income in a separate statement following the Statement of Operations. As noted above, the FASB has issued ASU 2013-02 which provides guidance and the effective date for implementation of enhanced disclosure of items reclassified out of accumulated other comprehensive income.
2. BUSINESS COMBINATIONS
For all of the Company’s acquisitions, the acquired businesses were recorded at their estimated fair values at the dates of acquisition. The significant acquisition made during fiscal 2012 is discussed below.
Acquisition of the Clinical Trial Supplies Operations of Aptuit, LLC
On February 17, 2012, the Company completed its acquisition of the Clinical Trial Supplies business (the “CTS Business”) of Aptuit, LLC, a Delaware limited liability company (“Aptuit”), by purchasing the outstanding shares of capital stock of Aptuit Holdings, Inc., a wholly-owned subsidiary of Aptuit (the “CTS Acquisition”). The acquisition was completed in connection with the pursuit of the Company’s strategic growth initiatives. Catalent financed the CTS Acquisition and related fees and expenses using the proceeds from a $400.0 million incremental term loan facility and cash on hand. During the year ended June 30, 2012, Catalent incurred approximately $15.0 million in transaction related costs in connection with the acquisition of the CTS Business. These costs are reflected in “Selling, general and administrative expenses” on the Consolidated Statements of Operations.
Purchase Price Allocation
The acquisition method of accounting is based on ASC Subtopic 805-10, “Business Combinations,” and uses the fair value concepts defined in ASC Subtopic 820-10, “Fair Value Measurements and Disclosures.” The excess of the purchase price over the fair values of the identified net assets acquired was recorded as goodwill in accordance with ASC 805-30-30-1 and is generally driven by the Company’s expectations of its ability to realize synergies and achieve its strategic growth objectives. The actions taken to achieve these synergies include headcount reductions, site consolidations and functional alignment to leverage our cost base.
F-17
Table of Contents
As of June 30, 2013, the final allocation of purchase price was comprised of:
| (Dollars in millions) |
||||
| Accounts receivable, net |
$ | 27.9 | ||
| Plant, property and equipment, net |
80.6 | |||
| Unbilled services |
11.8 | |||
| Other assets |
0.4 | |||
| Goodwill |
170.4 | |||
| Intangibles |
177.6 | |||
| Accounts payable |
(10.8 | ) | ||
| Accrued liabilities |
(7.0 | ) | ||
| Deferred tax liability |
(39.0 | ) | ||
| Other liabilities |
(1.6 | ) | ||
| Unearned revenue |
(9.5 | ) | ||
|
|
|
|||
| Total purchase price |
$ | 400.8 | ||
|
|
|
|||
The goodwill recorded to the Clinical Services reporting unit of the Development and Clinical Services segment as of June 30, 2013 was $170.4 million. In addition, the Company expects approximately $6.8 million of goodwill to be tax deductible pursuant to the provisions of ASC 740 Income taxes.
Valuations of Definite Lived Intangible Assets Acquired
The weighted average life of all intangible assets acquired approximates 13.5 years. The following table sets forth the components of intangible assets by type acquired in connection with the CTS Business acquisition:
| (Dollars in millions) |
Estimated Fair Value |
Estimated Useful Life (in years) |
||||||
| Customer relationships—finite-lived |
$ | 171.0 | 13.0-15.0 | |||||
| Backlog |
3.0 | 1.0 | ||||||
| Internally developed software—finite-lived |
3.4 | 4.9 | ||||||
| Leasehold assets |
0.2 | 4.0 | ||||||
|
|
|
|||||||
| Total |
177.6 | |||||||
|
|
|
|||||||
3. GOODWILL
The following table summarizes the changes between June 30, 2012 and June 30, 2013 in the carrying amount of goodwill in total and by reporting segment:
| (Dollars in millions) |
Oral Technologies |
Medication Delivery Solutions |
Development & Clinical Services |
Total | ||||||||||||
| Balance at June 30, 2011(1) |
$ | 880.8 | $ | — | $ | 25.2 | $ | 906.0 | ||||||||
|
|
|
|
|
|
|
|
|
|||||||||
| Additions/(impairment) |
— | — | 169.4 | 169.4 | ||||||||||||
| Foreign currency translation adjustments |
(41.0 | ) | — | (4.5 | ) | (45.5 | ) | |||||||||
|
|
|
|
|
|
|
|
|
|||||||||
| Balance at June 30, 2012 |
839.8 | — | 190.1 | 1,029.9 | ||||||||||||
|
|
|
|
|
|
|
|
|
|||||||||
| Additions/(impairment) |
— | — | 0.9 | 0.9 | ||||||||||||
| Foreign currency translation adjustments |
(6.6 | ) | — | (0.8 | ) | (7.4 | ) | |||||||||
|
|
|
|
|
|
|
|
|
|||||||||
| Balance at June 30, 2013 |
$ | 833.2 | $ | — | $ | 190.2 | $ | 1,023.4 | ||||||||
|
|
|
|
|
|
|
|
|
|||||||||
| (1) | The opening balance is reflective of historical impairment charges related to the Medication Delivery Solutions segment of approximately $158.0 million. |
F-18
Table of Contents
No goodwill impairment charges were required during the current or comparable prior year period. When required, impairment charges are recorded within the Consolidated Statement of Operations as Impairment charges and (gain)/loss on sale of assets.
4. DEFINITE LIVED LONG-LIVED ASSETS
The Company’s definite lived long-lived assets include property, plant and equipment as well as other intangible assets with definite lives.
The details of other intangible assets subject to amortization as of June 30, 2013 and June 30, 2012, are as follows:
| (Dollars in millions) |
Gross Carrying Value |
Accumulated Amortization |
Net Carrying Value |
|||||||||
| June 30, 2013 |
||||||||||||
| Amortized intangibles: |
||||||||||||
| Core technology |
$ | 143.7 | $ | (44.4 | ) | $ | 99.3 | |||||
| Customer relationships |
214.3 | (50.1 | ) | 164.2 | ||||||||
| Product relationships |
227.1 | (118.4 | ) | 108.7 | ||||||||
|
|
|
|
|
|
|
|||||||
| Total intangible assets |
$ | 585.1 | $ | (212.9 | ) | $ | 372.2 | |||||
| (Dollars in millions) |
Gross Carrying Value |
Accumulated Amortization |
Net Carrying Value |
|||||||||
| June 30, 2012 |
||||||||||||
| Amortized intangibles: |
||||||||||||
| Core technology |
$ | 145.0 | $ | (37.5 | ) | $ | 107.5 | |||||
| Customer relationships |
215.6 | (33.4 | ) | 182.2 | ||||||||
| Product relationships |
227.6 | (99.6 | ) | 128.0 | ||||||||
|
|
|
|
|
|
|
|||||||
| Total intangible assets |
$ | 588.2 | $ | (170.5 | ) | $ | 417.7 | |||||
Amortization expense was $43.4 million, $34.0 million, and 28.8 million for the fiscal year ended June 30, 2013, June 30, 2012, and June 30, 2011, respectively. Future amortization expense is estimated to be:
| (Dollars in millions) |
2014 | 2015 | 2016 | 2017 | 2018 | |||||||||||||||
| Amortization expense |
$ | 41.6 | $ | 41.2 | $ | 41.2 | $ | 40.5 | $ | 40.5 | ||||||||||
There were no intangible asset impairments recorded in the current or prior period.
5. RESTRUCTURING AND OTHER COSTS
The Company has implemented plans to restructure certain operations, both domestically and internationally. The restructuring plans focused on various aspects of operations, including closing and consolidating certain manufacturing operations, rationalizing headcount and aligning operations in a strategic and more cost-efficient structure. In addition, the Company may incur restructuring charges in cases where a material change in the scope of operation with its business occurs.
F-19
Table of Contents
The following table summarizes the significant costs recorded within restructuring costs:
| (Dollars in millions) |
Fiscal Year Ended June 30, 2013 |
Fiscal Year Ended June 30, 2012 |
Fiscal Year Ended June 30, 2011 |
|||||||||
| Restructuring costs: |
||||||||||||
| Employee-related reorganization(1) |
15.1 | 14.9 | 6.7 | |||||||||
| Asset impairments |
0.7 | 2.9 | 0.6 | |||||||||
| Facility exit and other costs(2) |
2.6 | 1.7 | 5.2 | |||||||||
|
|
|
|
|
|
|
|||||||
| Total restructuring costs |
$ | 18.4 | $ | 19.5 | $ | 12.5 | ||||||
|
|
|
|
|
|
|
|||||||
| (1) | Employee-related costs consist primarily of severance costs. Outplacement services provided to employees who have been involuntarily terminated and duplicate payroll costs during transition periods are also included within this classification. |
| (2) | Facility exit and other costs consist of accelerated depreciation, equipment relocation costs and costs associated with planned facility expansions and closures to streamline the Company’s operations. |
6. EARNINGS PER SHARE
The reconciliations between basic and diluted earnings per share attributable to Catalent common shareholders for the fiscal years ended June 30, 2013, 2012 and 2011 are as follows (in millions, except per share data):
| Years Ended June 30, | ||||||||||||
| 2013 | 2012 | 2011 | ||||||||||
| Earnings (loss) from continuing operations less net income (loss) attributable to noncontrolling interest |
$ | (47.9 | ) | $ | 0.9 | $ | (33.0 | ) | ||||
| Earnings (loss) from discontinued operations |
1.2 | (41.3 | ) | (21.0 | ) | |||||||
|
|
|
|
|
|
|
|||||||
| Net earnings (loss) attributable to Catalent |
$ | (46.7 | ) | $ | (40.4 | ) | $ | (54.0 | ) | |||
|
|
|
|
|
|
|
|||||||
| Weighted average shares outstanding |
1,071,009 | 1,069,648 | 1,067,051 | |||||||||
| Dilutive securities issuable—stock plans |
— | 7,273 | — | |||||||||
|
|
|
|
|
|
|
|||||||
| Total weighted average diluted shares outstanding |
1,071,009 | 1,076,921 | 1,067,051 | |||||||||
|
|
|
|
|
|
|
|||||||
| Basic earnings per share of common stock: |
||||||||||||
| Earnings (loss) from continuing operations |
$ | (44.72 | ) | $ | 0.84 | $ | (30.93 | ) | ||||
| Earnings (loss) from discontinued operations |
1.12 | (38.61 | ) | (19.68 | ) | |||||||
|
|
|
|
|
|
|
|||||||
| Net earnings (loss) attributable to Catalent |
$ | (43.60 | ) | $ | (37.77 | ) | $ | (50.61 | ) | |||
|
|
|
|
|
|
|
|||||||
| Diluted earnings per share of common stock—assuming dilution: |
||||||||||||
| Earnings (loss) from continuing operations |
$ | (44.72 | ) | $ | 0.84 | $ | (30.93 | ) | ||||
| Earnings (loss) from discontinuing operations |
1.12 | (38.35 | ) | (19.68 | ) | |||||||
|
|
|
|
|
|
|
|||||||
| Net earnings (loss) attributable to Catalent |
$ | (43.60 | ) | $ | (37.51 | ) | $ | (50.61 | ) | |||
|
|
|
|
|
|
|
|||||||
The computation of diluted earnings per share for 2013 and 2011 excludes the effect of the potential common shares issuable under the employee stock option plan of approximately 93 and 64 thousand shares, respectively, and excludes restricted share awards of 4 and 3 thousand, respectively, because the Company had a net loss for the year and the effect would therefore be anti-dilutive. The computation of diluted earnings per share for 2012 excludes the effect of potential shares issuable under 23 thousand options because the vesting provisions of those awards specify performance or market-based conditions that had not been met as of the period end.
F-20
Table of Contents
7. LONG-TERM OBLIGATIONS AND OTHER SHORT-TERM BORROWINGS
Long-term obligations and other short-term borrowings consist of the following at June 30, 2013 and June 30, 2012:
| (Dollars in millions) |
Maturity | June 30, 2013 |
June 30, 2012 |
|||||||||
| Senior Secured Credit Facilities |
||||||||||||
| Term loan facility dollar-denominated |
September 2016 | $ | 791.3 | $ | 798.9 | |||||||
| Term loan facility dollar-denominated |
September 2017 | 646.3 | 591.2 | |||||||||
| Term loan facility euro-denominated |
April 2014 | — | 56.3 | |||||||||
| Term loan facility euro-denominated |
September 2016 | 266.6 | 257.7 | |||||||||
| 9 1⁄2% Senior Toggle Notes |
April 2015 | — | 619.1 | |||||||||
| 9 3⁄4% Senior Subordinated euro-denominated Notes |
April 2017 | 281.9 | 268.7 | |||||||||
| 7 7⁄8% Senior Notes |
October 2018 | 348.2 | — | |||||||||
| Senior Unsecured Term Loan Facility |
December 2017 | 274.1 | — | |||||||||
| $200.3 million Revolving Credit Facility |
April 2016 | — | — | |||||||||
| Other Obligations |
2013 to 2032 | 83.2 | 91.6 | |||||||||
|
|
|
|
|
|||||||||
| Total |
2,691.6 | 2,683.5 | ||||||||||
| Less: current portion and other short-term borrowings |
35.0 | 43.2 | ||||||||||
|
|
|
|
|
|||||||||
| Long-term obligations, less current portion short-term borrowings |
$ | 2,656.6 | $ | 2,640.3 | ||||||||
|
|
|
|
|
|||||||||
The Company has historically used interest rate swaps to manage the economic effect of variable interest obligations associated with floating term loans so that the interest payable effectively becomes fixed at a certain rate, thereby reducing the impact on rate changes on interest expense. See Note 8 for further discussion.
Senior Secured Credit Facilities
On April 10, 2007, the Operating Company entered into a $1.8 billion senior secured credit facility (the “Secured Credit Agreement”) consisting of: (i) an approximately $1.4 billion term loan facility consisting of Dollar Term-1 Loans (the “Dollar Term-1 Loans”) and euro Term Loans (the “euro Term Loans”) and (ii) a $350.0 million revolving credit facility.
The revolving credit facility includes borrowing capacity available for letters of credit and for short-term borrowings. Borrowings under the term loan facility (secured and unsecured) and the revolving credit facility bear interest, at the Operating Company’s option, at a rate equal to an applicable margin over either (a) a base rate determined by reference to the higher of (1) the rate of interest per annum published by The Wall Street Journal from time to time, as the “prime lending rate” and (2) the federal funds rate plus one-half of 1% or (b) a LIBOR rate determined by reference to the British Bankers Association Interest Settlement Rate for deposits in dollars for the interest period relevant to such borrowing adjusted for certain additional costs. The weighted-average interest rates during fiscal 2013 were approximately 3.98% and 4.55% for the Euro-denominated and US-dollar denominated term loans, respectively and approximately 4.0% for the revolving credit facility.
In addition to paying interest on outstanding principal under the senior secured credit facilities, the Operating Company is required to pay a commitment fee to the lenders under the revolving credit facility with respect to the unutilized commitments there under. The initial commitment fee is 0.5% per annum. The commitment fee may be reduced subject to the Operating Company attaining certain leverage ratios. The Operating Company is also required to pay customary letter of credit fees.
The senior secured credit facilities are subject to amortization and prepayment requirements and contain certain covenants, events of default and other customary provisions.
F-21
Table of Contents
On June 1, 2011, the Operating Company and certain lenders amended the Secured Credit Agreement in order to extend the maturity for certain Revolving Credit Loans and Revolving Credit Commitments. In particular, the Operating Company converted approximately $200.3 million of Revolving Credit Commitments and Revolving Credit Loans into new Revolving Tranche-2 Commitments and Revolving Tranche-2 Loans. The amendment set the applicable margin for the Revolving Tranche-2 Loans to a percentage per annum equal to at the Operating Company’s option (i) in the case of euro currency rate loans, 3.75%, or (ii) in the case of base rate loans, 2.75%, which may be reduced subject to the Operating Company attaining certain leverage ratios. In addition, the Operating Company extended the final maturity date of the converted facility to the ninth anniversary or April 10, 2016, subject to certain conditions regarding the refinancing or repayment of the Operating Company’s term loans, the Senior Toggle Notes (defined below), the Senior Subordinated Notes (defined below), and certain other unsecured debt which would cause the final maturity date to be an earlier date.
On February 17, 2012, in connection with the acquisition of the CTS Business, the Operating Company entered into Amendment No. 2 to the Secured Credit Agreement. The amendment provided senior secured financing consisting of a $400.0 million incremental term loan facility (the “Dollar Term-2 Loans”) pursuant to the exercise of the accordion feature under the Secured Credit Agreement. The Dollar Term-2 Loans have substantially similar terms as the Dollar Term-1 Loans. The Operating Company used the proceeds from the Dollar Term-2 Loans, along with cash on hand, to finance the acquisition of the CTS Business. The amendment set the applicable margin for the Dollar Term-2 Loans to a percentage per annum equal to at the Company’s option (i) in the case of euro currency rate loans, 4.00%, subject to a floor of 1.25% or (ii) in the case of base rate loans, 3.00%, subject to a floor of 2.25%. The Dollar Term-2 Loans will mature on the earlier of (i) September 15, 2017 and (ii) the 91st day prior to the maturity of the Operating Company’s Senior Subordinated Notes or any permitted refinancing thereof; provided such Senior Subordinated Notes have an outstanding aggregate principal amount in excess of $100.0 million.
On February 27, 2012, the Operating Company entered into Amendment No. 3 to the Secured Credit Agreement to convert approximately $796.8 million of Dollar Term-1 Loans into new Extended Dollar Term-1 Loans (the “Extended Dollar Term-1 Loans”) and approximately €207.7 million of Euro Term Loans into new Extended Euro Term Loans (the “Extended Euro Term Loans”) with the consent solely of those lenders that agreed to convert their Dollar Term-1 Loans and/or Euro Term Loans, respectively. The Extended Dollar Term-1 Loans and the Extended Euro Term Loans have substantially similar terms as the Dollar Term-1 Loans and Euro Term Loans. The amendment set the applicable margin for the Extended Dollar Term-1 Loans and Extended Euro Term Loans to a percentage per annum equal to at the Operating Company’s option (i) in the case of euro currency rate loans, 4.00% or (ii) in the case of base rate loans, 3.00%. The final maturity date of the Extended Dollar Term-1 Loans and Extended Euro Term Loans was extended to the earlier of (i) September 15, 2016 and (ii) the 91 day prior to the maturity of the Operating Company’s Senior Toggle Notes or any permitted refinancing thereof; provided such Senior Toggle Notes have an outstanding aggregate principal amount in excess of $100.0 million. On March 1, 2012, the Operating Company entered into the Extension Amendment to the Secured Credit Agreement in order to extend the maturity of an additional $11.0 million of Dollar Term-1 Loans into Extended Dollar Term-1 Loans. In addition, the borrowing capacity of the $350.0 million revolving credit facility was reduced to approximately $200.3 million in order to maintain a cost effective debt structure which is appropriate for the Company’s financing needs.
On April 27, 2012, the Operating Company entered into Amendment No. 4 to the Secured Credit Agreement in order to permit the Company to borrow an aggregate principal amount of up to $205.0 million of Refinancing Dollar Term-2 Loans (the “Refinancing Dollar Term-2 Loans”) with the consent of only the lenders agreeing to provide such Refinancing Dollar Term-2 Loans. The proceeds from the Refinancing Dollar Term-2 Loans were used to prepay in full all outstanding Non-Extended Dollar Term-1 Loans under the Secured Credit Agreement. The Refinancing Dollar Term-2 Loans have identical terms with, and the same rights and obligations under the Secured Credit Agreement as, the outstanding Dollar Term-2 Loans.
On February 28, 2013, the Operating Company entered into Amendment No. 5 to the Secured Credit Agreement in order to borrow an aggregate principal amount of approximately $659.5 million of Refinancing
F-22
Table of Contents
Dollar Term-2 Loans and approximately $799.3 million of Refinancing Dollar Term-1 Loans (the “Refinancing Dollar Term-1 Loans”). The proceeds from the Refinancing Dollar Term-2 Loans were used to prepay in full all outstanding Non-Extended Euro Term Loans and Dollar Term-2 Loans under the Secured Credit Agreement; the proceeds of the Refinancing Dollar Term-1 Loans were used to prepay in full all outstanding Extended Dollar Term-1 Loans under the Secured Credit Agreement. The Refinancing Dollar Term-2 and Refinancing Dollar Term-1 Loans have identical terms with, and the same rights and obligations under the Secured Credit Agreement as, the previously outstanding Dollar Term-2 Loans and Extended Dollar Term-1 Loans, respectively. The amendment set the applicable margin for the Refinancing Dollar Term-2 Loans at the Operating Company’s option, at a percentage per annum equal to (i) in the case of eurocurrency rate loans, 3.25%, subject to a floor of 1.00%, or (ii) in the case of base rate loans, 2.25%, subject to a floor of 2.00%. The amendment set the applicable margin for the Refinancing Dollar Term-1 Loans, at the Operating Company’s option, at a percent per annum equal to (i) in the case of eurocurrency rate loans, 3.50% or (ii) in the case of base rate loans, 2.50%. Cash paid associated with this financing activity approximated $2.6 million and $0.6 million of unamortized deferred finance costs and debt discounts were expensed.
As of June 30, 2013, there were $11.8 million in outstanding letters of credit which reduced the borrowing capacity under the approximately $200.3 million revolving line of credit.
Senior Notes
On April 10, 2007, the Operating Company issued $565.0 million of 9.5%/10.25% senior PIK-election fixed rate notes due 2015 (“Senior Toggle Notes”). The Senior Toggle Notes are unsecured senior obligations of the Operating Company. Interest on the Senior Toggle Notes is payable semi-annually in arrears on each April 15 and October 15, which commenced on October 15, 2007. The Operating Company may redeem these notes at par plus specified declining premiums set forth in the indenture plus any accrued and unpaid interest to the date of redemption.
In September 2012, the Operating Company announced the commencement of a tender offer to purchase for cash up to $350 million aggregate principal amount of its outstanding Senior Toggle Notes. On September 18, 2012, the Operating Company purchased $45.9 million aggregate principal amount of Senior Toggle Notes at a price of $47.1 million plus accrued and unpaid interest pursuant to the tender offer. On November 1, 2012, the Operating Company redeemed $304.1 million aggregate principal amount of Senior Toggle Notes for an aggregate price of $311.4 million plus accrued and unpaid interest. In connection with this transaction, the Operating Company paid $8.5 million of call premiums and expensed $3.3 million of unamortized deferred finance costs. These expenses are recorded within “Other Income/Expense” in the Company’s statement of operations.
On September 18, 2012, the Operating Company issued $350 million aggregate principal amount of 7.875% Senior Notes (the “7.875% Notes”). The 7.875% Notes will mature on October 15, 2018 and interest is payable on the 7.875% Notes on April 15 and October 15 of each year, commencing April 15, 2013. The 7.875% Notes were offered in a private offering to qualified institutional buyers pursuant to Rule 144A under the Securities Act of 1933, as amended (the “Securities Act”), and to non-U.S. persons in offshore transactions in accordance with Regulation S under the Securities Act. The 7.875% Notes were issued at a price of 100.0% of their principal amount. The Operating Company used a portion of the net proceeds from the offering of the 7.875% Notes to finance a portion of its tender offer for the Senior Toggle Notes and partial redemption of the Senior Toggle Notes as described above. The Operating Company may redeem these notes at par plus specified declining premiums set forth in the senior subordinated indenture plus any accrued and unpaid interest to the date of redemption.
Senior Unsecured Credit Facility
On April 29, 2013, the Operating Company entered into a senior unsecured term loan facility, in order to borrow an aggregate principal amount of $275 million of unsecured term loans (the “Unsecured Loans”) due
F-23
Table of Contents
December 31, 2017. The proceeds from the Unsecured Loans were used to redeem all $269.1 million of the remaining principal outstanding of the Company’s Senior Toggle Notes at par plus accrued and unpaid interest as of May 29, 2013, the date of redemption. The Unsecured Loans bear interest, at the Operating Company’s option, at a rate equal to the Eurocurrency Rate plus 5.25%, subject to a floor of 1.25%, or the “Base Rate” plus 4.25%, subject to a floor of 2.25%. The “Base Rate” is equal to the higher of either the Federal Funds Rate plus 0.5% or the rate of interest per annum published by the Wall Street Journal from time to time, as the “prime lending rate.” The “Eurocurrency Rate” is determined by reference to the British Bankers Association Interest Settlement rate for deposits in dollars for the interest period relevant to such borrowing adjusted for certain additional costs. The Company is not required to repay installments on the Unsecured Loans and is only required to repay the Unsecured Loans on the date of maturity. Cash paid associated with this financing activity approximated $4.7 million and $2.1 million of unamortized deferred financing costs were expensed.
Senior Subordinated Notes
On April 10, 2007, the Operating Company issued €225.0 million 9.75% euro-denominated ($300.3 million dollar equivalent at the exchange rate effective on the issue date) Senior Subordinated Notes due 2017 (the “Senior Subordinated Notes”). The Senior Subordinated Notes are unsecured senior subordinated obligations of the Operating Company and are subordinated in right of payment to all existing and future senior indebtedness of the Operating Company (including the senior credit facilities and the Senior Toggle Notes). Interest on the Senior Subordinated Notes is payable semi-annually in cash in arrears on each April 15 and October 15, which commences on October 15, 2007. The Operating Company may redeem these notes at par plus specified declining premiums set forth in the senior subordinated indenture plus any accrued and unpaid interest to the date of redemption.
Long-Term and Other Obligations
Other obligations consist primarily of capital leases for buildings and other loans for business and working capital needs.
Maturities of long-term obligations, including capital leases of $62.5 million, and other short-term borrowings for future fiscal years are:
| (Dollars in millions) |
2014 | 2015 | 2016 | 2017 | 2018 | Thereafter | Total | |||||||||||||||||||||
| Maturities of long-term and other obligations |
35.0 | 26.0 | 20.3 | 1,319.7 | 907.6 | 383.0 | 2,691.6 | |||||||||||||||||||||
Debt Issuance Costs
Debt issuance costs are capitalized within prepaid expenses and other assets on the balance sheet and amortized over the life of the related obligation through charges to interest expense in the Consolidated Statements of Operations. The unamortized total of debt issuance costs were approximately $20.3 million and $28.2 million as of June 30, 2013 and June 30, 2012, respectively. Amortization of debt issuance costs totaled $9.2 million and $14.7 million for the fiscal years ended June 30, 2013 and June 30, 2012, respectively.
Guarantees and Security
All obligations under the Secured Credit Agreement and the 7.875% Notes and the Senior Subordinated Notes (together, the “Notes”) are unconditionally guaranteed by each of the Operating Company’s existing U.S. wholly-owned subsidiaries, other than the Company’s Puerto Rico subsidiaries, subject to certain exceptions.
All obligations under the Senior Secured Credit Facilities, and the guarantees of those obligations, are secured by substantially all of the following assets of the Company and each guarantor, subject to certain exceptions:
| • | a pledge of 100% of the capital stock of the Operating Company and 100% of the equity interests directly held by the Operating Company and each guarantor in any wholly-owned material subsidiary |
F-24
Table of Contents
| of the Operating Company or any guarantor (which pledge, in the case of any non-U.S. subsidiary of a U.S. subsidiary, will not include more than 65% of the voting stock of such non-U.S. subsidiary); and |
| • | a security interest in, and mortgages on, substantially all tangible and intangible assets of the Operating Company and of each guarantor, subject to certain limited exceptions. |
Debt Covenants
The Credit Agreement, the senior unsecured term loan facility, and the indentures governing the notes contain a number of covenants that, among other things, restrict, subject to certain exceptions, the Operating Company’s (and the Operating Company’s restricted subsidiaries’) ability to incur additional indebtedness or issue certain preferred shares; create liens on assets; engage in mergers and consolidations; sell assets; pay dividends and distributions or repurchase capital stock; repay subordinated indebtedness; engage in certain transactions with affiliates; make investments, loans or advances; make certain acquisitions; and in the case of the Operating Company’s Credit Agreement, enter into sale and leaseback transactions, amend material agreements governing the Operating Company’s subordinated indebtedness (including the senior subordinated notes) and change the Operating Company’s lines of business.
The Credit Agreement, the senior unsecured term loan facility, the senior unsecured term loan facility, and the indentures governing the notes also contain change of control provisions and certain customary affirmative covenants and events of default. As of June 30, 2013, the Company was in compliance with all covenants related to its long-term obligations. The Company’s long-term debt obligations do not contain any financial maintenance covenants.
Subject to certain exceptions, the Secured Credit Agreement and the indentures governing the notes will permit the Operating Company and its restricted subsidiaries to incur additional indebtedness, including secured indebtedness. None of the Operating Company’s non-U.S. subsidiaries or Puerto Rico subsidiaries is a guarantor of the loans or notes.
As market conditions warrant and subject to the Operating Company’s contractual restrictions and liquidity position, the Company, its affiliates and/or the Company’s major equity holders, including Blackstone and its affiliates, may from time to time repurchase the Operating Company’s outstanding debt securities, including the Senior Toggle Notes and the Senior Subordinated Notes and/or the Operating Company’s outstanding bank loans in privately negotiated or open market transactions, by tender or otherwise. Any such repurchases may be funded by incurring new debt, including additional borrowings under the Operating Company’s existing credit facility. Any new debt may also be secured debt. The Company may also use available cash on the balance sheet. The amounts involved in any such transactions, individually or in the aggregate, may be material. Further, since some of the Operating Company’s debt may trade at a discount to the face amount, any such purchases may result in the Company’s acquiring and retiring a substantial amount of any particular series, with the attendant reduction in the trading liquidity of any such series.
Under the indentures governing the notes, the credit agreement governing the senior unsecured credit facility and the credit agreement governing the senior unsecured credit facility, the Operating Company’s ability to engage in certain activities such as incurring certain additional indebtedness, making certain investments and paying certain dividends is tied to ratios based on Adjusted EBITDA (which is defined as “EBITDA” in the indentures). Adjusted EBITDA is based on the definitions in the Operating Company’s indentures, the credit agreement governing the senior unsecured credit facility and the credit agreement governing the senior unsecured credit facility, is not defined under U.S. GAAP, and is subject to important limitations.
F-25
Table of Contents
8. DERIVATIVE INSTRUMENTS AND HEDGING ACTIVITIES
Risk Management Objective of Using Derivatives
The Company is exposed to certain risks arising from both its business operations and economic conditions. The Company principally manages its exposures to a wide variety of business and operational risks through management of its core business activities. The Company manages economic risks, including interest rate, liquidity, and credit risk primarily by managing the amount, sources and duration of its debt funding and the use of derivative financial instruments. Specifically, the Company enters into derivative financial instruments to manage exposures that arise from business activities that result in the receipt or payment of future known and uncertain cash amounts, the value of which are determined by interest rates. The Company’s derivative financial instruments are used to manage differences in the amount, timing, and duration of the Company’s known or expected cash receipts and its known or expected cash payments principally related to the Company’s borrowings. The Company does not net any of its derivative positions under master netting arrangements.
The Company is exposed to fluctuations in the EUR-USD exchange rate on its investments in foreign operations in Europe. While the Company does not actively hedge against changes in foreign currency, it has mitigated the exposure of its investments in its European operations by denominating a portion of its debt in euros. At June 30, 2013, the Company had euro-denominated debt outstanding of $548.5 million that qualifies as a hedge of a net investment in foreign operations. For non-derivatives designated and qualifying as net investment hedges, the effective portion of the translation gains or losses are reported in accumulated other comprehensive income/(loss) as part of the cumulative translation adjustment. For the fiscal year ended June 30, 2013 the Company recorded a loss of $20.9 million within cumulative translation adjustment. The net accumulated gain of this net investment as of June 30, 2013 included within other comprehensive income/(loss) was approximately $63.0 million. For the fiscal year ended June 30, 2013, the Company recognized an unrealized foreign exchange loss of $6.7 million in the consolidated statement of operations related to a portion of its euro-denominated debt not designated as a net investment hedge. For the fiscal year ended June 30, 2012, the Company recognized an unrealized foreign exchange gain of $17.1 million.
Amounts are reclassified out of accumulated other comprehensive income/(loss) into earnings when the hedged net investment is either sold or substantially liquidated.
Cash Flow Hedges of Interest Rate Risk
The Company’s objectives in using interest rate derivatives historically were to add stability to interest expense and to manage its exposure to interest rate movements. To accomplish this objective, the Company primarily used interest rate swaps as part of its interest rate risk management strategy. Interest rate swaps designated as cash flow hedges involve the receipt of variable-rate amounts from a counterparty in exchange for the Company making fixed-rate payments over the life of the agreements without exchange of the underlying notional amount.
The effective portion of changes in the fair value of derivatives designated and that qualify as cash flow hedges for financial reporting purposes is recorded in accumulated other comprehensive income/(loss) on the balance sheet and is subsequently reclassified into earnings in the period that the hedged forecasted transaction affects earnings. The ineffective portion of the change in fair value of the derivatives is recognized directly in earnings.
During fiscal year 2013, the Operating Company’s two U.S. dollar-denominated and one euro-denominated interest rate swap agreements, which were designated as effective cash flow hedges for financial reporting purposes, matured. The Operating Company’s Japanese yen interest rate swap, effective as an economic hedge but not designated as effective for financial reporting purposes also matured during fiscal year 2013. As of June 30, 2013, the Company did not have any interest rate swap agreements in place that would have the economic effect of modifying the variable interest obligations associated with its floating rate term loans.
F-26
Table of Contents
On February 28, 2013, in connection with the refinancing of the Operating Company’s €44.9 million Euro term loan, Catalent de-designated €35.0 million of the €240.0 million notional Euribor-based interest rate swap. Prior to de-designation, the effective portion of the change in fair value of the derivative was recorded as a component of other comprehensive income/(loss). The other comprehensive income/(loss) balance associated with the de-designated portion of the derivative will be reclassified to earnings when either the originally hedged forecasted interest payments on the hedged debt affect earnings or at the time the originally forecasted transactions become probable of not occurring. The amount of losses reclassified into earnings as a result of the discontinuance of a portion of the Euribor-based interest rate swap as a cash flow hedge for the fiscal year ended June 30, 2013 is $0.1 million.
The table below presents the fair value of the Company’s derivative financial instruments as well as their classification on the Consolidated Balance Sheet as of June 30, 2013 and June 30, 2012.
| (Dollars in millions) |
Fair Values of Financial Derivatives Instruments on the Consolidated Balance Sheets | |||||||||||||||
| Liability Derivatives As of June 30, 2013 |
Liability Derivatives As of June 30, 2012 |
|||||||||||||||
| Balance Sheet Location | Fair Value | Balance Sheet Location | Fair Value | |||||||||||||
| Derivatives designated as hedging instruments under ASC 815: |
||||||||||||||||
| Interest rate swaps |
|
Other accrued liabilities and other liabilities |
|
$ | — | |
Other accrued liabilities and other liabilities |
|
$ | 23.1 | ||||||
| Total derivatives designated as hedging instruments under ASC 815: |
— | 23.1 | ||||||||||||||
| Derivatives not designated as hedging instruments under ASC 815: |
||||||||||||||||
| Interest rate swaps |
|
Other accrued liabilities and other liabilities |
|
$ | — | |
Other accrued liabilities and other liabilities |
|
$ | 0.2 | ||||||
| Total derivatives not designated as hedging instruments under ASC 815: |
$ | — | $ | 0.2 | ||||||||||||
The table below presents the fair value of the Company’s derivative financial instruments as well as their classification on the Consolidated Statement of Operations for the fiscal year ended June 30, 2013, June 30, 2012 and June 30, 2011.
| (Dollars in millions) | The Effect of Derivative Instruments on the Consolidated Statement of Operations for the Fiscal Years Ended June 30, 2013, June 30, 2012 and June 30, 2011 |
|||||||||||||||
| Derivatives in ASC 815 Cash |
Amount of (Gain) or Loss Recognized in OCI on Derivative (Effective Portion) |
Location of (Gain) or Loss Reclassified from Accumulated OCI into Income (Effective Portion) |
Amount of (Gain) or Loss Reclassified from Accumulated OCI into Income (Effective Portion) |
Location of (Gain) or |
Amount of (Gain) or Loss Recognized in Income on Derivative (Ineffective Portion and Amount excluded from Effectiveness Testing) |
|||||||||||
| Fiscal Year 2013: |
||||||||||||||||
| Interest Rate Swaps |
$ | 1.1 | Interest expense, net |
$ | 21.6 | Other (income)/expense, net | $ | 0.1 | ||||||||
| Fiscal Year 2012: |
||||||||||||||||
| Interest Rate Swaps |
$ | 11.0 | Interest expense, net |
$ | 26.4 | Other (income)/expense, net | $ | 0.2 | ||||||||
| Fiscal Year 2011: |
||||||||||||||||
| Interest Rate Swaps |
$ | 14.4 | Interest income/ (expense), net |
$ | 26.9 | Other (income)/expense, net | $ | 0.1 | ||||||||
F-27
Table of Contents
| (Dollars in millions) |
Derivatives Not Designated as Hedging Instruments Under ASC 815 | |||||
| Location of (Gain) or Loss Recognized in Income on Derivative |
Amount of (Gain) or Loss Recognized in Income on Derivative |
|||||
| Fiscal Year 2013: |
||||||
| Interest Rate Swaps |
Other (income)/expense, net | $ | 0.2 | |||
| Fiscal Year 2012: |
||||||
| Interest Rate Swaps |
Other (income)/expense, net | $ | 0.1 | |||
| Fiscal Year 2011: |
||||||
| Interest Rate Swaps |
Other (income)/expense, net | $ | (0.2 | ) | ||
9. FAIR VALUE MEASUREMENTS OF FINANCIAL INSTRUMENTS
ASC 820 Fair Value Measurements and Disclosures (“ASC 820”), which defines fair value, establishes a framework for measuring fair value, and expands disclosures about fair value measurements. ASC 820 defines fair value as the exit price that would be received to sell an asset or paid to transfer a liability. Fair value is a market-based measurement that should be determined using assumptions that market participants would use in pricing an asset or liability. Valuation techniques used to measure fair value should maximize the use of observable inputs and minimize the use of unobservable inputs. To measure fair value, the Company uses the following fair value hierarchy based on three levels of inputs, of which the first two are considered observable and the last unobservable:
Level 1—Quoted prices in active markets for identical assets or liabilities.
Level 2—Inputs other than Level 1 that are observable for the asset or liability, either directly or indirectly, such as quoted prices for similar assets and liabilities in active markets; quoted prices for identical or similar assets or liabilities in markets that are not active; or other inputs that are observable or can be corroborated by observable market data by correlation or other means.
Level 3—Unobservable inputs that are supported by little or no market activity and that are significant to the fair value of the assets or liabilities. Value is determined using pricing models, discounted cash flow methodologies, or similar techniques and also includes instruments for which the determination of fair value requires significant judgment or estimation.
Fair value under ASC 820 is principally applied to financial assets and liabilities which, for Catalent, include both investments in money market funds and derivative instruments—interest rate swaps. The Company is not required to apply all the provisions of ASC 820 in financial statements to the nonfinancial assets and nonfinancial liabilities. There were no changes from the previously reported classification of financial assets and liabilities. The following table provides a summary of financial assets and liabilities that are measured at fair value on a recurring basis as of June 30, 2013, aggregated by the level in the fair value hierarchy within which those measurements fall:
| Fair Value Measurements Using: | ||||||||||||||||
| (Dollars in millions) |
Total | Level 1 | Level 2 | Level 3 | ||||||||||||
| Assets |
||||||||||||||||
| Cash equivalents—money market funds |
$ | 5.8 | $ | 5.8 | $ | — | $ | — | ||||||||
| Liabilities |
||||||||||||||||
| Interest rate swaps |
$ | — | $ | — | $ | — | $ | — | ||||||||
F-28
Table of Contents
The following table provides a summary of financial assets and liabilities that are measured at fair value on a recurring basis as of June 30, 2012, aggregated by the level in the fair value hierarchy in which those measurements fall:
| Fair Value Measurements Using: | ||||||||||||||||
| (Dollars in millions) |
Total | Level 1 | Level 2 | Level 3 | ||||||||||||
| Assets |
||||||||||||||||
| Cash equivalents—money market funds |
$ | 5.9 | $ | 5.9 | $ | — | $ | — | ||||||||
| Liabilities |
||||||||||||||||
| Interest rate swaps |
$ | 23.3 | $ | — | $ | 23.3 | $ | — | ||||||||
Cash Equivalents
The fair value of cash and cash equivalents is estimated on the quoted market price of the investments. The carrying amounts of the Company’s cash equivalents approximate their fair value due to the short-term maturity of these instruments.
Derivative Instruments—Interest Rate Swaps
Historically, the Company has used interest rate swaps to manage interest rate risk on its variable rate long-term debt obligations. The fair value of interest rate swaps are determined using the market standard methodology of netting the discounted future fixed cash receipts (or payments) and the discounted expected variable cash payments (or receipts). The variable cash payments (or receipts) are based on the expectation of future interest rates (forward curves) and derived from observed market interest rate curves. In addition, to comply with the provision of ASC 820, credit valuation adjustments, which consider the impact of any credit enhancements on the contracts, are incorporated in the fair values to account for potential nonperformance risk.
Long-Term Obligations
The estimated fair value of long-term debt is based on the quoted market prices for the same or similar issues or on the current rates offered for debt of the same remaining maturities and considers collateral, if any.
The carrying amounts and the estimated fair values of financial instruments as of June 30, 2013 and June 30, 2012, are as follows:
| June 30, 2013 | June 30, 2012 | |||||||||||||||
| (Dollars in millions) |
Carrying Value |
Estimated Fair Value |
Carrying Value |
Estimated Fair Value |
||||||||||||
| Long-term debt and other |
$ | 2,691.6 | $ | 2,633.2 | $ | 2,683.5 | $ | 2,644.6 | ||||||||
| LIBOR interest rate swap |
— | — | 16.7 | 16.7 | ||||||||||||
| EURIBOR interest rate swap |
— | — | 6.4 | 6.4 | ||||||||||||
| TIBOR interest rate swap |
$ | — | $ | — | $ | 0.2 | $ | 0.2 | ||||||||
The estimated fair values of these Level 2 liabilities are based on quoted market prices for the same or similar instruments and/or the current interest rates offered for debt of the same remaining maturities or estimated discounted cash flows.
F-29
Table of Contents
10. INCOME TAXES
Earnings/(loss) from continuing operations before income taxes and discontinued operations are as follows for the fiscal years ended 2013, 2012 and 2011:
| Fiscal Year Ended June 30, | ||||||||||||
| (Dollars in millions) |
2013 | 2012 | 2011 | |||||||||
| U.S. Operations |
$ | (124.9 | ) | $ | (402.1 | ) | $ | (85.1 | ) | |||
| Non-U.S. Operation |
$ | 101.0 | $ | 420.7 | $ | 79.7 | ||||||
|
|
|
|
|
|
|
|||||||
| $ | (23.9 | ) | $ | 18.6 | $ | (5.4 | ) | |||||
|
|
|
|
|
|
|
|||||||
The provision /(benefit) for income taxes consists of the following for the fiscal years ended 2013, 2012 and 2011:
| Fiscal Year Ended June 30, |
||||||||||||
| (Dollars in millions) |
2013 | 2012 | 2011 | |||||||||
| Current: |
||||||||||||
| Federal |
$ | (0.4 | ) | $ | — | $ | (0.9 | ) | ||||
| State and local |
(2.4 | ) | 0.1 | (0.5 | ) | |||||||
| Non-U.S. |
21.2 | 19.2 | 19.0 | |||||||||
|
|
|
|
|
|
|
|||||||
| Total |
$ | 18.4 | $ | 19.3 | $ | 17.6 | ||||||
| Deferred: |
||||||||||||
| Federal |
$ | 6.2 | $ | 6.0 | $ | 5.5 | ||||||
| State and local |
(0.6 | ) | 0.2 | 1.2 | ||||||||
| Non-U.S. |
0.1 | (9.0 | ) | (0.6 | ) | |||||||
|
|
|
|
|
|
|
|||||||
| Total |
5.7 | (2.8 | ) | 6.1 | ||||||||
|
|
|
|
|
|
|
|||||||
| Total provision/(benefit) |
$ | 24.1 | $ | 16.5 | $ | 23.7 | ||||||
|
|
|
|
|
|
|
|||||||
A reconciliation of the provision/(benefit) based on the federal statutory income tax rate to the Company’s effective income tax rate is as follows for the fiscal years ended 2013, 2012 and 2011:
| Fiscal Year Ended June 30, |
||||||||||||
| (Dollars in millions) |
2013 | 2012 | 2011 | |||||||||
| Provision at U.S. federal statutory tax rate |
$ | (4.9 | ) | $ | 8.6 | $ | (5.4 | ) | ||||
| State and local income taxes, net of federal benefit |
0.5 | 0.2 | 0.8 | |||||||||
| Foreign tax rate differential |
(18.1 | ) | (43.1 | ) | (11.8 | ) | ||||||
| Permanent items |
53.5 | 36.6 | 3.1 | |||||||||
| Unrecognized tax positions |
— | (2.8 | ) | 2.5 | ||||||||
| Tax valuation allowance |
3.6 | 28.1 | 29.5 | |||||||||
| Foreign tax credit—Non U.S. |
(3.4 | ) | (0.2 | ) | (0.2 | ) | ||||||
| Withholding tax and other foreign taxes |
1.8 | (7.7 | ) | 6.1 | ||||||||
| Change in tax rate |
(4.3 | ) | (1.9 | ) | (0.3 | ) | ||||||
| Other |
(4.6 | ) | (1.3 | ) | (0.6 | ) | ||||||
|
|
|
|
|
|
|
|||||||
| $ | 24.1 | $ | 16.5 | $ | 23.7 | |||||||
|
|
|
|
|
|
|
|||||||
As of June 30, 2013, the Company had $355.3 million of undistributed earnings from non-U.S. subsidiaries that are intended to be permanently reinvested in non-U.S. operations. As these earnings are considered permanently reinvested, no U.S. tax provision has been accrued related to the repatriation of these earnings. It is not feasible to estimate the amount of U.S. tax that might be payable on the eventual remittance of such earnings.
F-30
Table of Contents
Deferred income taxes arise from temporary differences between financial reporting and tax reporting bases of assets and liabilities, and operating loss and tax credit carry forwards for tax purposes. The components of the deferred income tax assets and liabilities are as follows at June 30, 2013 and 2012:
| Fiscal Year Ended June 30, |
||||||||
| (Dollars in millions) |
2013 | 2012 | ||||||
| Deferred income tax assets: |
||||||||
| Accrued liabilities |
$ | 28.9 | $ | 38.0 | ||||
| Equity compensation |
8.1 | 7.3 | ||||||
| Loss and tax credit carry forwards |
216.5 | 216.0 | ||||||
| Foreign Currency |
24.3 | 27.6 | ||||||
| Pension |
44.2 | 38.5 | ||||||
| Property-related |
28.1 | 25.9 | ||||||
| Intangibles |
11.8 | 15.9 | ||||||
| Other |
10.3 | 8.3 | ||||||
| OCI |
7.9 | 27.0 | ||||||
|
|
|
|
|
|||||
| Total deferred income tax assets |
380.1 | 404.5 | ||||||
| Valuation Allowance |
(231.6 | ) | (250.7 | ) | ||||
|
|
|
|
|
|||||
| Net deferred income tax assets |
148.5 | 153.8 | ||||||
|
|
|
|
|
|||||
| Fiscal Year Ended June 30, |
||||||||
| (Dollars in millions) |
2013 | 2012 | ||||||
| Deferred income tax liabilities: |
||||||||
| Accrued Liabilities |
(2.6 | ) | (2.5 | ) | ||||
| Equity Compensation |
— | 0.1 | ||||||
| Foreign Currency |
(0.3 | ) | (1.2 | ) | ||||
| Property-related |
(37.1 | ) | (30.0 | ) | ||||
| Goodwill and other intangibles |
(178.7 | ) | (187.0 | ) | ||||
| Other |
(0.7 | ) | (0.9 | ) | ||||
| OCI |
(0.6 | ) | — | |||||
|
|
|
|
|
|||||
| Total deferred income tax liabilities |
(220.0 | ) | (221.5 | ) | ||||
|
|
|
|
|
|||||
| Net deferred income tax liabilities |
$ | (71.5 | ) | $ | (67.7 | ) | ||
|
|
|
|
|
|||||
Deferred tax assets and liabilities in the preceding table are in the following captions in the balance sheet at June 30, 2013 and 2012:
| Fiscal Year Ended June 30, |
||||||||
| (Dollars in millions) |
2013 | 2012 | ||||||
| Current deferred tax asset |
$ | 16.3 | $ | 18.6 | ||||
| Non-current deferred tax asset |
132.2 | 135.2 | ||||||
| Current deferred tax liability |
(0.9 | ) | (1.6 | ) | ||||
| Non-current deferred tax liability |
(219.1 | ) | (219.9 | ) | ||||
|
|
|
|
|
|||||
| Net deferred tax liability |
$ | (71.5 | ) | $ | (67.7 | ) | ||
At June 30, 2013, the Company has federal net operating loss carry forwards of $397.4 million, $7.8 million of which are subject to Internal Revenue Code Section 382 limitations, because they were generated in years prior to April 10, 2007, when the Company was owned by Cardinal Health. The federal loss carry forwards will expire in fiscal years 2022 through 2033. At June 30, 2013, the Company has state tax loss carry forwards of
F-31
Table of Contents
$462.0 million. Approximately $172.0 million of these losses are state tax losses generated in periods prior to the period ending June 30, 2007. Substantially all state carry forwards have a twenty year carry forward period. In accordance with ASC 718, $37.8 million of federal and state losses were generated in prior tax years as a result of tax deductions for equity. Such deductions are not being recognized for financial statement purposes because a cash tax benefit was not realized by the Company, as determined using a with-and-without approach as described in ASC 740-20. As a result, these deductions are not reflected in the federal and state net operating loss carry forward amounts indicated above. At June 30, 2013, the Company has international tax loss carry forwards of $92.6 million. Substantially all of these carry forwards are available for at least three years or have an indefinite carry forward period.
The Company has established a full valuation allowance against its net federal and state deferred tax assets as management does not believe it is more likely than not that these assets will be realized. The Company’s overall valuation allowance as of June 30, 2012 was $250.7 million. During the fiscal year the increase/(decrease) in valuation allowance related to federal, state and foreign assets was $(34.5) million, $(7.8) million, $23.1 million, respectively. As of June 30, 2013 the valuation allowance totaled $231.6 million. This total includes a full valuation allowance of $167.1 million and $34.9 million against its net federal and state deferred tax assets, respectively. At June 30, 2013, the Company has also recorded a valuation allowance of $29.6 million against certain of its foreign net deferred tax assets. The net decrease in the valuation allowance of $19.1 million is primarily due to a decrease of $42.3 million in federal and state valuation allowance, which was a result of reductions in select U.S. deferred tax asset accounts such as net operating losses and OCI. During the current fiscal year the Company generated federal and state taxable income due to U.S. income inclusions resulting from deemed distributions from foreign subsidiaries. This income is not considered to be from normal operating activities.
Management evaluates all available evidence; both positive and negative using a more likely than not standard, in determining if adjustments to the valuation allowance are necessary. This assessment considers, among other matters, the nature, frequency and severity of recent losses, forecasts of future profitability, the duration of statutory carry forward periods, previous experience with tax attributes expiring unused and tax planning alternatives. In making such judgments, significant weight is given to evidence that can be objectively verified. The ability to realize deferred tax assets depends on the ability to generate sufficient taxable income in the carry back or carry forward periods provided for in the tax law for each applicable tax jurisdiction.
As part of the 2007 acquisition from Cardinal, the Company has been indemnified by Cardinal for tax liabilities that may arise in the future that relate to tax periods prior to April 10, 2007 (the “Formation Date”). The indemnification agreement includes, among other taxes, any and all Federal, state and international income based taxes as well as any interest and penalties that may be related thereto.
Similarly, as part of the 2012 purchase of the CTS business from Aptuit, Inc, the Company has been indemnified by Aptuit, Inc. for tax liabilities that may arise in the future that relate to tax periods prior to February 17, 2012. The indemnification agreement includes, among other taxes, any and all Federal, state and international income based taxes as well as any interest and penalties that may be related thereto.
The amount of income taxes the Company may pay is subject to ongoing audits by federal, state and foreign tax authorities, which may result in proposed assessments. The Company’s estimate for the potential outcome for any uncertain tax issue is highly judgmental. The Company assesses its income tax positions and record benefits for all years subject to examination based upon management’s evaluation of the facts, circumstances and information available at the reporting date. For those tax positions for which it is more likely than not that a tax benefit will be sustained, the Company records the amount that has a greater than 50% likelihood of being realized upon settlement with a taxing authority that has full knowledge of all relevant information. Interest and penalties are accrued, where applicable. If the Company does not believe that it is more likely than not that a tax benefit will be sustained, no tax benefit is recognized.
F-32
Table of Contents
ASC 740 includes guidance on the accounting for uncertainty in income taxes recognized in the financial statements. This standard also provides that a tax benefit from an uncertain tax position may be recognized when it is more likely than not that the position will be sustained upon examination, including resolutions of any related appeals or litigation processes, based on the technical merits. As of June 30, 2013, the Company had a total of $37.7 million of unrecognized tax benefits. A reconciliation of the Company’s unrecognized tax benefit, excluding accrued interest for June 30, 2013, June 30, 2012 and June 30, 2011 are as follows:
| (Dollars in millions) |
||||
| Balance at June 30, 2010 |
$ | 36.4 | ||
|
|
|
|||
| Additions based on tax positions related to the current year |
8.3 | |||
| Additions for tax positions of prior years |
6.0 | |||
| Reductions for tax positions of prior years |
(13.3 | ) | ||
| Settlements |
(3.5 | ) | ||
|
|
|
|||
| Balance at June 30, 2011 |
$ | 33.9 | ||
|
|
|
|||
| Additions based on tax positions related to the current year |
4.4 | |||
| Additions for tax positions of prior years |
0.7 | |||
| Reductions for tax positions of prior years |
(5.6 | ) | ||
|
|
|
|||
| Balance at June 30, 2012 |
$ | 33.4 | ||
|
|
|
|||
| Additions based on tax positions related to the current year |
5.4 | |||
| Additions for tax positions of prior years |
1.9 | |||
| Reductions for tax positions of prior years |
(1.1 | ) | ||
| Settlements |
(1.9 | ) | ||
|
|
|
|||
| Balance at June 30, 2013 |
$ | 37.7 | ||
|
|
|
|||
Of this amount, $9.6 million and $8.9 million represent the amount of unrecognized tax benefits that, if recognized, would favorably impact the effective income tax rate as of June 30, 2013 and June 30, 2012, respectively. An additional $21.5 million represents the amount of unrecognized tax benefits that, if recognized, would not impact the effective income tax rate due to a full valuation allowance. The remaining $6.6 million represents unrecognized tax benefits subject to indemnification by Cardinal.
In the normal course of business, the Company is subject to examination by taxing authorities throughout the world, including major jurisdictions such as Germany, United Kingdom, France, the United States, and various states. The Company is no longer subject to examinations by the relevant tax authorities for years prior to fiscal 2001.
The Company recognizes interest and penalties related to uncertain tax positions in income tax expense. As of June 30, 2013, the Company has approximately $5.0 million of accrued interest related to uncertain tax positions, a decrease of $0.9 million from the prior year. The portion of such interest and penalties subject to indemnification by Cardinal is $4.1 million, a decrease of $1.1 million from the prior year.
11. EMPLOYEE RETIREMENT BENEFIT PLANS
The Company sponsors various retirement plans, including defined benefit pension plans and defined contribution plans. Substantially all of the Company’s domestic non-union employees are eligible to participate in an employer-sponsored retirement savings plans, which include features under Section 401(k) of the Internal Revenue Code of 1986, as amended, and provide for company matching contributions. The Company’s contributions to the plans are determined by its Board of Directors subject to certain minimum requirements as specified in the plans. The Company uses a measurement date of June 30 for all its retirement and postretirement benefit plans.
In addition, the Company has recorded $39.7 million in obligations related to its withdrawal from a multi employer pension plan related to a former commercial packaging site, a clinical services site and a former printed
F-33
Table of Contents
components operation. The Company’s withdrawal from these multi employer pension plans have been classified as a mass withdrawal under the Multiemployer Pension Plan Amendments Act of 1980, and, as amended, under the Pension Protection Act of 2006. The estimated discounted value of the projected contributions related to these plans is $39.7 million and $35.8 million as of June 30, 2013 and June 30, 2012, respectively. The withdrawal from the plan resulted in the recognition of liabilities associated with the Company’s long term obligations in both the prior and current year periods, which were primarily recorded as an expense within discontinued operations. The actuarial review process, which is administered by the plan trustees, is ongoing and the Company await final determination as to the company’s ultimate liability. The annual cash impact associated with the Company’s long term obligation is approximately $1.7 million per year. Refer to Note 14 for further discussion.
The following table provides a reconciliation of the change in projected benefit obligation and fair value of plan assets for the defined benefit retirement and other retirement plans, excluding the multi employer pension plan liability:
| At June 30, | Retirement Benefits | Other Post-Retirement Benefits | ||||||||||||||
| (Dollars in millions) |
2013 | 2012 | 2013 | 2012 | ||||||||||||
| Accumulated Benefit Obligation |
$ | 279.7 | $ | 283.0 | $ | 4.9 | $ | 5.3 | ||||||||
| Change in Benefit Obligation |
||||||||||||||||
| Benefit obligation at beginning of year |
292.2 | 257.0 | 5.3 | 5.2 | ||||||||||||
| Company service cost |
2.8 | 2.5 | — | — | ||||||||||||
| Interest cost |
11.9 | 12.9 | 0.2 | 0.2 | ||||||||||||
| Employee contributions |
0.1 | 0.1 | — | — | ||||||||||||
| Plan amendments |
— | — | — | — | ||||||||||||
| Curtailments |
— | — | — | — | ||||||||||||
| Settlements |
(1.6 | ) | — | — | — | |||||||||||
| Special termination benefits |
— | — | — | — | ||||||||||||
| Divestitures |
— | — | — | — | ||||||||||||
| Business combinations |
— | — | — | — | ||||||||||||
| Benefits paid |
(9.8 | ) | (9.2 | ) | (0.2 | ) | (0.3 | ) | ||||||||
| Actual expenses |
— | (0.1 | ) | — | — | |||||||||||
| Actuarial (gain)/loss |
(6.1 | ) | 43.1 | (0.3 | ) | 0.2 | ||||||||||
| Exchange rate gain/(loss) |
(0.4 | ) | (14.1 | ) | (0.1 | ) | — | |||||||||
|
|
|
|
|
|
|
|
|
|||||||||
| Benefit obligation at end of year |
289.1 | 292.2 | 4.9 | 5.3 | ||||||||||||
| Change in Plan Assets |
||||||||||||||||
| Fair value of plan assets at beginning of year |
191.4 | 182.9 | — | — | ||||||||||||
| Actual return on plan assets |
12.9 | 15.3 | — | — | ||||||||||||
| Company contributions |
8.9 | 8.4 | 0.2 | 0.4 | ||||||||||||
| Employee contributions |
0.1 | 0.1 | — | — | ||||||||||||
| Settlements |
(1.6 | ) | — | — | — | |||||||||||
| Special company contributions to fund termination benefits |
— | — | — | — | ||||||||||||
| Divestitures |
— | — | — | — | ||||||||||||
| Business combinations |
— | — | — | — | ||||||||||||
| Benefits paid |
(9.8 | ) | (9.2 | ) | (0.2 | ) | (0.4 | ) | ||||||||
| Actual expenses |
— | (0.1 | ) | — | — | |||||||||||
| Exchange rate gain/(loss) |
(3.5 | ) | (6.0 | ) | — | — | ||||||||||
|
|
|
|
|
|
|
|
|
|||||||||
| Fair value of plan assets at end of year |
198.4 | 191.4 | — | — | ||||||||||||
| Funded Status |
||||||||||||||||
| Funded status at end of year |
(90.7 | ) | (100.8 | ) | (4.9 | ) | (5.3 | ) | ||||||||
| Employer contributions between measurement date and reporting date |
— | — | — | — | ||||||||||||
|
|
|
|
|
|
|
|
|
|||||||||
| Net pension asset (liability) |
(90.7 | ) | (100.8 | ) | (4.9 | ) | (5.3 | ) | ||||||||
F-34
Table of Contents
The following table provides a reconciliation of the net amount recognized in the Consolidated Balance Sheets:
| At June 30, | Retirement Benefits | Other Post-Retirement Benefits | ||||||||||||||
| (Dollars in millions) |
2013 | 2012 | 2013 | 2012 | ||||||||||||
| Amounts Recognized in Statement of Financial Position |
||||||||||||||||
| Noncurrent assets |
$ | 0.4 | $ | 0.5 | $ | — | $ | — | ||||||||
| Current liabilities |
(1.0 | ) | (1.0 | ) | (0.5 | ) | (0.5 | ) | ||||||||
| Noncurrent liabilities |
(90.1 | ) | (100.3 | ) | (4.4 | ) | (4.8 | ) | ||||||||
|
|
|
|
|
|
|
|
|
|||||||||
| Total asset/(liability) |
(90.7 | ) | (100.8 | ) | (4.9 | ) | (5.3 | ) | ||||||||
| Amounts Recognized in Accumulated Other Comprehensive Income |
||||||||||||||||
| Transition (asset)/obligation |
— | — | — | — | ||||||||||||
| Prior service cost |
0.2 | 0.2 | — | — | ||||||||||||
| Net (gain)/loss |
32.5 | 42.4 | (0.6 | ) | (0.3 | ) | ||||||||||
|
|
|
|
|
|
|
|
|
|||||||||
| Total accumulated other comprehensive income at the end of the year |
32.7 | 42.6 | (0.6 | ) | (0.3 | ) | ||||||||||
| Additional Information for Plan with ABO in Excess of Plan Assets |
||||||||||||||||
| Projected benefit obligation |
272.7 | 279.0 | 4.9 | 5.3 | ||||||||||||
| Accumulated benefit obligation |
265.7 | 272.3 | 4.9 | 5.3 | ||||||||||||
| Fair value of plan assets |
181.6 | 177.8 | — | — | ||||||||||||
| Additional Information for Plan with PBO in Excess of Plan Assets |
||||||||||||||||
| Projected benefit obligation |
272.7 | 279.0 | 4.9 | 5.3 | ||||||||||||
| Accumulated benefit obligation |
265.7 | 272.3 | 4.9 | 5.3 | ||||||||||||
| Fair value of plan assets |
181.6 | 177.8 | — | — | ||||||||||||
| Components of Net Periodic Benefit Cost |
||||||||||||||||
| Service Cost |
2.8 | 2.5 | — | — | ||||||||||||
| Interest Cost |
11.9 | 12.9 | 0.2 | 0.2 | ||||||||||||
| Expected return on plan assets |
(9.8 | ) | (10.7 | ) | — | — | ||||||||||
| Amortization of unrecognized: |
||||||||||||||||
| Transition (asset)/obligation |
— | — | — | — | ||||||||||||
| Prior service cost |
— | — | — | — | ||||||||||||
| Net (gain)/loss |
0.9 | 0.1 | — | — | ||||||||||||
|
|
|
|
|
|
|
|
|
|||||||||
| Ongoing periodic cost |
5.8 | 4.8 | 0.2 | 0.2 | ||||||||||||
| Settlement/curtailment expense/(income) |
0.2 | — | — | — | ||||||||||||
|
|
|
|
|
|
|
|
|
|||||||||
| Net periodic benefit cost |
6.0 | 4.8 | 0.2 | 0.2 | ||||||||||||
|
|
|
|
|
|
|
|
|
|||||||||
F-35
Table of Contents
| At June 30, | Retirement Benefits | Other Post-Retirement Benefits | ||||||||||||||
| (Dollars in millions) |
2013 | 2012 | 2013 | 2012 | ||||||||||||
| Other Changes in Plan Assets and Benefit Obligations Recognized in Other Comprehensive Income |
||||||||||||||||
| Net (gain)/loss arising during the year |
$ | (9.2 | ) | $ | 38.5 | (0.3 | ) | 0.2 | ||||||||
| Prior service cost (credit) during the year |
— | — | — | — | ||||||||||||
| Transition asset/(obligation) recognized during the year |
— | — | — | — | ||||||||||||
| Prior service cost recognized during the year |
— | — | — | — | ||||||||||||
| Net gain/(loss) recognized during the year |
(1.1 | ) | (0.1 | ) | — | — | ||||||||||
| Exchange rate gain/(loss) recognized during the year |
0.4 | (1.1 | ) | — | — | |||||||||||
|
|
|
|
|
|
|
|
|
|||||||||
| Total recognized in other comprehensive income |
$ | (9.9 | ) | $ | 37.3 | $ | (0.3 | ) | $ | 0.2 | ||||||
| Total Recognized in Net Periodic Benefit Cost and Other Comprehensive Income |
||||||||||||||||
| Total recognized in net periodic benefit cost and other comprehensive income |
$ | (3.9 | ) | $ | 42.1 | $ | (0.1 | ) | $ | 0.4 | ||||||
| Estimated Amounts to be Amortized from Accumulated Other Comprehensive Income into Net Periodic Benefit Cost |
||||||||||||||||
| Amortization of: |
||||||||||||||||
| Transition (asset)/obligation |
$ | — | $ | — | $ | — | $ | — | ||||||||
| Prior service cost/(credit) |
— | — | — | — | ||||||||||||
| Net (gain)/loss |
1.2 | 0.9 | — | — | ||||||||||||
| Financial Assumptions Used to Determine Benefit Obligations at the Balance Sheet Date |
||||||||||||||||
| Discount rate (%) |
4.14 | % | 4.09 | % | 3.92 | % | 3.38 | % | ||||||||
| Rate of compensation increases (%) |
2.51 | % | 2.51 | % | N/A | N/A | ||||||||||
| Financial Assumptions Used to Determine Net Periodic Benefit Cost for Financial Year |
||||||||||||||||
| Discount rate (%) |
4.09 | % | 5.21 | % | 3.38 | % | 4.49 | % | ||||||||
| Rate of compensation increases (%) |
2.51 | % | 2.51 | % | N/A | N/A | ||||||||||
| Expected long-term rate of return (%) |
5.12 | % | 5.96 | % | N/A | N/A | ||||||||||
| Expected Future Contributions |
||||||||||||||||
| Financial Year |
||||||||||||||||
| 2014 |
$ | 8.0 | $ | 0.5 | ||||||||||||
F-36
Table of Contents
| At June 30, | Retirement Benefits | Other Post-Retirement Benefits | ||||||||||||||
| (Dollars in millions) |
2013 | 2012 | 2013 | 2012 | ||||||||||||
| Expected Future Benefit Payments |
||||||||||||||||
| Financial Year |
||||||||||||||||
| 2014 |
10.9 | 9.4 | 0.5 | 0.5 | ||||||||||||
| 2015 |
9.2 | 10.7 | 0.5 | 0.5 | ||||||||||||
| 2016 |
10.7 | 9.7 | 0.5 | 0.5 | ||||||||||||
| 2017 |
10.4 | 11.8 | 0.4 | 0.5 | ||||||||||||
| 2018 |
12.1 | 10.8 | 0.4 | 0.4 | ||||||||||||
| 2019-2023 |
69.3 | 70.0 | 1.8 | 1.9 | ||||||||||||
| Actual Asset Allocation (%) |
||||||||||||||||
| Equities |
34.1 | % | 29.7 | % | — | % | — | % | ||||||||
| Government Bonds |
21.0 | % | 21.9 | % | — | % | — | % | ||||||||
| Corporate Bonds |
22.0 | % | 23.9 | % | — | % | — | % | ||||||||
| Property |
2.8 | % | 3.3 | % | — | % | — | % | ||||||||
| Insurance Contracts |
9.8 | % | 11.3 | % | — | % | — | % | ||||||||
| Other |
10.3 | % | 9.9 | % | — | % | — | % | ||||||||
| Total |
100.0 | % | 100 | % | — | % | — | % | ||||||||
| Actual Asset Allocation (Amount) |
||||||||||||||||
| Equities |
67.9 | 56.8 | — | — | ||||||||||||
| Government Bonds |
41.6 | 41.9 | — | — | ||||||||||||
| Corporate Bonds |
43.6 | 45.7 | — | — | ||||||||||||
| Property |
5.5 | 6.3 | — | — | ||||||||||||
| Insurance Contracts |
19.4 | 21.6 | — | — | ||||||||||||
| Other |
20.4 | 18.9 | — | — | ||||||||||||
| Total |
198.4 | 191.4 | — | — | ||||||||||||
| Target Asset Allocation (%) |
||||||||||||||||
| Equities |
33.8 | % | 33.2 | % | — | % | — | % | ||||||||
| Government Bonds |
18.1 | % | 21.4 | % | — | % | — | % | ||||||||
| Corporate Bonds |
27.8 | % | 24.3 | % | — | % | — | % | ||||||||
| Property |
3.7 | % | 3.6 | % | — | % | — | % | ||||||||
| Insurance Contracts |
7.5 | % | 8.6 | % | — | % | — | % | ||||||||
| Other |
9.1 | % | 8.9 | % | — | % | — | % | ||||||||
| Total |
100.0 | % | 100.0 | % | — | % | — | % | ||||||||
The Company employs a building block approach in determining the long-term rate of return for plan assets. Historical markets are studied and long-term historical relationships between equities and fixed income are preserved consistent with the widely-accepted capital market principle that assets with higher volatility generate a greater return over the long run. Current market factors such as inflation and interest rates are evaluated before long-term capital market assumptions are determined. The long-term portfolio return is established via a building block approach with proper consideration of diversification and rebalancing. Peer data and historical returns are reviewed to check for reasonability and appropriateness.
Plan assets are recognized and measured at fair value in accordance with the accounting standards regarding fair value measurements. The following are valuation techniques used to determine the fair value of each major category of assets.
| • | Short-term Investments, Equity securities, Fixed Income Securities, and Real Estate are valued using quoted market prices or other valuation methods, and thus are classified within Level 1 or Level 2. |
| • | Insurance Contracts and Other include investments with some observable and unobservable prices that are adjusted by cash contributions and distributions, and thus are classified within Level 2 or Level 3. |
F-37
Table of Contents
The following table provides a summary of plan assets that are measured in fair value as of June 30, 2013, aggregated by the level in the fair value hierarchy within which those measurements fall:
| (Dollars in millions) |
Total Assets | Level 1 | Level 2 | Level 3 | ||||||||||||
| Equity Securities |
$ | 67.9 | $ | 6.0 | $ | 61.9 | — | |||||||||
| Debt Securities |
85.2 | 23.5 | 61.7 | — | ||||||||||||
| Real Estate |
5.5 | — | 0.7 | 4.8 | ||||||||||||
| Other |
39.8 | — | 18.1 | 21.7 | ||||||||||||
|
|
|
|
|
|
|
|
|
|||||||||
| Total |
$ | 198.4 | $ | 29.5 | $ | 142.4 | $ | 26.5 | ||||||||
Level 3 real estate assets consist of a UK Property fund (UBS Life Triton Property Fund) which directly invests in properties which are held in the UK. The funds are priced using the Net Asset Value (“NAV”) of the fund and investors also get Bid and Offer prices on a monthly basis. The NAV is extracted using UK GAAP and its primary asset is Investment Properties. Investment properties are measured at fair value as determined by third party independent appraisers (the “Values”). Their value is ascertained by reference to the market value, having regard to whether they are let or un-let at the date of valuation, in accordance with the Appraisal and Valuation Manual issued by the Royal Institution of Chartered Surveyors.
Level 3 other assets consist of an insurance contract in the UK to fulfill the benefit obligations for a portion of the participant’s benefits. The value of this commitment is determined using the same assumptions and methods used to value the UK Retirement & Death Benefit Plan pension liability. Level 3 other assets also include the partial funding of the Eberbach Pension through a company promissory note or loan with an annual rate of interest of 5%. The value of this commitment fluctuates due to contributions and benefit payments in addition to loan interest.
The following table provides a summary of plan assets that are measured in fair value as of June 30, 2012, aggregated by the level in the fair value hierarchy within which those measurements fall:
| (Dollars in millions) |
Total Assets | Level 1 | Level 2 | Level 3 | ||||||||||||
| Equity Securities |
$ | 56.9 | $ | 5.0 | $ | 51.9 | — | |||||||||
| Debt Securities |
87.8 | 26.5 | 61.3 | — | ||||||||||||
| Real Estate |
6.3 | — | 0.9 | 5.4 | ||||||||||||
| Other |
40.4 | — | 19.4 | 21.0 | ||||||||||||
|
|
|
|
|
|
|
|
|
|||||||||
| Total |
$ | 191.4 | $ | 31.5 | $ | 133.5 | $ | 26.4 | ||||||||
F-38
Table of Contents
The following table provides a reconciliation of the beginning and ending balances of level 3 assets as well as the changes during the period attributable to assets held and those purchases, sales, settlements, contributions and benefits that were paid:
Total (Level 3)
Asset Category Allocations—June 30, 2013
| Total ( Level 3) |
Fair Value Measurement Using Significant Unobservable Inputs Total (Level 3) |
Fair Value Measurement Using Significant Unobservable Inputs Insurance Contracts |
Fair Value Measurement Using Significant Unobservable Inputs Other |
|||||||||
| Beginning Balance at June 30, 2012 |
$ | 26.4 | $ | 4.9 | $ | 21.5 | ||||||
| Actual return on plan assets: |
— | — | — | |||||||||
| Relating to assets still held at the reporting date |
0.4 | (0.7 | ) | 1.1 | ||||||||
| Relating to assets sold during the period |
— | — | — | |||||||||
| Purchases, sales, settlements, contributions and benefits paid |
(0.3 | ) | (0.2 | ) | (0.1 | ) | ||||||
| Transfers in and/or out of Level 3 |
— | — | — | |||||||||
|
|
|
|
|
|
|
|||||||
| Ending Balance at June 30, 2013 |
$ | 26.5 | $ | 4.0 | $ | 22.5 | ||||||
The investment policy reflects the long-term nature of the plans’ funding obligations. The assets are invested to provide the opportunity for both income and growth of principal. This objective is pursued as a long-term goal designed to provide required benefits for participants without undue risk. It is expected that this objective can be achieved through a well-diversified asset portfolio. All equity investments are made within the guidelines of quality, marketability and diversification mandated by the Employee Retirement Income Security Act (“ERISA”) (for plans subject to ERISA) and other relevant statutes. Investment managers are directed to maintain equity portfolios at a risk level approximately equivalent to that of the specific benchmark established for that portfolio. Assets invested in fixed income securities and pooled fixed income portfolios are managed actively to pursue opportunities presented by changes in interest rates, credit ratings or maturity premiums.
F-39
Table of Contents
| At June 30, | Other Post- Retirement Benefits |
|||||||
| (Actual dollar amounts) |
2013 | 2012 | ||||||
| Assumed Healthcare Cost Trend Rates at the Balance Sheet Date |
||||||||
| Healthcare cost trend rate—initial (%) |
||||||||
| Pre 65 |
7.81 | % | 8.47 | % | ||||
| Post 65 |
7.14 | % | 7.70 | % | ||||
| Healthcare cost trend rate—ultimate (%) |
||||||||
| Pre 65 |
4.67 | % | 4.77 | % | ||||
| Post 65 |
4.67 | % | 4.77 | % | ||||
| Year in which ultimate rates are reached |
||||||||
| Pre 65 |
2021 | 2020 | ||||||
| Post 65 |
2020 | 2019 | ||||||
| Effect of 1% Change in Healthcare Cost Trend Rate |
||||||||
| Healthcare cost trend rate up 1% |
||||||||
| on APBO at balance sheet date |
$ | 288,650 | $ | 278,178 | ||||
| on total service and interest cost |
10,129 | 11,853 | ||||||
| Effect of 1% Change in Healthcare Cost Trend Rate |
||||||||
| Healthcare cost trend rate down 1% |
||||||||
| on APBO at balance sheet date |
$ | (256,221 | ) | $ | (248,870 | ) | ||
| on total service and interest cost |
(8,987 | ) | (10,601 | ) | ||||
| Expected Future Contributions |
||||||||
| Financial Year |
||||||||
| 2014 |
$ | 485,333 | ||||||
12. RELATED PARTY TRANSACTIONS
Advisor Transaction and Management Fees
The Company entered into a transaction and advisory fee agreement with Blackstone and certain other Investors in BHP PTS Holdings L.L.C. (the “Investors”), the investment entity controlled by affiliates of Blackstone that was formed in connection with the Investors’ investment in Phoenix. The Company pays an annual sponsor advisory fee to Blackstone and the Investors for certain monitoring, advisory and consulting services to the Company. During the fiscal year ended June 30, 2013, 2012 and 2011 this management fee was approximately $12.4 million, $11.8 million and $10.6 million, respectively. This fee was recorded as expense within selling, general and administrative expenses in the Consolidated Statements of Operations. In addition, pursuant to the terms of the transaction and advisory services agreement with Blackstone, the Company paid $10.0 million in the aggregate in connection with the CTS Acquisition during the fiscal year ended 2012.
Other Related Party Transactions
The Company participates in an employer health program agreement with Equity Healthcare LLC (“Equity Healthcare”). Equity Healthcare negotiates with providers of standard administrative services for health benefit plans and other related services for cost discounts and quality of service monitoring capability by Equity Healthcare. Because of the combined purchasing power of its client participants, Equity Healthcare is able to negotiate pricing terms for providers that are believed to be more favorable than the companies could obtain for themselves on an individual basis. In consideration for these services, the Company paid Equity Healthcare a fee of $2.50 and $2.60 per participating employee per month in calendar year 2012 and 2013, respectively. As of June 30, 2013, the Company had approximately 2,360 employees enrolled in its health benefit plans in the United States. Equity Healthcare is an affiliate of Blackstone.
In addition, the Company does ordinary course business with a number of other companies affiliated with Blackstone; the Company believes that all such arrangements have been entered into in the ordinary course of its business and have been conducted on an arm’s length basis.
F-40
Table of Contents
13. EQUITY
Description of Capital Stock
The Company is authorized to issue 1.2 million shares of capital stock, all of which are Common Stock, with a par value of $0.01 per share. In accordance with the Certificate of Incorporation of the Company, each share of Common Stock shall have one vote, and the Common Stock shall vote together as a single class. As of June 30, 2013, substantially all of the outstanding shares of the capital stock of the Company have been issued to, and are held by, Phoenix Charter, LLC. In accordance with the By-Laws of the Company, the Board of Directors may declare dividends upon the stock of the Company as and when the Board deems appropriate.
Accumulated other comprehensive income/(loss)
Accumulated other comprehensive income/(loss) for the fiscal years June 30, 2013, June 30, 2012 and June 30, 2011 consists of:
| (Dollars in millions) |
Foreign Currency Translation Adjustments |
Unrealized Gains/(Losses) on Derivatives |
Deferred Compensation |
Pension Liability Adjustments |
Other Comprehensive Income/(Loss) |
|||||||||||||||
| Balance at June 30, 2010 |
$ | 27.9 | $ | (49.3 | ) | (0.3 | ) | $ | (26.8 | ) | $ | (48.5 | ) | |||||||
| Activity, net of tax |
62.4 | 12.5 | 0.9 | 18.7 | 94.5 | |||||||||||||||
|
|
|
|
|
|
|
|
|
|
|
|||||||||||
| Balance at June 30, 2011 |
90.3 | (36.8 | ) | 0.6 | (8.1 | ) | 46.0 | |||||||||||||
| Activity, net of tax |
(27.3 | ) | 15.2 | 0.1 | (26.5 | ) | (38.5 | ) | ||||||||||||
|
|
|
|
|
|
|
|
|
|
|
|||||||||||
| Balance at June 30, 2012 |
63.0 | (21.6 | ) | 0.7 | (34.6 | ) | 7.5 | |||||||||||||
| Activity, net of tax |
(47.9 | ) | 21.6 | 0.8 | 8.7 | (16.8 | ) | |||||||||||||
|
|
|
|
|
|
|
|
|
|
|
|||||||||||
| Balance at June 30, 2013 |
$ | 15.1 | $ | — | $ | 1.5 | $ | (25.9 | ) | $ | (9.3 | ) | ||||||||
| Year Ended June 30, | ||||||||||||
| 2013 | 2012 | 2011 | ||||||||||
| Cumulative translation adjustments: |
||||||||||||
| Net investment hedge |
(20.9 | ) | 69.4 | (94.1 | ) | |||||||
| Long term intercompany loans |
(4.8 | ) | — | — | ||||||||
| Translation adjustments |
(22.2 | ) | (96.7 | ) | 156.5 | |||||||
|
|
|
|
|
|
|
|||||||
| Total cumulative translation adjustment |
(47.9 | ) | (27.3 | ) | 62.4 | |||||||
|
|
|
|
|
|
|
|||||||
| Net change in minimum pension liability |
||||||||||||
| Net (gain)/loss arising during the year |
9.5 | (38.7 | ) | 28.4 | ||||||||
| Net gain/(loss) recognized during the year |
1.1 | 0.1 | 0.9 | |||||||||
| Foreign Exchange Translation and Other |
(0.4 | ) | 3.0 | (3.9 | ) | |||||||
|
|
|
|
|
|
|
|||||||
| Total Pension, pretax |
10.2 | (35.6 | ) | 25.4 | ||||||||
|
|
|
|
|
|
|
|||||||
| Tax(1) |
(1.5 | ) | 9.1 | (6.7 | ) | |||||||
|
|
|
|
|
|
|
|||||||
| Net change in minimum pension liability, net of tax |
8.7 | (26.5 | ) | 18.7 | ||||||||
|
|
|
|
|
|
|
|||||||
| (1) | Tax related to minimum pension liability relate to the Company’s foreign operations. |
Tax related to the minimum pension liability generated in the U.S., foreign currency translation adjustments, unrealized gains/(losses) and derivatives and deferred compensation have a full valuation allowance recorded offsetting the tax impact resulting in a net zero tax impact for the three years presented (See Note 10 to the Consolidated Financial Statements).
F-41
Table of Contents
14. COMMITMENTS AND CONTINGENCIES
The future minimum rental payments for operating leases having initial or remaining non-cancelable lease terms in excess of one year at June 30, 2013 are:
| (Dollars in millions) |
2014 | 2015 | 2016 | 2017 | 2018 | Thereafter | Total | |||||||||||||||||||||
| Minimum rental payments |
$ | 6.50 | $ | 5.40 | $ | 3.80 | $ | 2.40 | $ | 1.90 | $ | 6.10 | $ | 26.1 | ||||||||||||||
Rental expense relating to operating leases was approximately $9.4 million, $13.1 million and $15.5 million for the fiscal years ended June 30, 2013, June 30, 2012 and June 30, 2011, respectively. Sublease rental income was not material for any period presented herein.
Other Matters
The Company, along with several pharmaceutical companies, is currently named as a defendant in one civil lawsuit filed by an individual allegedly injured by use of the prescription acne medication Amnesteem®, a branded generic form of isotretinoin. While it is not possible to determine the ultimate outcome of this legal proceeding, including making a determination of liability, the Company believes that it has meritorious defenses with respect to the claims asserted against it and intends to vigorously defend its position.
As has been previously disclosed with regard to the Company’s participation in a multi employer pension plan, the Company notified the plan trustees of its withdrawal from such plan in fiscal 2012. The withdrawal from the plan resulted in the recognition of liabilities associated with the Company’s long term obligations in both the prior and current year periods, which were primarily recorded as an expense within discontinued operations. The actuarial review process, which is administered by the plan trustees, is ongoing and the Company awaits final determination as to the Company’s ultimate liability. The annual cash impact associated with its long term obligation approximates $1.7 million per year.
From time to time the Company may be involved in legal proceedings arising in the ordinary course of business, including, without limitation, inquiries and claims concerning environmental contamination as well as litigation and allegations in connection with acquisitions, product liability, manufacturing or packaging defects, and claims for reimbursement for the cost of lost or damaged active pharmaceutical ingredients, the cost of which could be significant. Based on advice of counsel and available information, including current status or stage of proceeding, and taking into account accruals for matters where the Company has established them, it currently believe that any liabilities ultimately resulting from these ordinary course claims and proceedings will not, individually or in the aggregate, have a material adverse effect on its consolidated financial position, results of operations or cash flows.
15. SEGMENT INFORMATION
The Company conducts its business within the following operating segments: Softgel Technologies, Modified Release Technologies, Medication Delivery Solutions and Development & Clinical Services. The Softgel Technologies and Modified Release Technologies segments are aggregated into one reportable operating segment—Oral Technologies. The Company evaluates the performance of its segments based on segment earnings before noncontrolling interest, other (income) expense, impairments, restructuring costs, interest expense, income tax (benefit)/expense, and depreciation and amortization (“Segment EBITDA”). EBITDA from continuing operations is consolidated earnings from continuing operations before interest expense, income tax (benefit)/expense, depreciation and amortization and is adjusted for the income or loss attributable to non controlling interest. The Company’s presentation of Segment EBITDA and EBITDA from continuing operations may not be comparable to similarly-titled measures used by other companies.
The segments of the Company are organized around similar products and services the Company provides to its customers.
F-42
Table of Contents
The following tables include net revenue and Segment EBITDA during the fiscal year ended June 30, 2013, June 30, 2012, and June 30, 2011:
| Fiscal Year Ended June 30, |
||||||||||||
| (Dollars in millions) |
2013 | 2012 | 2011 | |||||||||
| Oral Technologies |
||||||||||||
| Net revenue |
$ | 1,186.3 | $ | 1,220.2 | $ | 1,159.0 | ||||||
| Segment EBITDA |
315.7 | 334.6 | 308.4 | |||||||||
| Medication Delivery Solutions |
||||||||||||
| Net revenue |
219.3 | 223.9 | 238.6 | |||||||||
| Segment EBITDA |
31.5 | 27.5 | 33.5 | |||||||||
| Development and Clinical Services |
||||||||||||
| Net revenue |
404.8 | 268.3 | 157.0 | |||||||||
| Segment EBITDA |
75.0 | 53.0 | 30.1 | |||||||||
| Inter-segment revenue elimination |
(10.1 | ) | (17.6 | ) | (22.8 | ) | ||||||
| Unallocated Costs(1) |
(90.6 | ) | (84.8 | ) | (100.3 | ) | ||||||
| Combined Total |
||||||||||||
| Net revenue |
1,800.3 | 1,694.8 | 1,531.8 | |||||||||
|
|
|
|
|
|
|
|||||||
| EBITDA from continuing operations |
$ | 331.6 | $ | 330.3 | $ | 271.7 | ||||||
|
|
|
|
|
|
|
|||||||
| (1) | Unallocated costs include restructuring and special items, equity-based compensation, impairment charges, certain other corporate directed costs, and other costs that are not allocated to the segments as follows: |
| (Dollars in millions) |
Fiscal Year Ended June 30, |
|||||||||||
| 2013 | 2012 | 2011 | ||||||||||
| Impairment charges and gain/(loss) on sale of assets |
$ | (5.2 | ) | $ | (1.8 | ) | $ | (3.6 | ) | |||
| Equity compensation |
(2.8 | ) | (3.7 | ) | (3.9 | ) | ||||||
| Restructuring and other items(2) |
(29.0 | ) | (45.8 | ) | (24.9 | ) | ||||||
| Property and casualty losses |
— | 8.8 | (11.6 | ) | ||||||||
| Sponsor advisory fee |
(12.4 | ) | (11.8 | ) | (10.6 | ) | ||||||
| Noncontrolling interest |
0.1 | (1.2 | ) | (3.9 | ) | |||||||
| Other income/(expense), net (2) |
(25.1 | ) | 3.8 | (26.0 | ) | |||||||
| Non-allocated corporate costs, net |
(16.2 | ) | (33.1 | ) | (15.8 | ) | ||||||
|
|
|
|
|
|
|
|||||||
| Total unallocated costs |
$ | (90.6 | ) | $ | (84.8 | ) | $ | (100.3 | ) | |||
|
|
|
|
|
|
|
|||||||
| (2) | Segment results do not include restructuring and certain acquisition related costs |
| (3) | Primarily relates to realized and unrealized gains/(losses) related to foreign currency translation and expenses related to financing transactions during the period |
Provided below is a reconciliation of earnings/(loss) from continuing operations to EBITDA from continuing operations:
| (Dollars in millions) |
Fiscal Year Ended June 30, |
|||||||||||
| 2013 | 2012 | 2011 | ||||||||||
| Earnings/(loss) from continuing operations |
$ | (48.0 | ) | $ | 2.1 | $ | (29.1 | ) | ||||
| Depreciation and amortization |
152.2 | 129.7 | 115.5 | |||||||||
| Interest expense, net |
203.2 | 183.2 | 165.5 | |||||||||
| Income tax (benefit)/expense |
24.1 | 16.5 | 23.7 | |||||||||
| Noncontrolling interest |
0.1 | (1.2 | ) | (3.9 | ) | |||||||
|
|
|
|
|
|
|
|||||||
| EBITDA from continuing operations |
$ | 331.6 | $ | 330.3 | $ | 271.7 | ||||||
|
|
|
|
|
|
|
|||||||
F-43
Table of Contents
The following table includes total assets for each segment, as well as reconciling items necessary to total the amounts reported in the Consolidated Financial Statements:
| (Dollars in millions) |
June 30, 2013 |
June 30, 2012 |
||||||
| Assets |
||||||||
| Oral Technologies |
$ | 2,464.4 | $ | 2,589.6 | ||||
| Medication Delivery Solutions |
286.2 | 251.7 | ||||||
| Development and Clinical Services |
645.9 | 671.5 | ||||||
| Corporate and eliminations |
(339.7 | ) | (373.8 | ) | ||||
|
|
|
|
|
|||||
| Total assets |
$ | 3,056.8 | $ | 3,139.0 | ||||
|
|
|
|
|
|||||
The following tables include depreciation and amortization expense and capital expenditures for the fiscal years ended June 30, 2013, June 30, 2012 and June 30, 2011 for each segment, as well as reconciling items necessary to total the amounts reported in the Consolidated Financial statements:
Depreciation and Amortization Expense
| (Dollars in millions) |
Fiscal Year Ended June 30, |
|||||||||||
| 2013 | 2012 | 2011 | ||||||||||
| Oral Technologies |
$ | 86.7 | $ | 82.5 | $ | 82.3 | ||||||
| Medication Delivery Solutions |
20.6 | 20.7 | 18.8 | |||||||||
| Development and Clinical Services |
33.2 | 17.1 | 6.9 | |||||||||
| Corporate |
11.7 | 9.4 | 7.5 | |||||||||
|
|
|
|
|
|
|
|||||||
| Total depreciation and amortization expense |
$ | 152.2 | $ | 129.7 | $ | 115.5 | ||||||
|
|
|
|
|
|
|
|||||||
Capital Expenditures
| (Dollars in millions) |
Fiscal Year Ended June 30, |
|||||||||||
| 2013 | 2012 | 2011 | ||||||||||
| Oral Technologies |
$ | 47.7 | $ | 57.1 | $ | 43.4 | ||||||
| Medication Delivery Solutions |
47.7 | 22.0 | 24.2 | |||||||||
| Development and Clinical Services |
21.3 | 16.9 | 12.6 | |||||||||
| Corporate |
5.8 | 8.2 | 7.1 | |||||||||
|
|
|
|
|
|
|
|||||||
| Total capital expenditure |
$ | 122.5 | $ | 104.2 | $ | 87.3 | ||||||
|
|
|
|
|
|
|
|||||||
The following table presents revenue and long-lived assets by geographic area:
| Net Revenue Fiscal Year Ended June 30, |
Long-Lived Assets(1) |
|||||||||||||||||||
| (Dollars in millions) |
2013 | 2012 | 2011 | June 30, 2013 |
June 30, 2012 |
|||||||||||||||
| United States |
$ | 695.8 | $ | 591.9 | $ | 497.6 | $ | 375.7 | $ | 353.6 | ||||||||||
| Europe |
863.2 | 868.9 | 842.2 | 344.2 | 348.9 | |||||||||||||||
| International Other |
270.1 | 288.0 | 210.2 | 94.6 | 107.2 | |||||||||||||||
| Eliminations |
(28.8 | ) | (54.0 | ) | (18.2 | ) | — | — | ||||||||||||
|
|
|
|
|
|
|
|
|
|
|
|||||||||||
| Total |
$ | 1,800.3 | $ | 1,694.8 | $ | 1,531.8 | $ | 814.5 | $ | 809.7 | ||||||||||
|
|
|
|
|
|
|
|
|
|
|
|||||||||||
| (1) | Long-lived assets consists of property and equipment, net of accumulated depreciation. |
F-44
Table of Contents
16. EQUITY-BASED COMPENSATION
Company Plan
The Company’s stock-based compensation is comprised of stock options and restricted stock units. Awards issued under the 2007 PTS Holdings Corp. Stock Incentive Plan (the “2007 Plan”) are generally issued for the purpose of retaining key employees and directors. The Company has adopted two forms of non-qualified stock option agreements (the “Form Option Agreements”) for awards under the 2007 Plan. Under our Form Option Agreement, adopted in 2009, a portion of the stock option awards vest over a five-year period of time contingent solely upon the participant’s continued employment with the Company, another portion of the stock option awards will vest over a specified performance period upon achievement of pre-determined operating performance targets over time and the remaining portion of the stock option awards will vest upon realization of certain internal rates of return or multiple of investment goals. Under our other Form Option Agreement, adopted in 2013, a portion of the stock option awards will vest over a specified performance period upon achievement of pre-determined operating performance targets over time while the other portion of the stock option awards will vest upon realization of a specified multiple of investment goal. The Form Option Agreements include certain forfeiture provisions upon a participant’s separation from service with the Company. A maximum of 104,114 shares of our common stock may be issued pursuant to awards under the 2007 Plan. As of June 30, 2013, approximately 4,000 authorized shares are available for future awards under the 2007 Plan.
Stock Compensation Expense
Stock compensation expense recognized in the consolidated statements of income was $2.8 million, $3.7 million and $3.9 million in fiscal years 2013, 2012 and 2011, respectively. All stock compensation expense is classified in selling, general and administrative expenses along with the wages and benefits of the option participants. Stock compensation expense is based on awards expected to vest, and therefore has been adjusted for an estimate of option forfeitures. Forfeitures are required to be estimated at the time of grant and revised in subsequent periods, if necessary, if actual forfeitures differ from those estimates. As of June 30, 2013, $10.3 million of unrecognized compensation expense is expected to be recognized as expense over a weighted-average period of approximately 2.25 years.
Methodology and Assumptions
Stock options are granted with an exercise price equal to the fair market value on the date of grant. In the 2007 Plan, stock options granted generally vest in equal annual installments over a five year period from the grant date. Stock options granted typically have a contractual term of 10 years. The grant-date fair value, adjusted for estimated forfeitures, is recognized as expense on a ratable basis over the substantive vesting period. The fair value of stock options is determined using the Black-Scholes-Merton option pricing model for service and performance based awards, and an adaptation of the Black-Scholes-Merton option valuation model, which takes into consideration the internal rate of return thresholds, for market based awards. This model adaptation is essentially equivalent to the use of path dependent-lattice model.
The weighted average of assumptions used in estimating the fair value of stock options granted during each year were as follows.
| Year Ended June 30, | ||||||
| 2013 | 2012 | 2011 | ||||
| Expected volatility |
30% -31% | 29% - 30% | 29% - 30% | |||
| Expected life (in years) |
5.8 - 6.5 | 6.5 - 7.5 | 6.5 - 7.5 | |||
| Risk-free interest rates |
0.3% - 1.9% | 1.3% - 1.6% | 2.7% - 3.2% | |||
| Dividend yield |
None | None | None | |||
Because we are currently a privately held company, the Company’s expected volatility assumption is based on the historical volatility of closing share price of a comparable peer group. We selected peer companies from
F-45
Table of Contents
the pharmaceutical industry with similar characteristics to us, including market capitalization, number of employees and product focus. In addition, since the Company does not have a pattern of exercise behavior of option holders, we used the simplified method to determine the expected life of each option, which is the mid-point between the vesting date and the end of the contractual term. The risk-free interest rate for the expected life of the option is based on the comparable U.S. Treasury yield curve in effect at the time of grant. The weighted-average grant-date fair value of stock options granted in fiscal 2013, 2012, and 2011 was $296 per share, $272 per share and $241 per share, respectively.
The following table summarizes stock option activity and shares outstanding for the years ended June 30, 2013.
| Time | Performance | Market | ||||||||||||||||||||||||||||||||||||||
| Weighted Average Exercise Price |
Number of shares |
WA Contractual Term |
Aggregate Intrinsic Value |
Number of shares |
WA Contractual Term |
Aggregate Intrinsic Value |
Number of shares |
WA Contractual Term |
Aggregate Intrinsic Value |
|||||||||||||||||||||||||||||||
| Outstanding as of |
$ | 827 | 38,577 | 7.6 | $ | 18,420,550 | 11,614 | 7.8 | $ | 5,664,200 | 23,203 | 7.8 | $ | 11,088,790 | ||||||||||||||||||||||||||
| Granted |
$ | 1,309 | 2,400 | 10.0 | $ | — | 12,152 | 10.0 | $ | — | 12,955 | 10.00 | — | |||||||||||||||||||||||||||
| Exercised |
$ | 850 | (75 | ) | — | $ | — | — | — | $ | — | — | — | — | ||||||||||||||||||||||||||
| Forfeited |
$ | 860 | (770 | ) | — | $ | — | (444 | ) | — | $ | — | (1,506 | ) | — | — | ||||||||||||||||||||||||
| Expired/Cancelled |
$ | 879 | (938 | ) | — | $ | — | (208 | ) | — | $ | — | — | — | — | |||||||||||||||||||||||||
| Outstanding as of June 30, 2013 |
$ | 963 | 39,194 | 6.79 | $ | 17,708,630 | 23,114 | 8.47 | $ | 5,365,770 | 34,652 | 7.98 | $ | 10,616,630 | ||||||||||||||||||||||||||
| Expected to vest as of June 30, 2013 |
$ | 953 | 36,813 | 6.71 | $ | 17,026,259 | 20,945 | 8.37 | $ | 5,196,255 | 31,337 | 7.98 | $ | 9,565,452 | ||||||||||||||||||||||||||
| Vested and Exercisable as of June 30, 2013 |
$ | 796 | 20,554 | 6.22 | $ | 10,494,820 | 5,804 | 6.58 | $ | 3,066,168 | — | 0.0 | $ | — | ||||||||||||||||||||||||||
Since inception of the 2007 Plan, participants have exercised the option to purchase 75 shares in fiscal year 2013 resulting in an inconsequential impact on the Company’s cash balance and income tax accounts. The intrinsic value of the options exercised in fiscal 2013 was $35 thousand.
Restricted Stock Units
The Company may grant restricted stock units (“RSUs”) to employees for recognition and retention purposes. RSUs generally vest over a three or five-year period. The grant-date fair value, adjusted for estimated forfeitures, is recognized as expense ratably on a graded vesting schedule over the vesting period. The fair value of RSUs is determined based on the number of shares granted and the fair value of the Company’s common stock on the date of grant.
The following table summarizes non-vested RSU activity for the year ended June 30, 2013.
| RSUs | Weighted Average Grant- Date Fair Value |
|||||||
| Non-vested as of June 30, 2012 |
1,900 | $ | 826 | |||||
| Granted |
— | $ | — | |||||
| Vested |
(767 | ) | $ | 813 | ||||
| Forfeited |
— | $ | — | |||||
| Non-vested as of June 30, 2013 |
1,133 | $ | 835 | |||||
As of June 30, 2013, $0.2 million of unrecognized compensation cost related to RSUs is expected to be recognized as expense over a weighted-average period of approximately 1.0 year. The weighted-average grant-date fair value of RSUs granted in fiscal 2012 was $1,040. There were no RSU grants in fiscal year 2013 of 2011. The fair value of RSUs vested in fiscal 2013, 2012 and 2011 was $0.6 million, $0.5 million and $0.5 million, respectively.
F-46
Table of Contents
17. SUPPLEMENTAL BALANCE SHEET INFORMATION
Supplementary balance sheet information at June 30, 2013 and June 30, 2012, is detailed in the following tables.
Inventories
Work-in-process and finished goods inventories include raw materials, labor and overhead. Total inventories consisted of the following:
| (Dollars in millions) |
June 30, 2013 |
June 30, 2012 |
||||||
| Raw materials and supplies |
$ | 70.6 | $ | 69.8 | ||||
| Work-in-process |
26.1 | 25.1 | ||||||
| Finished goods |
40.0 | 32.3 | ||||||
|
|
|
|
|
|||||
| Total inventory, gross |
136.7 | 127.2 | ||||||
| Inventory reserve |
(11.8 | ) | (8.5 | ) | ||||
|
|
|
|
|
|||||
| Inventories |
$ | 124.9 | $ | 118.7 | ||||
|
|
|
|
|
|||||
Prepaid expenses and other
Prepaid expenses and other current assets consist of the following:
| (Dollars in millions) |
June 30, 2013 |
June 30, 2012 |
||||||
| Prepaid expenses |
$ | 16.2 | $ | 24.2 | ||||
| Spare parts supplies |
11.8 | 11.7 | ||||||
| Deferred taxes |
16.3 | 18.6 | ||||||
| Other current assets |
44.3 | 54.2 | ||||||
|
|
|
|
|
|||||
| Prepaid expenses and other |
$ | 88.6 | $ | 108.7 | ||||
|
|
|
|
|
|||||
Property, plant, and equipment, net
Property, plant, and equipment, net consists of the following:
| (Dollars in millions) |
June 30, 2013 |
June 30, 2012 |
||||||
| Land, buildings and improvements |
$ | 552.7 | $ | 527.3 | ||||
| Machinery, equipment and capitalized software |
641.6 | 586.2 | ||||||
| Furniture and fixtures |
9.0 | 8.5 | ||||||
| Construction in progress |
61.6 | 54.2 | ||||||
|
|
|
|
|
|||||
| Property and equipment, at cost |
1,264.9 | 1,176.2 | ||||||
| Accumulated depreciation |
(450.4 | ) | (366.5 | ) | ||||
|
|
|
|
|
|||||
| Property, plant, and equipment, net |
$ | 814.5 | $ | 809.7 | ||||
|
|
|
|
|
|||||
Other assets
Other assets consist of the following:
| (Dollars in millions) |
June 30, 2013 |
June 30, 2012 |
||||||
| Deferred long term debt financing costs |
$ | 18.2 | $ | 22.6 | ||||
| Other |
18.4 | 19.2 | ||||||
|
|
|
|
|
|||||
| Total other assets |
$ | 36.6 | $ | 41.8 | ||||
|
|
|
|
|
|||||
F-47
Table of Contents
Other accrued liabilities
Other accrued liabilities consist of the following:
| (Dollars in millions) |
June 30, 2013 |
June 30, 2012 |
||||||
| Accrued employee-related expenses |
$ | 81.1 | $ | 86.8 | ||||
| Restructuring accrual |
6.0 | 9.8 | ||||||
| Deferred income tax |
0.9 | 1.6 | ||||||
| Accrued interest |
12.5 | 18.3 | ||||||
| Interest rate swaps |
— | 23.2 | ||||||
| Deferred revenue and fees |
36.3 | 25.4 | ||||||
| Accrued income tax |
30.7 | 31.4 | ||||||
| Other accrued liabilities and expenses |
57.0 | 65.4 | ||||||
|
|
|
|
|
|||||
| Other accrued liabilities |
$ | 224.5 | $ | 261.9 | ||||
|
|
|
|
|
|||||
Allowance for doubtful accounts
Trade receivables allowance for doubtful accounts activity as follows:
| (Dollars in millions) |
June 30, 2013 |
June 30, 2012 |
June 30, 2011 |
|||||||||
| Trade receivables allowance for doubtful accounts |
||||||||||||
| Beginning balance |
$ | 4.2 | $ | 4.3 | $ | 2.8 | ||||||
| Charged to cost and expenses |
2.1 | 0.5 | 1.4 | |||||||||
| Deductions and other |
(0.6 | ) | (0.3 | ) | (0.1 | ) | ||||||
| Impact of foreign exchange |
— | (0.3 | ) | 0.2 | ||||||||
|
|
|
|
|
|
|
|||||||
| Closing balance |
$ | 5.7 | $ | 4.2 | $ | 4.3 | ||||||
|
|
|
|
|
|
|
|||||||
Inventory reserve
Inventory reserve activity as follows:
| (Dollars in millions) |
June 30, 2013 |
June 30, 2012 |
June 30, 2011 |
|||||||||
| Inventory reserve |
||||||||||||
| Beginning balance |
$ | 8.5 | $ | 9.8 | $ | 14.6 | ||||||
| Charged to cost and expenses |
8.7 | 9.1 | 8.9 | |||||||||
| Deductions |
(5.9 | ) | (9.6 | ) | (15.2 | ) | ||||||
| Impact of foreign exchange |
0.5 | (0.8 | ) | 1.5 | ||||||||
|
|
|
|
|
|
|
|||||||
| Closing balance |
$ | 11.8 | $ | 8.5 | $ | 9.8 | ||||||
|
|
|
|
|
|
|
|||||||
18. DISCONTINUED OPERATIONS
In the fourth fiscal quarter of 2012, the Company sold its U.S. based commercial packaging operations and concluded the elimination of cash flows qualified the component as a discontinued operation. No material gain or loss was recognized on the sale. In addition, during fiscal year 2011, the Company concluded that its printed components facilities qualified as a component entity, the operations of which were then classified as held for sale and discontinued. In conjunction with the exit of these operations the Company incurred expenses related to long term pension obligations in the current and prior year periods.
F-48
Table of Contents
The domestic commercial packaging and printed component entities were previously reported in the Company’s Packaging Services segment.
Summarized Consolidated Statements of Operations data for discontinued operations are as follows:
| Fiscal Year Ended June 30, | ||||||||||||
| (Dollars in millions) |
2013 | 2012 | 2011 | |||||||||
| Net revenue |
$ | — | $ | 94.3 | $ | 188.9 | ||||||
| Earnings/(loss) before income taxes |
1.2 | (41.2 | ) | (20.1 | ) | |||||||
| Income tax (benefit)/expense |
— | 0.1 | 0.9 | |||||||||
| Net earnings/(loss) from discontinued operations, net of tax |
$ | 1.2 | $ | (41.3 | ) | $ | (21.0 | ) | ||||
19. SUBSEQUENT EVENTS
In October 2013, the Company acquired 100% of the shares of a softgel manufacturing business in Brazil. The acquired business, based in Indaiatuba, provides for increased capacity in the Company’s softgel encapsulated Vitamin, Mineral and Supplement (VMS) products, prescription and Over-the-Counter (OTC) segments in the South American market. The purchase price and financial results of the acquired business are not material to the Company’s consolidated financial statements. The acquired business will be included in the Oral Technologies reportable segment.
In the preparation of its consolidated financial statements, the Company completed an evaluation of the impact of any subsequent events and determined there were no other subsequent events requiring disclosure in or adjustment to these financial statements.
F-49
Table of Contents
CATALENT, INC. AND SUBSIDIARIES
CONSOLIDATED STATEMENTS OF OPERATIONS
(Unaudited; Dollars in millions, except per share data)
| Nine Months Ended March 31, |
||||||||
| 2014 | 2013 | |||||||
| Net revenue |
$ | 1,308.1 | $ | 1,295.1 | ||||
| Cost of sales |
899.8 | 900.2 | ||||||
|
|
|
|
|
|||||
| Gross margin |
408.3 | 394.9 | ||||||
| Selling, general and administrative expenses |
256.2 | 251.7 | ||||||
| Impairment charges and (gain)/loss on sale of assets |
0.4 | 4.6 | ||||||
| Restructuring and other |
11.9 | 12.7 | ||||||
|
|
|
|
|
|||||
| Operating earnings/(loss) |
139.8 | 125.9 | ||||||
| Interest expense, net |
122.8 | 160.7 | ||||||
| Other (income)/expense, net |
2.8 | 20.3 | ||||||
|
|
|
|
|
|||||
| Earnings/(loss) from continuing operations, before income taxes |
14.2 | (55.1 | ) | |||||
| Income tax expense/(benefit) |
23.3 | 5.9 | ||||||
|
|
|
|
|
|||||
| Earnings/(loss) from continuing operations |
(9.1 | ) | (61.0 | ) | ||||
| Net earnings/(loss) from discontinued operations, net of tax |
(2.7 | ) | (4.9 | ) | ||||
|
|
|
|
|
|||||
| Net earnings/(loss) |
(11.8 | ) | (65.9 | ) | ||||
| Less: Net earnings/(loss) attributable to noncontrolling interest, net of tax |
(0.8 | ) | — | |||||
|
|
|
|
|
|||||
| Net earnings/(loss) attributable to Catalent |
$ | (11.0 | ) | $ | (65.9 | ) | ||
|
|
|
|
|
|||||
| Earnings per share attributable to Catalent: |
||||||||
| Basic |
||||||||
| Continuing operations |
$ | (8.49 | ) | $ | (56.97 | ) | ||
| Net earnings/(loss) |
(11.01 | ) | (61.54 | ) | ||||
| Diluted |
||||||||
| Continuing operations |
(8.49 | ) | (56.97 | ) | ||||
| Net earnings/(loss) |
(11.01 | ) | (61.54 | ) | ||||
The accompanying notes are an integral part of these unaudited consolidated financial statements.
F-50
Table of Contents
CATALENT, INC. AND SUBSIDIARIES
CONSOLIDATED STATEMENTS OF COMPREHENSIVE INCOME/(LOSS)
(Unaudited; Dollars in millions)
| Nine Months Ended March 31, |
||||||||
| 2014 | 2013 | |||||||
| Net earnings/(loss) |
$ | (11.8 | ) | $ | (65.9 | ) | ||
| Other comprehensive income/(loss), net of tax |
||||||||
| Foreign currency translation adjustments |
16.1 | (25.2 | ) | |||||
| Defined benefit pension plan |
0.6 | — | ||||||
| Deferred compensation |
1.4 | 0.8 | ||||||
| Changes in derivatives for the period |
— | 20.7 | ||||||
|
|
|
|
|
|||||
| Other comprehensive income/(loss), net of tax |
18.1 | (3.7 | ) | |||||
| Comprehensive income/(loss) |
6.3 | (69.6 | ) | |||||
| Comprehensive income/(loss) attributable to noncontrolling interest |
(0.8 | ) | — | |||||
|
|
|
|
|
|||||
| Comprehensive income/(loss) attributable to Catalent |
$ | 7.1 | $ | (69.6 | ) | |||
|
|
|
|
|
|||||
The accompanying notes are an integral part of these unaudited consolidated financial statements.
F-51
Table of Contents
CATALENT, INC. AND SUBSIDIARIES
(Unaudited; Dollars in millions, except per share amounts)
| March 31, 2014 |
June 30, 2013 |
|||||||
| ASSETS |
||||||||
| Current assets: |
||||||||
| Cash and cash equivalents |
$ | 55.7 | 106.4 | |||||
| Trade receivables, net |
344.2 | 358.0 | ||||||
| Inventories |
155.0 | 124.9 | ||||||
| Prepaid expenses and other |
72.5 | 88.6 | ||||||
|
|
|
|
|
|||||
| Total current assets |
627.4 | 677.9 | ||||||
| Property, plant, and equipment, net |
837.6 | 814.5 | ||||||
| Other assets: |
||||||||
| Goodwill |
1,088.3 | 1,023.4 | ||||||
| Other intangibles, net |
363.3 | 372.2 | ||||||
| Deferred income taxes |
132.2 | 132.2 | ||||||
| Other |
42.2 | 36.6 | ||||||
|
|
|
|
|
|||||
| Total assets |
$ | 3,091.0 | 3,056.8 | |||||
|
|
|
|
|
|||||
| LIABILITIES, REDEEMABLE NONCONTROLLING INTEREST, AND SHAREHOLDERS’ DEFICIT |
||||||||
| Current liabilities: |
||||||||
| Current portion of long-term obligations and other short-term borrowings |
$ | 27.2 | 35.0 | |||||
| Accounts payable |
130.3 | 150.8 | ||||||
| Other accrued liabilities |
255.8 | 224.5 | ||||||
|
|
|
|
|
|||||
| Total current liabilities |
413.3 | 410.3 | ||||||
| Long-term obligations, less current portion |
2,674.0 | 2,656.6 | ||||||
| Pension liability |
134.5 | 134.1 | ||||||
| Deferred income taxes |
213.1 | 219.1 | ||||||
| Other liabilities |
52.0 | 47.0 | ||||||
| Commitment and contingencies (see Note 13) |
||||||||
| Redeemable noncontrolling interest |
4.5 | — | ||||||
| Shareholders’ deficit: |
||||||||
| Common stock $0.01 par value; 1,200,000 shares authorized as of March 31, 2014 and June 30, 2013; 1,068,591 and 1,068,516 shares issued and outstanding as of March 31, 2014 and June 30, 2013, respectively |
— | — | ||||||
| Additional paid in capital |
1,031.0 | 1,027.4 | ||||||
| Accumulated deficit |
(1,439.8 | ) | (1,428.8 | ) | ||||
| Accumulated other comprehensive income/(loss) |
8.8 | (9.3 | ) | |||||
|
|
|
|
|
|||||
| Total Catalent shareholders’ deficit |
(400.0 | ) | (410.7 | ) | ||||
| Noncontrolling interest |
(0.4 | ) | 0.4 | |||||
|
|
|
|
|
|||||
| Total shareholders’ deficit |
(400.4 | ) | (410.3 | ) | ||||
|
|
|
|
|
|||||
| Total liabilities, redeemable noncontrolling interest and shareholders’ deficit |
$ | 3,091.0 | 3,056.8 | |||||
|
|
|
|
|
|||||
The accompanying notes are an integral part of these unaudited consolidated financial statements.
F-52
Table of Contents
CATALENT, INC. AND SUBSIDIARIES
CONSOLIDATED STATEMENT OF CHANGES IN SHAREHOLDERS’ EQUITY/(DEFICIT)
(Unaudited; Dollars in millions, except share data in thousands)
| Shares of Common Stock |
Common Stock |
Additional Paid in Capital |
Accumulated Deficit |
Accumulated Other Comprehensive (Loss)/Income |
Noncontrolling Interest |
Total Shareholders’ (Deficit)/Equity |
||||||||||||||||||||||
| Balance at June 30, 2013 |
1,068.5 | $ | — | $ | 1,027.4 | $ | (1,428.8 | ) | $ | (9.3 | ) | $ | 0.4 | $ | (410.3 | ) | ||||||||||||
| Equity contribution |
0.1 | 0.2 | (0.4 | ) | (0.2 | ) | ||||||||||||||||||||||
| Equity compensation |
3.4 | 3.4 | ||||||||||||||||||||||||||
| Net earnings/(loss) |
(11.0 | ) | (0.4 | ) | (11.4 | ) | ||||||||||||||||||||||
| Other comprehensive income/(loss) |
18.1 | 18.1 | ||||||||||||||||||||||||||
|
|
|
|
|
|
|
|
|
|
|
|
|
|
|
|||||||||||||||
| Balance at March 31, 2014 |
1,068.6 | $ | — | $ | 1,031.0 | $ | (1,439.8 | ) | $ | 8.8 | $ | (0.4 | ) | $ | (400.4 | ) | ||||||||||||
|
|
|
|
|
|
|
|
|
|
|
|
|
|
|
|||||||||||||||
The accompanying notes are an integral part of these unaudited consolidated financial statements.
F-53
Table of Contents
CATALENT, INC. AND SUBSIDIARIES
CONSOLIDATED STATEMENTS OF CASH FLOWS
(Unaudited; Dollars in millions)
| Nine Months Ended March 31, |
||||||||
| 2014 | 2013 | |||||||
| CASH FLOWS FROM OPERATING ACTIVITIES: |
||||||||
| Net earnings/(loss) |
$ | (11.8 | ) | $ | (65.9 | ) | ||
| Net earnings/(loss) from discontinued operations |
(2.7 | ) | (4.9 | ) | ||||
|
|
|
|
|
|||||
| Earnings/(loss) from continuing operations |
(9.1 | ) | (61.0 | ) | ||||
| Adjustments to reconcile (loss)/earnings from continued operations to net cash from operations: |
||||||||
| Depreciation and amortization |
108.9 | 114.9 | ||||||
| Non-cash foreign currency transaction (gain)/loss, net |
(5.6 | ) | 10.3 | |||||
| Amortization and write off of debt financing costs |
8.6 | 13.0 | ||||||
| Asset impairments and (gain)/loss on sale of assets |
0.4 | 4.6 | ||||||
| Call premium payments and financing fees paid |
— | 7.6 | ||||||
| Equity compensation |
3.4 | 2.2 | ||||||
| Provision/(benefit) for deferred income taxes |
(8.1 | ) | (7.2 | ) | ||||
| Provision for bad debts and inventory |
4.5 | 7.2 | ||||||
| Change in operating assets and liabilities: |
||||||||
| Decrease/(increase) in trade receivables |
21.8 | 20.8 | ||||||
| Decrease/(increase) in inventories |
(27.0 | ) | (28.0 | ) | ||||
| Increase/(decrease) in accounts payable |
(25.3 | ) | 5.0 | |||||
| Other accrued liabilities and operating items, net |
22.7 | (5.0 | ) | |||||
|
|
|
|
|
|||||
| Net cash provided by/(used in) operating activities from continuing operations |
95.2 | 84.4 | ||||||
| Net cash provided by/(used in) operating activities from discontinued operations |
(1.9 | ) | (1.2 | ) | ||||
|
|
|
|
|
|||||
| Net cash provided by/(used in) operating activities |
93.3 | 83.2 | ||||||
|
|
|
|
|
|||||
| CASH FLOWS FROM INVESTING ACTIVITIES: |
||||||||
| Acquisition of property and equipment and other productive assets |
(62.0 | ) | (84.8 | ) | ||||
| Proceeds from sale of property and equipment |
0.8 | 0.3 | ||||||
| Payment for acquisitions, net |
(53.5 | ) | — | |||||
|
|
|
|
|
|||||
| Net cash provided by/(used in) investing activities from continuing operations |
(114.7 | ) | (84.5 | ) | ||||
| Net cash provided by/(used in) investing activities from discontinued operations |
4.0 | — | ||||||
|
|
|
|
|
|||||
| Net cash provided by/(used in) investing activities |
(110.7 | ) | (84.5 | ) | ||||
|
|
|
|
|
|||||
| CASH FLOWS FROM FINANCING ACTIVITIES: |
||||||||
| Net change in short-term borrowings |
(17.2 | ) | (9.5 | ) | ||||
| Proceeds from borrowing, net |
0.7 | 399.3 | ||||||
| Payments related to long-term obligations |
(20.0 | ) | (434.3 | ) | ||||
| Reclassification of call premium payments |
— | (7.6 | ) | |||||
| Equity contribution/(redemption) |
0.2 | 0.7 | ||||||
|
|
|
|
|
|||||
| Net cash (used in)/provided by financing activities from continuing operations |
(36.3 | ) | (51.4 | ) | ||||
| Net cash (used in)/provided by financing activities from discontinued operations |
— | — | ||||||
|
|
|
|
|
|||||
| Net cash (used in)/provided by financing activities |
(36.3 | ) | (51.4 | ) | ||||
|
|
|
|
|
|||||
| Effect of foreign currency on cash |
3.0 | 1.2 | ||||||
| NET INCREASE/(DECREASE) IN CASH AND EQUIVALENTS |
(50.7 | ) | (51.5 | ) | ||||
| CASH AND EQUIVALENTS AT BEGINNING OF PERIOD |
106.4 | 139.0 | ||||||
|
|
|
|
|
|||||
| CASH AND EQUIVALENTS AT END OF PERIOD |
$ | 55.7 | $ | 87.5 | ||||
|
|
|
|
|
|||||
| SUPPLEMENTARY CASH FLOW INFORMATION: |
||||||||
| Interest paid |
$ | 102.6 | $ | 132.4 | ||||
| Income taxes paid, net |
$ | 13.5 | $ | 10.3 | ||||
The accompanying notes are an integral part of these unaudited consolidated financial statements.
F-54
Table of Contents
CATALENT, INC. AND SUBSIDIARIES
NOTES TO UNAUDITED CONSOLIDATED FINANCIAL STATEMENTS
(Unaudited; Dollars in millions except per share amounts)
1. BASIS OF PRESENTATION AND SUMMARY OF SIGNIFICANT ACCOUNTING POLICIES
Business
Catalent, Inc. (“Catalent” or the “Company” or the “Parent”) directly and wholly-owns PTS Intermediate Holdings LLC (“Intermediate Holdings”). Intermediate Holdings directly and wholly-owns Catalent Pharma Solutions, Inc. (“Operating Company”). Parent is 100% owned by Phoenix Charter LLC (“Phoenix”) and certain members of the Company’s senior management. Phoenix is wholly-owned by BHP PTS Holdings L.L.C., an entity controlled by affiliates of The Blackstone Group L.P. (“Blackstone”), a global private investment and advisory firm.
Basis of Presentation
The accompanying unaudited consolidated financial statements have been prepared in accordance with accounting principles generally accepted in the United States (GAAP) for interim financial information and with the instructions to Form 10-Q and Article 10 of Regulation S-X. Accordingly, they do not include all of the information and notes required by GAAP for complete financial statements. In the opinion of management, all adjustments (consisting of normal recurring adjustments) considered necessary for a fair presentation have been included. Operating results for the nine months ended March 31, 2014 are not necessarily indicative of the results that may be expected for the year ending June 30, 2014. The consolidated balance sheet at June 30, 2013 has been derived from the audited consolidated financial statements at that date but does not include all of the information and footnotes required by GAAP for complete financial statements. For further information, refer to the consolidated financial statements and footnotes thereto of the Company.
Noncontrolling interest is included within the equity section in the consolidated balance sheets. Redeemable noncontrolling interest has been classified as temporary equity and is therefore reported outside of permanent equity on the consolidated balance sheets at the greater of the initial carrying amount adjusted for the noncontrolling interest’s share of net earnings/(loss) or its redemption value. The Company presents the amount of consolidated net earnings/(loss) that is attributable to Catalent and the noncontrolling interest in the consolidated statements of operations. Furthermore, the Company discloses the amount of comprehensive income that is attributable to Catalent and the noncontrolling interest in the consolidated statements of comprehensive income/(loss).
Use of Estimates
The preparation of financial statements in conformity with generally accepted accounting principles in the United States requires management to make estimates and assumptions that affect amounts reported in the financial statements and accompanying notes. Such estimates include, but are not limited to, allowance for doubtful accounts, inventory and long-lived asset valuation, goodwill and other intangible asset valuation and impairment, equity-based compensation, income taxes, derivative financial instruments and pension plan asset and liability valuation. Actual amounts may differ from these estimated amounts.
Foreign Currency Translation
The financial statements of the Company’s operations outside the U.S. are generally measured using the local currency as the functional currency. Adjustments to translate the assets and liabilities of these foreign operations into U.S. dollars are accumulated as a component of other comprehensive income/(loss) utilizing period-end exchange rates. The currency fluctuation related to certain long-term inter-company loans deemed to not be repayable in the foreseeable future have been recorded within the cumulative translation adjustment, a
F-55
Table of Contents
component of other comprehensive income/(loss). In addition, the currency fluctuation associated with the portion of the Company’s euro-denominated debt designated as a net investment hedge is included as a component of other comprehensive income/(loss). Foreign currency transaction gains and losses calculated by utilizing weighted average exchange rates for the period are included in the statements of operations in “other (income)/expense, net”. Such foreign currency transaction gains and losses include inter-company loans repayable in the foreseeable future.
Revenue Recognition
In accordance with Accounting Standard Codification (“ASC”) 605 Revenue Recognition, the Company recognizes revenue when persuasive evidence of an arrangement exists, product delivery has occurred or the services have been rendered, the price is fixed or determinable and collectability is reasonably assured. In cases where the Company has multiple contracts with the same customer, the Company evaluates those contracts to assess if the contracts are linked or are separate arrangements. Factors the Company considers include the timing of negotiation, interdependency with other contracts or elements and payment terms. The Company and its customers generally view each contract discussion as a separate arrangement.
Manufacturing and packaging service revenue is recognized upon delivery of the product in accordance with the terms of the contract, which specify when transfer of title and risk of loss occurs. Some of the Company’s manufacturing contracts with its customers have annual minimum purchase requirements. At the end of the contract year, revenue is recognized for the unfilled purchase obligation in accordance with the contract terms. Development service contracts generally take the form of a fee-for-service arrangement. After the Company has evidence of an arrangement, the price is determinable and there is a reasonable expectation regarding payment, the Company recognizes revenue at the point in time the service obligation is completed and accepted by the customer. Examples of output measures include a formulation report, analytical and stability testing, clinical batch production or packaging and the storage and distribution of a customer’s clinical trial material. Development service revenue is primarily driven by the Company’s Development and Clinical Services segment.
Arrangements containing multiple elements, including service arrangements, are accounted for in accordance with the provisions of ASC 605-25, Revenue Recognition: Multiple-Element Arrangements. The Company determines the separate units of account in accordance with ASC 605-25. If the deliverable meets the criteria of a separate unit of accounting, the arrangement consideration is allocated to each element based upon its relative selling price. In determining the best evidence of selling price of a unit of account the Company utilizes vendor-specific objective evidence (“VSOE”), which is the price the Company charges when the deliverable is sold separately. When VSOE is not available, management uses relevant third-party evidence (“TPE”) of selling price, if available. When neither VSOE nor TPE of selling price exists, management uses its best estimate of selling price.
Goodwill
The Company accounts for purchased goodwill and intangible assets with indefinite lives in accordance with ASC 350 Intangibles—Goodwill and Other (ASC 350). Under ASC 350, goodwill and intangible assets with indefinite lives are not amortized, but instead are tested for impairment at least annually. The Company has elected to perform its annual impairment analysis during its fourth fiscal quarter each year or earlier if indicators of impairment are present.
Property and Equipment and Other Definite Lived Intangible Assets
Property and equipment are stated at cost, net of depreciation. Depreciation expense is computed using the straight-line method over the estimated useful lives of the assets, including capital lease assets that are amortized over the shorter of their useful lives or the terms of the respective leases. The Company generally uses the following ranges of useful lives for its property and equipment categories: buildings and improvements—5 to 50
F-56
Table of Contents
years; machinery and equipment—3 to 10 years; and furniture and fixtures—3 to 7 years. Depreciation expense was $77.2 million for the nine months ended March 31, 2014 and $82.6 million for the nine months ended March 31, 2013. The Company charges repairs and maintenance costs to expense as incurred. The amount of capitalized interest was immaterial for all periods presented.
Intangible assets with finite lives, primarily including customer relationships, patents and trademarks, continue to be amortized over their useful lives. The Company generally uses the following range of useful lives for its intangible assets with finite lives categories: product relationships—12 years; customer relationships—12 to 14 years; and core technology—10 to 20 years. The Company evaluates the recoverability of its other long-lived assets, including amortizing intangible assets, if circumstances indicate impairment may have occurred pursuant to ASC 360 Property, Plant and Equipment (ASC 360). This analysis is performed by comparing the respective carrying values of the assets to the current and expected future cash flows, on an un-discounted basis, to be generated from such assets. If such analysis indicates that the carrying value of these assets is not recoverable, the carrying value of such assets is reduced to fair value through a charge to the Consolidated Statements of Operations. Fair value is determined based on assumptions the Company believes marketplace participants would utilize and comparable marketplace information in similar arm’s length transactions.
Research and Development Costs
The Company expenses research and development costs as incurred. Costs incurred in connection with the development of new offerings and manufacturing process improvements are recorded within selling, general and administrative expenses. Such research and development costs included in selling, general and administrative expenses amounted to $12.3 million for nine months ended March 31, 2014 and $10.1 million for the nine months ended March 31, 2013. Costs incurred in connection with research and development services the Company provides to customers and services performed in support of the commercial manufacturing process for customers are recorded within cost of sales. Such research and development costs included in cost of sales amounted to $24.6 million for the nine months ended March 31, 2014 and $26.4 million for the nine months ended March 31, 2013.
Earnings / (loss) per share
The Company reports net earnings (loss) per share in accordance with the standard codification of ASC “Earnings per Share” (“ASC 260”). Under ASC 260, basic earnings per share, which excludes dilution, is computed by dividing net earnings or loss available to common stockholders by the weighted average number of common shares outstanding for the period. Diluted earnings per share reflects the potential dilution of securities that could be exercised or converted into common shares, and is computed by dividing net earnings or loss available to common stockholders by the weighted average of common shares outstanding plus the dilutive potential common shares. Diluted earnings per share includes in-the-money stock options, restricted stock units, and restricted stock using the treasury stock method. During a loss period, the assumed exercise of in-the-money stock options has an anti-dilutive effect and therefore, these instruments are excluded from the computation of dilutive earnings per share.
Equity-Based Compensation
The Company accounts for its equity-based compensation awards in accordance with Accounting Standard Codification ASC 718 Compensation—Stock Compensation (“ASC 718”). ASC 718 requires companies to recognize compensation expense using a fair value based method for costs related to share-based payments including stock options and restricted stock units. The expense is measured based on the grant date fair value of the awards that are expected to vest, and the expense is recorded over the applicable requisite service period. In the absence of an observable market price for a share-based award, the fair value is based upon a valuation methodology that takes into consideration various factors, including the exercise price of the award, the expected term of the award, the current price of the underlying shares, the expected volatility of the underlying share price based on peer companies, the expected dividends on the underlying shares and the risk-free interest rate.
F-57
Table of Contents
Recent Financial Accounting Standards
In February 2013, the FASB issued Accounting Standards Update No. 2013-02, “Reporting of Amounts Reclassified out of Accumulated Other Comprehensive Income” (“ASU 2013-02”). ASU 2013-02 requires enhanced disclosures about items reclassified out of accumulated other comprehensive income (“AOCI”). For items reclassified to net income in their entirety, the ASU requires information about the effect of significant reclassification items to appear on separate line items of net income. For those items where direct reclassification to net income is not required, companies must provide cross-references to other disclosures that provide details about the effects of the reclassification out of AOCI. Expanded disclosures concerning current period changes in AOCI balances are also required for each component of OCI on the face of the financial statements or in the notes. During the first quarter of fiscal 2014, the Company adopted ASU 2013-02 and has presented the required disclosures in the “Accumulated Other Comprehensive Income/(Loss)” footnote within the notes to the financial statements.
In April 2014, the FASB issued Accounting Standards Update No. 2014-08, “Reporting Discontinued Operations and Disclosures of Disposals of an Entity” (“ASU 2014-08”). ASU 2014-08 changes the requirements for reporting discontinued operations under Accounting Standards Codification Subtopic 250-20 (“Subtopic 205-20”) by limiting discontinued operations reporting to disposals of components of an entity that represent strategic shifts that have (or will have) a major effect on an entity’s operations and financial results. The disclosure requirements for discontinued operations under ASU 2014-08 will be expanded in order to provide users of financial statements with more information about the assets, liabilities, revenues and expenses of discontinued operations. ASU 2014-08 is effective on a prospective basis for (1) all disposals (or classifications as held for sale) of components of an entity that occur within annual periods beginning on or after December 15, 2014, and interim periods within those years, and (2) all businesses that are classified as held for sale on acquisition that occur within annual periods beginning on or after December 15, 2014 and interim periods within those years. Catalent is currently evaluating the impact of this standard on the Company’s consolidated results of operations and financial position.
2. GOODWILL
The following table summarizes the changes between June 30, 2013 and March 31, 2014 in the carrying amount of goodwill in total and by reporting segment:
| (Dollars in millions) |
Oral Technologies |
Medication Delivery Solutions |
Development & Clinical Services |
Total | ||||||||||||
| Balance at June 30, 2013(1) |
$ | 833.2 | $ | — | $ | 190.2 | $ | 1,023.4 | ||||||||
| Additions/(impairments)(2) |
34.1 | — | — | 34.1 | ||||||||||||
| Foreign currency translation adjustments |
19.7 | — | 11.1 | 30.8 | ||||||||||||
|
|
|
|
|
|
|
|
|
|||||||||
| Balance at March 31, 2014 |
$ | 887.0 | $ | — | $ | 201.3 | $ | 1,088.3 | ||||||||
|
|
|
|
|
|
|
|
|
|||||||||
| (1) | The opening balance is reflective of historical impairment charges related to the Medication Delivery Solutions segment of approximately $158.0 million. |
| (2) | Acquired goodwill of $34.1 million in the Company’s Oral Technologies segment was generated from acquisitions in Brazil and China during the nine months ended March 31, 2014. |
No goodwill impairment charges were required during the current or comparable prior year period. When required, impairment charges are recorded within the Consolidated Statement of Operations as Impairment charges and (gain)/loss on sale of assets.
3. DEFINITE LIVED LONG-LIVED ASSETS
The Company’s definite lived long-lived assets include property, plant and equipment as well as other intangible assets with definite lives.
F-58
Table of Contents
The details of other intangible assets subject to amortization as of March 31, 2014 and June 30, 2013, are as follows:
| (Dollars in millions) |
Gross Carrying Value |
Accumulated Amortization |
Net Carrying Value |
|||||||||
| March 31, 2014 |
||||||||||||
| Amortized intangibles: |
||||||||||||
| Core technology |
$ | 149.5 | $ | (51.2 | ) | $ | 98.3 | |||||
| Customer relationships |
230.0 | (63.2 | ) | 166.8 | ||||||||
| Product relationships |
235.8 | (137.6 | ) | 98.2 | ||||||||
|
|
|
|
|
|
|
|||||||
| Total intangible assets |
$ | 615.3 | $ | (252.0 | ) | $ | 363.3 | |||||
|
|
|
|
|
|
|
|||||||
| (Dollars in millions) |
Gross Carrying Value |
Accumulated Amortization |
Net Carrying Value |
|||||||||
| June 30, 2013 |
||||||||||||
| Amortized intangibles: |
||||||||||||
| Core technology |
$ | 143.7 | $ | (44.4 | ) | $ | 99.3 | |||||
| Customer relationships |
214.3 | (50.1 | ) | 164.2 | ||||||||
| Product relationships |
227.1 | (118.4 | ) | 108.7 | ||||||||
|
|
|
|
|
|
|
|||||||
| Total intangible assets |
$ | 585.1 | $ | (212.9 | ) | $ | 372.2 | |||||
|
|
|
|
|
|
|
|||||||
Amortization expense was $31.7 million for the nine months ended March 31, 2014 and $32.3 million for the nine months ended March 31, 2013.
Amortization expense in future periods is estimated to be:
| (Dollars in millions) |
Remainder Fiscal 2014 |
2015 | 2016 | 2017 | 2018 | 2019 | ||||||||||||||||||
| Amortization expense |
$ | 10.5 | $ | 41.7 | $ | 41.7 | $ | 41.1 | $ | 41.1 | $ | 27.6 | ||||||||||||
4. DERIVATIVE INSTRUMENTS AND HEDGING ACTIVITIES
Risk Management Objective of Using Derivatives
The Company is exposed to fluctuations in the EUR-USD exchange rate on its investments in foreign operations in Europe. While the Company does not actively hedge against changes in foreign currency, the Company has mitigated the exposure of its investments in its European operations by denominating a portion of its debt in euros. At March 31, 2014, the Company had euro denominated debt outstanding of $576.0 million that qualifies as a hedge of a net investment in foreign operations. For non-derivatives designated and qualifying as net investment hedges, the effective portion of the translation gains or losses are reported in accumulated other comprehensive income/(loss) as part of the cumulative translation adjustment. For the nine months ended March 31, 2014, the Company recorded an unrealized foreign exchange loss of $18.1 million within cumulative translation adjustment. For the nine months ended March 31, 2013, the Company recorded an unrealized foreign exchange loss of $13.2 million within cumulative translation adjustment. The net accumulated gain of this net investment as of March 31, 2014 included within other comprehensive income/(loss) was approximately $45.0 million. For the nine months ended March 31, 2014, the Company recognized an unrealized foreign exchange loss of $11.6 million in the consolidated statement of operations related to a portion of its euro-denominated debt not designated as a net investment hedge. For the nine months ended March 31, 2013, the Company recognized an unrealized foreign exchange loss of $5.4 million.
F-59
Table of Contents
Amounts are reclassified out of accumulated other comprehensive income/(loss) into earnings when the hedged net investment is either sold or substantially liquidated.
Cash Flow Hedges of Interest Rate Risk
The Company’s objectives in using interest rate derivatives historically were to add stability to interest expense and to manage its exposure to interest rate movements. To accomplish this objective, the Company primarily used interest rate swaps as part of its interest rate risk management strategy. Interest rate swaps designated as cash flow hedges involve the receipt of variable-rate amounts from a counterparty in exchange for the Company making fixed-rate payments over the life of the agreements without exchange of the underlying notional amount. As of March 31, 2014, the Company did not have any interest rate swap agreements in place.
5. FAIR VALUE MEASUREMENTS OF FINANCIAL INSTRUMENTS
ASC 820 Fair Value Measurements and Disclosures (“ASC 820”), which defines fair value, establishes a framework for measuring fair value, and expands disclosures about fair value measurements. ASC 820 defines fair value as the exit price that would be received to sell an asset or paid to transfer a liability. Fair value is a market-based measurement that should be determined using assumptions that market participants would use in pricing an asset or liability. Valuation techniques used to measure fair value should maximize the use of observable inputs and minimize the use of unobservable inputs. To measure fair value, the Company uses the following fair value hierarchy based on three levels of inputs, of which the first two are considered observable and the last unobservable:
Level 1—Quoted prices in active markets for identical assets or liabilities.
Level 2—Inputs other than Level 1 that are observable for the asset or liability, either directly or indirectly, such as quoted prices for similar assets and liabilities in active markets; quoted prices for identical or similar assets or liabilities in markets that are not active; or other inputs that are observable or can be corroborated by observable market data by correlation or other means.
Level 3—Unobservable inputs that are supported by little or no market activity and that are significant to the fair value of the assets or liabilities. Value is determined using pricing models, discounted cash flow methodologies, or similar techniques and also includes instruments for which the determination of fair value requires significant judgment or estimation.
Fair value under ASC 820 is principally applied to financial assets and liabilities which, for Catalent, primarily include investments in money market funds. The Company is not required to apply all the provisions of ASC 820 in financial statements to the nonfinancial assets and nonfinancial liabilities. There were no changes from the previously reported classification of financial assets and liabilities.
The following table provides a summary of financial assets and liabilities that are measured at fair value on a recurring basis as of March 31, 2014, aggregated by the level in the fair value hierarchy within which those measurements fall:
| Fair Value Measurements using: | ||||||||||||||||
| (Dollars in millions) |
Total | Level 1 | Level 2 | Level 3 | ||||||||||||
| Assets |
||||||||||||||||
| Cash equivalents—money market funds |
$ | 0.9 | $ | 0.9 | $ | — | $ | — | ||||||||
The following table provides a summary of financial assets and liabilities that are measured at fair value on a recurring basis as of June 30, 2013, aggregated by the level in the fair value hierarchy in which those measurements fall:
| Fair Value Measurements using: | ||||||||||||||||
| (Dollars in millions) |
Total | Level 1 | Level 2 | Level 3 | ||||||||||||
| Assets |
||||||||||||||||
| Cash equivalents—money market funds |
$ | 5.8 | $ | 5.8 | $ | — | $ | — | ||||||||
F-60
Table of Contents
Cash Equivalents
The fair value of cash equivalents is estimated on the quoted market price of the investments. The carrying amounts of the Company’s cash equivalents approximate their fair value due to the short-term maturity of these instruments.
Long-Term Obligations
The estimated fair value of long-term debt, which is considered a Level 2 liability, is based on the quoted market prices for the same or similar issues or on the current rates offered for debt of the same remaining maturities and considers collateral, if any.
The carrying amounts and the estimated fair values of financial instruments as of March 31, 2014 and June 30, 2013, are as follows:
| March 31, 2014 | June 30, 2013 | |||||||||||||||
| (Dollars in millions) |
Carrying Value |
Estimated Fair Value |
Carrying Value |
Estimated Fair Value |
||||||||||||
| Long-term debt and other |
$ | 2,701.2 | $ | 2,709.0 | $ | 2,691.6 | $ | 2,633.2 | ||||||||
6. EARNINGS PER SHARE
The reconciliations between basic and diluted earnings per share attributable to Catalent common shareholders for the nine months ended March 31, 2014 and 2013 are as follows (in millions, except per share data):
| Nine Months Ended March 31, |
||||||||
| 2014 | 2013 | |||||||
| Earnings (loss) from continuing operations less net income (loss) attributable to noncontrolling interest |
$ | (9.1 | ) | $ | (61.0 | ) | ||
| Earnings (loss) from discontinued operations |
(2.7 | ) | (4.9 | ) | ||||
|
|
|
|
|
|||||
| Net earnings (loss) attributable to Catalent |
$ | (11.8 | ) | $ | (65.9 | ) | ||
| Weighted average shares outstanding |
1,071,936 | 1,070,811 | ||||||
| Dilutive securities issuable—stock plans |
— | — | ||||||
|
|
|
|
|
|||||
| Total weighted average diluted shares outstanding |
1,071,936 | 1,070,811 | ||||||
| Basic earnings per share of common stock: |
||||||||
| Earnings (loss) from continuing operations |
$ | (8.49 | ) | $ | (56.97 | ) | ||
| Earnings (loss) from discontinued operations |
(2.52 | ) | (4.57 | ) | ||||
|
|
|
|
|
|||||
| Net earnings (loss) attributable to Catalent |
$ | (11.01 | ) | $ | (61.54 | ) | ||
| Diluted earnings per share of common stock—assuming dilution: |
||||||||
| Earnings (loss) from continuing operations |
$ | (8.49 | ) | $ | (56.97 | ) | ||
| Earnings (loss) from discontinuing operations |
(2.52 | ) | (4.57 | ) | ||||
|
|
|
|
|
|||||
| Net earnings (loss) attributable to Catalent |
$ | (11.01 | ) | $ | (61.54 | ) | ||
The computation of diluted earnings per share for the nine months ended March 31, 2014 and 2013 excludes the effect of the potential common shares issuable under the employee stock option plan of approximately 91 thousand shares and 70 thousand shares, respectively, and excludes restricted share awards of 4 thousand in each period because the Company had a net loss for each period presented and the effect would therefore be anti-dilutive.
F-61
Table of Contents
7. LONG-TERM OBLIGATIONS AND OTHER SHORT-TERM BORROWINGS
Long-term obligations and other short-term borrowings consist of the following at March 31, 2014 and June 30, 2013:
| (Dollars in millions) |
Maturity | March 31, 2014 |
June 30, 2013 |
|||||||||
| Senior Secured Credit Facilities |
||||||||||||
| Term loan facility dollar-denominated |
September 2016 | $ | 786.2 | $ | 791.3 | |||||||
| Term loan facility dollar-denominated |
September 2017 | 643.1 | 646.3 | |||||||||
| Term loan facility euro-denominated |
September 2016 | 278.9 | 266.6 | |||||||||
| 9 3⁄4% Senior Subordinated euro-denominated Notes |
April 2017 | 297.1 | 281.9 | |||||||||
| 7 7⁄8% Senior Notes |
October 2018 | 348.6 | 348.2 | |||||||||
| Senior Unsecured Term Loan Facility |
December 2017 | 274.3 | 274.1 | |||||||||
| $200.3 million Revolving Credit Facility |
April 2016 | — | — | |||||||||
| Other obligations |
2014 to 2032 | 73.0 | 83.2 | |||||||||
|
|
|
|
|
|||||||||
| Total |
2,701.2 | 2,691.6 | ||||||||||
| Less: Current portion of long-term obligations and other short-term borrowings |
27.2 | 35.0 | ||||||||||
|
|
|
|
|
|||||||||
| Long-term obligations, less current portion short-term borrowings |
$ | 2,674.0 | $ | 2,656.6 | ||||||||
|
|
|
|
|
|||||||||
Debt Covenants
The Credit Agreement, the senior unsecured term loan facility and the indentures governing the notes contain a number of covenants that, among other things, restrict, subject to certain exceptions, the Operating Company’s (and the Operating Company’s restricted subsidiaries’) ability to incur additional indebtedness or issue certain preferred shares; create liens on assets; engage in mergers and consolidations; sell assets; pay dividends and distributions or repurchase capital stock; repay subordinated indebtedness; engage in certain transactions with affiliates; make investments, loans or advances; make certain acquisitions; and in the case of the Operating Company’s Credit Agreement, enter into sale and leaseback transactions, amend material agreements governing the Operating Company’s subordinated indebtedness (including the senior subordinated notes) and change the Operating Company’s lines of business.
As of March 31, 2014, the Company was in compliance with all covenants related to its long-term obligations. The Company’s long-term debt obligations do not contain any financial maintenance covenants.
8. INCOME TAXES
The Company accounts for income taxes in accordance with the provision of ASC 740 Income Taxes. Generally, fluctuations in the effective tax rate are primarily due to changes in the U.S. and non-U.S. pretax income resulting from the Company’s business mix and changes in the tax impact of special items and other discrete tax items, which may have unique tax implications depending on the nature of the item. Such discrete items include, but are not limited to, changes in foreign statutory tax rates, the amortization of certain assets and the tax impact of changes in its ASC 740 unrecognized tax benefit reserves. In the normal course of business, the Company is subject to examination by taxing authorities throughout the world, including such major jurisdictions as the United States, Germany, France, and the United Kingdom. The Company is no longer subject to non-U.S. income tax examinations for years prior to 2005. Under the terms of the purchase agreement related to the 2007 acquisition, the Company is indemnified by its former owner for tax liabilities that may arise in the future that relate to tax periods prior to April 10, 2007. The indemnification agreement includes, among other taxes, any and all federal, state and international income based taxes as well as interest and penalties that may be related thereto. As of March 31, 2014 and June 30, 2013, approximately $2.9 million and $6.6 million of unrecognized tax benefit is subject to indemnification by its former owner, respectively.
F-62
Table of Contents
ASC 740 includes guidance on the accounting for uncertainty in income taxes recognized in the financial statements. This standard also provides that a tax benefit from an uncertain tax position may be recognized when it is more likely than not that the position will be sustained upon examination, including resolutions of any related appeals or litigation processes, based on the technical merits. As of March 31, 2014, the Company had a total of $59.6 million of unrecognized tax benefits. A reconciliation of its reserves for uncertain tax positions, excluding accrued interest and penalties, for March 31, 2014 is as follows:
| Balance at June 30, 2013 |
$ | 37.7 | ||
| Additions based on tax positions related to the current year |
0.8 | |||
| Additions for tax positions of prior years |
25.1 | |||
| Reductions for tax positions of prior years |
(4.0 | ) | ||
|
|
|
|||
| Balance at March 31, 2014 |
$ | 59.6 | ||
|
|
|
As of March 31, 2014 and June 30, 2013, the Company had a total of $64.8 million and $42.7 million of uncertain tax positions (including accrued interest and penalties), respectively. As of these dates, $34.9 million and $9.6 million, respectively, represent the amount of unrecognized tax benefits, which, if recognized, would favorably impact the effective income tax rate. The Company recognizes interest and penalties related to uncertain tax positions as a component of income tax expense. As of March 31, 2014 and June 30, 2013, the Company has approximately $5.2 million and $5.0 million of accrued interest and penalties related to uncertain tax positions, respectively. As of these dates, the portion of such interest and penalties subject to indemnification by its former owner is $2.4 million and $4.1 million, respectively.
9. EMPLOYEE RETIREMENT BENEFIT PLANS
Components of the Company’s net periodic benefit costs are as follows:
| Nine Months Ended March 31, |
||||||||
| (Dollars in millions) |
2014 | 2013 | ||||||
| Components of net periodic benefit cost: |
||||||||
| Service cost |
$ | 2.1 | $ | 2.2 | ||||
| Interest cost |
9.2 | 9.1 | ||||||
| Expected return on plan assets |
(7.8 | ) | (7.4 | ) | ||||
| Amortization(1) |
0.9 | 0.7 | ||||||
|
|
|
|
|
|||||
| Net amount recognized |
$ | 4.4 | $ | 4.6 | ||||
|
|
|
|
|
|||||
| (1) | Amount represents the amortization of unrecognized actuarial gains/(losses). |
The Company has recorded $39.6 million in obligations related to its withdrawal from a multi-employer pension plan related to a former commercial packaging site, a clinical services site and a former printed components operation. The estimated discounted value of the projected contributions related to these plans is $39.6 million as of March 31, 2014 and $39.7 million as of June 30, 2013. The annual cash impact associated with the Company’s long-term obligation approximates $1.7 million per year. Refer to Note 13 to the Consolidated Financial Statements for further discussion.
10. RELATED PARTY TRANSACTIONS
Advisor Transaction and Management Fees
The Company is party to a transaction and advisory fee agreement with Blackstone and certain other Investors in BHP PTS Holdings L.L.C. (the “Investors”), the investment entity controlled by affiliates of Blackstone that was formed in connection with the Investors’ investment in Phoenix. The Company pays an annual sponsor advisory fee to Blackstone and the Investors for certain monitoring, advisory and consulting
F-63
Table of Contents
services to the Company. During the nine months ended March 31, 2014 this management fee was approximately $9.7 million, and was $9.4 million for nine months ended March 31, 2013, and is recorded within selling, general and administrative expenses in the Consolidated Statements of Operations.
11. ACCUMULATED OTHER COMPREHENSIVE INCOME/(LOSS)
The components of the changes in the cumulative translation adjustment and minimum pension liability for the nine months ended March 31, 2014 and March 31, 2013 are presented below.
| Nine Months Ended March 31, |
||||||||
| 2014 | 2013 | |||||||
| Foreign currency translation adjustments: |
||||||||
| Net investment hedge |
$ | (18.1 | ) | $ | (13.2 | ) | ||
| Long term intercompany loans |
20.7 | (9.3 | ) | |||||
| Translation adjustments |
13.5 | (2.7 | ) | |||||
|
|
|
|
|
|||||
| Total foreign currency translation adjustment |
16.1 | (25.2 | ) | |||||
|
|
|
|
|
|||||
| Net change in minimum pension liability |
||||||||
| Net gain/(loss) recognized during the period |
1.0 | — | ||||||
|
|
|
|
|
|||||
| Total pension, pretax |
1.0 | — | ||||||
|
|
|
|
|
|||||
| Tax expense/(benefit)(1) |
(0.4 | ) | — | |||||
|
|
|
|
|
|||||
| Net change in minimum pension liability, net of tax |
$ | 0.6 | $ | — | ||||
|
|
|
|
|
|||||
| (1) | Tax related to minimum pension liability relate to the Company’s foreign operations. |
Tax related to the minimum pension liability generated in the U.S., foreign currency translation adjustments related to the net investment hedge, unrealized gains/(losses) and derivatives and deferred compensation have a full valuation allowance recorded offsetting the tax impact resulting in a net zero tax impact for the two years presented.
Changes in Accumulated Other Comprehensive Income/(Loss) by Component
For the nine months ended March 31, 2014 the changes in accumulated other comprehensive income by component are as follows:
| Foreign Exchange Translation Adjustments |
Pension and Other Post-Retirement Adjustments |
Deferred Compensation |
Total | |||||||||||||
| Balance at June 30, 2013 |
$ | 15.1 | $ | (25.9 | ) | $ | 1.5 | $ | (9.3 | ) | ||||||
|
|
|
|
|
|
|
|
|
|||||||||
| Other comprehensive income/(loss) before reclassifications |
16.1 | — | 1.4 | 17.5 | ||||||||||||
| Amounts reclassified from accumulated other comprehensive income |
— | 0.6 | — | 0.6 | ||||||||||||
|
|
|
|
|
|
|
|
|
|||||||||
| Net current period other comprehensive income (loss) |
16.1 | 0.6 | 1.4 | 18.1 | ||||||||||||
|
|
|
|
|
|
|
|
|
|||||||||
| Balance at March 31, 2014 |
$ | 31.2 | $ | (25.3 | ) | $ | 2.9 | $ | 8.8 | |||||||
|
|
|
|
|
|
|
|
|
|||||||||
For the nine months ended March 31, 2014, the Company reclassified $1.0 million of actuarial losses related to its defined benefit pension and other post-retirement benefit plans from accumulated other comprehensive
F-64
Table of Contents
income into selling, general and administrative expenses. Due to this reclassification, the Company recognized an income tax benefit of $0.4 million for the nine months ended March 31, 2014.
12. REDEEMABLE NONCONTROLLING INTEREST
In July 2013, the Company acquired a 67% controlling interest in a softgel manufacturing facility located in Haining, China. The noncontrolling interest shareholders have the right to jointly sell the remaining 33% interest to Catalent during the 30-day period following the third anniversary of closing for a price based on the greater of (1) an amount that would provide the noncontrolling interest shareholders a return on their investment of a predetermined amount per annum on their pro rata share of the initial valuation or (2) a multiple of the sum of the target’s earnings before interest, taxes, depreciation and amortization and amortization less net debt for the four quarters immediately preceding such sale. Noncontrolling interest with redemption features, such as the arrangement described above, that are not solely within the Company’s control are considered redeemable noncontrolling interests, which is considered temporary equity and is therefore reported outside of permanent equity on the Company’s consolidated balance sheet at the greater of the initial carrying amount adjusted for the noncontrolling interest’s share of net income/(loss) or its redemption value. As of March 31, 2014, the redemption value of the redeemable noncontrolling interest approximated the carrying value.
13. COMMITMENTS AND CONTINGENCIES
As previously disclosed with regard to the Company’s participation in a multi-employer pension plan, the Company notified the plan trustees of its withdrawal from such plan in fiscal 2012. The withdrawal from the plan resulted in the recognition of liabilities associated with the Company’s long term obligations in both the prior and current year periods, which were primarily recorded as an expense within discontinued operations. The actuarial review process, which is administered by the plan trustees, is ongoing and the Company awaits final determination as to the company’s ultimate liability. The annual cash impact associated with the Company’s long term obligation approximates $1.7 million per year. Refer to Note 9 on the Consolidated Financial Statements for further discussion.
Beginning in November 2006, the Company, along with several pharmaceutical companies, has been named in approximately 380 civil lawsuits. These lawsuits were filed by individuals allegedly injured by their use of the prescription acne medication Amnesteem®, a branded generic form of isotretinoin, and in some instances of isotretinoin products made and/or sold by other firms as well. All but one of these lawsuits have been dismissed or settled. The Company was not required to make any contribution toward any settlement to date. While it is not possible to determine the ultimate outcome of this legal proceeding, including making a determination of liability, the Company believes it has meritorious defenses with respect to the claims asserted against it and intends to vigorously defend its position.
From time to time, the Company may be involved in legal proceedings arising in the ordinary course of business, including, without limitation, inquiries and claims concerning environmental contamination as well as litigation and allegations in connection with acquisitions, product liability, manufacturing or packaging defects and claims for reimbursement for the cost of lost or damaged active pharmaceutical ingredients, the cost of which could be significant. The Company intends to vigorously defend itself against such other litigation and does not currently believe that the outcome of any such other litigation will have a material adverse effect on the Company’s financial statements. In addition, the healthcare industry is highly regulated and government agencies continue to scrutinize certain practices affecting government programs and otherwise.
From time to time, the Company receives subpoenas or requests for information from various government agencies, including from state attorneys general and the U.S. Department of Justice relating to the business practices of customers or suppliers. The Company generally responds to such subpoenas and requests in a timely and thorough manner, which responses sometimes require considerable time and effort and can result in considerable costs being incurred. The Company expects to incur costs in future periods in connection with existing and future requests.
F-65
Table of Contents
14. SEGMENT INFORMATION
The Company conducts its business within the following operating segments: Softgel Technologies, Modified Release Technologies, Medication Delivery Solutions and Development & Clinical Services. The Softgel Technologies and Modified Release Technologies segments are aggregated into one reportable operating segment—Oral Technologies. The Company evaluates the performance of its segments based on segment earnings before noncontrolling interest, other (income) expense, impairments, restructuring costs, interest expense, income tax (benefit)/expense, and depreciation and amortization (“Segment EBITDA”). EBITDA from continuing operations is consolidated earnings from continuing operations before interest expense, income tax (benefit)/expense, depreciation and amortization and is adjusted for the income or loss attributable to noncontrolling interest. The Company’s presentation of Segment EBITDA and EBITDA from continuing operations may not be comparable to similarly-titled measures used by other companies.
The segments of the Company are organized around similar products and services the Company provides to its customers.
The following tables include net revenue and Segment EBITDA during the nine months ended March 31, 2014 and March 31, 2013:
| Nine Months Ended March 31, |
||||||||
| (Dollars in millions) |
2014 | 2013 | ||||||
| Oral Technologies |
||||||||
| Net revenue |
$ | 832.0 | $ | 853.0 | ||||
| Segment EBITDA |
211.2 | 214.9 | ||||||
| Medication Delivery Solutions |
||||||||
| Net revenue |
177.2 | 151.2 | ||||||
| Segment EBITDA |
30.9 | 17.1 | ||||||
| Development and Clinical Services |
||||||||
| Net revenue |
306.8 | 298.1 | ||||||
| Segment EBITDA |
57.2 | 55.5 | ||||||
| Inter-segment revenue elimination |
(7.9 | ) | (7.2 | ) | ||||
| Unallocated Costs(1) |
(52.6 | ) | (67.0 | ) | ||||
| Combined Totals: |
||||||||
|
|
|
|
|
|||||
| Net revenue |
$ | 1,308.1 | $ | 1,295.1 | ||||
|
|
|
|
|
|||||
| EBITDA from continuing operations |
$ | 246.7 | $ | 220.5 | ||||
|
|
|
|
|
|||||
| (1) | Unallocated costs include restructuring and special items, equity-based compensation, impairment charges, certain other corporate directed costs, and other costs that are not allocated to the segments as follows: |
| Nine Months Ended March 31, |
||||||||
| (Dollars in millions) |
2014 | 2013 | ||||||
| Impairment charges and gain/(loss) on sale of assets |
$ | (0.4 | ) | $ | (4.6 | ) | ||
| Equity compensation |
(3.4 | ) | (2.2 | ) | ||||
| Restructuring and other special items |
(20.9 | ) | (21.3 | ) | ||||
| Sponsor advisory fee |
(9.7 | ) | (9.4 | ) | ||||
| Noncontrolling interest |
0.8 | — | ||||||
| Other income/(expense), net(2) |
(2.8 | ) | (20.3 | ) | ||||
| Non-allocated corporate costs, net |
(16.2 | ) | (9.2 | ) | ||||
|
|
|
|
|
|||||
| Total unallocated costs |
$ | (52.6 | ) | $ | (67.0 | ) | ||
|
|
|
|
|
|||||
F-66
Table of Contents
| (2) | Other income primarily relates to realized and unrealized gains/(losses) related to foreign currency translation. The prior year period included charges associated with redemption of the Company’s Senior Toggle Notes. |
Provided below is a reconciliation of earnings/(loss) from continuing operations to EBITDA from continuing operations:
| Nine Months Ended March 31, |
||||||||
| (Dollars in millions) |
2014 | 2013 | ||||||
| Earnings/(loss) from continuing operations |
$ | (9.1 | ) | $ | (61.0 | ) | ||
| Depreciation and amortization |
108.9 | 114.9 | ||||||
| Interest expense, net |
122.8 | 160.7 | ||||||
| Income tax (benefit)/expense |
23.3 | 5.9 | ||||||
| Noncontrolling interest |
0.8 | — | ||||||
|
|
|
|
|
|||||
| EBITDA from continuing operations |
$ | 246.7 | $ | 220.5 | ||||
|
|
|
|
|
|||||
The following table includes total assets for each segment, as well as reconciling items necessary to total the amounts reported in the Consolidated Balance Sheets:
| (Dollars in millions) |
March 31, 2014 |
June 30, 2013 |
||||||
| Assets |
||||||||
| Oral Technologies |
$ | 2,630.6 | $ | 2,464.4 | ||||
| Medication Delivery Solutions |
289.2 | 286.2 | ||||||
| Development and Clinical Services |
657.8 | 645.9 | ||||||
| Corporate and eliminations |
(486.6 | ) | (339.7 | ) | ||||
|
|
|
|
|
|||||
| Total assets |
$ | 3,091.0 | $ | 3,056.8 | ||||
|
|
|
|
|
|||||
15. SUPPLEMENTAL BALANCE SHEET INFORMATION
Supplementary balance sheet information at March 31, 2014 and June 30, 2013, is detailed in the following tables.
Inventories
Work-in-process and finished goods inventories include raw materials, labor, and overhead. Total inventories consisted of the following:
| (Dollars in millions) |
March 31, 2014 |
June 30, 2013 |
||||||
| Raw materials and supplies |
$ | 92.8 | $ | 70.6 | ||||
| Work-in-process |
30.3 | 26.1 | ||||||
| Finished goods |
43.7 | 40.0 | ||||||
|
|
|
|
|
|||||
| Total inventories, gross |
166.8 | 136.7 | ||||||
| Inventory reserve |
(11.8 | ) | (11.8 | ) | ||||
|
|
|
|
|
|||||
| Inventories |
$ | 155.0 | $ | 124.9 | ||||
|
|
|
|
|
|||||
F-67
Table of Contents
Prepaid expenses and other
Prepaid expenses and other current assets consist of the following:
| (Dollars in millions) |
March 31, 2014 |
June 30, 2013 |
||||||
| Prepaid expenses |
$ | 12.1 | $ | 16.2 | ||||
| Spare parts supplies |
12.3 | 11.8 | ||||||
| Deferred income taxes |
16.3 | 16.3 | ||||||
| Other current assets |
31.8 | 44.3 | ||||||
|
|
|
|
|
|||||
| Total prepaid expenses and other |
$ | 72.5 | $ | 88.6 | ||||
|
|
|
|
|
|||||
Property, plant, and equipment, net
Property, plant, and equipment, net consist of the following:
| (Dollars in millions) |
March 31, 2014 |
June 30, 2013 |
||||||
| Land, buildings, and improvements |
$ | 615.0 | $ | 552.7 | ||||
| Machinery, equipment, and capitalized software |
674.8 | 641.6 | ||||||
| Furniture and fixtures |
8.1 | 9.0 | ||||||
| Construction in progress |
67.7 | 61.6 | ||||||
|
|
|
|
|
|||||
| Property, plant, and equipment, at cost |
1,365.6 | 1,264.9 | ||||||
| Accumulated depreciation |
(528.0 | ) | (450.4 | ) | ||||
|
|
|
|
|
|||||
| Property, plant, and equipment, net |
$ | 837.6 | $ | 814.5 | ||||
|
|
|
|
|
|||||
Other assets
Other assets consist of the following:
| (Dollars in millions) |
March 31, 2014 |
June 30, 2013 |
||||||
| Deferred long term debt financing costs |
$ | 14.8 | $ | 18.2 | ||||
| Other |
27.4 | 18.4 | ||||||
|
|
|
|
|
|||||
| Total other assets |
$ | 42.2 | $ | 36.6 | ||||
|
|
|
|
|
|||||
Other accrued liabilities
Other accrued liabilities consist of the following:
| (Dollars in millions) |
March 31, 2014 |
June 30, 2013 |
||||||
| Accrued employee-related expenses |
$ | 71.9 | $ | 81.1 | ||||
| Restructuring accrual |
4.6 | 6.0 | ||||||
| Deferred income taxes |
0.9 | 0.9 | ||||||
| Accrued interest |
26.4 | 12.5 | ||||||
| Deferred revenue and fees |
52.2 | 36.3 | ||||||
| Accrued income taxes |
45.2 | 30.7 | ||||||
| Other accrued liabilities and expenses |
54.6 | 57.0 | ||||||
|
|
|
|
|
|||||
| Other accrued liabilities |
$ | 255.8 | $ | 224.5 | ||||
|
|
|
|
|
|||||
F-68
Table of Contents
16. SUBSEQUENT EVENTS
In the preparation of its consolidated financial statements, the Company completed an evaluation of the impact of any subsequent events and determined there were no other subsequent events requiring disclosure in or adjustment to these financial statements.
F-69
Table of Contents
Shares
Catalent, Inc.
Common Stock
PROSPECTUS
| Morgan Stanley | J.P. Morgan |
| BofA Merrill Lynch | Goldman, Sachs & Co. | Jefferies | Deutsche Bank Securities | |||
| Blackstone Capital Markets | Piper Jaffray | Raymond James | ||
| Wells Fargo Securities |
William Blair | Evercore | ||
, 2014
Through and including the 25th day after the date of this prospectus, all dealers that effect transactions in these securities, whether or not participating in this offering, may be required to deliver a prospectus. This is in addition to the dealers’ obligations to deliver a prospectus when acting as underwriters and with respect to their unsold allotments or subscriptions.
Table of Contents
PART II
INFORMATION NOT REQUIRED IN PROSPECTUS
ITEM 13. OTHER EXPENSES OF ISSUANCE AND DISTRIBUTION.
The following table sets forth the expenses payable by the Registrant expected to be incurred in connection with the issuance and distribution of the shares of common stock being registered hereby (other than underwriting discounts and commissions). All of such expenses are estimates, other than the filing and listing fees payable to the Securities and Exchange Commission, the Financial Industry Regulatory Authority, Inc. and .
| Filing Fee—Securities and Exchange Commission |
$ | 12,800 | ||
| Fee—Financial Industry Regulatory Authority, Inc. |
$ | 15,500 | ||
| Listing Fee—New York Stock Exchange |
* | |||
| Fees and Expenses of Counsel |
* | |||
| Printing Expenses |
* | |||
| Fees and Expenses of Accountants |
* | |||
| Transfer Agent and Registrar’s Fees |
* | |||
| Miscellaneous Expenses |
* | |||
|
|
|
|||
| Total |
* | |||
|
|
|
| * | To be provided by amendment. |
ITEM 14. INDEMNIFICATION OF DIRECTORS AND OFFICERS.
Section 102(b)(7) of the Delaware General Corporation Law, or DGCL, allows a corporation to provide in its certificate of incorporation that a director of the corporation will not be personally liable to the corporation or its stockholders for monetary damages for breach of fiduciary duty as a director, except where the director breached the duty of loyalty, failed to act in good faith, engaged in intentional misconduct or knowingly violated a law, authorized the payment of a dividend or approved a stock repurchase in violation of Delaware corporate law or obtained an improper personal benefit. Our amended and restated certificate of incorporation will provide for this limitation of liability.
Section 145 of the DGCL, or Section 145, provides, among other things, that a Delaware corporation may indemnify any person who was, is or is threatened to be made, party to any threatened, pending or completed action, suit or proceeding, whether civil, criminal, administrative or investigative (other than an action by or in the right of such corporation), by reason of the fact that such person is or was an officer, director, employee or agent of such corporation or is or was serving at the request of such corporation as a director, officer, employee or agent of another corporation or enterprise. The indemnity may include expenses (including attorneys’ fees), judgments, fines and amounts paid in settlement actually and reasonably incurred by such person in connection with such action, suit or proceeding, provided such person acted in good faith and in a manner he or she reasonably believed to be in or not opposed to the corporation’s best interests and, with respect to any criminal action or proceeding, had no reasonable cause to believe that his or her conduct was illegal. A Delaware corporation may indemnify any persons who were or are a party to any threatened, pending or completed action or suit by or in the right of the corporation by reason of the fact that such person is or was a director, officer, employee or agent of another corporation or enterprise. The indemnity may include expenses (including attorneys’ fees) actually and reasonably incurred by such person in connection with the defense or settlement of such action or suit, provided such person acted in good faith and in a manner he or she reasonably believed to be in or not opposed to the corporation’s best interests, provided further that no indemnification is permitted without judicial approval if the officer, director, employee or agent is adjudged to be liable to the corporation. Where an officer or director is successful on the merits or otherwise in the defense of any action referred to above, the corporation must indemnify him against the expenses which such officer or director has actually and reasonably incurred.
II-1
Table of Contents
Section 145 further authorizes a corporation to purchase and maintain insurance on behalf of any person who is or was a director, officer, employee or agent of the corporation or is or was serving at the request of the corporation as a director, officer, employee or agent of another corporation or enterprise, against any liability asserted against him and incurred by him in any such capacity, or arising out of his or her status as such, whether or not the corporation would otherwise have the power to indemnify him or her under Section 145.
Our amended and restated bylaws will provide that we must indemnify our directors and officers to the fullest extent authorized by the DGCL and must also pay expenses incurred in defending any such proceeding in advance of its final disposition upon delivery of an undertaking, by or on behalf of an indemnified person, to repay all amounts so advanced if it should be determined ultimately that such person is not entitled to be indemnified under this section or otherwise.
The indemnification rights set forth above shall not be exclusive of any other right which an indemnified person may have or hereafter acquire under any statute, provision of our amended and restated certificate of incorporation, our amended and restated bylaws, agreement, vote of stockholders or disinterested directors or otherwise.
We expect to maintain standard policies of insurance that provide coverage (1) to our directors and officers against loss rising from claims made by reason of breach of duty or other wrongful act and (2) to us with respect to indemnification payments that we may make to such directors and officers.
The proposed form of Underwriting Agreement filed as Exhibit 1.1 to this Registration Statement provides for indemnification to our directors and officers by the underwriters against certain liabilities.
| ITEM 15. | RECENT SALES OF UNREGISTERED SECURITIES. |
None.
| ITEM 16. | EXHIBITS AND FINANCIAL STATEMENT SCHEDULES. |
(a) Exhibit Index
| 1.1* | Form of Underwriting Agreement | |
| 3.1* | Form of Amended and Restated Certificate of Incorporation of the Registrant | |
| 3.2* | Form of Amended and Restated Bylaws of the Registrant | |
| 4.1 | Senior Subordinated Indenture dated as of April 10, 2007, among PTS Acquisition Corp., Cardinal Health 409, Inc. and the Bank of New York (incorporated by reference to Exhibit 4.2 to Catalent Pharma Solutions, Inc.’s Registration Statement on Form S-4 filed on December 6, 2007, File No. 333-147871) | |
| 4.2 | First Supplemental Indenture, dated as of July 3, 2008, to the Senior Subordinated Indenture dated as of April 10, 2007, among Catalent US Holding I, LLC, Catalent US Holding II, LLC and The Bank of New York Mellon (incorporated by reference to Exhibit 4.5 to Catalent Pharma Solutions, Inc.’s Annual Report on Form 10-K for the fiscal year ended June 30, 2008 filed on September 29, 2008, File No. 333-147871) | |
| 4.3 | Indenture, dated as of September 18, 2012, among Catalent Pharma Solutions, Inc., the Guarantors named therein and The Bank of New York Mellon, as Trustee, governing the 7.875% Senior Notes Due 2018 (incorporated by reference to Exhibit 4.1 to Catalent Pharma Solutions, Inc.’s Current Report on Form 8-K filed on September 18, 2012, File No. 333-147871) | |
| 5.1* | Form of opinion of Simpson Thacher & Bartlett LLP regarding validity of the shares of common stock registered | |
II-2
Table of Contents
| 10.1 | Offer Letter, dated February 29, 2008, between Matthew Walsh and Catalent Pharma Solutions, Inc. (incorporated by reference to Exhibit 10.1 to Catalent Pharma Solutions, Inc.’s Quarterly Report on Form 10-Q filed on May 15, 2008, File No. 333-147871) | |
| 10.2 | Severance Agreement, dated February 29, 2008, between Matthew Walsh and Catalent Pharma Solutions, Inc. (incorporated by reference to Exhibit 10.2 to Catalent Pharma Solutions, Inc.’s Quarterly Report on Form 10-Q filed on May 15, 2008, File No. 333-147871) | |
| 10.3 | Form of Severance Agreement between named executive officers and Catalent Pharma Solutions, Inc. (incorporated by reference to Exhibit 10.3 to Catalent Pharma Solutions, Inc.’s Annual Report on Form 10-K for the fiscal year ended June 30, 2011 filed on September 17, 2010, File No. 333-147871) | |
| 10.4 | Offer Letter, dated August 25, 2009, between William Downie and Catalent Pharma Solutions, Inc. (incorporated by reference to Exhibit 10.4 to Catalent Pharma Solutions, Inc.’s Annual Report on Form 10-K filed on September 4, 2012, File No. 333-147871) | |
| 10.5 | Offer Letter, dated August 27, 2007, between Samrat S. Khichi and Catalent Pharma Solutions, Inc. (incorporated by reference to Exhibit 10.8 to Catalent Pharma Solutions, Inc.’s Annual Report on Form 10-K filed on September 28, 2009, File No. 333-147871) | |
| 10.6 | Letter Agreement, dated November 18, 2010, between Catalent Pharma Solutions, Inc. and William Downie (incorporated by reference to Exhibit 10.6 to Catalent Pharma Solutions, Inc.’s Annual Report on Form 10-K filed on September 4, 2012, File No. 333-147871) | |
| 10.7 | Management Equity Subscription Agreement dated September 8, 2010 by and between Catalent, Inc. (formerly known as PTS Holdings Corp.) and Melvin D. Booth (incorporated by reference to Exhibit 10.7 to Catalent Pharma Solutions, Inc.’s Annual Report on Form 10-K for the fiscal year ended June 30, 2011 filed on September 17, 2010, File No. 333-147871) | |
| 10.8 | Transaction and Advisory Fee Agreement, dated as of April 10, 2007, among PTS Acquisition Corp., Blackstone Management Partners V L.L.C., Genstar Capital LLC and Aisling Capital, LLC (incorporated by reference to Exhibit 10.10 to Catalent Pharma Solutions, Inc.’s Registration Statement on Form S-4 filed on December 6, 2007, File No. 333-147871) | |
| 10.9 | Securityholders Agreement, dated as of May 7, 2007, among Catalent, Inc. (formerly known as PTS Holdings Corp.), Blackstone Healthcare Partners V L.P., BHP PTS Holdings L.L.C. and the other parties thereto (incorporated by reference to Exhibit 10.11 to Catalent Pharma Solutions, Inc.’s Registration Statement on Form S-4 filed on December 6, 2007, File No. 333-147871) | |
| 10.10 | Form of Unit Subscription Agreement (incorporated by reference to Exhibit 10.12 to Catalent Pharma Solutions, Inc.’s Amendment No. 1 to the Registration Statement on Form S-4/A filed on March 3, 2008, File No. 333-147871) | |
| 10.11 | Form of Management Equity Subscription Agreement (incorporated by reference to Exhibit 10.13 to Catalent Pharma Solutions, Inc.’s Amendment No. 1 to the Registration Statement on Form S-4/A filed on March 3, 2008, File No. 333-147871) | |
| 10.12 | Form of Nonqualified Stock Option Agreement (executives) (incorporated by reference to Exhibit 10.14 to Catalent Pharma Solutions, Inc.’s Amendment No. 1 to the Registration Statement on Form S-4/A filed on March 3, 2008, File No. 333-147871) | |
| 10.13 | Form of Nonqualified Stock Option Agreement (non-employee directors) (incorporated by reference to Exhibit 10.15 to Catalent Pharma Solutions, Inc.’s Amendment No. 1 to the Registration Statement on Form S-4/A filed on March 3, 2008, File No. 333-147871) | |
| 10.14 | 2007 PTS Holdings Corp. Stock Incentive Plan (incorporated by reference to Exhibit 10.16 to Catalent Pharma Solutions, Inc.’s Registration Statement on Form S-4 filed on December 6, 2007, File No. 333-147871) | |
II-3
Table of Contents
| 10.15 | Amendment No. 1 to the 2007 PTS Holdings Corp. Stock Incentive Plan, dated September 8, 2010 (incorporated by reference to Exhibit 10.16 to Catalent Pharma Solutions, Inc.’s Annual Report on Form 10-K for the fiscal year ended June 30, 2011 filed on September 17, 2010, File No. 333-147871) | |
| 10.16 | Form of Nonqualified Stock Option Agreement (executives) approved October 23, 2009 (incorporated by reference to Exhibit 10.1 to Catalent Pharma Solutions, Inc.’s Quarterly Report on Form 10-Q filed on February 12, 2010, File No. 333-147871) | |
| 10.17 | Form of Nonqualified Stock Option Agreement Amendment (executives) approved October 23, 2009 (incorporated by reference to Exhibit 10.3 to Catalent Pharma Solutions, Inc.’s Quarterly Report on Form 10-Q filed on February 12, 2010, File No. 333-147871) | |
| 10.18 | Catalent Pharma Solutions, LLC Deferred Compensation Plan (incorporated by reference to Exhibit 10.19 to Catalent Pharma Solutions, Inc.’s Annual Report on Form 10-K for the fiscal year ended June 30, 2010 filed on September 28, 2009, File No. 333-147871) | |
| 10.19 | First Amendment to the Catalent Pharma Solutions, LLC Deferred Compensation Plan (incorporated by reference to Exhibit 10.1 to Catalent Pharma Solutions, Inc.’s Quarterly Report on Form 10-Q filed on February 17, 2009, File No. 333-147871) | |
| 10.20 | Second Amendment to the Catalent Pharma Solutions, LLC Deferred Compensation Plan (incorporated by reference to Exhibit 10.21 to Catalent Pharma Solutions, Inc.’s Annual Report on Form 10-K for the fiscal year ended June 30, 2010 filed on September 28, 2009, File No. 333-147871) | |
| 10.21 | Credit Agreement, dated as of April 10, 2007, among PTS Acquisition Corp., PTS Intermediate Holdings LLC, Morgan Stanley Senior Funding, Inc., Bank of America, N.A. and the other Lenders as parties thereto (incorporated by reference to Exhibit 10.19 to Catalent Pharma Solutions, Inc.’s Registration Statement on Form S-4 filed on December 6, 2007, File No. 333-147871) | |
| 10.22 | Security Agreement, dated as of April 10, 2007, among PTS Acquisition Corp., Cardinal Health 409, Inc., PTS Intermediate Holdings LLC, Certain Subsidiaries of Holdings Identified Therein and Morgan Stanley Senior Funding, Inc., (incorporated by reference to Exhibit 10.20 to Catalent Pharma Solutions, Inc.’s Registration Statement on Form S-4 filed on December 6, 2007, File No. 333-147871) | |
| 10.23 | Security Agreement Supplement, dated as of July 1, 2008, to the Security Agreement, dated as of April 10, 2007, among PTS Acquisition Corp., Cardinal Health 409, Inc., PTS Intermediate Holdings LLC, Certain Subsidiaries of Holdings Identified Therein and Morgan Stanley Senior Funding Inc. (incorporated by reference to Exhibit 10.26 to Catalent Pharma Solutions, Inc.’s Annual Report on Form 10-K for the fiscal year ended June 30, 2008 filed on September 29, 2008, File No. 333-147871) | |
| 10.24 | Intellectual Property Security Agreement, dated as of April 10, 2007, among PTS Acquisition Corp., Cardinal Health 409, Inc., PTS Intermediate Holdings LLC, Certain Subsidiaries of Holdings Identified Therein and Morgan Stanley Senior Funding, Inc. (incorporated by reference to Exhibit 10.21 to Catalent Pharma Solutions, Inc.’s Registration Statement on Form S-4 filed on December 6, 2007, File No. 333-147871) | |
| 10.25 | Intellectual Property Security Agreement Supplement, dated as of July 1, 2008, to the Intellectual Property Security Agreement, dated as of April 10, 2007, among PTS Acquisition Corp., Cardinal Health 409, Inc., PTS Intermediate Holdings LLC, Certain Subsidiaries of Holdings Identified Therein and Morgan Stanley Senior Funding, Inc. (incorporated by reference to Exhibit 10.28 to Catalent Pharma Solutions, Inc.’s Annual Report on Form 10-K for the fiscal year ended June 30, 2008 filed on September 29, 2008, File No. 333-147871) | |
| 10.26 | Guaranty, dated as of April 10, 2007, among PTS Intermediate Holdings LLC, Certain Subsidiaries of Holdings Identified Therein and Morgan Stanley Senior Funding, Inc. (incorporated by reference to Exhibit 10.22 to Catalent Pharma Solutions, Inc.’s Registration Statement on Form S-4 filed on December 6, 2007, File No. 333-147871) | |
II-4
Table of Contents
| 10.27 | Guaranty Supplement, dated as of July 1, 2008, to the Guaranty, dated as of April 10, 2007, among PTS Intermediate Holdings LLC, Certain Subsidiaries of Holdings Identified Therein and Morgan Stanley Senior Funding, Inc. (incorporated by reference to Exhibit 10.30 to Catalent Pharma Solutions, Inc.’s Annual Report on Form 10-K for the fiscal year ended June 30, 2008 filed on September 29, 2008, File No. 333-147871) | |
| 10.28 | Employment Agreement, dated February 23, 2009 by and among Catalent, Inc. (formerly known as PTS Holdings Corp.), Catalent Pharma Solutions, Inc. and John R. Chiminski (including Form of Restricted Stock Unit Agreement and Form of Management Equity Subscription Agreement) (incorporated by reference to Exhibit 99.2 to Catalent Pharma Solutions, Inc.’s Current Report on Form 8-K filed on March 5, 2009, File No. 333-147871) | |
| 10.29 | Letter Agreement, dated October 30, 2009, by and among Catalent, Inc. (formerly known as PTS Holdings Corp.), Catalent Pharma Solutions, Inc. and John R. Chiminski (incorporated by reference to Exhibit 10.4 to Catalent Pharma Solutions, Inc.’s Quarterly Report on Form 10-Q filed on February 12, 2010, File No. 333-147871) | |
| 10.30 | Letter Agreement, entered into on June 30, 2010, by and among Catalent, Inc. (formerly known as PTS Holdings Corp.), Catalent Pharma Solutions, Inc. and John R. Chiminski (including Form of Restricted Stock Unit Agreement) (incorporated by reference to Exhibit 10.1 to Catalent Pharma Solutions, Inc.’s Current Report on Form 8-K filed on July 7, 2010, File No. 333-147871) | |
| 10.31 | Form of Nonqualified Stock Option Agreement (John R. Chiminski) approved October 23, 2009 (incorporated by reference to Exhibit 10.4 to Catalent Pharma Solutions, Inc.’s Quarterly Report on Form 10-Q filed on February 12, 2010, File No. 333-147871) | |
| 10.32 | Form of Restricted Stock Unit Agreement (John R. Chiminski) approved October 23, 2009 (incorporated by reference to Exhibit 10.5 to Catalent Pharma Solutions, Inc.’s Quarterly Report on Form 10-Q filed on February 12, 2010, File No. 333-147871) | |
| 10.33 | Amendment No. 1, dated as of June 1, 2011, relating to the Credit Agreement, dated as of April 10, 2007, among Catalent Pharma Solutions, Inc., PTS Intermediate Holdings LLC, Morgan Stanley Senior Funding, Inc., as the administrative agent and swing line lender and other lenders as parties thereto, (incorporated by reference to Exhibit 10.1 to Catalent Pharma Solutions, Inc.’s Current Report on Form 8-K filed on June 7, 2011, File No. 333-147871) | |
| 10.34 | Amendment No. 2, dated as of February 17, 2012, relating to the Credit Agreement, dated as of April 10, 2007, as amended, among Catalent Pharma Solutions, Inc., PTS Intermediate Holdings LLC, Morgan Stanley Senior Funding, Inc., as the administrative agent, collateral agent and swing line lender and other lenders as parties thereto (incorporated by reference to Exhibit 10.1 to Catalent Pharma Solutions, Inc.’s Current Report on Form 8-K filed on February 24, 2012, File No. 333-147871) | |
| 10.35 | Amendment No. 3, dated as of February 27, 2012, relating to the Credit Agreement, dated as of April 10, 2007, as amended, among Catalent Pharma Solutions, Inc., PTS Intermediate Holdings LLC, Morgan Stanley Senior Funding, Inc., as the administrative agent, collateral agent and swing line lender and other lenders as parties thereto (incorporated by reference to Exhibit 10.1 to Catalent Pharma Solutions, Inc.’s Current Report on Form 8-K filed on March 2, 2012, File No. 333-147871) | |
| 10.36 | Extension Amendment, dated as of March 1, 2012, relating to the Credit Agreement, dated as of April 10, 2007, as amended, among Catalent Pharma Solutions, Inc., PTS Intermediate Holdings LLC, Morgan Stanley Senior Funding, Inc., as the administrative agent and as a dollar term-1 lender and other lenders as parties thereto (incorporated by reference to Exhibit 10.2 to Catalent Pharma Solutions, Inc.’s Current Report on Form 8-K filed on March 2, 2012, File No. 333-147871) | |
| 10.37 | Amendment No. 4, dated as of April 27, 2012, relating to the Credit Agreement, dated as of April 10, 2007, as amended, among Catalent Pharma Solutions, Inc., PTS Intermediate Holdings LLC, Morgan Stanley Senior Funding, Inc., as the administrative agent, collateral agent and swing line lender and | |
II-5
Table of Contents
| other lenders as parties thereto (incorporated by reference to Exhibit 10.1 to Catalent Pharma Solutions, Inc.’s Current Report on Form 8-K filed on May 3, 2012, File No. 333-147871) | ||
| 10.38 | Letter Agreement, entered into on December 12, 2011, by and among Catalent, Inc. (formerly known as PTS Holdings Corp.), Catalent Pharma Solutions, Inc. and John R. Chiminski (incorporated by reference to Exhibit 10.1 to Catalent Pharma Solutions, Inc.’s Quarterly Report on Form 10-Q filed on February 10, 2012, File No. 333-147871) | |
| 10.39 | Employment Agreement, dated as of October 11, 2011, and effective as of September 26, 2011, by and between Catalent Pharma Solutions, Inc. and Matthew Walsh (including Form of Restricted Stock Unit Agreement and Form of Nonqualified Stock Option Agreement) (incorporated by reference to Exhibit 10.42 to Catalent Pharma Solutions, Inc.’s Annual Report on Form 10-K filed on September 4, 2012, File No. 333-147871) | |
| 10.40 | Amended and Restated Management Equity Subscription Agreement dated as of October 11, 2011 by and between Catalent, Inc. (formerly known as PTS Holdings Corp.) and Matthew Walsh (including Form of Restricted Stock Unit Agreement and Form of Nonqualified Stock Option Agreement) (incorporated by reference to Exhibit 10.43 to Catalent Pharma Solutions, Inc.’s Annual Report on Form 10-K filed on September 4, 2012, File No. 333-147871) | |
| 10.41 | Amendment No. 5, dated as of February 28, 2013 relating to the Credit Agreement, dated as of April 10, 2007, as amended, among Catalent Pharma Solutions, Inc., PTS Intermediate Holdings LLC, Morgan Stanley Senior Fund, Inc., as the administrative agent, collateral agent and swing line leader and to the partners thereto (incorporated by reference to Exhibit 10.1 to Catalent Pharma Solutions, Inc.’s Current Report on Form 8-K filed on March 6, 2013, File No. 333-147871) | |
| 10.42 | Senior Unsecured Term Loan Credit Agreement, dated as of April 29, 2013, among the Company, the guarantors named therein, Morgan Stanley Senior Funding, Inc., as the administrative agent, and other lenders party thereto. (incorporated by reference to Exhibit 10.1 to Catalent Pharma Solutions, Inc.’s Current Report on Form 8-K filed on May 2, 2013, File No. 333-147871) | |
| 10.43 | Form of Nonqualified Stock Option Agreement (executives) approved June 25, 2013 (incorporated by reference to Exhibit 10.45 of Catalent Pharma Solutions, Inc.’s Annual Report on Form 10-K filed on September 10, 2013) | |
| 10.44 | Form of Nonqualified Stock Option Agreement (Chief Executive Officer) approved June 25, 2013 (incorporated by reference to Exhibit 10.46 of Catalent Pharma Solutions Inc.’s Annual Report on Form 10-K filed on September 10, 2013) | |
| 10.45* | Amendment No. 2 to the 2007 PTS Holdings Corp. Stock Incentive Plan, dated June 25, 2013 | |
| 10.46* | Form of 2014 Omnibus Incentive Plan | |
| 10.47* | Form of Stock Option Agreement | |
| 10.48* | Form of Restricted Stock Unit Agreement for Employees | |
| 10.49* | Restricted Stock Unit Agreement for Directors | |
| 10.50** | Form of Registration Rights Agreement | |
| 10.51* | Form of Shareholders Agreement | |
| 10.52 | Amended and Restated Credit Agreement, dated as of May 20, 2014, relating to the Credit Agreement, dated as of April 10, 2007, as amended, among Catalent Pharma Solutions, Inc., PTS Intermediate Holdings LLC, Morgan Stanley Senior Funding, Inc., as the administrative agent, collateral agent and swing line lender and other lenders as parties thereto (incorporated by reference to Exhibit 10.1 to Catalent Pharma Solutions, Inc.’s Current Report on Form 8-K filed on May 27, 2014, File No. 333-147871) | |
| 21.1** | Subsidiaries of the Registrant | |
| 23.1** | Consent of Ernst & Young LLP | |
| 23.2* | Consent of Simpson Thacher & Bartlett LLP (included as part of Exhibit 5.1) | |
| 23.3* | Consent of Jack Stahl to be named as a director nominee | |
| 23.4* | Consent of Rolf Classon to be named as a director nominee | |
| 24.1 | Power of Attorney (included on signature pages to this Registration Statement) | |
| * | Previously filed. |
| ** | Filed herewith. |
| *** | To be filed by amendment. |
II-6
Table of Contents
(b) Financial Statement Schedule
All schedules are omitted because the required information is either not present, not present in material amounts or presented within our audited consolidated financial statements included elsewhere in this prospectus included in the prospectus and are incorporated herein by reference.
ITEM 17. UNDERTAKINGS
| (1) | Insofar as indemnification for liabilities arising under the Securities Act of 1933 may be permitted to directors, officers and controlling persons of the registrant pursuant to the foregoing provisions, or otherwise, the registrant has been advised that in the opinion of the Securities and Exchange Commission such indemnification is against public policy as expressed in the Securities Act of 1933 and is, therefore, unenforceable. In the event that a claim for indemnification against such liabilities (other than the payment by the registrant of expenses incurred or paid by a director, officer or controlling person of the registrant in the successful defense of any action, suit or proceeding) is asserted by such director, officer or controlling person in connection with the securities being registered, the registrant will, unless in the opinion of its counsel the matter has been settled by controlling precedent, submit to a court of appropriate jurisdiction the question of whether such indemnification by it is against public policy as expressed in the Securities Act of 1933 and will be governed by the final adjudication of such issue. |
| (2) | The undersigned Registrant hereby undertakes that: |
| (A) | For purposes of determining any liability under the Securities Act of 1933, the information omitted from the form of prospectus filed as part of this registration statement in reliance upon Rule 430A and contained in a form of prospectus filed by the registrant pursuant to Rule 424(b) (1) or (4) or 497(h) under the Securities Act shall be deemed to be part of this registration statement as of the time it was declared effective. |
| (B) | For the purpose of determining any liability under the Securities Act of 1933, each post-effective amendment that contains a form of prospectus shall be deemed to be a new registration statement relating to the securities offered therein, and the offering of such securities at that time shall be deemed to be the initial bona fide offering thereof. |
| (3) | The undersigned Registrant hereby undertakes to provide to the underwriters at the closing specified in the underwriting agreement certificates in such denominations and registered in such names as required by the underwriters to permit prompt delivery to each purchaser. |
II-7
Table of Contents
SIGNATURES
Pursuant to the requirements of the Securities Act of 1933, as amended, the Registrant has duly caused this Registration Statement or amendment thereto to be signed on its behalf by the undersigned, thereunto duly authorized, in Somerset, State of New Jersey, on the 30th day of May, 2014.
| CATALENT, INC. | ||
| By: |
/s/ SAMRAT S. KHICHI | |
| Name: Samrat S. Khichi, Esq. Title: Senior Vice President, Chief Administrative Officer, General Counsel and Secretary | ||
Pursuant to the requirements of the Securities Act of 1933, as amended, this Registration Statement or amendment thereto has been signed by the following persons in the capacities indicated on the 30th day of May, 2014.
| Signature |
Title | |
| * John Chiminski |
Chief Executive Officer and Director (Principal Executive Officer) | |
| * Chinh E. Chu |
Director | |
| * Bruce McEvoy |
Director | |
| * James Quella |
Director | |
| * Matthew Walsh |
Treasurer (Principal Financial Officer and Principal Accounting Officer) | |
| * By: |
/s/ SAMRAT S. KHICHI, ESQ. | |
| Name: |
Samrat S. Khichi, Esq. | |
| Title: |
Attorney-in-Fact |
II-8