Attached files
| file | filename |
|---|---|
| 8-K - FORM 8-K - PEABODY ENERGY CORP | btu_8-k2014528.htm |
Exhibit 99.1

Advanced Energy
Brean Capital 2014 Global Resources and Infrastructure Conference
May 28, 2014
Peabody Energy

Statement on Forward-Looking Information
Peabody Energy
Certain statements in this press release are forward-looking as defined in the Private Securities Litigation Reform Act of 1995. The company uses words such as “anticipate,” “believe,” “expect,” “may,” “forecast,” “project,” “should,” “estimate,” “plan,” “outlook,” “target” or other similar words to identify forward-looking statements. These forward-looking statements are based on numerous assumptions that the company believes are reasonable, but they are open to a wide range of uncertainties and business risks that may cause actual results to differ materially from expectations as of May 14, 2014. These factors are difficult to accurately predict and may be beyond the company’s control. The company does not undertake to update its forward-looking statements. Factors that could affect the company’s results include, but are not limited to: global supply and demand for coal, including the seaborne thermal and metallurgical coal markets; price volatility and customer procurement practices, particularly in higher-margin products and in the company’s trading and brokerage businesses; impact of alternative energy sources, including natural gas and renewables; global steel demand and the downstream impact on metallurgical coal prices; impact of weather and natural disasters on demand, production and transportation; reductions and/or deferrals of purchases by major customers and ability to renew sales contracts; credit and performance risks associated with customers, suppliers, contract miners, co-shippers, and trading, banks and other financial counterparties; geologic, equipment, permitting, site access and operational risks related to mining; transportation availability, performance and costs; availability, timing of delivery and costs of key supplies, capital equipment or commodities such as diesel fuel, steel, explosives and tires; impact of take-or-pay agreements with rail and port commitments for the delivery of coal; successful implementation of business strategies; negotiation of labor contracts, employee relations and workforce availability; changes in postretirement benefit and pension obligations and funding requirements; replacement and development of coal reserves; availability, access to and related cost of capital and financial markets; effects of changes in interest rates and currency exchange rates (primarily the Australian dollar); effects of acquisitions or divestitures; economic strength and political stability of countries in which the company has operations or serves customers; legislation, regulations and court decisions or other government actions, including, but not limited to, new environmental and mine safety requirements; changes in income tax regulations, sales-related royalties, or other regulatory taxes and changes in derivative laws and regulations; litigation, including claims not yet asserted; and other risks detailed in the company’s reports filed with the Securities and Exchange Commission (SEC).
Adjusted EBITDA is defined as (loss) income from continuing operations before deducting net interest expense, income taxes, asset retirement obligation expenses, depreciation, depletion and amortization, asset impairment and mine closure costs, charges for the settlement of claims and litigation related to previously divested operations and amortization of basis difference associated with equity method investments. Adjusted EBITDA, which is not calculated identically by all companies, is not a substitute for operating income, net income or cash flow as determined in accordance with United States GAAP. Management uses Adjusted EBITDA as the primary metric to measure segment operating performance and also believes it is useful to investors in comparing the company’s current results with those of prior and future periods and in evaluating the company’s operating performance without regard to its capital structure or the cost basis of its assets.
Adjusted (Loss) Income from Continuing Operations and Adjusted Diluted EPS are defined as (loss) income from continuing operations and diluted earnings per share from continuing operations, respectively, excluding the impacts of asset impairment and mine closure costs and charges for the settlement of claims and litigation related to previously divested operations, net of tax, and the remeasurement of foreign income tax accounts on our income tax provision. The income tax benefits related to asset impairment and mine closure costs and charges for the settlement of claims and litigation related to previously divested operations are calculated based on the enacted tax rate in the jurisdiction in which they have been or will be realized, adjusted for the estimated recoverability of those benefits. Management has included these measures because, in the opinion of management, excluding those foregoing items is useful in comparing the company’s current results with those of prior and future periods. Management also believes that excluding the impact of the remeasurement of foreign income tax accounts represents a meaningful indicator of the company's ongoing effective tax rate.
5/28/14
2

Coal: World’s Fastest Growing Major Fuel; Expected to Be Largest Energy Source
Peabody Energy
Emerging Countries Rely on low-cost coal to fuel growing economies and raise standards of living
Developed Countries Returning to coal and adding new coal-fueled generation
U.S. Demand Coal remains largest and lowest-cost source of electricity generation in the U.S.
Long-Term Demand Urbanization and industrialization trends expected to drive sustained long-term coal demand growth
3

Peabody Overview: Our Approach Begins by Answering a Question
Peabody Energy
How to Design the Best Positioned Coal Company?
Global Scope Targeting highest-growth markets with tier one assets in U.S. West, U.S. Midwest and Australia
Superior Asset Base 8 billion tons of coal reserves and ~500,000 acres of surface land in U.S. and Australia
Low Cost U.S. Position Largest producer in Southern Powder River Basin with world’s most productive coal mine
Strong Metallurgical Coal Portfolio Largest seaborne low-vol PCI supplier and leading seaborne metallurgical coal presence
Competitive Advantage Superior margins to peers; sound financial position with strong liquidity
Proven Track Record Operational excellence; well-capitalized platform; strong portfolio management
Reserves and acres of surface land based on 2013 10-K filing.
4

Global Coal Markets
5

Expanding Global Energy Needs Lead to Rising Coal Demand
Peabody Energy
Global Energy Demand (MTOE) 2010 2020P 2030P 0 3,000 6,000 9,000 12,000 15,000 18,000 +38%
Global Electricity Use (TWh) 2010 2020P 2030P 0 6,000 12,000 18,000 24,000 30,000 36,000 +69%
Global Coal Demand (MTOE) 2010 2020P 2030P 0 1,000 2,000 3,000 4,000 5,000 +48%
Source: Peabody Energy Analytics; International Energy Agency (IEA), 2013 World Energy Outlook. Energy and coal demand in Million Tonnes of Oil Equivalent (MTOE). Electricity use in terawatt-hours (TWh).
6

Increasing Urbanization in Asia Continues to Drive Record Global Coal Demand
Peabody Energy
200,000 People Added to Cities Each Day
Global Urban Population (Millions)
2010 2015P 2020P 0 1,000 2,000 3,000 4,000
Urbanization trends lead to greater coal use to fuel growing electricity and steel demand
More than 70 million people expected to be added to cities each year through 2020
Coal is the only affordable fuel, at scale, to meet rising energy needs
Source: United Nations, Department of Economic and Social Affairs, Population Division “World Urbanization Prospects: The 2011 Revision”.
7

Coal: Least Expensive and Most Reliable Form of Electricity Generation
Peabody Energy
Coal Oil Natural Gas Nuclear Solar/Wind
Low Cost Baseload Capacity Safe to Transport Energy Dense Widely Available Technology Based
Coal: Only a fraction of other fuels’ costs Provides baseload power; easily transported Energy dense, abundant and increasingly uses advanced technologies
Source: Peabody Energy Analytics
8

Policies, Security and Economics Driving Greater Global Coal Use
Peabody Energy
United States Coal increases market share in past 2 years
Europe Energy security crisis emphasizes advantage of coal
South Africa One of many nations solving energy poverty with coal-fueled solutions
Germany Highest coal use since 1990
India One of world’s fastest growing coal importers
China Using technology and incentives to reduce emissions and increase coal use
Australia Coal exports rising and strong push by government to repeal carbon tax
Japan Coal use increases 16 months in a row
Source: Peabody Global Analytics. Data for U.S. and Japan as of April 2014. Japan data year-over-year.
9

New Generation Expected to Drive Significant Global Thermal Coal Demand
Peabody Energy
Coal to Account for 40% of Global Electricity Generation Growth
Projected Seaborne Thermal Coal Demand (Tonnes in Millions)
2013E 2016P 2020P Atlantic Other Pacific China India
0 200 400 600 800 1,000 1,200
-15 +155 +70 +85 955 1,078 1,200
New coal-fueled generation of ~250 GW projected by 2016 Requires 750 million tonnes of new annual coal production at expected capacity utilization
China and India imports likely to grow ~100 million tonnes in next three years
Source: Peabody Global Analytics, McCloskey, other industry sources.
10

Metallurgical Coal Essential for Rising Steel Production in Emerging Countries
Peabody Energy
2014 Steel Consumption Per Capita
~ 500 Million Tonnes of Metallurgical Coal Required to Reach Stable Stage Steel Intensity of Developed Asian Countries (850 Kg/Capita)
India China Kg/Capita 0 200 400 600 800 1,000 70 545
Historic growth in India and China driving increased metallurgical coal demand
Significant steel increases required to reach levels of developed economies
Greater imports needed to meet metallurgical coal needs Global metallurgical coal demand expected to rise 20 - 40 million tonnes per year
Projected long-term fundamentals remain sound on increasing urbanization in Asia
Source: Peabody Global Analytics.
11

Growing PCI Market Allows Steel Producers to Offset Higher-Cost Coke
Peabody Energy
Expected PCI Demand Growth (Tonnes in Millions)
2010 2015P 2020P 0 50 100 150 200 250 120 165 195
Pulverized Coal Injection a low-cost substitute for coke made from coking coal 1 ton of low-vol PCI replaces 1.3 tons of hard coking coal
Modern blast furnaces can use up to 25% PCI
Majority of high quality low-vol PCI supply from Australia; Peabody largest seaborne supplier
Source: Peabody Global Analytics.
12

Global Seaborne Supply Growth to Slow; Fundamentals to Gradually Improve
Peabody Energy
2014 Global Exports (Tonnes in Millions)
0 200 400 Indonesia Australia Russia U.S. Colombia South Africa Canada Mongolia Other
End of supply growth phase that began in 2012 on higher prices
Most new projects have been completed; higher- cost mine closings accelerating
Significant reduction in capital spending limits future supply growth
Source: Peabody Global Analytics.
13

China Expected to Follow U.S. Path of Greater Coal Use and Lower Emissions
Peabody Energy
U.S. Emissions Rate Declines 89% Since 1970; Coal Use Rises 173% Pittsburgh 1950s Today
1970 1980 1990 2000 2011 -100% -50% 0% 50% 100% 150% 200%
Coal-Based Power Generation +173% GDP per Capita +116% Regulated Emissions/MWh from Coal -89%
Source: USDA 2011; Energy Information Administration 2012; U.S. EPA Air Trends Data, 2012; Peabody analysis 2012. GDP in 2005 dollars.
14

U.S. Coal Increases Market Share; Fuels 42% of Electricity Generation in the U.S.
Peabody Energy
Share of U.S. Electric Power Sector Generation
April 2012 April 2014 0% 10% 20% 30% 40% 50% Coal Natural Gas Nuclear Other 31% 31% 19% 19% 42% 23% 20% 15%
U.S. coal use rebounds materially in the U.S. in past two years
Gas share reduced on rising natural gas prices
Coal use up 7% YTD; Gas generation down 4%
Southern Powder River Basin and Illinois Basin coal very competitive with natural gas SPRB: $2.50 - $2.75 ILB: $3.50 - $3.75 CAPP: $4.50+
Source: Peabody Global Analytics and EIA. YTD through April 2014.
15

SPRB Prices at 30-Month High on Rising Coal Demand, Declining Stockpiles
Peabody Energy
SPRB Utility Inventories and Spot Price (Stockpiles Days Use)
January 2008 April 2014 Price Stockpiles $6 $7 $8 $9 $10 $11 $12 $13 $14 $15 $16 $17
SPRB stockpiles below normal at 48 days use; ~50% below 2012 peak levels Some customer inventories are at less than 10 days use
SPRB prices up ~30% in last 6 months
U.S. coal demand expected to increase 35 - 45 million tons in 2014
Source: Peabody Global Analytics and EIA. Stockpiles as of end of April 2014.
16

SPRB and Illinois Basin: 100 Million Ton Demand Increase Forecasted by 2016
Peabody Energy
Expected SPRB and ILB Generation Demand (Tons in Millions)
0 200 400 600 515 -60 +100 +60 615 SPRB and ILB +100
2013 Retirements Utilization Switching 2016P
Significant coal-fueled generation of ~250 GW projected to remain on line in 2016
Increased power plant utilization and basin switching expected to more than offset retirements Current coal fleet utilization only 60% of capacity, remaining fleet has potential to run at 80%
Source: Peabody Global Analytics.
17

Annual World Coal Use Expected to Grow 700 Million Tonnes Over Next Three Years
Peabody Energy
Expected Global Coal Demand (Tonnes in Millions) 0 2,000 4,000 6,000 8,000 10,000
ROW China India
2013E 2,925 4,130 780 7,835 2016P 3,075 4,570 890 8,535 2020P 3,185 4,907 1,069 9,161
Coal is the world’s fastest growing major fuel
Record global coal use expected to continue on growing electricity and steel demand
IEA and other observers project that coal will overtake oil as world’s largest energy source in coming years
Source: Peabody Global Analytics.
18

Peabody Energy Overview
19

Delivering on Long-Term Journey to Reshape Peabody’s Asset Base
Peabody Energy
Strategy Leading Position in High-Growth Low-Cost U.S. Basins Strong Global Presence in High-Growth Markets
Actions 3 Major Acquisitions and Mine Expansions in Australia Increased PRB and ILB Investments Expansion of Trading Offices Enter China and Mongolia Exit from Appalachia Operations
Results Diverse Global Platform Largest U.S. Producer Largest Producer and Reserve Holder in SPRB Largest Seaborne Supplier of Low-Vol PCI Coal Third-Largest Australian Reserve Holder Fifth-Largest Global Seaborne Metallurgical Coal Supplier
20

Peabody: World’s Largest Private-Sector Coal Company
Peabody Energy
Metallurgical and Thermal Coal Customers in 25+ Countries
(From U.S) London Essen New Delhi Urumqi Ulaanbaatar Beijing Singapore Jakarta Balikpapan Brisbane, QLD Newcastle, NSW St. Louis, MO (to Europe)
Mining Operations and Trading Sales Reserves SPRB 135 3.4 Midwest 26 3.2 Southwest 16 0.5 Colorado 7 0.2 Australia 35 0.9 Trading 32 0 Total Tons 252 Million 8.3 Billion
Operating Regions Customers Served Corporate Office Regional Offices Trading/Business Development Offices Coal Flows
Reported 2013 sales volumes. Reserves based on 2013 10-K filing. Total sales and reserves variances are based on rounding calculations. Green shading indicates countries served by Peabody.
21

Peabody’s Core Strengths Targeted to Long-Term Value Creation
Peabody Energy
Superior Asset Base Leading reserve position Geographic diversity Access to high growth markets Leading presence in PRB and ILB
Best In-Class Operations Continuous focus on safety Strong operating performance Technology-driven process improvements Aggressive cost containment
Sound Financial Position Well-capitalized platform Strong liquidity No significant near-term debt maturities Opportunistic sales of non-core assets
Major Growth Potential Long-term expansion opportunities Asian partnerships and joint ventures Thought leader in sustainable mining, energy access and clean coal solutions
22

Competitive Advantage: Productive, Low-Cost SPRB and Western Assets
Peabody Energy
Largest Producer and Reserve Holder in SPRB
North Antelope Rochelle Mine World’s largest and most productive coal mine Produces ~110 million tons per year 2.3 billion tons of reserves
El Segundo Mine Most productive U.S. mine outside of the PRB Produces ~9 million tons per year ~160 million tons of reserves
North Antelope Rochelle Mine
Production and reserves based on 2013 10-K filing.
23

Midwest Portfolio Well Positioned: Anchored by Key Mines
Peabody Energy
26 Million Tons Shipped in 2013; 3 Billion Tons of Reserves
Peabody Mine Power Plant Illinois Indiana Kentucky Gateway Wildcat Hills/Cottage Grove Complex Bear Run Francisco Somerville Wild Boar
Peabody Illinois Basin Operating Base Strategically Located to Serve Local Market
Bear Run Mine Largest surface mine in Eastern U.S. Produces 8+ million tons per year Nearly 275 million tons of reserves
Gateway Mine Gateway North to extend production in 2015 Produces nearly 3 million tons per year
Production and reserves based on 2013 10-K filing.
24

Peabody’s Australia Strategy: Best Access to High-Growth Asian Market
Peabody Energy
Australia holds competitive advantage over other nations with mines close to ports; ports near high-growth markets
Peabody has substantial high-quality coal base; 925 million tons of reserves
Significant operational synergies with existing mines and potential future developments
Metallurgical Thermal PCI Mine Port Burton North Goonyella Coppabella Moorvale Millennium Middlemount Abbot Point Dalrymple Bay Queensland Wambo Underground Wilpinjong Wambo Open Cut Metropolitan PWCS NCIG Port Kembla
Reserves based on 2013 10-K filing.
25

Driving Further Progress at Australian Metallurgical and Thermal Mines
Peabody Energy
Metallurgical Coal Operations
Completing ramp up of new longwall top coal caving system at North Goonyella Mine
New longwall at Metropolitan Mine targets higher productivity
Completing successful owner-operator conversion initiatives with Moorvale PCI Mine in second half of 2014
Productivity improves 20% at PCI mines in 2013
Thermal Coal Operations
Wilpinjong Mine: 13 million tons per year; among lowest cost coal mines in Australia
Wambo Mine provides high-quality, low-ash thermal export coal
2014 Targets
35 to 37 million tons of coal sales 16 - 17 million tons of metallurgical coal 11 - 12 million tons of seaborne thermal coal
Average costs in the low-to-mid $70 per ton
26

Well-Capitalized Platform Allows Low Capital Spending for Multiple Years
Peabody Energy
U.S. Major Projects SPRB Recapitalization Mine Development in Midwest and Southwest
Australia Major Projects Owner-Operator Conversions in Australia Multiple Australian Mine Expansions
Capex reduced 67% in 2013; 2014 capex target at $250 - $295 million
First quarter capital expenditures lowest in 10 years
Sustaining capital trending below historical range of $1.25 - $1.75/ton
27
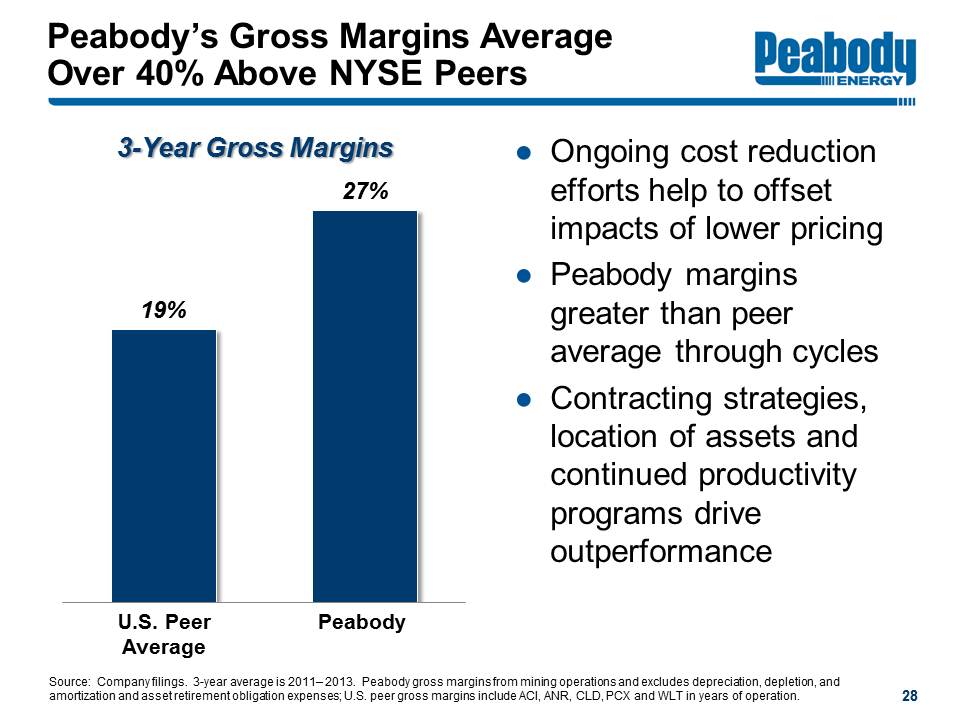
Peabody’s Gross Margins Average Over 40% Above NYSE Peers
Peabody Energy
3-Year Gross Margins U.S. Peer Average Peabody 19% 27%
Ongoing cost reduction efforts help to offset impacts of lower pricing
Peabody margins greater than peer average through cycles
Contracting strategies, location of assets and continued productivity programs drive outperformance
Source: Company filings. 3-year average is 2011- 2013. Peabody gross margins from mining operations and excludes depreciation, depletion, and amortization and asset retirement obligation expenses; U.S. peer gross margins include ACI, ANR, CLD, PCX and WLT in years of operation.
28

Peabody Energy: Best Positioned Coal Company
Peabody Energy
Global Scope Targeting highest-growth markets with tier one assets in U.S. West, U.S. Midwest and Australia
Superior Asset Base 8 billion tons of coal reserves and ~500,000 acres of surface land in U.S. and Australia
Low Cost U.S. Position Largest producer in Southern Powder River Basin with world’s most productive coal mine
Strong Metallurgical Coal Portfolio Largest seaborne low-vol PCI supplier and leading seaborne metallurgical coal presence
Competitive Advantage Superior margins to peers; sound financial position with strong liquidity
Proven Track Record Operational excellence; well-capitalized platform; strong portfolio management
Reserves and acres of surface land based on 2013 10-K filing.
29

Peabody Energy
Advanced Energy
PeabodyEnergy.com
AdvancedEnergyForLife.com

Appendix: Reconciliation of Non-GAAP Measures
Peabody Energy
Reconciliation of Non-GAAP Financial Measures (Unaudited) (Dollars in millions, except per share data)
Quarter Ended Mar. 31 (1) Jun. 30, 2014 Low (2) High (2) Year Ended Dec. 31, 2013 (1) 2012 (1)
Adjusted EBITDA (3) $176.9 $140 $200 $1,047.2 $1,836.5
Depreciation, depletion and amortization 157.2 155 170 740.3 663.4
Asset retirement obligation expenses 15.6 17 15 66.5 67.0
Amortization of basis difference related to equity affiliates 1.2 0 0 6.3 4.6
Interest income (3.6) (2) (4) (15.7) (24.5)
Interest expense 103.3 104 102 408.3 402.3
Loss on early debt extinguishment 0 0 0 16.9 3.3
Income tax (benefit) provision, excluding tax items shown separately below (51.1) (30) (50) (279.9) 481.7
Adjusted (Loss) Income from Continuing Operations (3) $(45.7) $(104) $(33) $104.5 $238.7
Asset impairment and mine closure costs 0 0 0 528.3 929.0
Settlement charges related to the Patriot bankruptcy reorganization 0 0 0 30.6 0
Tax benefit related to asset impairment and mine closure costs 0 0 0 (112.8) (227.3)
Tax benefit related to settlement charges related to the Patriot bankruptcy reorganization 0 0 0 (11.3) 0
Remeasurement (benefit) expense related to foreign income tax accounts (1.4) 0 0 (44.3) 7.9
Loss from continuing operations, net of income taxes $(44.3) $(104) $(33) $(286.0) $(470.9)
Diluted EPS - Loss from continuing operations $(0.18) $(0.39) $(0.14) $(1.12) $(1.80)
Asset impairment and mine closure costs, net of income taxes 0 0 0 1.56 2.61
Settlement charges related to the Patriot bankruptcy reorganization, net of income taxes 0 0 0 0.07 0
Remeasurement (benefit) expense related to foreign income tax accounts (0.01) 0 0 (0.17) 0.03
Adjusted Diluted EPS (3) $(0.19) $(0.39) $(0.14) $0.34 $0.84
(1) Actual historical results.
(2) Range of targeted projected results.
(3) Non-GAAP financial measure defined on slide 2 of this presentation.
This information is intended to be reviewed in conjunction with the company’s filings with the Securities and Exchange Commission.
5/28/14
31