Attached files
| file | filename |
|---|---|
| 8-K - 8-K - ILG, LLC | a14-13535_18k.htm |
Exhibit 99.1
|
|
Investor Presentation MAY 2014 |
|
|
2 SAFE HARBOR STATEMENT This presentation may contain “forward-looking statements” within the meaning of the Private Securities Litigation Reform Act of 1995. These forward-looking statements include statements relating to the anticipated financial performance, business prospects, new developments, and similar matters of/relating to Interval Leisure Group, Inc. (“ILG”), and/or statements that use words such as “anticipates,” “estimates,” “expects,” “intends,” “plans,” “believes,” and similar expressions. These forward-looking statements are based on management’s current expectations and assumptions, which are inherently subject to uncertainties, risks, and changes in circumstances that are difficult to predict. Actual results could differ materially from those contained in the forward-looking statements included herein for a variety of reasons, including, among others: adverse trends in economic conditions generally or in the vacation ownership, vacation rental, and travel industries; adverse changes to, or interruptions in, relationships with third parties; lack of available financing for, or insolvency or consolidation of developers; decreased demand from prospective purchasers of vacation interests; travel-related health concerns; changes in our senior management; regulatory changes; our ability to compete effectively and successfully introduce new products and services; our ability to successfully manage and integrate acquisitions, impairments of assets, the restrictive covenants in our revolving credit facility, adverse trends in key vacation destinations; business interruptions in connection with our technology systems; ability of managed homeowners’ associations to collect sufficient maintenance fees; third parties not repaying loans or extensions of credit; failure to consummate a previously announced transaction; and our ability to expand successfully in international markets and manage risks related to international operations. Certain of these and other risks and uncertainties are discussed in ILG’s filings with the Securities and Exchange Commission, including in its reports on Form 10-K and Form 10-Q. Other unknown or unpredictable factors also could have a material adverse effect on ILG’s business, financial condition, and results of operations. In light of these risks and uncertainties, these forward-looking statements may not occur. Accordingly, you should not place undue reliance on these forward-looking statements, which only reflect the views of ILG management as of the date of this presentation. ILG does not undertake to update these forward-looking statements. The “Hyatt Residence Club” and “Hyatt Residential Group” trademarks are owned by Hyatt and are being used under license. |
|
|
3 TODAY’S DISCUSSION Who We Are Investment Case Strategic Initiatives Financials Valuation |
|
|
MEMBERSHIP TYPES Traditional Corporate MEMBERSHIP LEVELS Platinum/Gold/Basic 4 ILG: WHO WE ARE Multi-platform, diversified leader in non-traditional lodging TRANSACTIONS Exchange Getaway MEMBERSHIP AND EXCHANGE PLATFORM FOR GROWTH MANAGEMENT AND RENTALS HRG PROPERTY MANAGEMENT & RENTALS Shared Ownership Condo/Hotel/Resorts Club Services Resort Management Development Sales & Marketing Financing OTHER Developer Support Services |

|
|
5 Creating an innovative model in non-traditional lodging ILG: INVESTMENT CASE Concentration on fee-for-service, cash-generative, and asset-light businesses UNIQUE, RESILIENT BUSINESS MODEL ~2 million members ~2,900 resorts in Interval Network Top-tier developer relationships ~250 resorts under management Global presence LEADING INDUSTRY POSITION STRONG BALANCE SHEET AND CASH FLOW Capital allocation priorities designed to drive shareholder value and cash generation STRATEGIC CAPITAL ALLOCATION More than 125 years of combined senior management experience with the company Demonstrated ability to perform through prior economic downturns HIGHLY EXPERIENCED MANAGEMENT TEAM Strong recurring revenue component Multi-faceted, diversified structure Low CapEx Healthy margins 2009 2010 2011 2012 2013 Net Debt/Adjusted EBITDA 1.59x 1.16x 0.95x 1.01x 1.23x Interest Expense Ratio 3.97x 4.26x 4.28x 6.13x 26.94x Return on Invested Capital 6.60% 7.30% 7.00% 2.30% 9.90% Return on Assets 3.90% 4.30% 4.20% 4.50% 7.90% Free Cash Flow (in $ Millions) $72.2 $75.0 $82.9 $65.4 $95.2 All terms are defined in the Glossary of Terms |
|
|
6 ILG: STRATEGIC INITIATIVES INITIATIVE: Grow Revenue, EBITDA, and Cash Flow Tactic: Invest in internal opportunities Tactic: Expand capabilities through strategic acquisitions INITIATIVE: Strategic Diversification Tactic: Acquire broad footprint in non-traditional lodging with a focus on shared ownership Tactic: Add proprietary branded club system including management, development, financing, sales and marketing INITIATIVE: Optimize Organizational Structure Tactic: Evaluate and implement efficiencies Drive long-term growth from a diverse foundation GOALS |

|
|
7 ILG: STRATEGIC INITIATIVES Create an opportunity greater than the sum of its parts Development & Financing Sales & Marketing Property Management & Rentals Club Services & Management Exchange Developer Support Services THE VACATION SYSTEM |

|
|
8 Announced May 2014 Anticipated close Q4 2014 Purchase price ~$190 million PLUS Reimbursement of Hyatt Ka’anapali Beach venture contributions estimated at $35 million* RECENTLY ANNOUNCED TRANSACTION Establishes Vacation System foundation with leading consumer brand Redefines ILG’s role in shared ownership industry Provides a platform for long-term growth Focus on fee-for-service revenue streams Relationship of more than 20 years with ILG = strong cultural fit Benefit Deal Terms Investment Thesis Sources of Value Adjusted EBITDA contribution of $20 – $25 million in 2015 ~$185 million fair value of tangible assets,** including ~$60 million in fair value of built inventory ~$15 – $20 million in NPV of expected future cash savings due to a section 338(h)(10) tax election Exclusive master license for the Hyatt brand in shared ownership Portfolio of management contracts *Amount represents reimbursement of Hyatt contribution based on early Q4 2014 close, with an additional $10 million estimated investment by ILG **As of March 2014, reflects ILG’s estimate of fair value of ~$60 million in fair value of built inventory, excluding Hyatt Ka’anapali Beach, ~$40 million in receivables and ~$85 million in property, plant, and other |

|
|
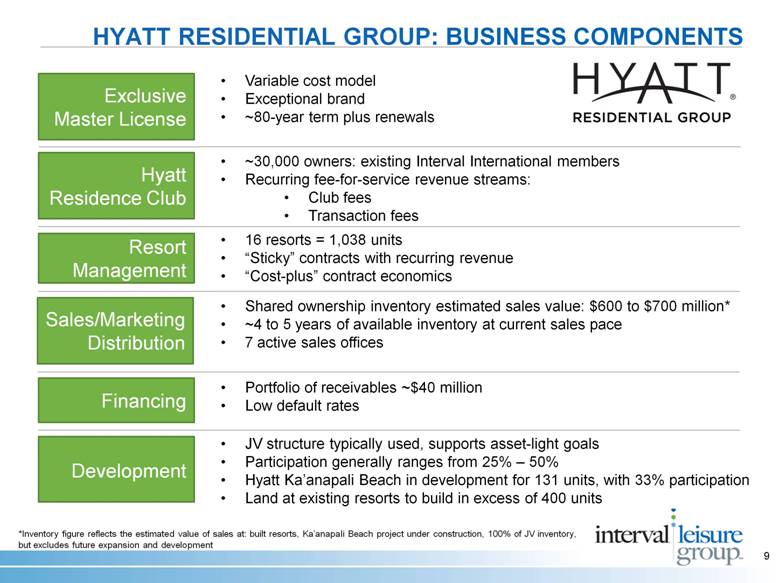
9 Hyatt Residence Club Sales/Marketing Distribution Development Variable cost model Exceptional brand ~80-year term plus renewals ~30,000 owners: existing Interval International members Recurring fee-for-service revenue streams: Club fees Transaction fees Shared ownership inventory estimated sales value: $600 to $700 million* ~4 to 5 years of available inventory at current sales pace 7 active sales offices 16 resorts = 1,038 units “Sticky” contracts with recurring revenue “Cost-plus” contract economics Exclusive Master License Financing Resort Management JV structure typically used, supports asset-light goals Participation generally ranges from 25% – 50% Hyatt Ka’anapali Beach in development for 131 units, with 33% participation Land at existing resorts to build in excess of 400 units Portfolio of receivables ~$40 million Low default rates HYATT RESIDENTIAL GROUP: BUSINESS COMPONENTS *Inventory figure reflects the estimated value of sales at: built resorts, Ka’anapali Beach project under construction, 100% of JV inventory, but excludes future expansion and development |
|
|
EXCLUSIVE MASTER LICENSE: Royalty-Fee Structure 10 HYATT RESIDENTIAL GROUP: BUSINESS COMPONENTS More than 40% of adjusted EBITDA is derived from recurring revenue ~24% ~17% ~33% ~26% % of applicable revenue VOI sales Club fees Rentals on Hyatt reservation system Resort management fees 1.5% 3.0% 5.0% 9.0% |
|
|
11 1995: Hyatt opens first vacation club property 1998 – 2010: Adds 14 resorts 2010: Rebranded Hyatt Residence Club 2014: Hyatt Ka’anapali Beach scheduled to open at year end 16 total resorts HYATT RESIDENTIAL GROUP: BUSINESS COMPONENTS Insert HRC ownership benefits History in Shared Ownership Headquarters Headcount HRC Ownership Benefits St. Petersburg, Florida ~800 employees ~30,000 owners Deeded interests that convert to points in the Hyatt Residence Club Hyatt Residence Club points can be exchanged for: Stays at 16 HRC properties Stays at Interval International affiliated resorts Hyatt Gold Passport points |

|
|
1 1 1 1 1 12 HYATT RESIDENCE CLUB HYATT SUNSET HARBOR RESORT Key West, Florida 16 RESORTS HYATT PIÑON POINTE Sedona, Arizona 3 2 2 1 1 1 HIGHLANDS INN, A HYATT RESIDENCE CLUB RESORT Carmel, California HYATT KA’ANAPALI BEACH Maui, Hawaii 1 Arizona, California, Colorado, Florida, Hawaii, Puerto Rico, Texas HYATT COCONUT PLANTATION RESORT Bonita Springs, Florida HYATT GRAND ASPEN Aspen, Colorado |

|
|
13 ILG HRG = LONG-TERM PLATFORM FOR GROWTH Add resorts to the system through joint ventures and tuck-in acquisitions, leading to fee-for-service revenue related to sales, marketing, and management services Expanded exchange and management opportunities Leverage Hyatt Residential Group sales and marketing expertise to recycle inventory through secondary sales |
|
|
RECENT TRANSACTION: VRI EUROPE Price: US ~$95 million 75.5% of joint-venture equity Closed November 2013 14 A track record of strategic and disciplined expansion Deal Terms Investment Thesis Expand fee-for-service business Broadening footprint internationally Added 21 resorts under management Capital Allocation Use of tax-trapped cash EBITDA accretive |

|
|
15 RECENT TRANSACTION: AQUA HOSPITALITY Price: ~$38 million Closed December 2013 Deal Terms Investment Thesis Expand fee-for-service business Highly desirable destination Synergies with Aston Hotels & Resorts Doubled available room nights Capital Allocation Increase profitability by reducing costs across combined entity Portfolio of properties complements existing offerings EBITDA accretive A track record of strategic and disciplined expansion |

|
|
16 Financials |
|
|
OPERATING METRICS 17 Source: Company management Notes: (1) Refer to definitions contained in the Glossary of Terms Revenue and active members in millions Available room nights in thousands (2) RevPAR for Q4-2013 and Q1-2014 includes the contributions from Aqua Hospitality subsequent to our acquisition Standalone Aston RevPAR for Q4-2013 was $122.10 and for Q1-2014 was $167.89 (2) FY FY FY 1Q 2Q 3Q 4Q FY 1Q Key Metrics (1) Consolidated Revenue $ 409.4 $ 428.8 $ 473.3 $ 134.9 $ 125.0 $ 119.2 $ 122.2 $ 501.2 $ 157.0 Membership and Exchange Total Membership & Exchange Revenue $ 345.2 $ 349.4 $ 357.7 $ 102.1 $ 95.5 $ 86.6 $ 80.8 $ 365.0 $ 95.3 Transaction-Fee Revenue $ 191.0 $ 192.3 $ 198.4 $ 61.1 $ 50.2 $ 46.0 $ 41.6 $ 198.9 $ 56.1 Membership-Fee Revenue $ 129.8 $ 129.5 $ 130.8 $ 33.4 $ 36.8 $ 32.3 $ 32.7 $ 135.2 $ 31.8 Total Active Members 1.80 1.78 1.82 1.83 1.82 1.82 1.82 1.82 1.82 Average Revenue per Member $ 181.36 $ 182.71 $ 182.39 $ 52.79 $ 48.59 $ 44.06 $ 41.65 $ 187.13 $ 49.30 Management and Rental Total Management & Rental Revenue $ 64.2 $ 79.4 $ 115.6 $ 32.8 $ 29.5 $ 32.5 $ 41.4 $ 136.2 $ 61.7 Available Room Nights 1,613 1,537 1,497 349 364 381 442 1,537 736 RevPAR $ 95.79 $ 111.43 $ 130.28 $ 166.39 $ 129.17 $ 145.53 $ 119.48 $ 138.90 $ 141.45 Year-to-Year Change Consolidated Revenue 1.1% 4.7% 10.4% 6.4% 5.3% 1.7% 10.3% 5.9% 16.4% Membership and Exchange Total Membership & Exchange Revenue (0.2%) 1.2% 2.4% 1.2% 6.5% 0.6% (0.3%) 2.0% (6.6%) Transaction-Fee Revenue 0.6% 0.7% 3.2% 0.0% 2.2% (1.2%) (0.1%) 0.3% (8.2%) Membership-Fee Revenue (1.7%) (0.3%) 1.0% 2.3% 13.2% (0.7%) (1.2%) 3.4% (4.6%) Total Active Members (1.8%) (1.3%) 2.4% (0.6%) (2.1%) (2.2%) (0.6%) (0.6%) (0.5%) Average Revenue per Member 3.3% 0.7% (0.2%) 0.9% 7.7% 1.2% 0.8% 2.6% (6.6%) Management and Rental Total Management & Rental Revenue 8.8% 23.6% 45.7% 26.9% 1.8% 4.6% 39.3% 17.8% 88.2% Available Room Nights 2.0% (4.7%) (2.6%) (5.4%) (3.2%) 0.0% 19.1% 2.7% 110.9% RevPAR 4.7% 16.3% 16.9% 15.7% 9.9% 8.2% (4.9%) 6.6% (15.0%) 2010 2011 2012 2013 2014 |
|
|
18 FIRST QUARTER 2014 FINANCIAL PERFORMANCE Notes: (1) As of April 8, 2014, maximum is 3.50x (2) As of April 8, 2014, minimum is 3.00x Q1 2013 Q1 2014 Change CONSOLIDATED REVENUE $134.9 $157.0 16.4% Membership and Exchange 102.1 95.3 (6.6%) Management and Rental 32.8 61.7 88.2% CONSOLIDATED ADJUSTED EBITDA $51.8 $50.3 (2.9%) Membership and Exchange 45.8 38.5 (15.9%) Management and Rental 6.0 11.8 97.6% SELECTED DATA AS OF MARCH 31 2013 2014 Cash $132.5 $64.9 $240.0 $248.0 Consolidated Total Leverage Ratio (1) 1.35x 1.27x Consolidated Interest Coverage Ratio (2) 9.95x 32.56x ($MM) Debt |
|
|
19 2013 FINANCIAL PERFORMANCE Notes: (1) As of December 31, 2013, maximum is 3.50x (2) As of December 31, 2013, minimum is 3.00x FY2012 FY2013 Change CONSOLIDATED REVENUE $473.3 $501.2 5.9% Membership and Exchange 357.7 365.0 2.0% Management and Rental 115.6 136.2 17.8% CONSOLIDATED ADJUSTED EBITDA $157.1 $166.2 5.8% Membership and Exchange 142.7 146.9 3.0% Management and Rental 14.4 19.3 34.2% SELECTED DATA AS OF DECEMBER 31 2012 2013 Cash $101.2 $48.5 Debt $260.0 $253.0 Consolidated Total Leverage Ratio (1) 1.51x 1.25x Consolidated Interest Coverage Ratio (2) 6.97x 31.37x ($MM) |
|
|
20 20 2009 – 2013 CAGR 5.5% Source: Company management Notes: (1) Refer to non–GAAP reconciliation in the Glossary of Terms (2) Free cash flow calculated as net cash provided by operating activities less CapEx; refer to the Glossary of Terms ($MM) ($MM) CapEx ($MM) Free Cash Flow (2) ($MM) 2009 – 2013 CAGR 2.9% Revenue Adjusted EBITDA(1) HISTORICAL FINANCIAL DATA 2009 2010 2011 2012 2013 |

|
|
21 NON–GAAP RECONCILIATION (Q1) ($MM) Membership and Exchange Management and Rental Consolidated Membership and Exchange Management and Rental Consolidated Adjusted EBITDA $45.8 $6.0 $51.8 $38.5 $11.8 $50.3 Non cash compensation expense (2.3) (0.3) (2.6) (2.6) (0.3) (2.8) Other non operating income (expense), net (0.3) (0.2) (0.5) - (0.2) (0.1) Acquisition-related and restructuring costs (0.2) (0.5) (0.8) (0.4) (0.9) (1.2) EBITDA 43.0 5.0 47.9 35.6 10.5 46.1 Amortization expense of intangibles (0.3) (1.7) (2.0) (0.3) (2.6) (3.0) Depreciation expense (3.3) (0.3) (3.7) (3.3) (0.5) (3.8) Less: net income attributable to noncontrolling interest - - - - 1.0 1.0 Less: other non operating income (expense), net 0.3 0.2 0.5 - 0.2 0.1 Operating income $39.7 $3.1 42.8 $31.9 $8.5 40.4 Interest income 0.2 - Interest expense (1.7) (1.3) . . Other non operating expense, net (0.5) (0.1) Income tax provision (15.8) (14.3) Net income 25.0 24.7 Net income attributable to noncontrolling interest - (1.0) Net income attributable to common stockholders $25.0 $23.7 Three Months Ended March 31 2013 2014 |
|
|
22 Valuation |
|
|
23 FY 2014E EV/EBITDA 8.2x 12.1x 8.0x 11.1x 13.0x FY 2015E EV/EBITDA 8.4x 10.9x 7.5x 10.4x 11.9x Source: Thomson ONE FirstCall mean EBITDA estimates; enterprise value calculated as of 05/23/14 VALUATION: PEER COMPARISON Business Components IILG VAC DRII WYN HOT Exchange Membership Hotel Management Shared Ownership Management Shared Ownership Upper Upscale Brand Development Sales & Marketing Consumer Financing |
|
|
24 |

|
|
25 GLOSSARY OF TERMS Acquisition-related and restructuring costs: Represents transaction fees, costs incurred in connection with performing due diligence, subsequent adjustments to our initial estimate of contingent consideration obligations associated with business acquisitions, and other direct costs related to acquisition activities. Additionally, this item includes certain restructuring charges primarily related to workforce reductions and estimated costs of exiting contractual commitments. Adjusted EBITDA: EBITDA, excluding, if applicable: (1) non-cash compensation expense, (2) goodwill and asset impairments, (3) acquisition related and restructuring costs, (4) other non-operating income and expense (including loss on extinguishment of debt), and (5) the impact of correcting prior period items. The company’s presentation of adjusted EBITDA may not be comparable to similarly titled measures used by other companies. Ancillary member revenue: Other Interval Network member-related revenue including insurance and travel-related services. Available room nights: Number of nights available for rental by Aston and Aqua at managed vacation properties during the period, which excludes all rooms under renovation. Average revenue per member: Membership fee revenue, transaction revenue and ancillary member revenue for the Interval Network for the applicable period, divided by the monthly weighted average number of Interval Network active members during the applicable period. Consolidated interest coverage ratio: Calculated as consolidated EBITDA over consolidated interest expense, as defined in our amended credit agreement. Consolidated total leverage ratio: Calculated as consolidated debt, less credit given for a portion of foreign cash, over consolidated EBITDA, as defined in our amended credit agreement at such date. EBITDA: Net income attributable to common stockholders excluding, if applicable: (1) interest income and interest expense, (2) income taxes, (3) depreciation expense, and (4) amortization expense of intangibles. Free cash flow: Cash provided by operating activities less capital expenditures. |
|
|
26 GLOSSARY OF TERMS Gross lodging revenue: Total room revenue collected from all Aston- and Aqua-managed occupied rooms during the period. Aqua occupied rooms are included only from the acquisition date. Interest expense ratio: Calculated as interest expense, net of capitalized interest, over adjusted EBITDA Management fee and rental revenue: Represents revenue earned by our Management and Rental segment exclusive of pass-through revenue. Membership-fee revenue: Represents fees paid for membership in the Interval Network. Net debt/adjusted EBITDA: Calculated as total debt, less cash and cash equivalents, over adjusted EBITDA. Pass-through revenue: Represents the compensation and other employee-related costs directly associated with management of the properties and homeowners’ associations that are included in both revenue and cost of sales and that are passed on to the property owners and homeowners’ associations without mark-up. Management believes presenting gross margin without these expenses provides management and investors a relevant period-over-period comparison. Return on assets: Calculated as net income attributable to common stockholders over total assets. Return on invested capital: Calculated as net income attributable to common stockholders less cash dividends paid, over total debt plus total equity. RevPAR: Gross lodging revenue divided by available room nights during the period for Aston and Aqua. Total active members: Active members of the Interval Network as of the end of the period. Active members are members in good standing who have paid membership fees and any other applicable charges in full as of the end of the period, or are within the allowed grace period. Transaction revenue: Interval Network transactional and service fees paid primarily for exchanges, Getaways, and reservation servicing. |