Attached files
| file | filename |
|---|---|
| 8-K - FORM 8-K - FIRST CAPITAL BANCORP, INC. | d732010d8k.htm |
Exhibit 99.1
|
|

Exhibit 99.1
CAPITAL BANCORP ANNUAL SHAREHOLDERS MEETING
MAY 21, 2014
|
|
FORWARD LOOKING STATEMENTS
Readers are cautioned that this presentation contains forward-looking statements made pursuant to safe harbor provisions of the Private Securities Litigation Reform Act of 1995. Such forward-looking statements are based on management’s current knowledge, assumptions, and analyses, which it believes are appropriate in the circumstances regarding future events, and may address issues that involve significant risks including, but not limited to: changes in interest rates; changes in accounting principles, policies, or guidelines; significant changes in general economic, competitive, and business conditions; significant changes in or additions to laws and regulatory requirements; and significant changes in securities markets. Additionally, such aforementioned uncertainties, assumptions, and estimates may cause actual results to differ materially from the anticipated results or other expectations expressed in the
forward-looking statements.
|
|
ECONOMIC REVIEW
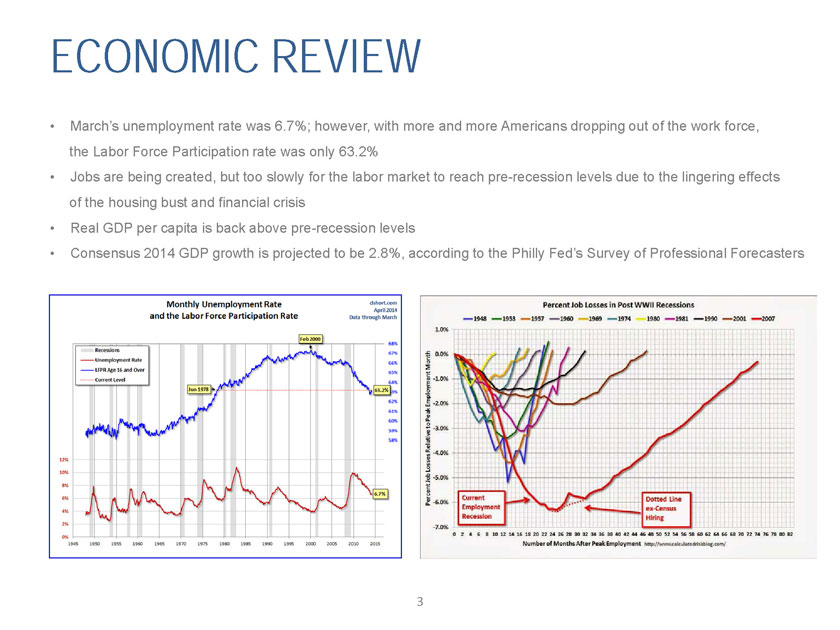
March’s unemployment rate was 6.7%; however, with more and more Americans dropping out of the work force, the Labor Force Participation rate was only 63.2%
Jobs are being created, but too slowly for the labor market to reach pre-recession levels due to the lingering effects of the housing bust and financial crisis
Real GDP per capita is back above pre-recession levels
Consensus 2014 GDP growth is projected to be 2.8%, according to the Philly Fed’s Survey of Professional Forecasters
| 3 |
|
|
|
| 4 |
|
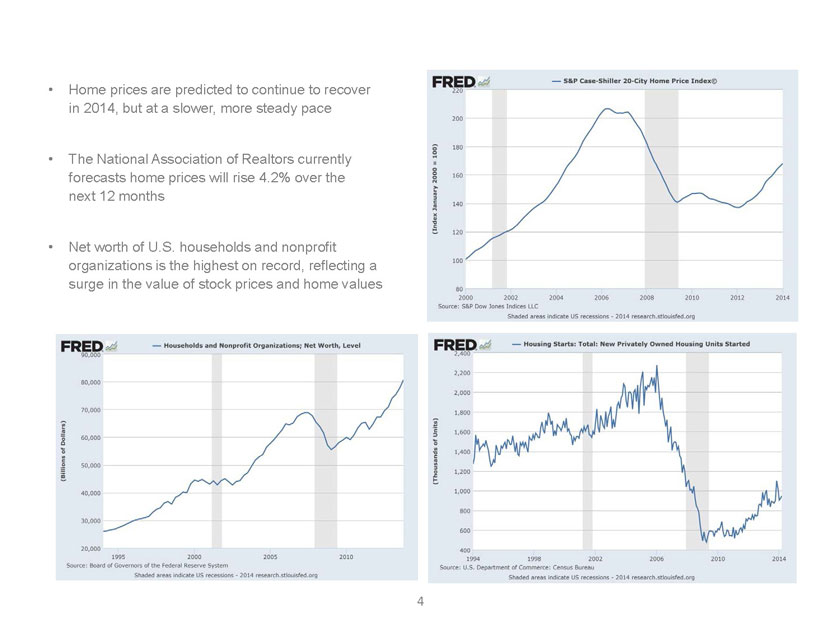
Home prices are predicted to continue to recover in 2014, but at a slower, more steady pace
The National Association of Realtors currently forecasts home prices will rise 4.2% over the next 12 months
Net worth of U.S. households and nonprofit organizations is the highest on record, reflecting a surge in the value of stock prices and home values
|
|
| 5 |
|
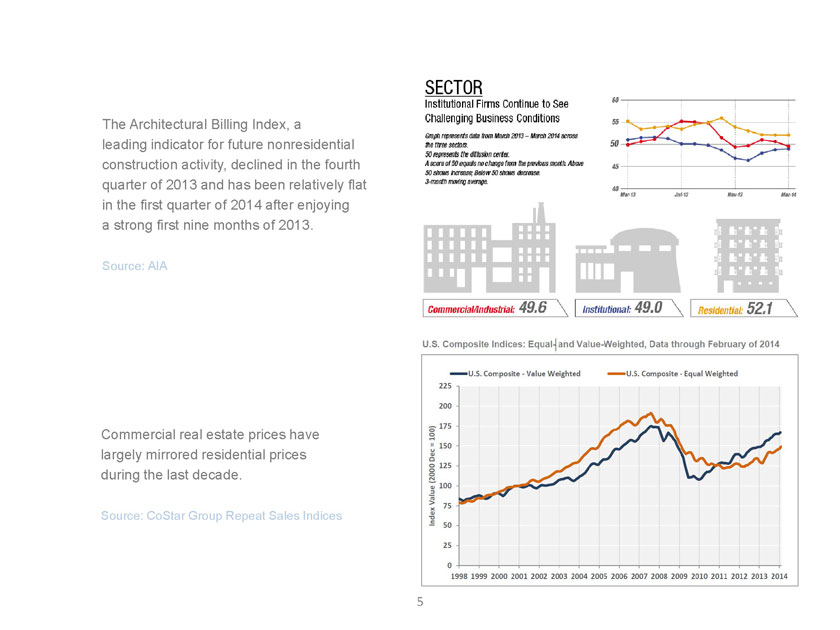
The Architectural Billing Index, a |
leading indicator for future nonresidential construction activity, declined in the fourth quarter of 2013 and has been relatively flat in the first quarter of 2014 after enjoying
a strong first nine months of 2013.
Source: AIA
Commercial real estate prices have largely mirrored residential prices
during the last decade.
Source: CoStar Group Repeat Sales Indices
|
|
| 6 |
|
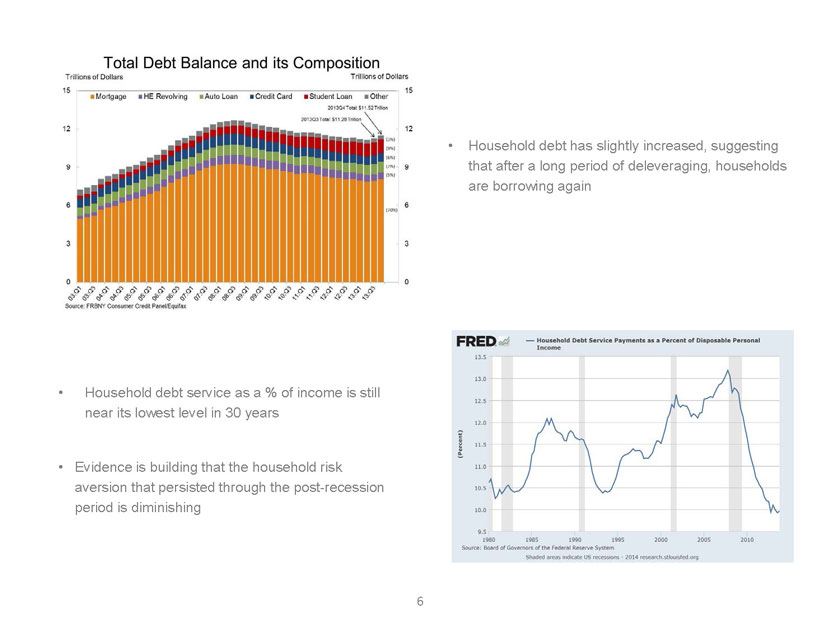
Household debt has slightly increased, suggesting that after a long period of deleveraging, households are borrowing again
Household debt service as a % of income is still near its lowest level in 30 years
Evidence is building that the household risk aversion that persisted through the post-recession period is diminishing
|
|
| 7 |
|
|
|
| 8 |
|
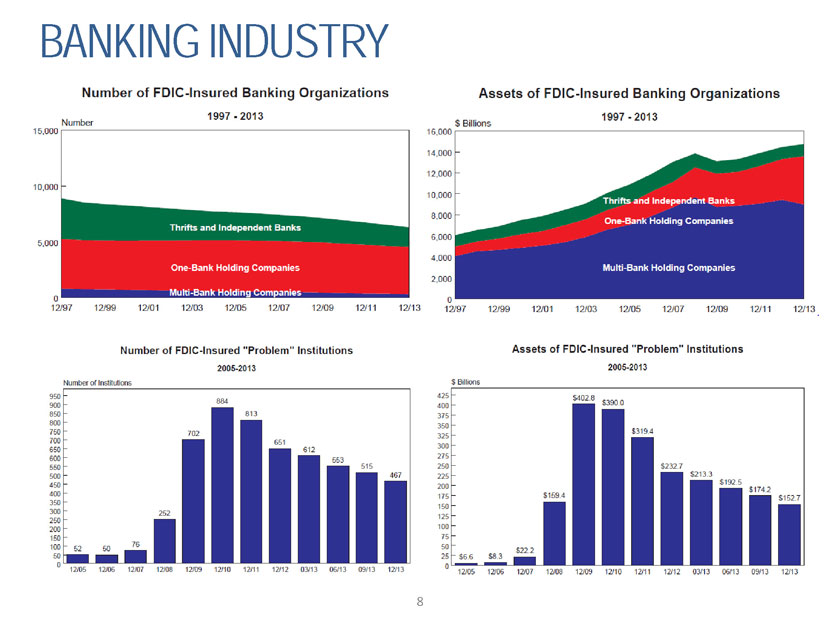
BANKING INDUSTRY |
|
|
9
|
|
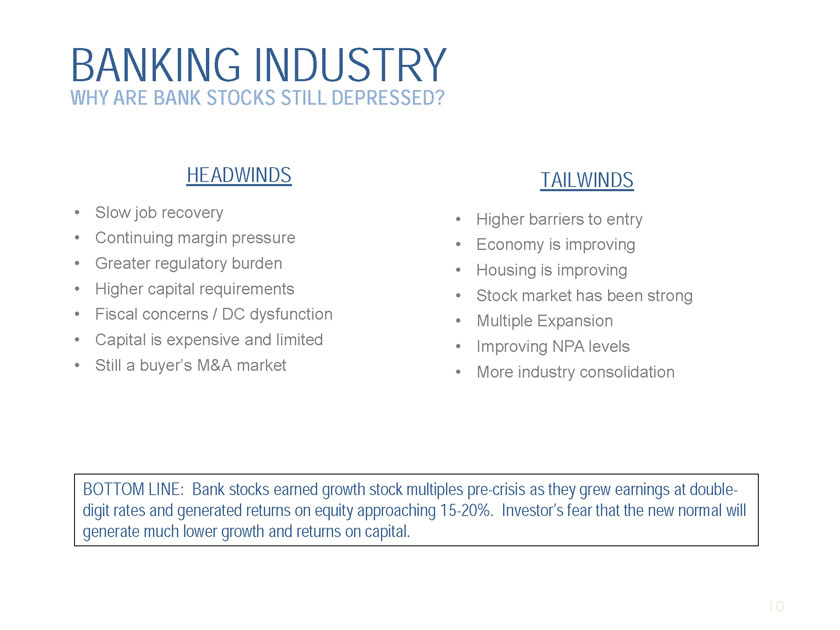
BANKING INDUSTRY
WHY ARE BANK STOCKS STILL DEPRESSED?
HEADWINDS TAILWINDS
Slow job recovery
Continuing margin pressure
Greater regulatory burden
Higher capital requirements
Fiscal concerns / DC dysfunction
Capital is expensive and limited
Still a buyer’s M&A market
Higher barriers to entry
Economy is improving
Housing is improving
Stock market has been strong
Multiple Expansion
Improving NPA levels
More industry consolidation
BOTTOM LINE: Bank stocks earned growth stock multiples pre-crisis as they grew earnings at double-digit rates and generated returns on equity approaching 15-20%. Investor’s fear that the new normal will generate much lower growth and returns on capital.
10
|
|
2013 IN REVIEW
Net Income of $3.9 Million – the most profitable year in the Company’s history
Loan growth, net of the allowance for loan losses, of $54.2 Million, or 14.70%, despite a
highly competitive market
An increase in the 2013 Net Interest Margin to 3.64%, as compared to 3.39% for 2012
An increase in the average balance of non-interest bearing Demand Deposits of $12.1 Million or 24.31%
(a key component of “core deposits” and a strategic initiative of the Bank)
Closing the year with an Allowance for Loan Losses at $8.2 Million or 1.89% of
total loans, as compared to $7.3 Million or 1.93% of total loans at FYE 2012
Reducing 30-89 days past due loans to $987 thousand or .23% of the overall loan portfolio
|
|
2013 IN REVIEW (Cont’d)
Continued improvement in the Bank’s Efficiency Ratio – a 2013 and 2014 strategic initiative
An employee turnover ratio of less than 5%—significantly outperforming industry standards
Triggering a strategic initiative to complete the redemption of the Company’s remaining
TARP-related securities
Building a successful foundation for implementing a new marketing and branding campaign
for the Bank
|
|
DRIVING SHAREHOLDER VALUE
FIVE MISSION-CRITICAL ELEMENTS
Earnings
Growth
Asset Quality
Capital
Franchise Development
|
|
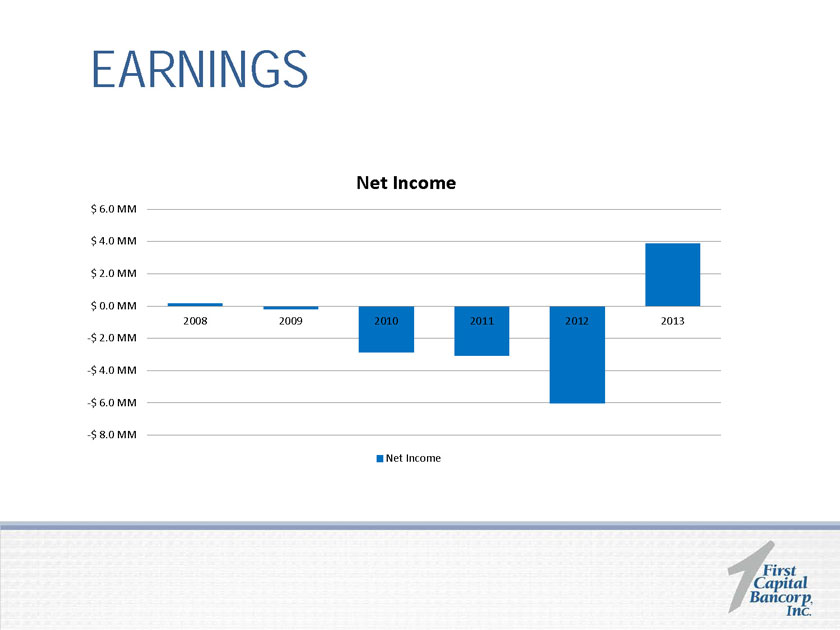
EARNINGS
-$ 8.0 MM
-$ 6.0 MM
-$ 4.0 MM
-$ 2.0 MM
$ 0.0 MM
$ 2.0 MM
$ 4.0 MM
$ 6.0 MM
2008
2009
2010
2011
2012
2013
Net Income
Net Income
|
|
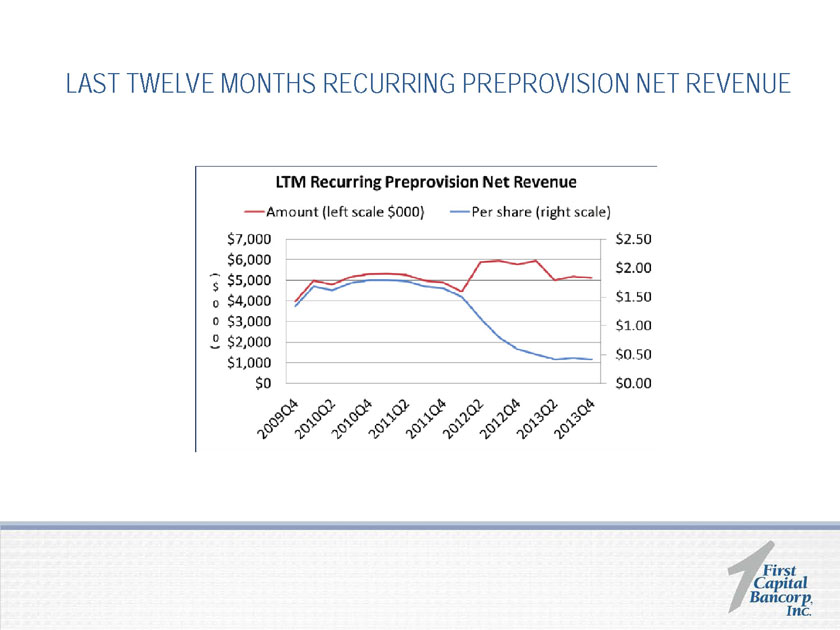
LAST TWELVE MONTHS RECURRING PREPROVISION NET REVENUE
|
|
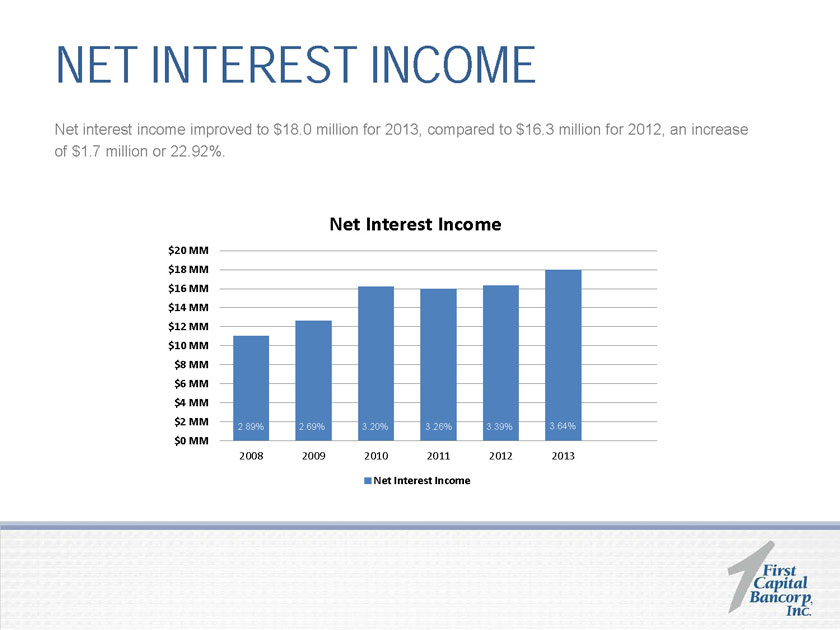
NET INTEREST INCOME
Net interest income improved to $18.0 million for 2013, compared to $16.3 million for 2012, an increase
of $1.7 million or 22.92%.
Net Interest Income
$0 MM
$2 MM
$4 MM
$6 MM
$8 MM
$10 MM
$12 MM
$14 MM
$16 MM
$18 MM
$20 MM
2008
2009
2010
2011
2012
2013
2014
Net Interest Income
2.89% 2.69%
2.89%
3.20%
3.26%
3.39%
3.64%
|
|
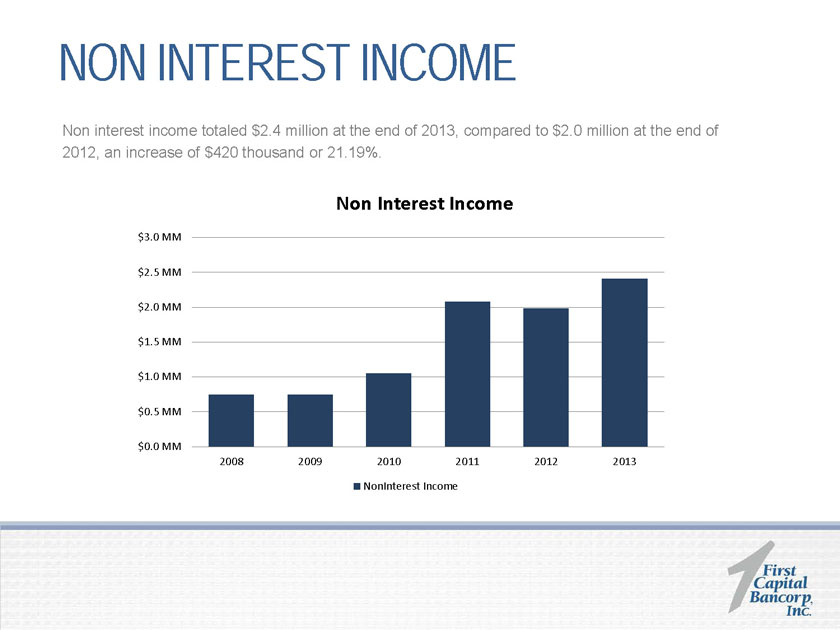
NON INTEREST INCOME Non interest income totaled $2.4 million at the end of 2013, compared to $2.0 million at the end of 2012, an increase of $420 thousand or 21.19%.
Non Interest Income
$0.0 MM
$0.5 MM
$1.0 MM
$1.5 MM
$2.0 MM
$2.5 MM
$3.0 MM
2008
2009
2010
2011
2012
2013
NonInterest Income
|
|
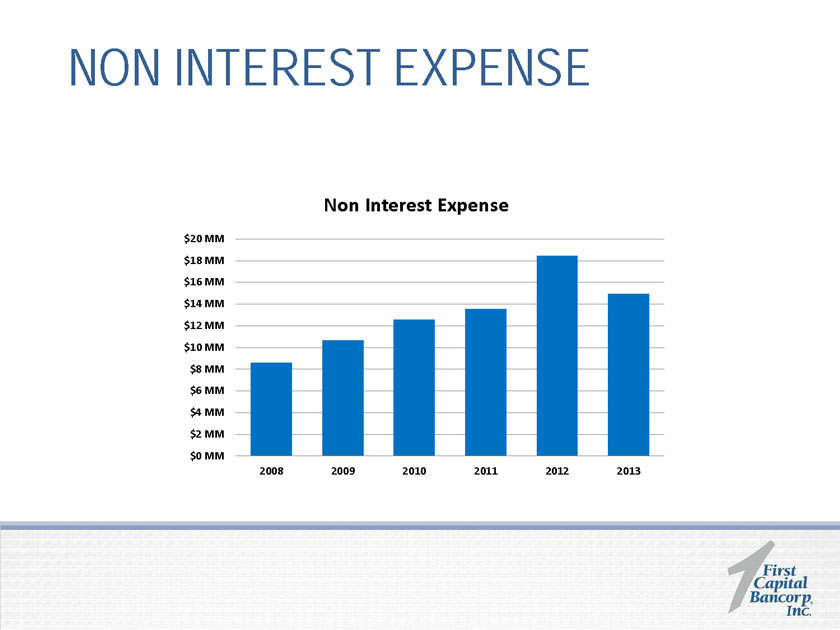
NON INTEREST EXPENSE
$0 MM
$2 MM
$4 MM
$6 MM
$8 MM
$10 MM
$12 MM
$14 MM
$16 MM
$18 MM
$20 MM
2008
2009
2010
2011
2012
2013
Non Interest Expense
|
|
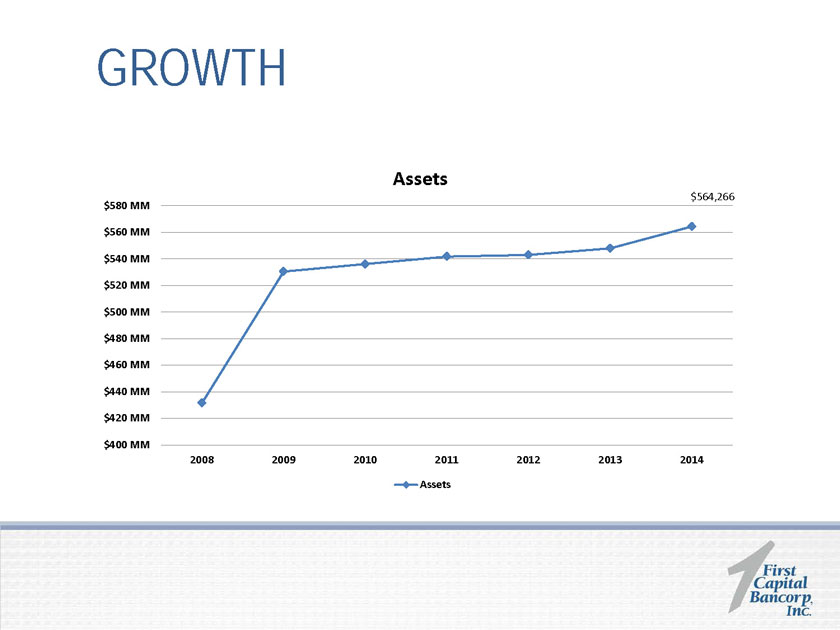
GROWTH
$564,266
$400 MM
$420 MM
$440 MM
$460 MM
$480 MM
$500 MM
$520 MM
$540 MM
$560 MM
$580 MM
2008
2009
2010
2011
2012
2013
2014Assets
Assets
|
|
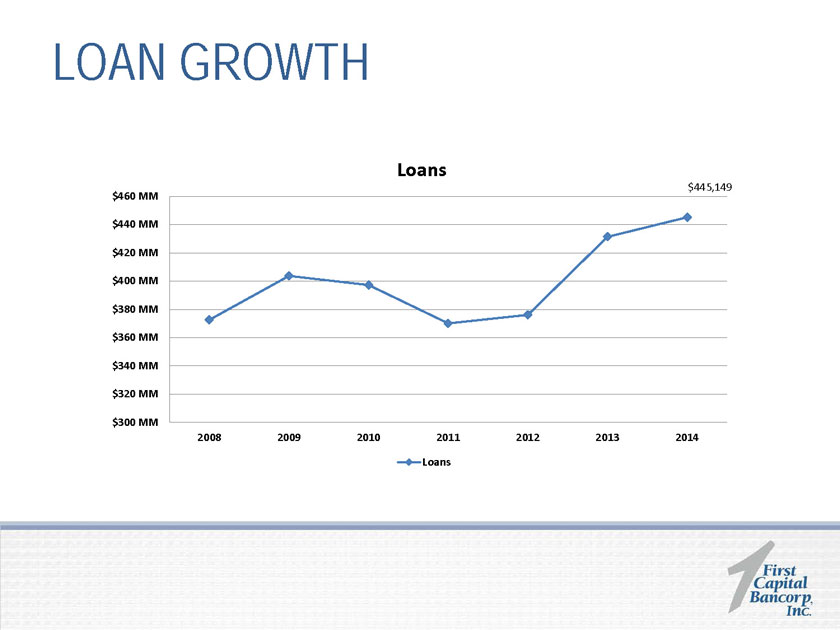
LOAN GROWTH
$445,149
$300 MM
$320 MM
$340 MM
$360 MM
$380 MM
$400 MM
$420 MM
$440 MM
$460 MM
2008
2009
2010
2011
2012
2013
2014Loans
Loans
|
|
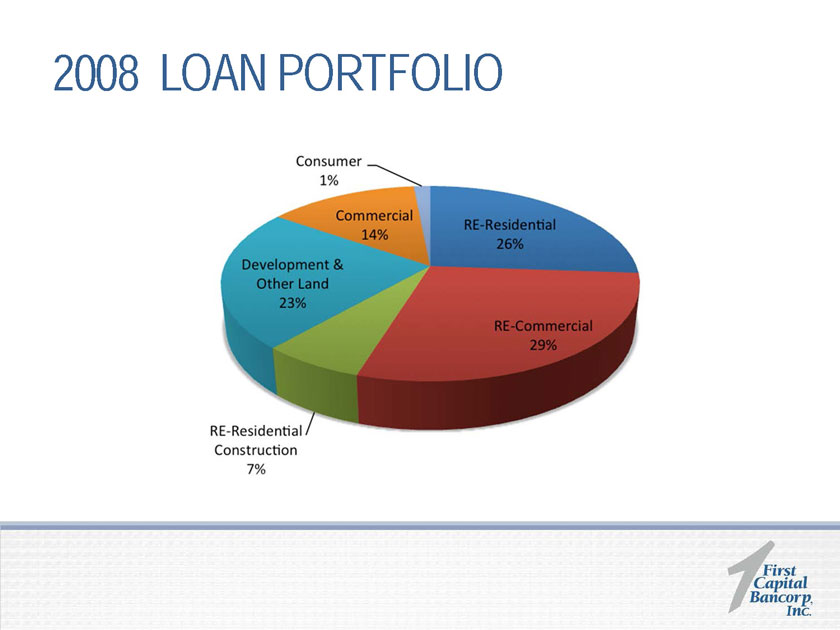
2008 LOAN PORTFOLIO
|
|
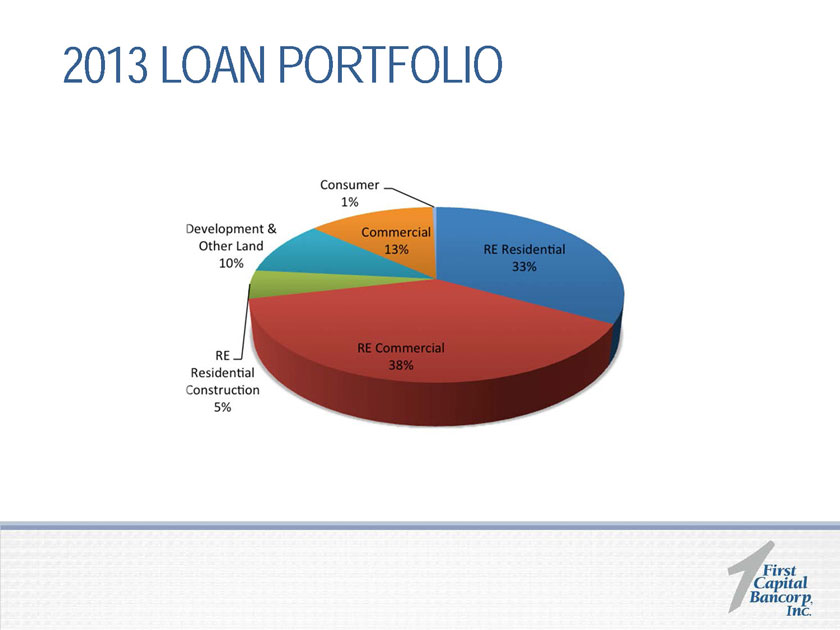
2013 LOAN PORTFOLIO
|
|
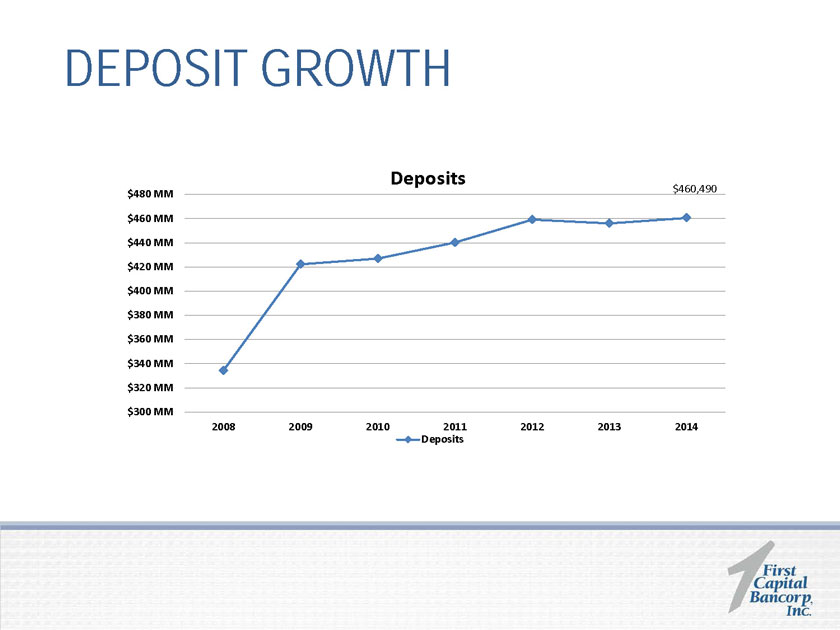
DEPOSIT GROWTH
$460,490
$300 MM
$320 MM
$340 MM
$360 MM
$380 MM
$400 MM
$420 MM
$440 MM
$460 MM
$480 MM
2008
2009
2010
2011
2012
2013
2014
Deposits
Deposits
|
|
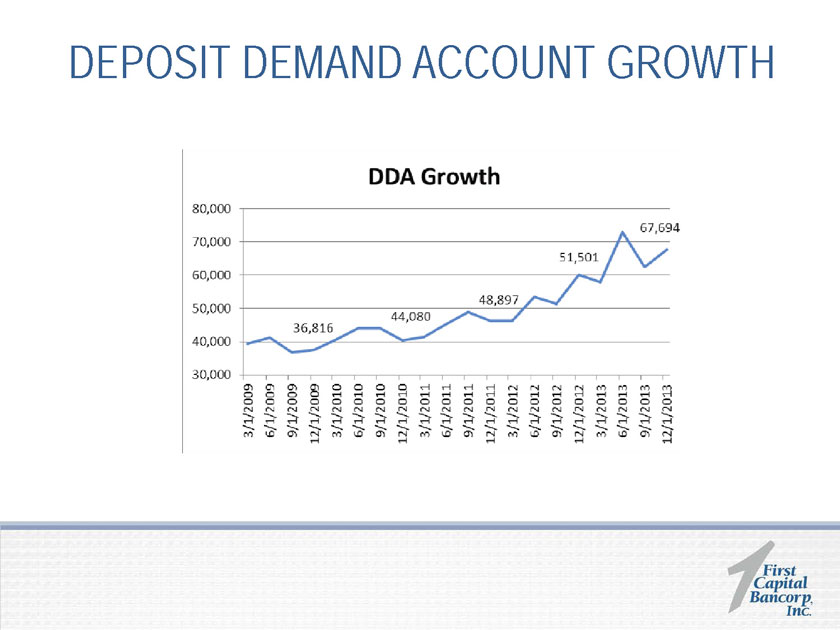
DEPOSIT DEMAND ACCOUNT GROWTH
|
|
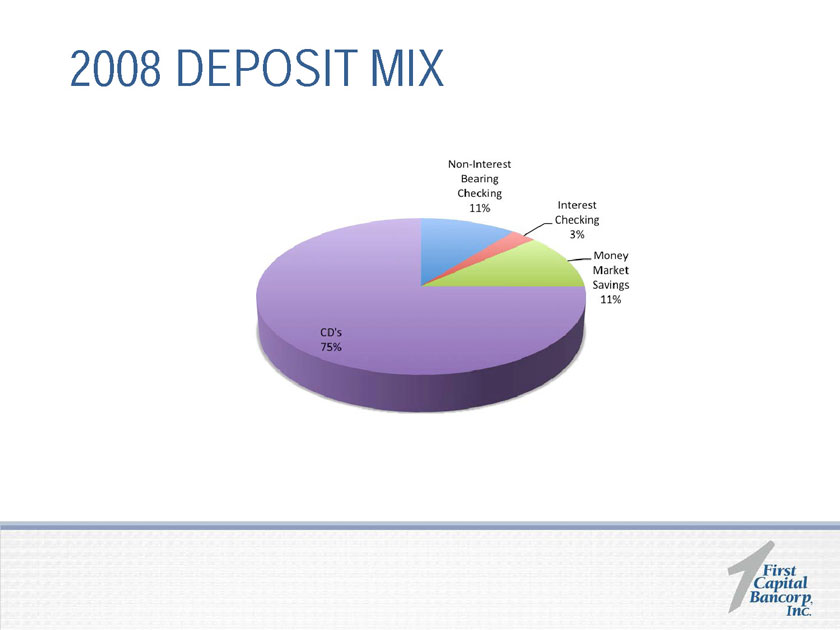
2008 DEPOSIT MIX
|
|
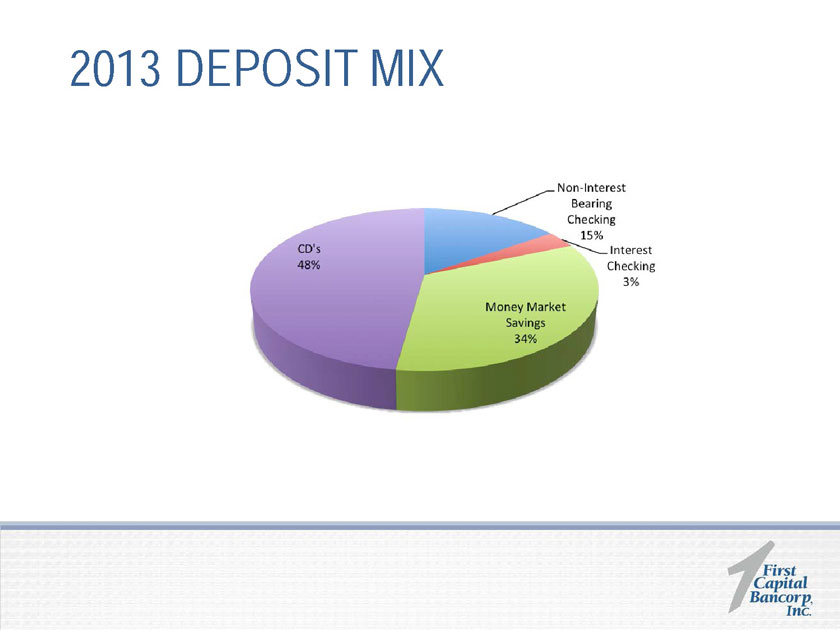
2013 DEPOSIT MIX
|
|
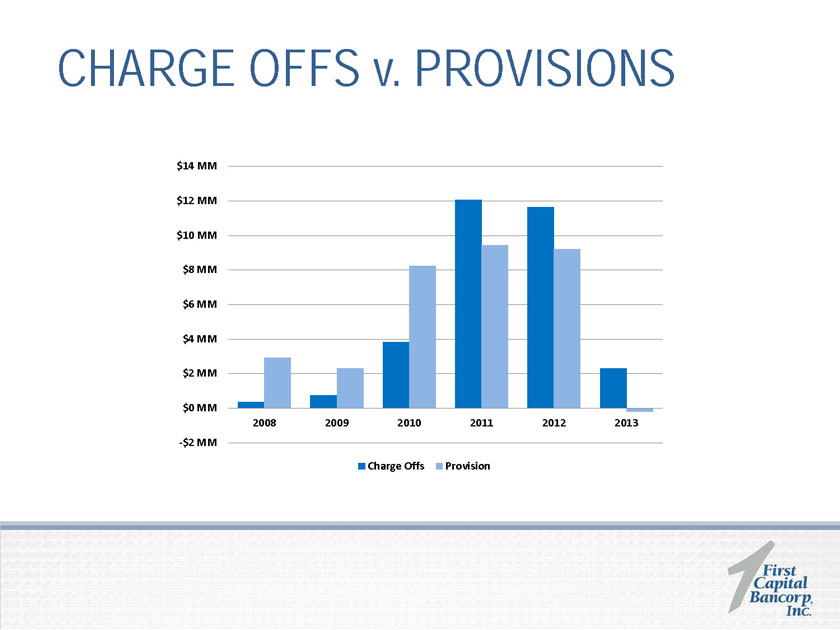
CHARGE OFFS v. PROVISIONS
-$2 MM
$0 MM
$2 MM
$4 MM
$6 MM
$8 MM
$10 MM
$12 MM
$14 MM
2008
2009
2010
2011
2012
2013
Charge Offs
Provision
|
|
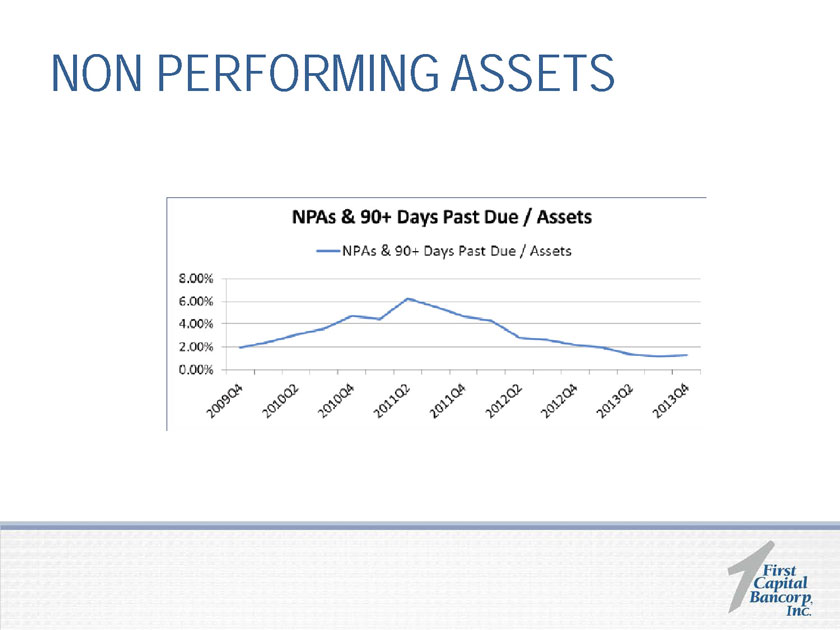
NON PERFORMING ASSETS
|
|
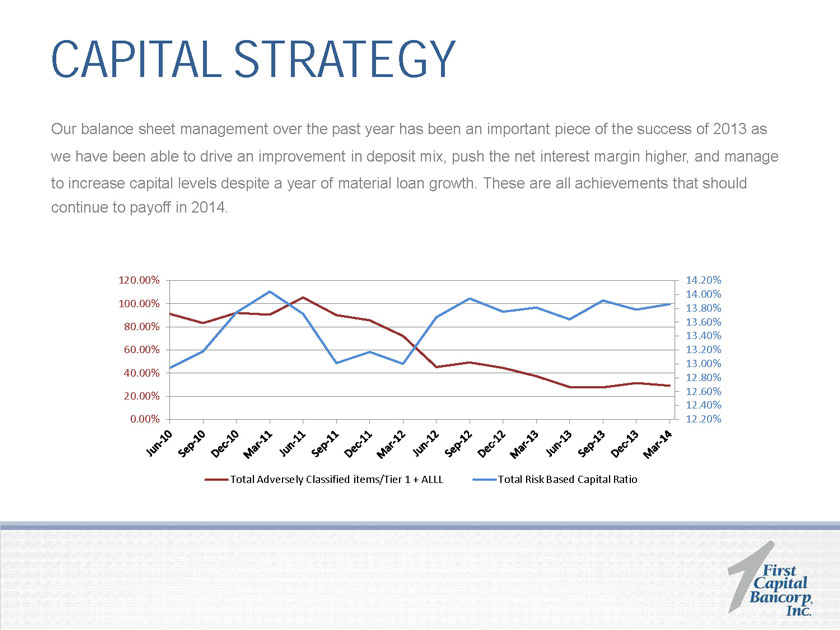
CAPITAL STRATEGY
Our balance sheet management over the past year has been an important piece of the success of 2013 as
we have been able to drive an improvement in deposit mix, push the net interest margin higher, and manage
to increase capital levels despite a year of material loan growth. These are all achievements that should continue to payoff in 2014.
0.00%
20.00%
40.00%
60.00%
80.00%
100.00%
120.00%
12.20%
12.40%
12.60%
12.80%
13.00%
13.20%
13.40%
13.60%
13.80%
14.00%
14.20%
Total Adversely Classified items/Tier 1 + ALLL
Total Risk Based Capital Ratio
|
|
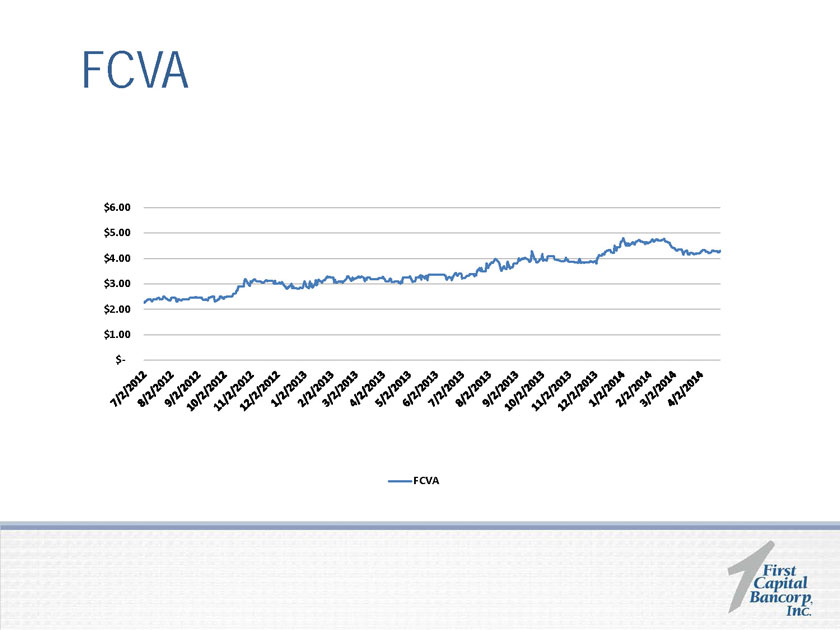
FCVA
$-
$1.00
$2.00
$3.00
$4.00
$5.00
$6.00
FCVA
|
|

FRANCHISE DEVELOPMENT
|
|

|
|

|
|

OUTDOOR BILLBOARDS
|
|

RADIO
|
|
SWIFT CREEK BRANCH
Opening June 13, 2014
Open Monday-Friday 10-7, Saturdays 10-2
Staffed by Full-Service Bankers
Promotion from within the First Capital Bank Team
|
|
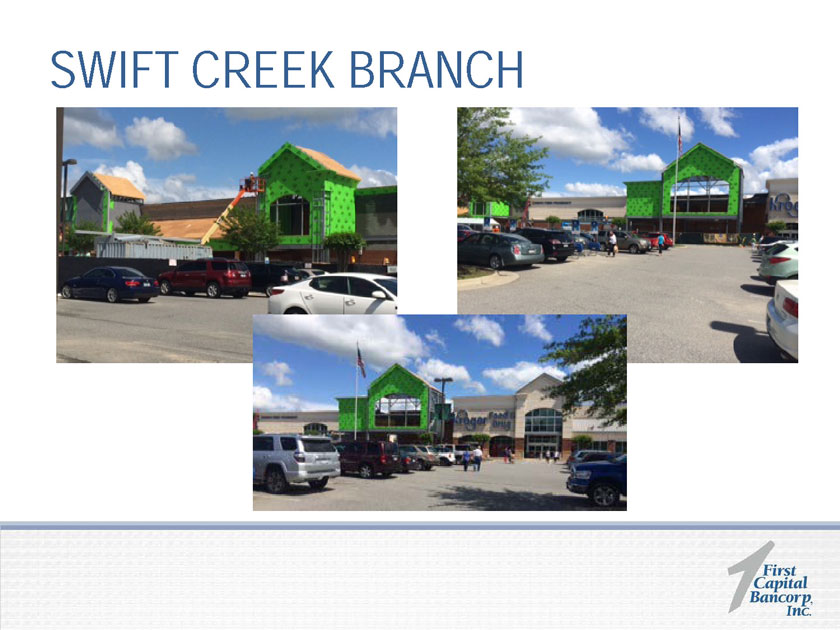
SWIFT CREEK BRANCH
|
|

August 2014
Four Wal-Mart locations
Expanded Squirrels Partnership
|
|