Attached files
| file | filename |
|---|---|
| 8-K - CHINA FUND INC | fp0010574_8k.htm |
|
Apr 30, 2014
|
Monthly Insight
The China Fund, Inc. (CHN)
|
|
Investment Objective
|
The investment objective of the Fund is to achieve long term capital appreciation. The Fund seeks to achieve its objective through investment in the equity securities of companies and other entities with significant assets, investments, production activities, trading or other business interests in China or which derive a significant part of their revenue from China.
The Fund has an operating policy that the Fund will invest at least 80% of its assets in China companies. For this purpose, ‘China companies’ are (i) companies for which the principal securities trading market is in China; (ii) companies for which the principal securities trading market is outside of China or in companies organized outside of China, that in both cases derive at least 50% of their revenues from goods or services sold or produced, or have a least 50% of their assets in China; or (iii) companies organized in China. Under the policy, China means the People’s Republic of China, including Hong Kong, and Taiwan. The Fund will provide its stockholders with at least 60 days’ prior notice of any change to this policy.
|
Performance Overview
|
|
Performance History
|
1 month
|
3 months
|
YTD
|
1 Year
|
3 Years (p.a.)
|
5 Years (p.a.)
|
10 Years (p.a.)
|
Since Inception
|
|
NAV (%)
|
-0.36
|
1.13
|
-2.60
|
8.87
|
-1.07
|
14.00
|
14.09
|
10.73
|
|
Market price (%)
|
-0.25
|
2.00
|
-4.57
|
8.10
|
-2.02
|
13.13
|
12.15
|
9.70
|
|
Benchmark (%)
|
-0.10
|
2.20
|
-3.40
|
2.75
|
0.16
|
10.86
|
9.51
|
N/A
|
|
Performance History
|
2013
|
2012
|
2011
|
2010
|
2009
|
2008
|
2007
|
2006
|
|
NAV (%)
|
17.03
|
12.07
|
-24.37
|
27.25
|
72.82
|
-46.95
|
86.20
|
57.10
|
|
Market price (%)
|
11.48
|
20.46
|
-27.51
|
23.60
|
72.19
|
-40.65
|
50.24
|
65.67
|
|
Benchmark (%)
|
7.25
|
22.65
|
-18.36
|
13.60
|
67.12
|
-49.37
|
37.97
|
39.50
|
Source: State Street Bank and Trust Company. Source for index data: MSCI as at Apr 30, 2014.
|
Portfolio Analysis
|
|
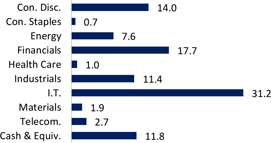
Sector allocation (%)
|
Country allocation (%)
|
 |
 |
|
Source: State Street Bank and Trust Company as at Apr 30, 2014.
|
* China includes A-shares (0.0%), A-share equity linked securities (8.5%), B-shares (0.0%), H-shares (20.9%) and Red-chips (12.6%).
|

The China Fund, Inc. (CHN)
|
Portfolio Analysis (continued)
|
|
Top 10 Holdings
|
Sector
|
%
|
|
|
Beijing Enterprises Holdings, Ltd.
|
Industrials
|
4.1
|
|
|
China Minsheng Banking Corp., Ltd.
|
Financials
|
3.9
|
|
|
Hutchison Whampoa, Ltd.
|
Industrials
|
3.8
|
|
|
Li & Fung, Ltd.
|
Consumer Discretionary
|
3.5
|
|
|
Taiwan Semiconductor Manufacturing Co., Ltd.
|
Information Technology
|
3.5
|
|
|
Hermes Microvision, Inc.
|
Information Technology
|
3.2
|
|
|
Tong Hsing Electronic Industries, Ltd.
|
Information Technology
|
3.2
|
|
|
PetroChina Co., Ltd.
|
Energy
|
3.1
|
|
|
Delta Electronics, Inc.
|
Information Technology
|
3.0
|
|
|
Hong Kong Exchanges and Clearing, Ltd.
|
Financials
|
2.9
|
|
|
Total
|
34.2
|
||
Source: State Street Bank and Trust Company as at Apr 30, 2014.
|
Fund Details
|
|
NAV
|
$22.44
|
|
Market price
|
$19.86
|
|
Premium/Discount
|
-11.50%
|
|
Market cap
|
US$311.45m
|
|
Shares outstanding
|
15,682,029
|
|
Exchange listed
|
NYSE
|
|
Listing date
|
July 10, 1992
|
|
Benchmark
|
MSCI Golden Dragon Index (Total Return)
|
|
Fund Manager
|
Christina Chung
|
|
Listed and direct investment manager
|
Allianz Global Investors U.S. LLC
|
Source: State Street Bank and Trust Company as at Apr 30, 2014.
|
Distribution History (10 years)
|
|
Declaration
date
|
Ex-dividend
date
|
Record
date
|
Payable
date
|
Dividend/
Share
|
Income
|
Long-term
Capital
|
Short-term
Capital
|
|
13 Dec 2013
|
19 Dec 2013
|
23 Dec 2013
|
27 Dec 2013
|
3.3140
|
0.4387
|
2.8753
|
0.0000
|
|
10 Dec 2012
|
20 Dec 2012
|
24 Dec 2012
|
28 Dec 2012
|
3.2517
|
0.3473
|
2.9044
|
0.0000
|
|
8 Dec 2011
|
21 Dec 2011
|
23 Dec 2011
|
29 Dec 2011
|
2.9964
|
0.1742
|
2.8222
|
0.0000
|
|
8 Dec 2010
|
21 Dec 2010
|
24 Dec 2010
|
29 Dec 2010
|
2.2742
|
0.3746
|
1.8996
|
0.0000
|
|
9 Dec 2009
|
22 Dec 2009
|
24 Dec 2009
|
29 Dec 2009
|
0.2557
|
0.2557
|
0.0000
|
0.0000
|
|
8 Dec 2008
|
22 Dec 2008
|
24 Dec 2008
|
23 Jan 2009
|
5.8174
|
0.4813
|
5.3361
|
0.0000
|
|
7 Dec 2007
|
19 Dec 2007
|
21 Dec 2007
|
25 Jan 2008
|
12.1200
|
0.2800
|
9.0000
|
2.8400
|
|
8 Dec 2006
|
19 Dec 2006
|
21 Dec 2006
|
29 Dec 2006
|
4.0117
|
0.2996
|
2.7309
|
0.9812
|
|
9 Dec 2005
|
19 Dec 2005
|
21 Dec 2005
|
29 Dec 2005
|
2.5119
|
0.2172
|
2.2947
|
0.0000
|
|
13 Dec 2004
|
20 Dec 2004
|
22 Dec 2004
|
7 Jan 2005
|
3.5701
|
0.1963
|
3.2664
|
0.1074
|
Source: State Street Bank and Trust Company as at December 31, 2013. Dividend/Share includes Income, Long-term Capital gains and Short-term Capital gains.
2
The China Fund, Inc. (CHN)
The China Fund Inc. NAV Performance of USD $10,000 since inception (with dividends reinvested at NAV price)
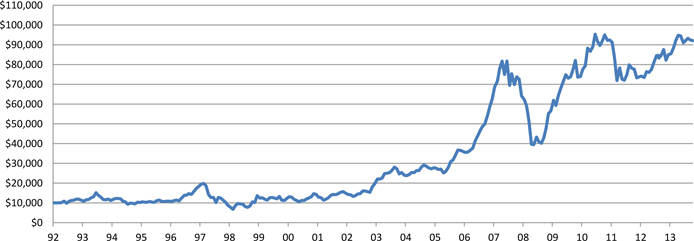
Past performance is not a guide to future returns.
Source: State Street Bank and Trust Company as at Apr 30, 2014.
The China Fund Inc. Premium / Discount

Past performance is not a guide to future returns.
Source: State Street Bank and Trust Company as at Apr 30, 2014.
3
The China Fund, Inc. (CHN)
Manager’s Commentary
Market Review
The Chinese equity markets rebounded in the first half of April, lifted by the announcement of the “Shanghai-Hong Kong Stock Connect” scheme on April 10. The China Securities Regulatory Commission and Hong Kong Securities and Futures Commission (“SFC”) jointly announced the scheme, which permits the mutual access to the Hong Kong and Shanghai Exchanges. Under the scheme, Chinese investors will be allowed to trade Hong Kong listed stocks on the Shanghai Exchange with an annual quota of RMB 300 billion and a daily quota of RMB 13 billion. Reciprocally, Hong Kong investors will be able to buy A-shares on the Hong Kong Stock Exchange with an annual quota of RMB 250 billion and a daily quota of RMB 10.5 billion. However, the equity markets pulled back in the second half of the month. The positive sentiment faded fast amid continued concern over sluggish economic growth and weakening renminbi. The HSBC China Flash Purchasing Managers’ Index (“PMI”) edged up to 48.3 for April from 48.0 and China’s first quarter GDP growth moderated to 7.4% year-on-year, compared to 7.7% for the fourth quarter of 2013. However, growth was higher than the consensus expectations of 7.3%. Other data also showed continued contraction of the Chinese economy. Company earnings results for the 2013 fiscal year were generally lackluster and the first quarter results for the big Chinese banks were largely in line with market expectations. Nevertheless, investors focused on the rising risk of non-performing loans and the exposure to property developers. The latest corruption scandal, in relation to the China Resources Group, further undermined investors’ fragile confidence in Chinese equities.
In Taiwan, the equity market was supported by good guidance figures delivered by the big technology companies. The smartphone supply chain players will likely benefit from strong demand for the new iPhone 6, driven by the replacement cycle and user preferences for larger sized smartphones.
Fund Review
The Fund marginally underperformed the benchmark for the month. Stock selection in information technology and consumer discretionary contributed the most in terms of relative returns, while stock selection in industrials and an overweight in consumer discretionary detracted. Two of the top contributors to relative performance for the month were Largan Precision and an underweight in Tencent. The surge in Largan’s share price was triggered by strong first quarter earnings results that were mainly the result of strong demand from Chinese smartphone brands. The underweight to Tencent contributed as the share price consolidated with investors continuing to take profits in new economy stocks. Conversely, one of the main detractors was CSR Corp. There was no specific or material news on the company, but there will be another rail equipment manufacturer listed in Hong Kong soon. It may have triggered arbitrage activities within the sector that have undermined the share price of CSR in the short term. The outlook for the sector remains positive as the Chinese government continues to increase investment in railway related infrastructure.
Key Transaction
We initiated a position in the Hong Kong Stock Exchange on the investment thesis that the company should be the direct beneficiary of the “Shanghai-Hong Kong Stock Connect” scheme in the medium term.
Outlook
We believe Hong Kong/China equities will continue to consolidate in the short term given slow economic growth in China coupled with concerns over the corporate earnings outlook and companies’ cash flow positions. With the Chinese government focusing on economic and structural reforms, the economy is unlikely to see significant policy easing measures in the short term despite some selective areas of economic support. Hence, in the absence of signs of economic recovery in China, we believe Hong Kong and China equities will continue to range trade. Against this backdrop, we will continue to focus on stock selection particularly in the technology sector and companies with global exposure to drive portfolio performance.
In Taiwan, we believe the technology sector will continue to benefit from strong demand recovery particularly for the key players in the smartphone supply chain.
Source : Allianz Global Investors U.S. LLC as at April 30 2014.
The China Fund, Inc. (CHN)
Portfolio Holdings
|
CUSIP
|
Security Description
|
Cost Base
|
Base MV
|
Shares
|
Percentage
of Net
Assets
|
|
608169900
|
Beijing Enterprises Holdings, Ltd.
|
12,981,141
|
14,570,117
|
1,683,500
|
4.1
|
|
B57JY2909
|
China Minsheng Banking Corp., Ltd.
|
15,205,944
|
13,806,605
|
13,723,500
|
3.9
|
|
644806002
|
Hutchison Whampoa, Ltd.
|
10,763,479
|
13,330,238
|
975,000
|
3.8
|
|
628625907
|
Li & Fung, Ltd.
|
12,020,152
|
12,400,008
|
8,538,000
|
3.5
|
|
688910900
|
Taiwan Semiconductor Manufacturing Co., Ltd.
|
8,470,505
|
12,223,575
|
3,115,000
|
3.5
|
|
B3WH02907
|
Hermes Microvision, Inc.
|
7,867,215
|
11,134,843
|
269,000
|
3.2
|
|
B1L8PB906
|
Tong Hsing Electronic Industries, Ltd.
|
9,584,674
|
11,088,615
|
2,067,000
|
3.2
|
|
622657906
|
PetroChina Co., Ltd.
|
9,815,518
|
11,052,868
|
9,564,000
|
3.1
|
|
626073902
|
Delta Electronics, Inc.
|
5,764,359
|
10,555,500
|
1,723,000
|
3.0
|
|
626735906
|
Hong Kong Exchanges and Clearing, Ltd.
|
10,237,199
|
10,384,186
|
576,300
|
2.9
|
|
637248907
|
MediaTek, Inc.
|
7,101,686
|
9,800,119
|
627,000
|
2.8
|
|
607355906
|
China Mobile, Ltd.
|
10,113,679
|
9,653,278
|
1,015,500
|
2.7
|
|
B01CT3905
|
Tencent Holdings, Ltd.
|
4,058,182
|
9,271,394
|
148,700
|
2.6
|
|
17313A533
|
Gree Electric Appliances, Inc. Access Product (expiration 01/16/15)
|
6,453,442
|
8,990,490
|
1,838,546
|
2.6
|
|
671815900
|
Qingling Motors Co., Ltd.
|
8,718,221
|
8,890,024
|
28,960,000
|
2.5
|
|
B01FLR903
|
Ping An Insurance (Group) Company of China, Ltd.
|
9,814,375
|
8,517,664
|
1,153,500
|
2.4
|
|
B00G0S903
|
CNOOC, Ltd.
|
10,305,318
|
8,492,348
|
5,160,000
|
2.4
|
|
658444906
|
Merida Industry Co., Ltd.
|
7,537,957
|
8,428,373
|
1,260,000
|
2.4
|
|
635186901
|
Digital China Holdings, Ltd.
|
14,791,043
|
8,198,328
|
8,865,000
|
2.3
|
|
B1DYPZ905
|
China Merchants Bank Co., Ltd.
|
9,119,882
|
7,675,121
|
4,312,000
|
2.2
|
|
645166901
|
Largan Precision Co., Ltd.
|
3,937,557
|
7,365,720
|
118,000
|
2.1
|
|
B2R2ZC908
|
CSR Corp., Ltd.
|
7,466,211
|
7,287,674
|
9,930,000
|
2.1
|
|
674347901
|
Semiconductor Manufacturing International Corp.
|
7,943,834
|
6,476,128
|
79,698,000
|
1.8
|
|
B1G1QD902
|
Industrial & Commercial Bank of China, Ltd.
|
6,201,503
|
5,901,452
|
9,925,000
|
1.7
|
|
B58J1S907
|
Chailease Holding Co., Ltd.
|
5,196,680
|
5,062,070
|
2,132,000
|
1.4
|
|
663094902
|
China Everbright International, Ltd.
|
1,742,461
|
5,001,823
|
4,002,000
|
1.4
|
|
ACI009HH0
|
China Suntien Green Energy Corp., Ltd.
|
4,612,718
|
4,320,455
|
12,785,000
|
1.2
|
|
620267906
|
Advantech Co., Ltd.
|
1,978,619
|
4,081,065
|
632,000
|
1.2
|
|
674842901
|
Ruentex Development Co., Ltd.
|
1,734,514
|
4,065,219
|
2,298,904
|
1.2
|
|
635415904
|
Epistar Corp.
|
4,361,736
|
3,954,262
|
1,812,000
|
1.1
|
|
600245005
|
ASM Pacific Technology, Ltd.
|
3,611,261
|
3,724,720
|
335,400
|
1.1
|
|
ACI07LD80
|
Dongxu Optoelectronic Technology Co., Ltd. Access Product (expiration 06/30/15)
|
2,846,947
|
3,714,328
|
962,760
|
1.1
|
|
B633D9904
|
Zhongsheng Group Holdings, Ltd.
|
3,919,603
|
3,613,710
|
2,996,500
|
1.0
|
|
B16NHT900
|
Shui On Land, Ltd.
|
4,771,127
|
3,499,958
|
13,172,500
|
1.0
|
|
913BMZ902
|
Ping An Insurance (Group) Company of China, Ltd. Access Product (expiration 06/30/15)
|
3,600,309
|
3,444,526
|
541,933
|
1.0
|
|
17314W591
|
Jiangsu Hengrui Medicine Co., Ltd. Access Product (expiration 01/16/15)
|
3,554,123
|
3,428,577
|
633,046
|
1.0
|
|
B45BF9907
|
Sanan Optoelectronics Co., Ltd. Access Product (expiration date 02/15/16)
|
3,541,260
|
3,394,825
|
871,809
|
1.0
|
|
B0Y91C906
|
China National Building Material Co., Ltd.
|
3,862,621
|
3,331,257
|
3,538,000
|
0.9
|
|
ACI07WMD5
|
China International Travel Service Corp., Ltd. Access Product (expiration 08/25/15)
|
3,801,918
|
3,324,471
|
626,632
|
0.9
|
|
B236JB905
|
Tiangong International Co., Ltd.
|
5,449,044
|
3,217,830
|
18,480,000
|
0.9
|
|
665157905
|
Comba Telecom Systems Holdings, Ltd.
|
7,615,377
|
2,833,143
|
11,150,000
|
0.8
|
|
B688XD907
|
Beijing Jingneng Clean Energy Co., Ltd.
|
3,525,009
|
2,689,904
|
6,244,000
|
0.8
|
|
ACI0873X6
|
Shanghai Jahwa United Co., Ltd. Access Product (expiration 06/12/17)
|
2,654,660
|
2,638,213
|
460,100
|
0.7
|
|
651795908
|
Natural Beauty Bio-Technology, Ltd.
|
4,906,910
|
2,461,483
|
47,710,000
|
0.7
|
|
42751U205
|
Hermes Microvision, Inc. GDR
|
1,368,073
|
1,942,129
|
46,900
|
0.6
|
|
B5SRR0900
|
Shanghai Jahwa United Co., Ltd. Access Product (expiration 01/16/15)
|
1,113,416
|
1,110,676
|
193,700
|
0.3
|
|
ACI0090H8
|
Zong Su Foods
|
15,000,035
|
-
|
2,677
|
0.0
|
Source: State Street Bank and Trust Company as at Apr 30, 2014.
5
The China Fund, Inc. (CHN)
|
The information contained herein has been obtained from sources believed to be reliable but Allianz Global Investors U.S. LLC and its affiliates do not warrant the information to be accurate, complete or reliable. The opinions expressed herein are subject to change at any time and without notice. Past performance is not indicative of future results. This material is not intended as an offer or solicitation for the purchase or sale of any financial instrument. Investors should consider the investment objectives, risks, charges and expenses of any mutual fund carefully before investing. This and other information is contained in the fund’s annual and semiannual reports, proxy statement and other fund information, which may be obtained by contacting your financial advisor or visiting the fund’s website at www.chinafundinc.com. This information is unaudited and is intended for informational purposes only. It is presented only to provide information on investment strategies and opportunities. The Fund seeks to achieve its objective through investment in the equity securities of companies and other entities with significant assets, investments, production activities, trading or other business interests in China or which derive a significant part of their revenue from China. Investing in non-U.S. securities entails additional risks, including political and economic risk and the risk of currency fluctuations, as well as lower liquidity. These risks, which can result in greater price volatility, will generally be enhanced in less diversified funds that concentrate investments in a particular geographic region. The Fund is a closed-end exchange traded management investment company. This material is presented only to provide information and is not intended for trading purposes. Closed-end funds, unlike open-end funds, are not continuously offered. After the initial public offering, shares are sold on the open market through a stock exchange, where shares may trade at a premium or a discount. Holdings are subject to change daily.
|