Attached files
| file | filename |
|---|---|
| 8-K - FORM 8-K - Bank of New York Mellon Corp | d730955d8k.htm |
 POWERING GLOBAL INVESTMENTS
May 20, 2014
UBS Global Financial Services Conference 2014
Gerald Hassell
Chairman and Chief Executive Officer
Todd Gibbons
Chief Financial Officer
Exhibit 99.1 |
 UBS
Global Financial Services Conference 2014 Cautionary Statement
A number of statements in our presentations, the accompanying slides and the
responses to your questions are “forward-looking
statements.”
These statements relate to, among other things, The Bank of New York Mellon
Corporation’s (the “Corporation”) expectations regarding:
Investment Management’s positioning for growth; the Fed Funds Effective rate and impact of increases on
our business; signs of an abatement in Corporate Trust run-off and the return
of the private housing market and impact on business; the long-term
growth potential of Investment Management; the benefits to having investment management and investment services
under one company; investing in our franchise for organic growth; projected margin
impacts of investment management initiatives; the challenging operating
environment and impact on the investment services business; expense control plans and annual run-rate of
savings;
changes
in
technology
and
staffing;
possible
gains
relating
to
real
estate
sales;
expected
severance
charges;
our
strong
capital position; our ability to perform well in stress scenarios and maintain our
high payout ratios; our 2014 capital plan; the impact of new capital
regulations; the outlook for Corporate Trust, including exploration of options and timing of process; our business model’s
ability
to
drive
shareholder
value
and
our
growth
position;
and
statements
regarding
the
Corporation's
aspirations,
as
well
as
the
Corporation’s overall plans, strategies, goals, objectives, expectations,
estimates, intentions, targets, opportunities and initiatives. These
forward-looking statements are based on assumptions that involve risks and uncertainties and that are subject to change
based
on
various
important
factors
(some
of
which
are
beyond
the
Corporation’s
control).
Actual results may differ materially from those expressed or implied as a result of
the factors described under “Forward Looking Statements”
and
“Risk
Factors”
in
the
Corporation’s
Annual
Report
on
Form
10-K
for
the
year
ended
December
31,
2013
(the
“2013
Annual
Report”),
and
in
other
filings
of
the
Corporation
with
the
Securities
and
Exchange
Commission
(the
“SEC”).
Such
forward-looking statements speak only as of May 20, 2014, and the Corporation
undertakes no obligation to update any forward- looking statement to
reflect events or circumstances after that date or to reflect the occurrence of unanticipated events.
Non-GAAP Measures:
In this presentation we may discuss some non-GAAP adjusted measures in
detailing the Corporation’s performance.
We believe these measures are useful to the investment community in analyzing the
financial results and trends of ongoing operations.
We believe they facilitate comparisons with prior periods and reflect the
principal basis on which our management monitors financial
performance. Additional disclosures relating to non-GAAP adjusted
measures are contained in the Corporation’s reports filed with the SEC,
including the 2013 Annual Report and our Quarterly Report on Form 10-Q for the quarter
ended
March
31,
2014,
available
at
www.bnymellon.com/investorrelations.
1 |
 UBS
Global Financial Services Conference 2014 The Investments Company for the
World Expertise Across the Investment Lifecycle
2
See page 25 in Appendix for sources. |
 UBS
Global Financial Services Conference 2014 3
The Investments Company for the World
Global Market Leadership
Corporate
Trust
#1 Global corporate trust service provider
Treasury
Services
Top 5 in U.S.D. payments
Global Markets
Client driven trading
Global Collateral
Services
Leveraging the breadth of Investment
Services
* Consolidated revenue and pretax income include the Other segment.
LTM = Last twelve months
Pretax
income
for
Investment
Services
and
Investment
Management
exclude
amortization
of
intangible
assets.
See
Appendix
for
revenue
and
pretax
income
reconciliation.
Rankings reflect BNY Mellon’s size in the markets in which it operates and are
based on internal data as well as BNY Mellon’s knowledge of those markets.
For additional details regarding these rankings, see Appendix and / or pages 17,
20-21 of our Form 10-Q for the quarter ended March 31, 2014, available at
www.bnymellon.com/investorrelations.
Asset Servicing
Largest global custodian ranked by Assets
Under Custody / Administration
Alternative
Investment Services
#3 fund administrator
Broker-Dealer
Services
#1 (U.S.), growing globally
Pershing
#1 clearing firm U.S., U.K., Ireland,
Australia
Depositary
Receipts
#1 in market share (~60%)
Asset
Management
#8 global asset manager
Consolidated
Revenue
of
~$15.1B
and
Pretax
Income
of
~$3.9B*
–
LTM
3/31/14
Investment Management
(46% non-U.S. revenue)
Investment Services
(36% non-U.S. revenue)
Wealth
Management
#7 U.S. wealth manager
Revenue: ~$10.1B
Pretax Income: ~$2.9B
Revenue: ~$4.0B
Pretax Income: ~$1.1B |
 UBS
Global Financial Services Conference 2014 Growth
Year-over-Year
Pretax Income
+12%
Net income (16%)
+9% (excluding disallowance of certain tax credits)
2
Investment Management Fees
1
+7%
AUM +$197 billion (+14%)
Net AUM inflows of $100 billion
Investment Services Fees
+4%
AUC/A +$1.3 trillion (+5%)
Estimated new AUC/A wins of $639 billion
Net Interest Revenue
+1%
Mix of interest-earning assets, lower funding costs and higher
interest-earning assets offset by lower yields
Operating Expenses
0%
Lower litigation provision, offset by higher core expenses in
support of fee growth and increasing regulatory / risk / compliance
costs
2013 Highlights
4
2013
Total Shareholder Return
39%
Return on Tangible Common
Equity
2
20%
Share Repurchases
$1B
83% total payout ratio
Repurchased ~3% of shares outstanding
Quarterly Dividend Increase
15%
1
Includes Performance fees.
2
Represents a non-GAAP adjusted measure. See Appendix for reconciliation.
Additional disclosure regarding this measure and other non-GAAP adjusted measures
are
available
in
the
Corporation’s
reports
filed
with
the
SEC,
including
our
2013
Annual
Report,
available
at
www.bnymellon.com/investorrelations. |
 UBS
Global Financial Services Conference 2014 2013 --
Solid Pretax Income Growth Despite Factors Unique to BNY Mellon
Pretax Income +12%
5
Money Market
Fee Waivers Pretax Trend
($millions)
Corporate Trust
Pretax Income ¹
($millions)
•
Pretax decline partially
driven by structured
debt run-off
•
Structured debt run-off
expected to abate in the
next 18 to 24 months
Combined pretax margin
dilution of ~260 bps from
2009 to 2013
1 Excludes the impact of intangible amortization and money market fee
waivers. 2 Assumes no change in client behavior.
Rapid Recovery of Fee
Waivers With Rising
Short-Term Interest Rates |
 UBS
Global Financial Services Conference 2014 Growth
1Q14 vs. 1Q13
Pretax Income
+12%
Net income +12% (excluding disallowance of certain tax
credits)
2
Investment Management Fees
1
+3%
AUM +$197 billion (+14%)
Net AUM inflows of $87 billion –
LTM
Investment Services Fees
+3%
AUC/A +$1.6 trillion (+6%)
Estimated new AUC/A wins of $595 billion –
LTM
Net Interest Revenue
+1%
Change in mix of interest-earning assets and higher
average deposits, partially offset by lower investment
yields
Operating Expenses
(3%)
Lower litigation provision in 1Q14 as well as an
administrative error and cost of generating tax credits in
1Q13, partially offset by higher compensation,
professional, legal & other purchased service expenses
1Q14 Highlights
6
1Q14
Total Shareholder Return –
LTM
29%
Return on Tangible Common
Equity
2
17%
Share Repurchases
$375MM
~83% total payout ratio
Common Dividend Paid
$174MM
1
Includes Performance fees.
LTM = Last twelve months
2
Represents a non-GAAP adjusted measure. See Appendix for reconciliation.
Additional disclosure regarding this measure and other non-GAAP adjusted measures are available
in
the
Corporation’s
reports
filed
with
the
SEC,
including
our
Form
10-Q
for
the
quarter
ended
March
31,
2014,
available
at
www.bnymellon.com/investorrelations. |
 UBS
Global Financial Services Conference 2014 7
Investment
Management
–
Driving
Organic
Growth
Multi-Boutique
Model
&
Wealth
Management
NEWTON
CIS
SIGULER
GUFF*
MELLON
CAPITAL
THE
BOSTON
COMPANY
CENTER-
SQUARE
STANDISH
EACM
HAMON*
INSIGHT
ALCENTRA
BNY
MELLON
WESTERN
FMC*
WALTER
SCOTT
BNY
MELLON
ARX
MERITEN
Highly successful contributor to earnings
Minimal balance sheet usage
Positive to BNY Mellon’s credit ratings and
stress test performance –
diverse revenue
streams and fee-generating business
Corporate brand and excellent credit ratings are
attractive to large, sophisticated investors
Strong long-term growth potential
Highly complementary to Investment Services
business
Investment Management Attributes
* Minority ownership or joint venture. See additional disclosures on pages
26-27 in Appendix. + |
 UBS
Global Financial Services Conference 2014 Investment
Management
–
Investing
in
Our
Franchise
8
Projected
Margin Impact (%)
0.2
(0.7)
(1.1)
(0.3)
0.5
1.5+
2.0+
NOTE: Illustrative scenario based on current estimates.
Investing for Organic Growth
Investment Management
Individuals as Investors
•
Intermediaries
Expand and enhance distribution, marketing
and solutions development
•
Direct
Increase Wealth Management presence,
sales, private banking and related services
APAC Strategy
•
Develop local solutions, marketing, sales and operations capabilities
Projected Margin Impact of
Investment Management Initiatives |
 UBS Global Financial Services Conference 2014
Investment Services –
Facing Challenging Operating Environment
9
Business Performance Dynamics
Longer Term Trends
Current Operating Environment
•
Solid demand for custody-
and clearing-
related solutions
•
Net new business wins
•
Organic growth initiatives
•
Strong pipelines, particularly relative to
middle-
and back-office solutions
•
Lower short-term interest rates
Pressure on net interest revenue /
margin
Money market fee waivers
(significant for BNY Mellon due to
large money funds business)
•
Lower volatility and trading volumes
•
Reduced structured debt market activity
High margin structured debt
securitizations run-off (Corporate
Trust)
•
Expense pressure from compliance / risk /
control functions and legal / litigation
BNY Mellon-specific (e.g. Tri-Party
Reform) |
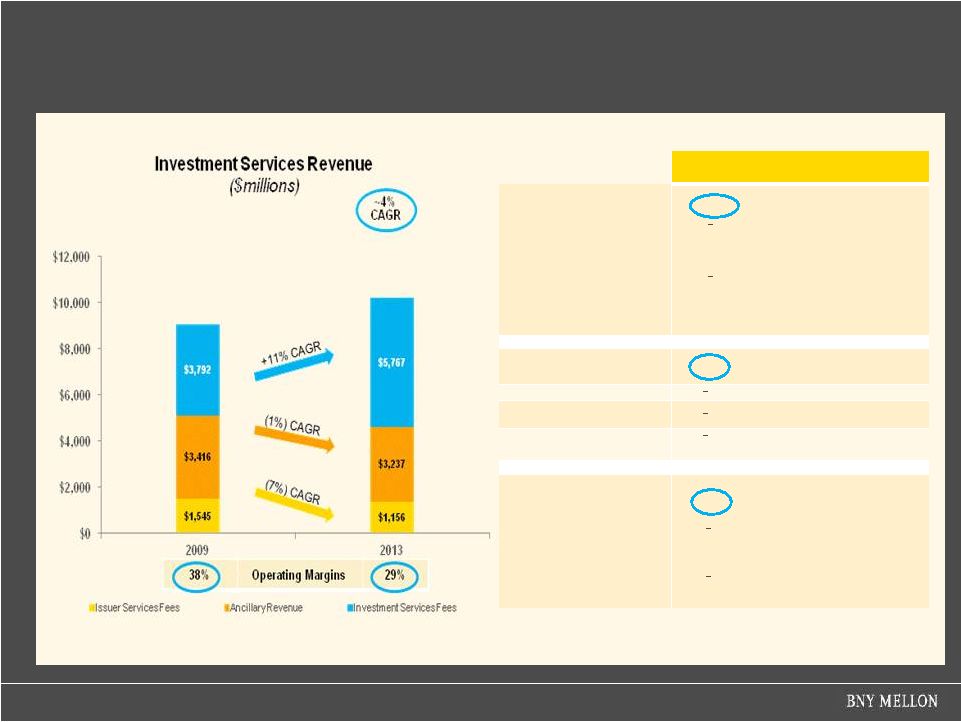 UBS Global Financial Services Conference 2014
Investment Services –
Facing Challenging Operating Environment
10
Performance Drivers
Investment
Services Fees
(adjusted)
•
~11%
CAGR reflects:
Ancillary Revenue:
•
~1% CAGR decline reflects lower:
Net Interest Revenue
Market rates and narrower spreads
Foreign Exchange
Volumes and volatility
Securities Lending
Short-term interest rates and
volumes
Issuer
Services Fees
(ex. money
market
fee waivers)
•
~7%
CAGR decline reflects:
NOTE: Adjusted Investment Services fees excludes Issuer Services, Securities
Lending revenue and the impact of money market fee waivers.
higher core Asset Servicing fees
--
acquisitions, net new business
and higher market values
higher Clearing services –
mutual fund, asset-based fees
and new business
lower corporate trust fees --
run-off in structured debt
securitizations
divestiture of Shareowner
Services
$10,160
$8,753 |
 UBS Global Financial Services Conference 2014
Investment Services –
Investing in Our Franchise
11
Investing for Organic Growth
Investment Services
Leveraging Investment Services scale
•
Develop strategic platform solutions; attractive to broader range of
large institutional clients
Global Collateral Services
•
Enhance collateral systems; supporting liquidity, global collateral
management and evolving European custody infrastructure
Foreign Exchange trading platform
•
Enhance electronic platform; increase connectivity to clients on
third-party communication networks
HedgeMark
•
Provider of hedge fund managed account and risk analytics
services
Measuring our Success
•
Investment Services fees growing faster
than AUC/A
•
FX volume growth outpacing industry
•
Continued improvement in Investment
Services coverage ratio*
* Coverage ratio represents Investment
Services fees as a percentage of noninterest
expense. Noninterest expense excludes
amortization of intangible assets, support
agreement charges and litigation expense. |
 UBS Global Financial Services Conference 2014
Focused on Expense Control and Operating Leverage
12
Bending the Cost Curve
Technology
•
Getting more out of existing investment
•
Insourcing application development and lowering unit cost
Managing
Real Estate
•
Consolidating our space –
net reduction of ~700,000 square
feet in New York City
Consolidating
Platforms
•
Custody: three platforms to one
•
Fund accounting: five platforms to three
Re-engineering
•
Rationalizing our staffing
•
Simplifying and automating global processes
•
~$80-100MM severance charge in 2Q14; >$100MM
annual
run-rate savings
1
~50% of run-rate savings expected to be achieved in 2H14
1
Total Corporation actual operating expense may increase or decrease due to other
factors. |
 UBS Global Financial Services Conference 2014
Provides Financial Flexibility…
Strong Capital Position and Returns
(At 3/31/14)
Estimated Common Equity Tier 1
Ratio, fully phased-in
(Non-GAAP)
1
Standardized
Advanced
11.1%
10.7%
Return on Tangible Common
Equity
(Non-GAAP)
1
17%
13
2011
2012
2013
2014 CCAR Plan
Share Repurchases
2
$873MM or 36MM shares
(3% of shares outstanding)
$1.1B or 51MM shares
(4% of shares outstanding)
$1B or 35MM shares
(3% of shares outstanding)
$1.74B
(4% of shares outstanding)
3
Quarterly Dividend Increase
+44%
+0%
+15%
+13%
Payout Ratio
58%
73%
83%
93%
4
Well Positioned
for Stress Scenarios
Strong Capital Generation Provides Financial Flexibility
1
Represents
a
non-GAAP
adjusted
measure.
See
Appendix
for
a
reconciliation.
Additional
disclosure
regarding
this
measure
and
other
non-GAAP
adjusted
measures
are
available
in
the
Corporation’s
reports
filed
with
the
SEC,
including
our
Form
10-Q
for
the
quarter
ended
March 31,
2014,
available
at
www.bnymellon.com/investorrelations.
SOURCE:
Federal
Reserve
–
Dodd-Frank
Act
Stress
Test
(DFAST)
2014:
Supervisory Stress Test Methodology and Results
See Appendix for additional detail.
Least
Impact
2 Percent of outstanding shares repurchased is based on shares outstanding at the
beginning (January 1) of each year, respectively. 3 Assumes shares
repurchased at closing stock price of $35.27 (on 4/2/14) and total common shares outstanding of 1,142MM at 1/1/14.
4
Ratio
calculated
using
Full
Year
2014
First
Call
consensus
net
income
estimates
as
a
benchmark.
Most
Impact
Impact of DFAST Stress Test
Severely Adverse Scenario
on Basel I Tier 1 Common Ratio |
 UBS Global Financial Services Conference 2014
Impact of New Capital Regulations
Business Models Have Different Capital Constraints
14
Spot Capital
Stress Capital
Sample
Institutions
Leverage
Bound Banks
•
Trust Banks
•
Securities Lenders
•
Broker-Dealers
Risk-Based
Capital
Bound Banks
•
Regional Banks
•
Universal Banks
•
Super-Regional
Banks
Potential Actions to Increase
Return on Equity
Increase deposits, lower funding costs
Invest in fee-based businesses that
generate deposits
Reduce risk-weighted assets
Potential Actions to Increase
Return on Equity
Reduce balance sheet
Increase risk-weighted assets
Invest in balance sheet-lite revenue streams
Low yielding assets
Expensive deposits
More yield on same balance sheet |
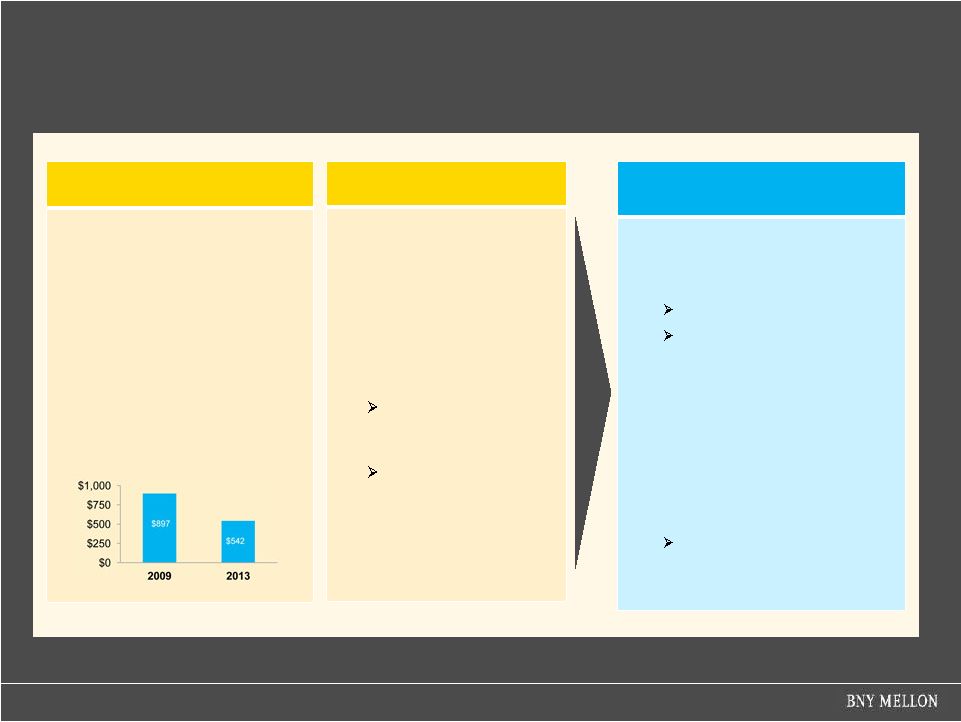 UBS Global Financial Services Conference 2014
Corporate Trust
Near-Term Pressure, Positive Long-Term Outlook, Evaluating Options
15
Near-Term
Profitability / Returns Negatively Impacted by:
•
Money market fee waivers
•
Reduced net interest
revenue (lower deposit
values)
•
Higher capital requirements
given balance sheet usage
Longer-Term
Outlook Positive
•
Structured debt run-off
expected to abate in
next 18-24 months
•
Stronger earnings and
operating margins with
normalized monetary
policy
Increased NIR due to
higher investment
yields on deposits
Reduced money-
market fee waivers
•
Potential recovery in
non-agency mortgage-
backed market
What are we Doing?
•
Exploring whether the business
is worth significantly more to
someone else
If yes, we may pursue sale
If no, we will retain and
continue to invest in the
business and benefit
from the anticipated upside
Includes the potential
redeployment of capital --
investments in our businesses;
dividends; share repurchases
Corporate Trust
Pretax Income
1
($millions)
1 Excludes the impact of intangible amortization and money market fee
waivers. •
The process is expected to
conclude in the third quarter
•
A sale and any subsequent use
of proceeds would be subject to
regulatory clearances |
 UBS Global Financial Services Conference 2014
Actively realigning the business model for the new regulatory
environment
Investing in our franchise to drive organic growth
Bending the cost curve and driving positive operating leverage
Generating strong returns on tangible capital, enabling:
Investments in our businesses
Dividend increases
Share repurchases
Driving Shareholder Value
16
Positioned for Growth |
 |
 APPENDIX
*******
*******
*******
*******
*******
*******
*******
*******
*******
*******
******* |
 UBS Global Financial Services Conference 2014
Reconciliation Schedule
Business -
Revenue and Pretax Income
*
Totals
exclude
the
Other
segment.
Pretax
metrics
exclude
the
impact
of
intangible
amortization.
INVESTMENT SERVICES
INVESTMENT MANAGEMENT
TOTAL
INVESTMENT SERVICES
REVENUE
$ MILLION
INVESTMENT MANAGEMENT
TOTAL
2,603
975
778
2Q13
310
PRETAX INCOME
$ MILLION
2,568
949
804
3Q13
260
2,470
1,061
650
4Q13
301
2,477
970
700
1Q14
277
10,118
3,955
2,932
LTM
1Q14
14,073
1,148
4,080
19 |
 UBS Global Financial Services Conference 2014
Reconciliation Schedule
Return on Tangible Common Equity and Net Income
Net Income ($millions)
(Ex. Intangible Amortization)
2013
Net income –
continuing operations
$2,047
Intangible amortization –
after-tax
220
M&I, litigation and restructuring
45
Net charge related to the
disallowance of certain tax credits
593
Adjusted Net Income
1
$2,905
($millions)
Average
Tangible
Common
Shareholders’
Equity
2013
Average Common Shareholders’
Equity
$34,832
Average Goodwill
(17,988)
Average Intangible Assets
(4,619)
Deferred Tax Liability –
tax deductible goodwill
1,302
Deferred Tax Liability –
non-tax deductible intangible
assets
1,222
Average Tangible Common Shareholders’
Equity
$14,749
Return
on
Tangible
Common
Equity
1
19.7%
20
1
Represents a non-GAAP adjusted measure. Additional disclosure regarding this and
other non-GAAP adjusted measures is available in the Corporation’s reports filed with the SEC, including our
Annual
Report
for
the
year
ended
December
31,
2013,
available
at
www.bnymellon.com/investorrelations.
Net Income ($millions)
2013
2012
Net income –
continuing
operations
$2,047
$2,427
Net charge related to the
disallowance of certain tax
credits
593
-
Adjusted Net Income
1
$2,640
$2,427
Adjusted Net Income
8.8% |
 UBS Global Financial Services Conference 2014
Reconciliation Schedule
Return on Tangible Common Equity and Net Income
Net Income ($millions)
(Ex. Intangible Amortization)
1Q14
Net income –
continuing operations
$661
Intangible amortization –
after-tax
49
M&I, litigation and restructuring
(7)
Adjusted Net Income
1
$703
($millions)
Average Tangible Common Shareholders’
Equity
1Q14
Average
Common
Shareholders’
Equity
$36,289
Average Goodwill
(18,072)
Average Intangible Assets
(4,422)
Deferred Tax Liability –
tax deductible goodwill
1,306
Deferred Tax Liability –
non-tax deductible intangible
assets
1,259
Average
Tangible
Common
Shareholders’
Equity
$16,360
Return on Tangible Common Equity
1
17.4%
21
1
Represents a non-GAAP adjusted measure. Additional disclosure regarding this
and other non-GAAP adjusted measures is available in the Corporation’s reports filed with the
SEC,
including
our
Form
10-Q
for
the
quarter
ended
March
31,
2014,
available
at
www.bnymellon.com/investorrelations.
Net Income ($millions)
1Q14
1Q13
Net income –
continuing
operations
$661
($266)
Net charge related to the
disallowance of certain
tax credits
-
854
Adjusted Net Income
1
$661
$588
Adjusted Net Income
12.4% |
 UBS Global Financial Services Conference 2014
Reconciliation Schedule
Estimated Common Equity Tier 1 Ratio, Fully Phased-in
($millions)
Basel III Capital Components and Ratios at March 31, 2014
Fully phased-in
Basel III
Common Equity
$36,424
Goodwill and Intangible Assets
(19,915)
Net Pension Fund Assets
(104)
Equity Method Investments
(426)
Deferred Tax Assets
(18)
Other
(10)
Total Common Equity Tier 1
$15,951
Risk-weighted
Assets
–
Standardized
Approach
$143,882
Risk-weighted
Assets
–
Advanced
Approach
$148,736
Estimated
Basel
III
CET1
ratio
–
Standardized
Approach
(Non-GAAP)
1
11.1%
Estimated
Basel
III
CET1
ratio
–
Advanced
Approach
(Non-GAAP)
1
10.7%
22
1Represents a non-GAAP adjusted measure. Additional disclosure regarding
this measure and other non-GAAP adjusted measures are available in the Corporation’s
reports
filed
with
the
SEC,
including
our
Form
10-Q
for
the
quarter
ended
March
31,
2014,
available
at
www.bnymellon.com/investorrelations.
At March 31, 2014, the estimated fully phased-in Basel III CET1 ratio is based
on our interpretation of the final rules released by the Federal Reserve on July 2, 2013, which
will be gradually phased-in over a multi-year period. Consistent with
historic practice, the risk-based capital ratios do not include the impact of the total consolidated assets
of certain consolidated investment management funds. If the Company is required to
include the net impact of such total consolidated assets, it would decrease the fully
phased-in CET1 ratio under the Standardized Approach by approximately 60 basis
points and the Advanced Approach by approximately 90 basis points at March 31, 2014.
See
additional
disclosures
in
our
Form
10-Q
for
the
quarter
ended
March
31,
2014,
available
at
www.bnymellon.com/investorrelations. |
 UBS Global Financial Services Conference 2014
Dodd-Frank Act Stress Test –
Severely Adverse Scenario
Impact on Tier 1 Common Equity Ratio
Bank Holding Company
Ticker/
Identifier
Tier 1 Common Ratio (%)
Stress
Impact
Actual Q3 2013
Ending
Minimum
American Express Company
AXP
12.8
14.0
12.1
0.7
BNY Mellon
BK
14.1
16.1
13.1
1.0
BB&T Corporation
BBT
9.4
8.4
8.4
1.0
SunTrust Banks
STI
9.9
9.0
8.8
1.1
U.S. Bancorp
USB
9.3
8.3
8.2
1.1
PNC Financial Services Group
PNC
10.3
9.0
9.0
1.3
Northern Trust Corporation
NTRS
13.1
11.7
11.7
1.4
Discover Financial Services
DFS
14.7
13.7
13.2
1.5
Fifth Third Bancorp
FITB
9.9
8.4
8.4
1.5
Ally Financial
ALLY
7.9
6.3
6.3
1.6
KeyCorp
KEY
11.2
9.3
9.2
2.0
Regions Financial Corporation
RF
11.0
9.0
8.9
2.1
Comerica Incorporated
CMA
10.7
8.6
8.6
2.1
State Street Corporation
STT
15.5
14.7
13.3
2.2
Wells Fargo & Company
WFC
10.6
8.2
8.2
2.4
M&T Bank Corporation
MTB
9.1
6.2
6.2
2.9
UnionBanCal Corporation
UNB
11.1
8.1
8.1
3.0
BBVA Compass Bancshares
BBVA
11.6
8.5
8.5
3.1
RBS Citizens Financial Group
RBS
13.9
10.7
10.7
3.2
BMO Financial Corp.
BMO
10.8
7.6
7.6
3.2
Huntington Bancshares Incorporated
HBAN
10.9
7.4
7.4
3.5
JPMorgan Chase & Co.
JPM
10.5
6.7
6.3
4.2
Capital One Financial Corporation
COF
12.7
7.8
7.8
4.9
Bank of America Corporation
BAC
11.1
6.0
5.9
5.2
Citigroup
C
12.7
7.2
7.2
5.5
Santander Holdings USA
SC
13.7
7.3
7.3
6.4
Morgan Stanley
MS
12.6
7.6
6.1
6.5
Zions Bancorporation
ZB
10.5
3.6
3.6
6.9
Goldman Sachs Group
GS
14.2
9.2
6.9
7.3
HSBC North America Holdings
HSBC
14.7
6.6
6.6
8.1
SOURCE:
Federal Reserve –
Dodd-Frank Act Stress
Test (DFAST) 2014: Supervisory Stress
Test Methodology and Results
23 |
 UBS Global Financial Services Conference 2014
Asset Servicing:
Largest global custodian ranked by
Assets Under Custody and / or Administration
Source: Globalcustody.net, 2013, data as of June 30, 2013 or as
otherwise noted by relevant ranked entity.
Broker-Dealer Services: #1 (U.S.), growing globally
Leading provider of U.S. Government Securities clearance services
Source: Federal Reserve Bank of New York -
Fedwire Securities High
Volume Customer Report, March 2013
Alternative Investment Services: #3 fund administrator
Based on single manager funds and funds of hedge fund assets under
administration combined.
Source:
HFMWeek
20th Biannual AuA Survey -
June 2013
Corporate Trust: #1 Global Corporate Trust Service
Provider
Source:
Thomson Reuters and Dealogic, first quarter, 2013
Depositary Receipts:
#1 in market share (~60%)
Leader in sponsored global depositary receipts programs
Source: BNY Mellon.
Data as of December 31, 2013
Pershing: #1 U.S. clearing firm
Pershing LLC., ranked by number of broker-dealer customers
Source: Investment News, 2012
Treasury Services:
Top 5 in USD payments
Fifth largest participant in CHIPS funds transfer volume
Fifth largest Fedwire payment processor
Source: CHIPS High Volume Customer Report, June 2013 and
Fedwire High Volume Customer Report, June 2013
Asset Management
Eighth largest global asset manager
Source: Pensions & Investments, November 2013
Wealth Management
Seventh largest U.S. wealth manager
Source: Barron’s, Sept 2013
Disclosures
24 |
 UBS Global Financial Services Conference 2014
Disclosures
All statistics are global and represent the minimum number of BNY Mellon client
relationships in each category. •
Fortune 500 (as of 12/31/13)
// Fortune
magazine, May 2013; Global 500 data
•
Central Banks (as of June 2013)
// CIA World Factbook, IMF, annual reports
•
Pensions & EB Funds (as of 2/26/14)
// Reprinted with permission of Pensions & Investments, Copyright 2013 //
Metric is Plan Assets, Millions (converted in thousands) •
Endowments (as of 2/26/14)
//
Reprinted
with
permission
of
NACUBO,
Copyright
2013
//
Metric
is
Total
Market
Value
of
Endowments,
in
thousands,
as
of
FYE
2011
// Data source used by P&I Magazine
•
Life & Health Insurance Companies (as of 2/26/14)
// Reprinted with permission of A.M. Best Company, Inc., Copyright 2013 // Metric
is 2012 Total Admitted Assets, in thousands •
QS World Universities Top 50 (of 400 listed) (as of 12/31/2013)
//
www.topuniversities.com/university-rankings/world-university-rankings/2013
25 |
 UBS Global Financial Services Conference 2014
Disclosures
BNY
Mellon
Investment
Management
is
one
of
the
world’s
leading
investment
management
organizations
and
one
of
the
top
U.S.
wealth
managers,
encompassing BNY Mellon’s affiliated investment management firms, wealth
management organization and global distribution companies. BNY
Mellon
is
the
corporate
brand
of
The
Bank
of
New
York
Mellon
Corporation
and
may
also
be
used
as
a
generic
term
to
reference
the
Corporation
as
a whole or its various subsidiaries generally. Products and services may be
provided under various brand names and in various countries by subsidiaries,
affiliates and joint ventures of The Bank of New York Mellon Corporation where authorized and regulated as required within each
jurisdiction.
Products or services described herein are provided by BNY Mellon, its subsidiaries,
affiliates or related companies and may be provided in various
countries
by
one
or
more
of
these
companies
where
authorized
and
regulated
as
required
within
each
jurisdiction.
Certain
investment
vehicles
may
only
be
offered
through
regulated
entities
or
licensed
individuals,
such
as
a
bank,
a
broker-dealer
or
an
insurance
company.
However,
this
material
is
not intended, nor should be construed, as an offer or solicitation of services or
products or an endorsement thereof in any jurisdiction or in any
circumstance that is otherwise unlawful or unauthorized. The investment products
and services mentioned here are not insured by the FDIC (or any
other state or federal agency), are not deposits of or guaranteed by any bank, and may lose value.
This
material
is
not
intended
as
an
offer
to
sell
or
a
solicitation
of
an
offer
to
buy
any
security,
and
it
is
not
provided
as
a
sales
or
advertising
communication
and
does
not
constitute
investment
advice.
MBSC
Securities
Corporation,
a
registered
broker-dealer,
FINRA
member
and
wholly
owned subsidiary of BNY Mellon, has entered into agreements to offer securities in
the U.S. on behalf of certain BNY Mellon Investment Management firms.
Securities in Canada are offered through BNY Mellon Asset Management Canada Ltd.,
registered as a Portfolio Manager and Exempt Market Dealer in all provinces
and territories of Canada, and as an Investment Fund Manager and Commodity
Trading Manager in Ontario. The value of investments and the income from them
is not guaranteed and can fall as well as rise due to stock market and currency movements.
When you sell your investment you may get back less than you originally
invested. Rankings include assets managed by BNY Mellon’s investment
boutiques and BNY Mellon Wealth Management. Each ranking may not include the
same mix of firms.
Unless otherwise noted, all references to assets under management (which are
approximate) are as of 3/31/14. Assets under management (AUM) /
overlay under management (OUM) for The Boston Company Asset Management, EACM
Advisors, Mellon Capital Management Corporation and Standish
Mellon
Asset
Management
Company
LLC
includes
assets
managed
by
those
individual
firms’
officers
as
associated
persons,
dual
officers
or employees of The Dreyfus Corporation. In addition, AUM/OUM for the
following firms includes assets managed by them as non-discretionary
investment
manager
for,
or
by
the
individual
firms’
officers
as
dual
officers
or
employees
of,
The
Bank
of
New
York
Mellon:
The
Dreyfus
Corporation
and its BNY Mellon Cash Investment Strategies division, The Boston Company Asset
Management, LLC, CenterSquare Investment Management, Inc, Mellon Capital
Management Corporation, Newton Capital Management Limited (part of The Newton Group) and Standish Mellon Asset
Management Company LLC.
Alcentra
Limited,
Insight
Investment
Management
Limited,
Newton
Capital
Management
Limited,
Newton
Investment
Management
Limited
and
Walter Scott & Partners Limited are authorized and regulated by the Financial
Conduct Authority. The registered address for Alcentra Limited is 10
Gresham
Street,
London,
EC2V7JD,
England.
The
registered
address
for
Insight
Investment
and
Newton
is
BNY
Mellon
Centre,
160
Queen
Victoria
Street, London, EC4V 4LA, England. The registered address for Walter Scott is One
Charlotte Square, Edinburgh, EH2 4DR, Scotland. Assets under
management include assets managed by both Alcentra Ltd. and Alcentra NY, LLC.
BNY
Mellon
Cash
Investment
Strategies
(CIS)
is
a
division
of
The
Dreyfus
Corporation.
26 |
 UBS Global Financial Services Conference 2014
Disclosures
BNY Mellon Investment Strategy & Solutions Group (“ISSG”) is part of
The Bank of New York Mellon (“Bank”). In the US, ISSG offers products and
services through the Bank, including investment strategies that are developed by
affiliated BNY Mellon Investment Management advisory firms and managed by
officers of such affiliated firms acting in their capacities as dual officers of the Bank.
BNY Mellon Western FMC, Insight Investment Management Limited and Meriten
Investment Management GmbH do not offer services in the U.S.
This
presentation
does
not
constitute
an
offer
to
sell,
or
a
solicitation
of
an
offer
to
purchase,
any
of
the
firms’
services
or
funds
to
any
U.S.
investor,
or where otherwise unlawful.
BNY Mellon Western Fund Management Company Limited is a joint venture between The
Bank of New York Mellon Corporation (49%) and China- based Western
Securities Company Ltd (51%). The firm does not offer services outside of the People's Republic of China.
BNY Mellon owns 90% of The Boston Company Asset Management, LLC and the remainder
is owned by employees of the firm. BNY Mellon owns a 19.9% minority interest
in The Hamon Investment Group Pte Limited, the parent company of Blackfriars Asset Management
Limited and Hamon Asian Advisors Limited which both offer investment services in
the U.S. Insight
investment's
assets
under
management
are
represented
by
the
value
of
cash
securities
and
other
economic
exposure
managed
for
clients.
Services offered in the U.S., Canada and Australia by Pareto Investment Management
Limited under the Insight Pareto brand. Mellon Capital Management Corporation
AUM includes $6.1 billion in overlay strategies. Meriten Investment
Management GmbH does not offer services in the U.S It was formerly known as WestLB Mellon Asset Management KAG mbH.
The Newton Group (“Newton”) is comprised of the following affiliated
companies: Newton Investment Management Limited, Newton Capital Management
Limited (NCM Ltd) and Newton Capital Management LLC (NCM LLC). NCM LLC personnel are supervised persons of NCM Ltd and
NCM
LLC
does
not
provide
investment
advice,
all
of
which
is
conducted
by
NCM
Ltd.
Only
NCM
LLC
and
NCM
Ltd
offer
services
in
the
U.S.
AUM
for
the Newton Group include assets managed by all of these companies (except NCM LLC).
In addition, AUM for the Firm may include assets managed by the firm's
officers as dual officers or employees of The Bank of New York Mellon and
assets of wrap fee account(s) and high net worth client model(s) for which
Newton Capital Management Limited provides advice in the form of non-discretionary model portfolios.
BNY Mellon owns a 20% interest in Siguler Guff & Company, LP and
certain related entities (including Siguler Guff Advisers, LLC).
Walter Scott’s AUM excludes advisory-only assets of $3.4 billion.
Securities transactions are effected, where required, only through registered
broker-dealers. Pershing is the umbrella name for Pershing LLC
(member FINRA, SIPC and NYSE), Pershing Advisor Solutions (member FINRA and SIPC),
Pershing Prime Services (a service of Pershing LLC), Pershing Limited (UK),
Pershing Securities Limited, Pershing Securities International Limited (Ireland), Pershing (Channel Islands) Limited, Pershing
Securities Canada Limited, Pershing Securities Singapore Private
Limited and Pershing Securities Australia Pty. Ltd. SIPC
protects securities in customer accounts of its members up to $500,000 in
securities (including $250,000 for claims for cash). Explanatory brochure available upon
request or at www.sipc.org. SIPC does not protect against loss due to market
fluctuation. SIPC protection is not the same as, and should not be
confused with, FDIC insurance. Investment products (other than deposit products)
referenced in this brochure (including money market funds) are not insured
by the FDIC (or any other state or federal agency), are not deposits of or guaranteed by BNY Mellon or any bank or non-bank subsidiary
thereof, and are subject to investment risk, including the loss of principal amount
invested. 27 |