Attached files
| file | filename |
|---|---|
| 8-K - FORM 8-K - S&T BANCORP INC | d729952d8k.htm |
| EX-99.1 - EX-99.1 - S&T BANCORP INC | d729952dex991.htm |
 2014 Annual Meeting
Exhibit 99.2 |
 Charles G. Urtin
Chairman of the Board |
 Todd
D. Brice President and
Chief Executive Officer |
 Forward Looking Statement
and Risk Factor
•
This presentation contains certain forward-looking statements within the
meaning of Section 27A of the Securities Act of 1933 and Section 21E of the
Securities Exchange Act of 1934. Forward- looking statements
include, among others, statements regarding trends, strategies, plans, beliefs,
intentions, expectations, goals and opportunities. Forward looking
statements are typically identified by words or phrases such as believe,
expect, anticipate, intend, estimate, assume, strategy, plan, outlook,
outcome, continue, remain, trend and variations of such words and similar
expressions,
or
future
or
conditional
verbs
such
as
will,
would,
should,
could,
may
or
similar
expressions. Actual results and performance could differ materially from
those anticipated by these forward-looking statements. Factors
that could cause such a difference include, but are not limited to, general
economic conditions, changes in interest rates, deposit flows, loan demand,
asset quality, including real estate and other collateral values, and
competition. •
S&T cautions that these forward-looking statements are subject to numerous
assumptions, risks and uncertainties, which change over time. These
forward-looking statements speak only as of the date hereof, and
S&T assumes no duty to update forward-looking statements. Subsequent
written
or
oral
statements
attributable
to
S&T
or
persons
acting
on
its
behalf
are
expressly
qualified in their entirety by the cautionary statements contained herein and
those in S&T’s reports previously and subsequently filed with the
Securities and Exchange Commission. 4 |
 Non-GAAP Financial Measures
•
In
addition
to
the
results
of
operations
presented
in
accordance
with
Generally
Accepted
Accounting Principles (GAAP), S&T management uses and this presentation
contains or references certain non-GAAP financial measures, such as net
interest income on a fully taxable equivalent basis. S&T believes these
financial measures provide information useful to investors in understanding
our operational performance and business and performance trends which facilitate
comparisons with the performance of others in the financial services
industry. Although S&T believes
that
these
non-GAAP
financial
measures
enhance
investors’
understanding
of
S&T’s
business and performance, these non-GAAP financial measures should not be
considered an alternative to GAAP. The non-GAAP financial measures
contained therein should be read in conjunction with the audited financial
statements and analysis as presented in the Annual Report on Form 10-K
as well as the unaudited financial statements and analyses as presented in the
respective Quarterly Reports on Forms 10-Q for S&T Bancorp, Inc. and
subsidiaries. 5 |
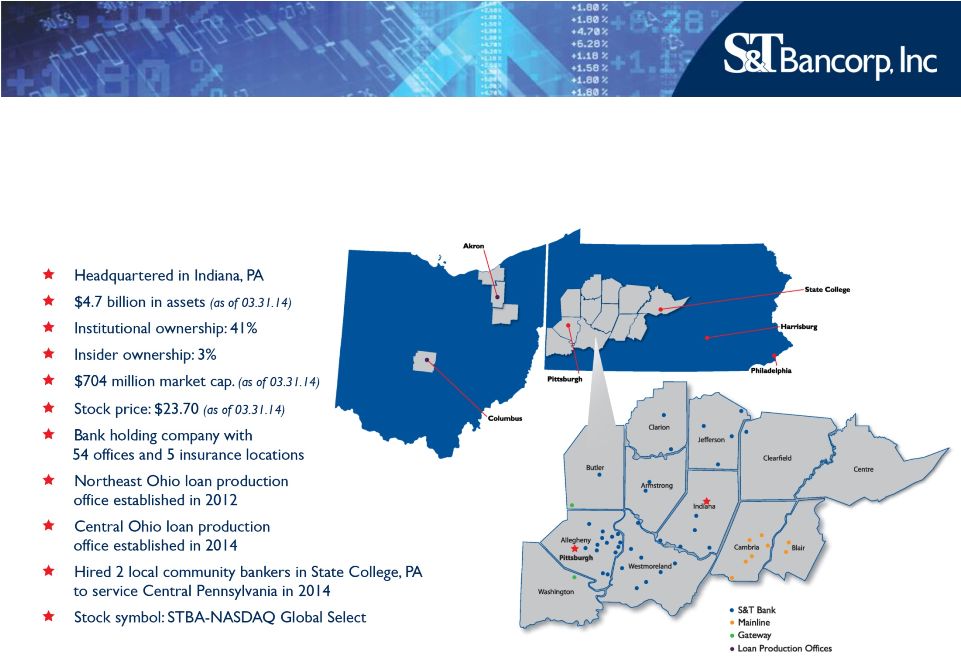 Corporate Profile
6 |
 STBA
Investment Thesis •
Stable Western PA economy
•
Long-term Marcellus Shale benefit
•
Opportunistic & effective acquisitions/expansions
•
Loan growth
•
Excellent asset quality
•
Demonstrated expense discipline and efficiency
•
Historically high performer
•
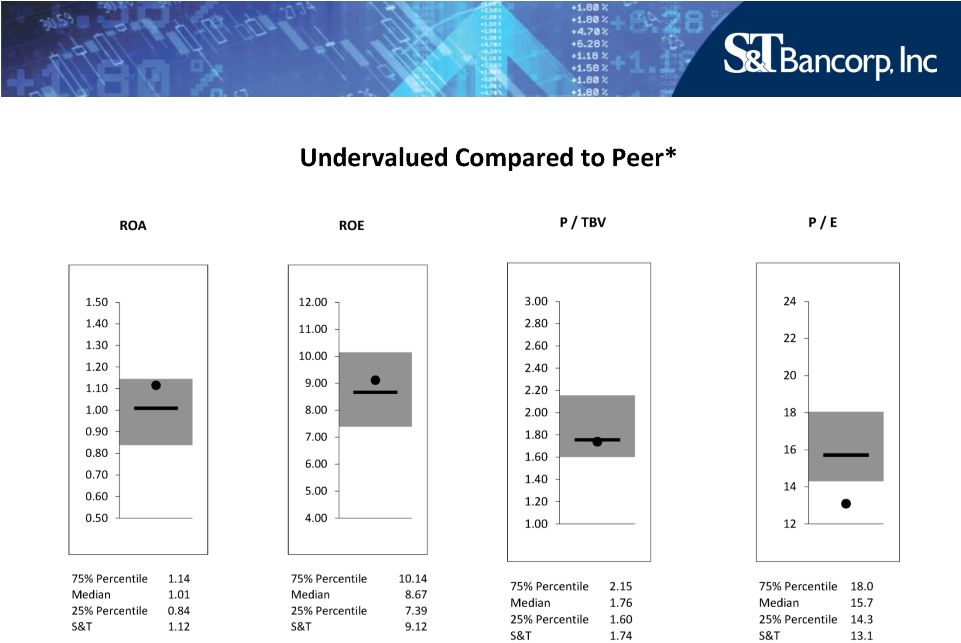
Undervalued compared to peer
7 |
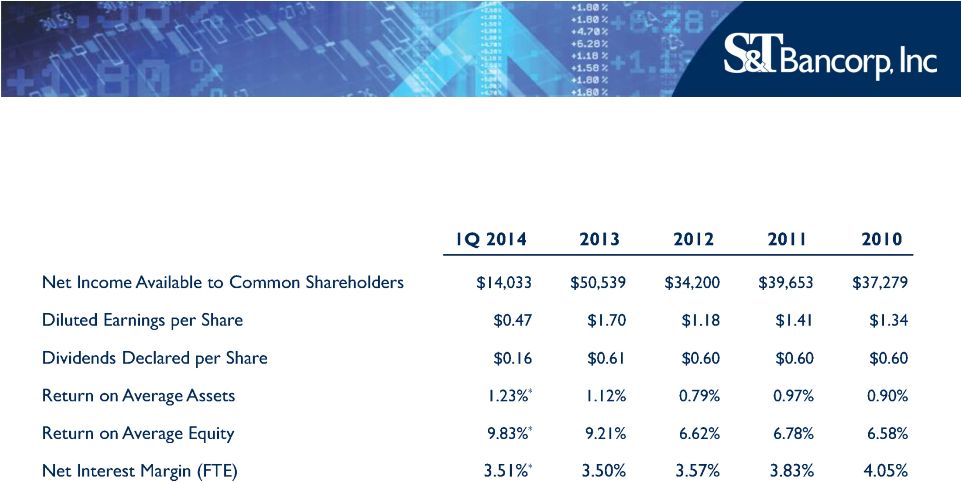 Performance Summary
Dollars in thousands, except per share data
*
Annualized
8 |
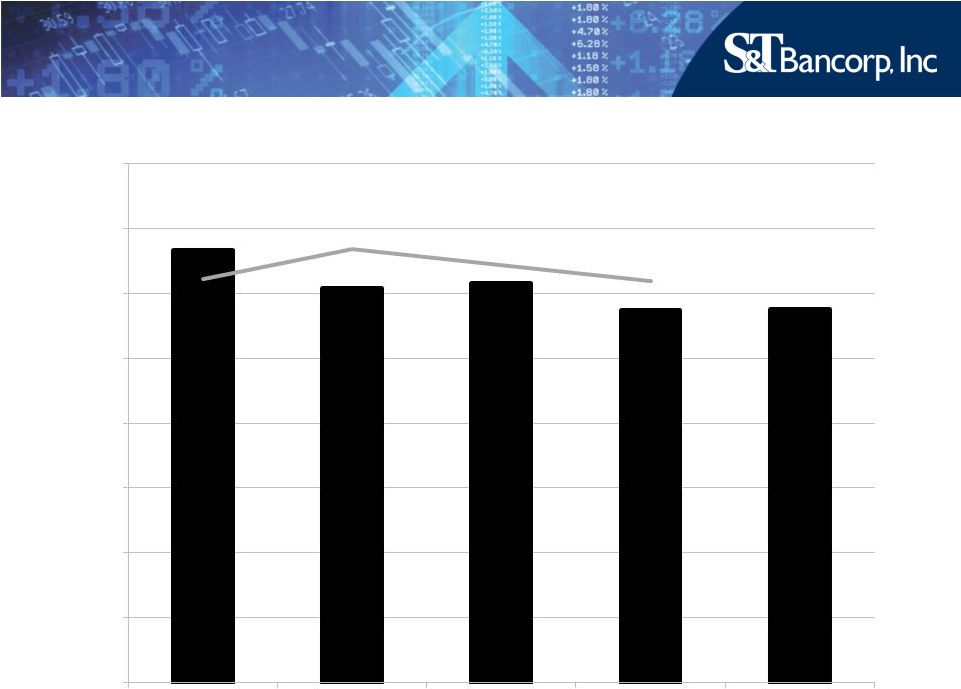
 * Bank
Holding Companies $3-10 Billion of Assets 9
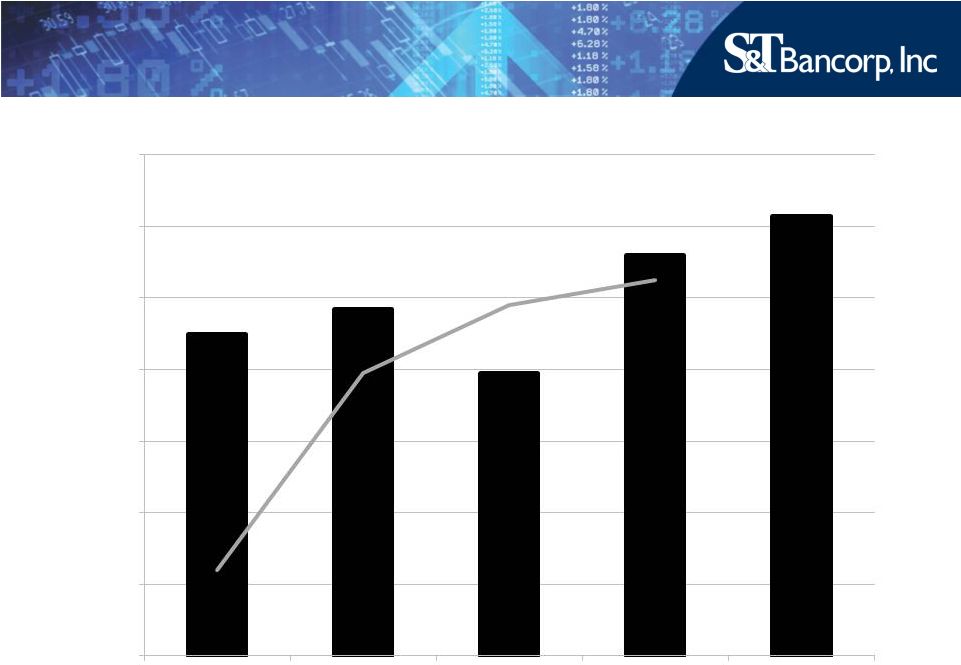
Peer*
0.0%
0.2%
0.4%
0.6%
0.8%
1.0%
1.2%
1.4%
2010
2011
2012
2013
1Q 14
Return on Average Assets |
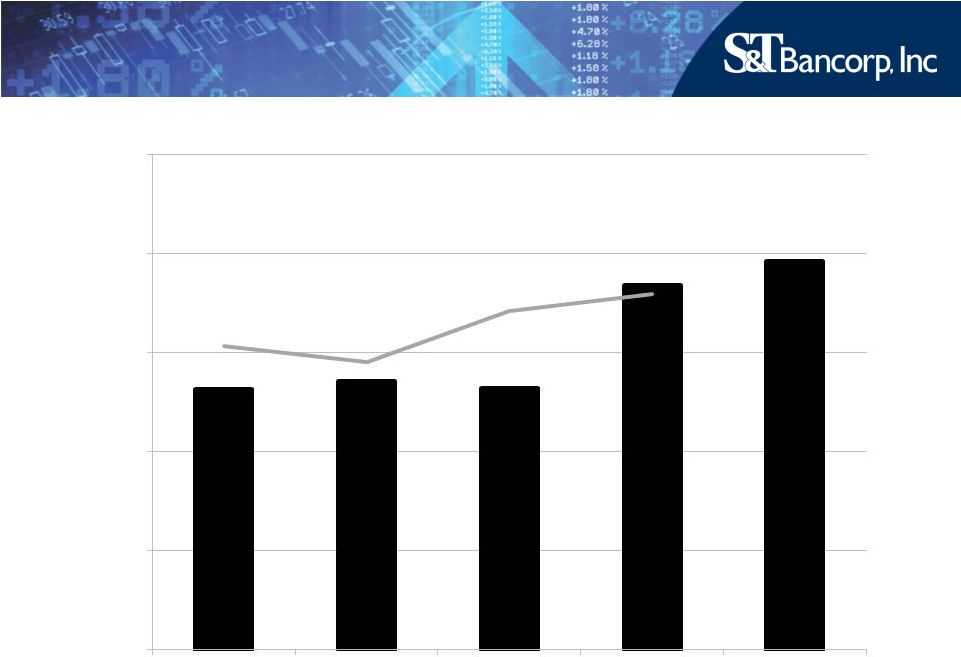 * Bank
Holding Companies $3-10 Billion of Assets 10
Peer*
0.0%
2.5%
5.0%
7.5%
10.0%
12.5%
2010
2011
2012
2013
1Q 14
Return on Average Equity |
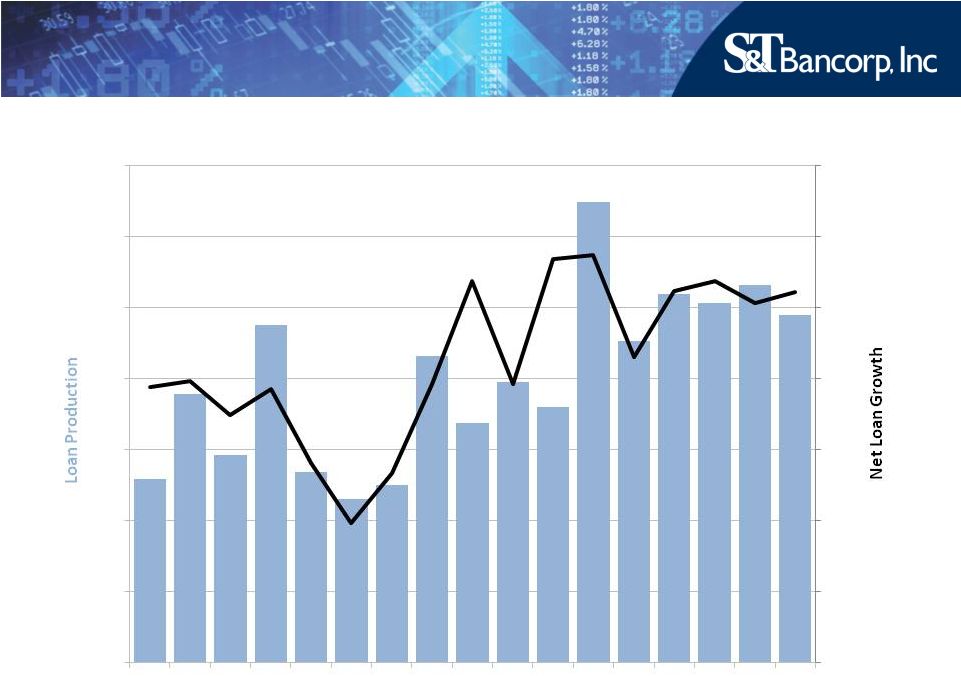 11
-$200
-$150
-$100
-$50
$0
$50
$100
$150
$0
$50
$100
$150
$200
$250
$300
$350
Q1
Q2
Q3
Q4
Q1
Q2
Q3
Q4
Q1
Q2
Q3
Q4
Q1
Q2
Q3
Q4
Q1
Loan Growth
$ in millions
2010
2011
2012
2013
2014 |
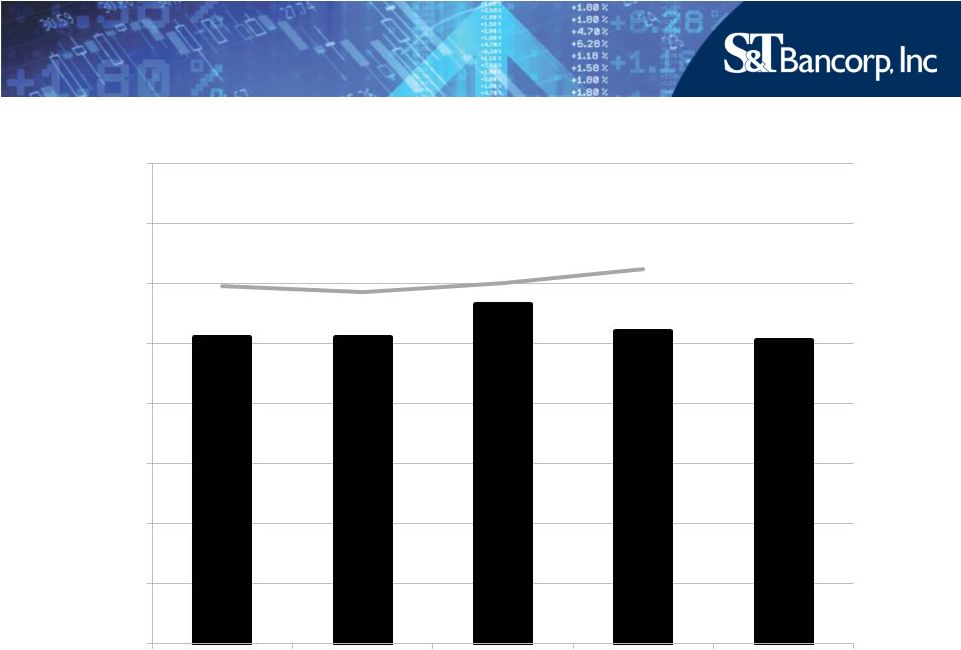 * Bank
Holding Companies $3-10 Billion of Assets 12
Peer*
0.0%
0.5%
1.0%
1.5%
2.0%
2.5%
3.0%
3.5%
4.0%
2010
2011
2012
2013
1Q 14
Non Interest Expense / Average Assets |
 13
Peer*
0.0%
2.5%
5.0%
7.5%
10.0%
12.5%
15.0%
17.5%
20.0%
2010
2011
2012
2013
1Q 14
Total Capital / RWA |
 Source: Bloomberg
*KRX –
KBW Regional Banking Index as of 5.14.14
14 |
 The
Right Size •
Big enough to:
–
Provide full complement of products and services
–
Access technology
–
Access capital markets
–
Attract talent
–
Expand –
mergers and acquisitions/de novo
•
Small enough to:
–
Stay close to our customers
–
Understand our markets
–
Be responsive
15 |
 2014 Annual Meeting |