Attached files
| file | filename |
|---|---|
| 8-K - 8-K - Intrepid Potash, Inc. | a14-12997_18k.htm |
Exhibit 99.1
|
|
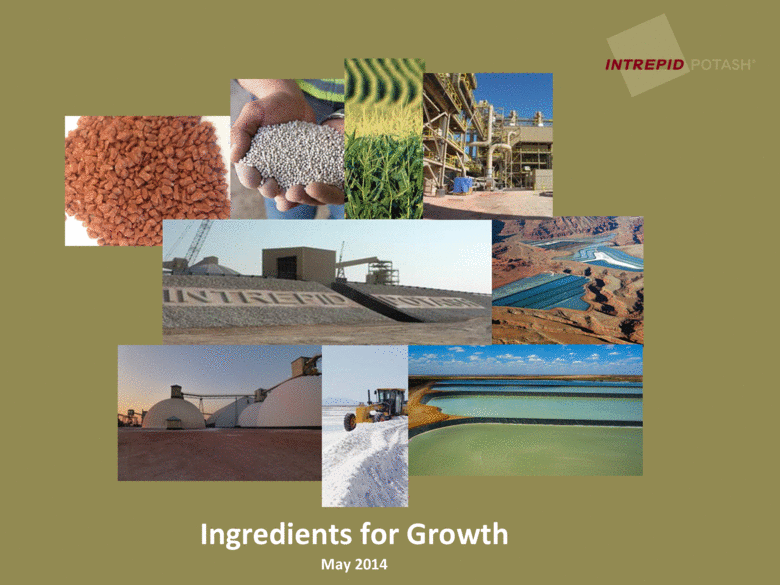
Ingredients for Growth May 2014 |
|
|
This presentation contains forward-looking statements — that is, statements about future, not past, events. These forward-looking statements often relate to our future performance and management’s expectations for the future, including statements about our financial outlook. Our forward-looking statements are based on estimates and assumptions that we believe are reasonable. Actual results could be materially different from our forward-looking statements. The factors that could cause actual results to differ are discussed in our periodic filings with the Securities and Exchange Commission. Statements regarding our financial outlook speak only as of the date of our first quarter 2014 earnings release, April 30, 2014, and all other forward-looking statements speak only as of the initial release date of this presentation, May 19, 2014. We have no duty to update publicly or revise any forward-looking statements to conform the statements to actual results or to reflect new information or future events. Safe Harbor 2 |
|
|
Built to be pure-play potassium product company Creating value through modernization of assets and new facilities Applying innovative technology Leader in low cost solar solution mining Geographically advantaged to key markets Committed to returning to profitability and generating free cash flow Achieve lower cost production Benefit from cost savings initiatives in place Significant reduction in capital investment in 2014 Intrepid Overview Building on Our History of Value Creation 3 Note: Free cash flow is a non-GAAP financial measure calculated as cash flows from operating activities less capital expenditures. |
|
|
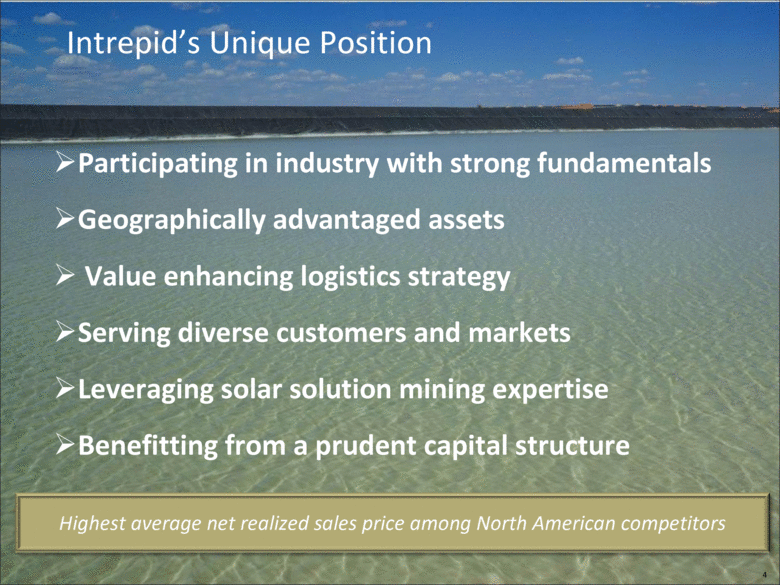
Intrepid’s Unique Position Participating in industry with strong fundamentals Geographically advantaged assets Value enhancing logistics strategy Serving diverse customers and markets Leveraging solar solution mining expertise Benefitting from a prudent capital structure Highest average net realized sales price among North American competitors 4 |
|
|
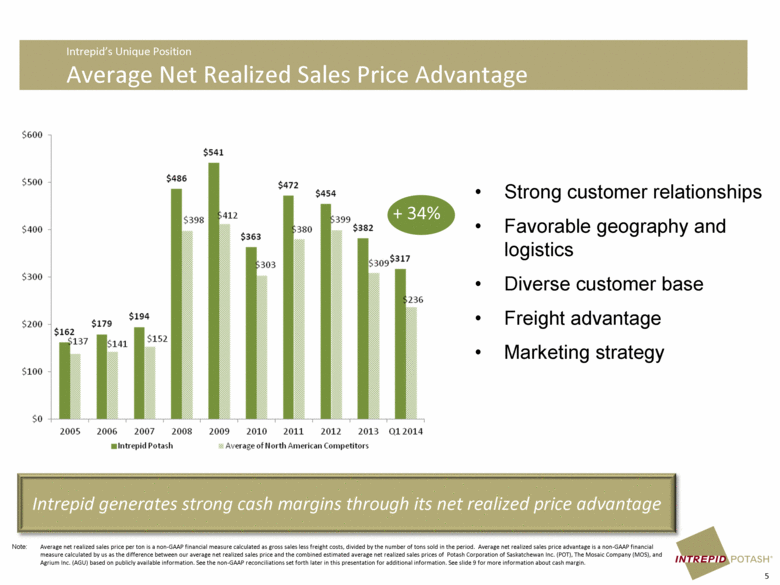
Intrepid generates strong cash margins through its net realized price advantage + 34% Note: Average net realized sales price per ton is a non-GAAP financial measure calculated as gross sales less freight costs, divided by the number of tons sold in the period. Average net realized sales price advantage is a non-GAAP financial measure calculated by us as the difference between our average net realized sales price and the combined estimated average net realized sales prices of Potash Corporation of Saskatchewan Inc. (POT), The Mosaic Company (MOS), and Agrium Inc. (AGU) based on publicly available information. See the non-GAAP reconciliations set forth later in this presentation for additional information. See slide 9 for more information about cash margin. Intrepid’s Unique Position Average Net Realized Sales Price Advantage 5 Strong customer relationships Favorable geography and logistics Diverse customer base Freight advantage Marketing strategy |
|
|
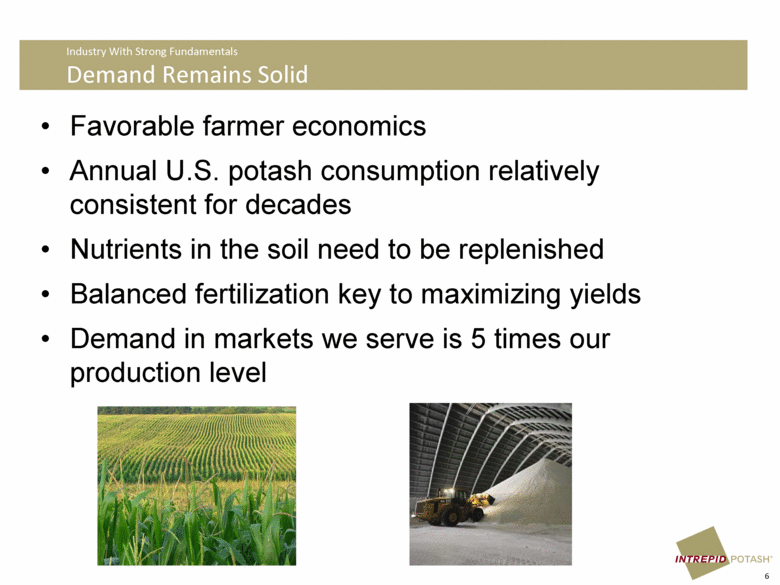
Favorable farmer economics Annual U.S. potash consumption relatively consistent for decades Nutrients in the soil need to be replenished Balanced fertilization key to maximizing yields Demand in markets we serve is 5 times our production level Industry With Strong Fundamentals Demand Remains Solid 6 |
|
|
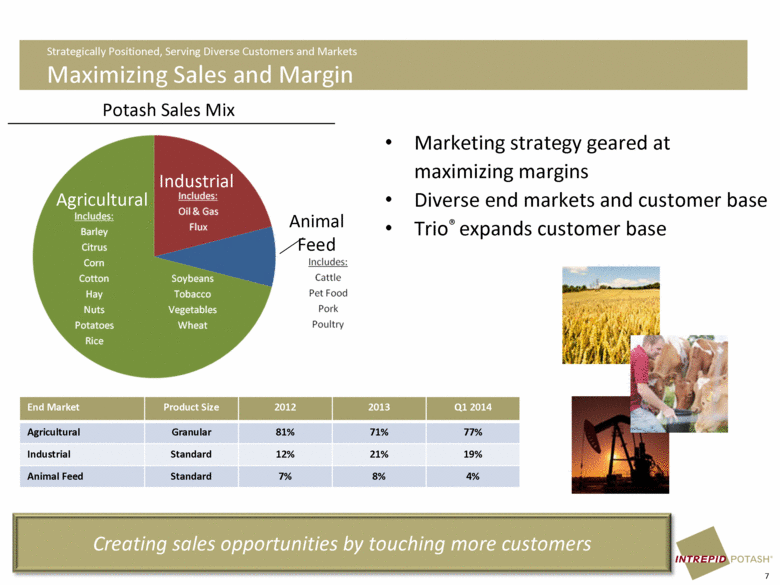
Strategically Positioned, Serving Diverse Customers and Markets Maximizing Sales and Margin Marketing strategy geared at maximizing margins Diverse end markets and customer base Trio® expands customer base End Market Product Size 2012 2013 Q1 2014 Agricultural Granular 81% 71% 77% Industrial Standard 12% 21% 19% Animal Feed Standard 7% 8% 4% Potash Sales Mix Industrial Agricultural Animal Feed 7 Creating sales opportunities by touching more customers |
|
|
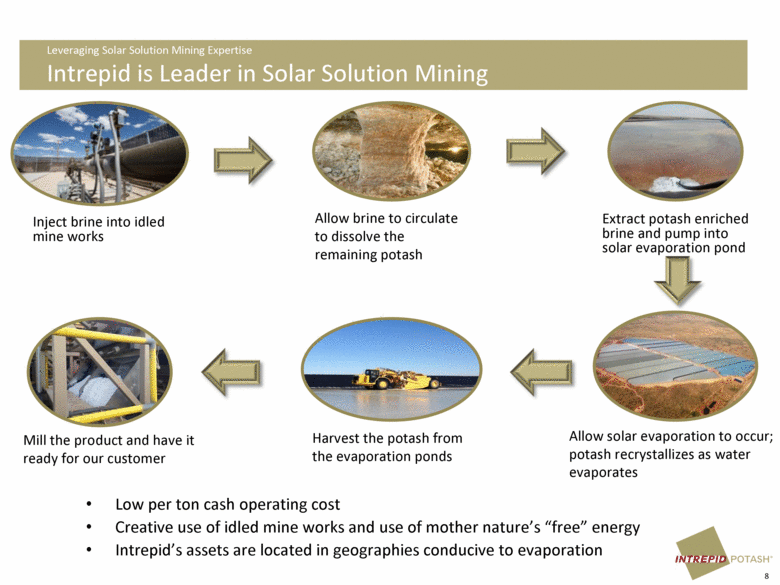
Leveraging Solar Solution Mining Expertise Intrepid is Leader in Solar Solution Mining Inject brine into idled mine works Allow brine to circulate to dissolve the remaining potash Extract potash enriched brine and pump into solar evaporation pond Low per ton cash operating cost Creative use of idled mine works and use of mother nature’s “free” energy Intrepid’s assets are located in geographies conducive to evaporation Allow solar evaporation to occur; potash recrystallizes as water evaporates Harvest the potash from the evaporation ponds Mill the product and have it ready for our customer 8 |
|
|
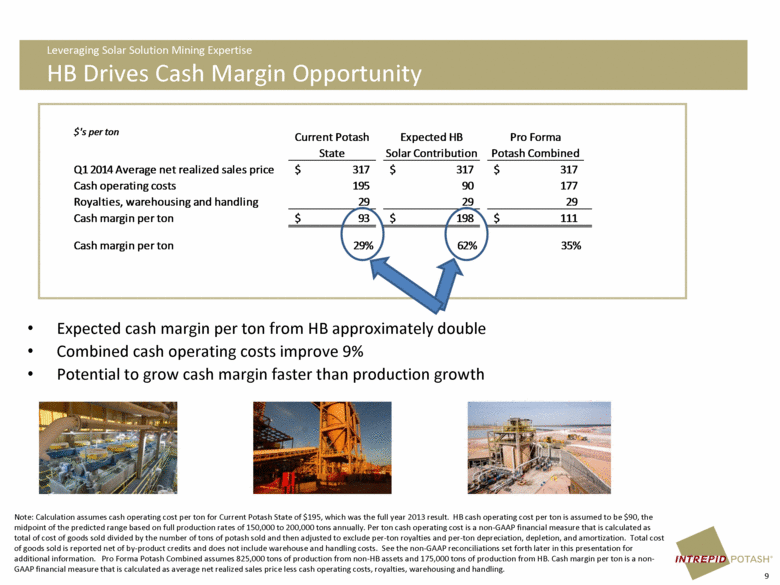
Leveraging Solar Solution Mining Expertise HB Drives Cash Margin Opportunity Expected cash margin per ton from HB approximately double Combined cash operating costs improve 9% Potential to grow cash margin faster than production growth 9 Note: Calculation assumes cash operating cost per ton for Current Potash State of $195, which was the full year 2013 result. HB cash operating cost per ton is assumed to be $90, the midpoint of the predicted range based on full production rates of 150,000 to 200,000 tons annually. Per ton cash operating cost is a non-GAAP financial measure that is calculated as total of cost of goods sold divided by the number of tons of potash sold and then adjusted to exclude per-ton royalties and per-ton depreciation, depletion, and amortization. Total cost of goods sold is reported net of by-product credits and does not include warehouse and handling costs. See the non-GAAP reconciliations set forth later in this presentation for additional information. Pro Forma Potash Combined assumes 825,000 tons of production from non-HB assets and 175,000 tons of production from HB. Cash margin per ton is a non-GAAP financial measure that is calculated as average net realized sales price less cash operating costs, royalties, warehousing and handling. $'s per ton Current Potash State Expected HB Solar Contribution Pro Forma Potash Combined Q1 2014 Average net realized sales price 317 $ 317 $ 317 $ Cash operating costs 195 90 177 Royalties, warehousing and handling 29 29 29 Cash margin per ton 93 $ 198 $ 111 $ Cash margin per ton 29% 62% 35% |
|
|
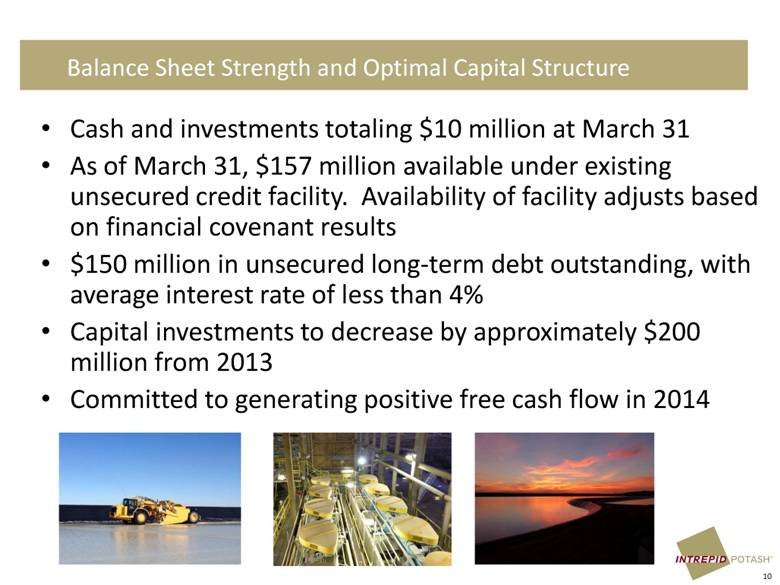
Cash and investments totaling $10 million at March 31 As of March 31, $157 million available under existing unsecured credit facility. Availability of facility adjusts based on financial covenant results $150 million in unsecured long-term debt outstanding, with average interest rate of less than 4% Capital investments to decrease by approximately $200 million from 2013 Committed to generating positive free cash flow in 2014 Balance Sheet Strength and Optimal Capital Structure 10 |
|
|
OBJECTIVE Respond to changing demand to pursue highest margin sales Ability to compact 100% of potash production PROJECTS North compaction Trio® pellet plant OBJECTIVE Increase production PROJECTS HB Solar Solution mine Moab solution mining caverns West plant improvements GROWTH OBJECTIVE Lower per ton cash operating costs PROJECTS HB Solar Solution mine North compaction West recovery improvement MARGIN Targeted Capital Investment Program to Achieve Greatest Returns 11 |

|
|
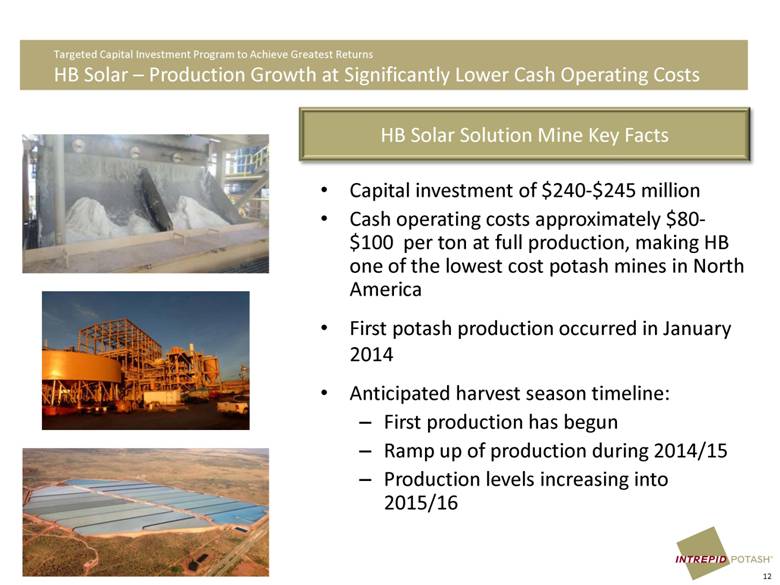
Targeted Capital Investment Program to Achieve Greatest Returns HB Solar – Production Growth at Significantly Lower Cash Operating Costs HB Solar Solution Mine Key Facts Capital investment of $240-$245 million Cash operating costs approximately $80-$100 per ton at full production, making HB one of the lowest cost potash mines in North America First potash production occurred in January 2014 Anticipated harvest season timeline: First production has begun Ramp up of production during 2014/15 Production levels increasing into 2015/16 12 |
|
|
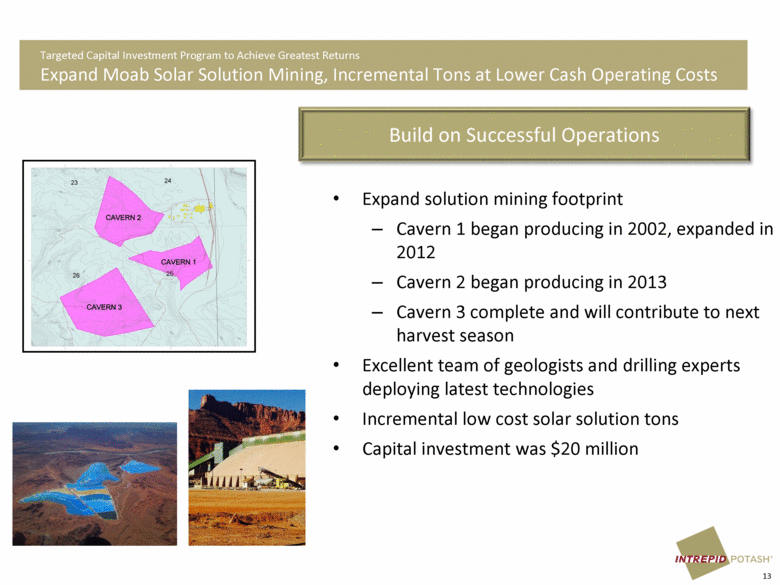
Targeted Capital Investment Program to Achieve Greatest Returns Expand Moab Solar Solution Mining, Incremental Tons at Lower Cash Operating Costs Build on Successful Operations Expand solution mining footprint Cavern 1 began producing in 2002, expanded in 2012 Cavern 2 began producing in 2013 Cavern 3 complete and will contribute to next harvest season Excellent team of geologists and drilling experts deploying latest technologies Incremental low cost solar solution tons Capital investment was $20 million 13 |
|
|
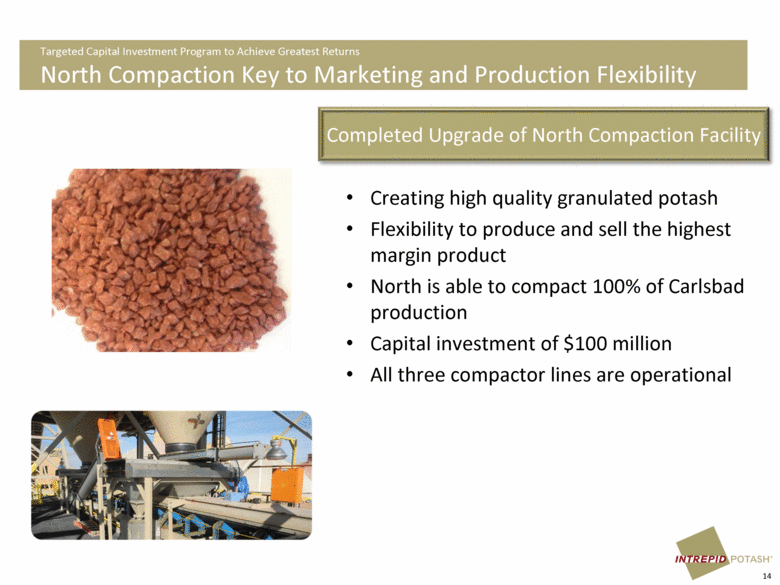
Targeted Capital Investment Program to Achieve Greatest Returns North Compaction Key to Marketing and Production Flexibility Completed Upgrade of North Compaction Facility Creating high quality granulated potash Flexibility to produce and sell the highest margin product North is able to compact 100% of Carlsbad production Capital investment of $100 million All three compactor lines are operational 14 |
|
|
Why Intrepid? Highest North American average net realized sales price over time and strong cash margin per ton Geographically advantaged assets and a logistics strategy to serve diversified markets and customer base Focused on growth, flexibility, and margin expansion Producing incremental low cost solar solution tons Strong capital structure Committed to lowering cost and generating positive free cash flow in 2014 15 |
|
|
Appendix ® Supplying a Growing America® Appendix |
|
|
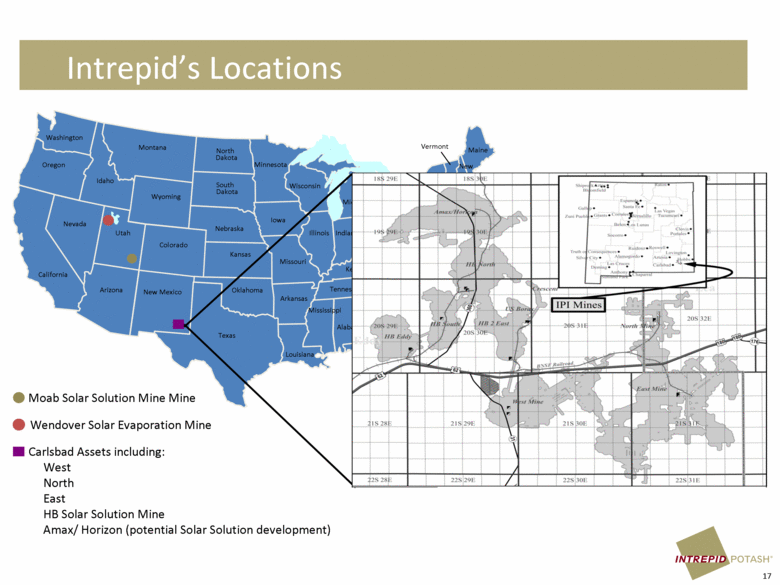
Wendover Solar Evaporation Mine Moab Solar Solution Mine Mine Carlsbad Assets including: West North East HB Solar Solution Mine Amax/ Horizon (potential Solar Solution development) Florida New Mexico Texas Oklahoma Kansas Nebraska South Dakota Montana Wyoming Colorado Utah Idaho Arizona Nevada Washington California Oregon Kentucky Maine New York Pennsylvania Michigan Vermont New Hampshire Virginia West Virginia Ohio Indiana Illinois North Carolina Tennessee South Carolina Alabama Mississippi Arkansas Louisiana Missouri Iowa Minnesota Wisconsin Georgia North Dakota Intrepid’s Locations 17 |
|
|
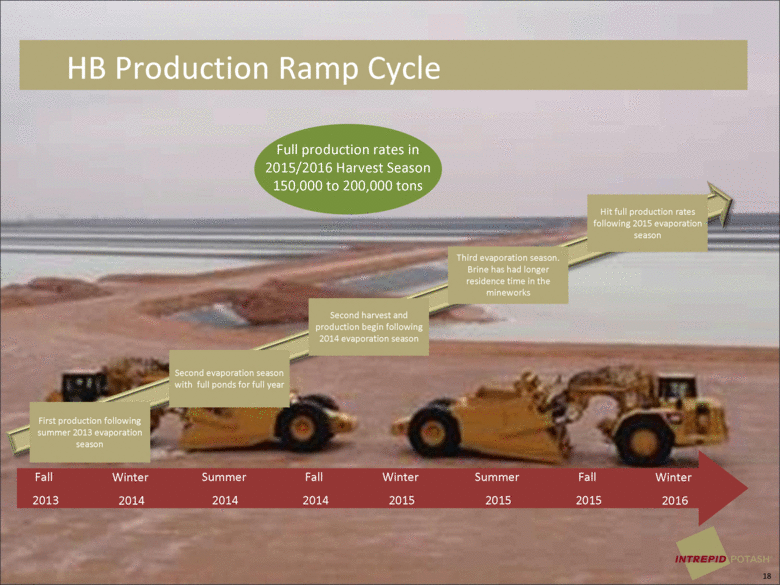
HB Production Ramp Cycle 18 First production following summer 2013 evaporation season Summer 2014 Winter 2015 Summer 2015 Winter 2016 Fall 2015 Fall 2014 Winter 2014 Fall 2013 Second evaporation season with full ponds for full year Second harvest and production begin following 2014 evaporation season Third evaporation season. Brine has had longer residence time in the mineworks Hit full production rates following 2015 evaporation season Full production rates in 2015/2016 Harvest Season 150,000 to 200,000 tons |
|
|
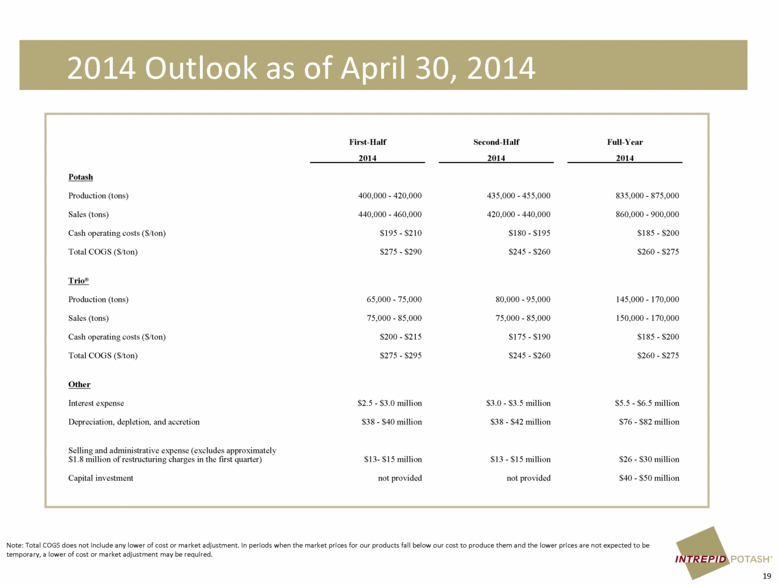
2014 Outlook as of April 30, 2014 19 Note: Total COGS does not include any lower of cost or market adjustment. In periods when the market prices for our products fall below our cost to produce them and the lower prices are not expected to be temporary, a lower of cost or market adjustment may be required. First-Half Second-Half Full-Year 2014 2014 2014 Potash Production (tons) 400,000 - 420,000 435,000 - 455,000 835,000 - 875,000 Sales (tons) 440,000 - 460,000 420,000 - 440,000 860,000 - 900,000 Cash operating costs ($/ton) $195 - $210 $180 - $195 $185 - $200 Total COGS ($/ton) $275 - $290 $245 - $260 $260 - $275 Trio® Production (tons) 65,000 - 75,000 80,000 - 95,000 145,000 - 170,000 Sales (tons) 75,000 - 85,000 75,000 - 85,000 150,000 - 170,000 Cash operating costs ($/ton) $200 - $215 $175 - $190 $185 - $200 Total COGS ($/ton) $275 - $295 $245 - $260 $260 - $275 Other Interest expense $2.5 - $3.0 million $3.0 - $3.5 million $5.5 - $6.5 million Depreciation, depletion, and accretion $38 - $40 million $38 - $42 million $76 - $82 million Selling and administrative expense (excludes approximately $1.8 million of restructuring charges in the first quarter) $13- $15 million $13 - $15 million $26 - $30 million Capital investment not provided not provided $40 - $50 million |
|
|
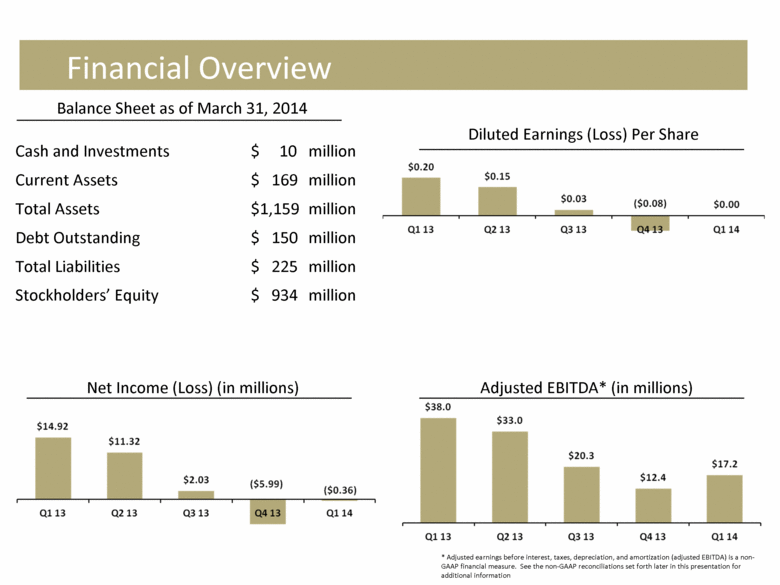
Financial Overview Adjusted EBITDA* (in millions) Balance Sheet as of March 31, 2014 Net Income (Loss) (in millions) Diluted Earnings (Loss) Per Share Cash and Investments $ 10 million Current Assets $ 169 million Total Assets $1,159 million Debt Outstanding $ 150 million Total Liabilities $ 225 million Stockholders’ Equity $ 934 million 20 * Adjusted earnings before interest, taxes, depreciation, and amortization (adjusted EBITDA) is a non-GAAP financial measure. See the non-GAAP reconciliations set forth later in this presentation for additional information |
|
|
Non-GAAP Reconciliations To supplement our consolidated financial statements, which are prepared and presented in accordance with GAAP, we use several non-GAAP financial measures to monitor and evaluate our performance. These non-GAAP financial measures may include adjusted EBITDA, adjusted net income, net sales, average net realized sales price, cash operating costs, average potash gross margin, average net realized sales price advantage, cash margin, and cash margin advantage. These non-GAAP financial measures should not be considered in isolation or as a substitute for, or superior to, the financial information prepared and presented in accordance with GAAP. In addition, because the presentation of these non-GAAP financial measures varies among companies, our non-GAAP financial measures may not be comparable to similarly titled measures used by other companies. We believe these non-GAAP financial measures provide useful information to investors for analysis of our business. We also refer to these non-GAAP financial measures in assessing our performance and when planning, forecasting and analyzing future periods. We believe these non-GAAP financial measures are widely used by professional research analysts and others in the valuation, comparison and investment recommendations of companies in the potash mining industry. Many investors use the published research reports of these professional research analysts and others in making investment decisions. The following slides contain additional information about the non-GAAP financial measures used in this presentation, including reconciliations of our non-GAAP financial measures to the most directly comparable GAAP measures: |
|
|
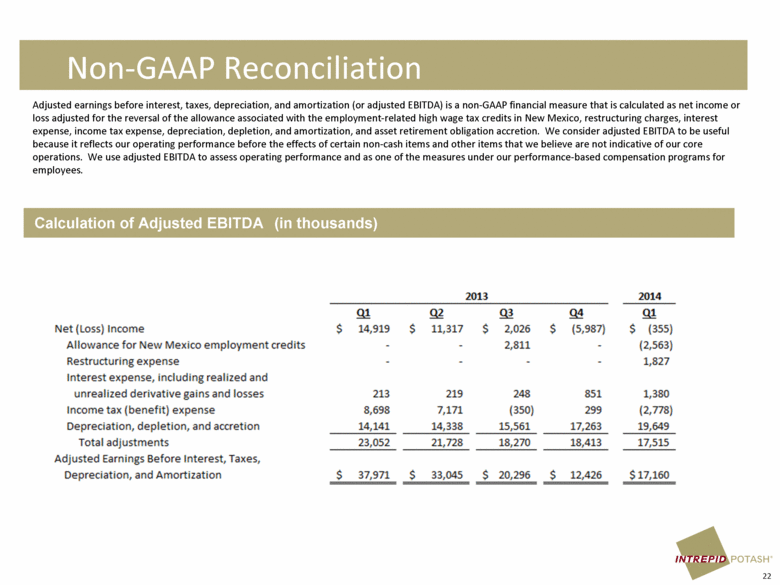
Non-GAAP Reconciliation Calculation of Adjusted EBITDA (in thousands) Adjusted earnings before interest, taxes, depreciation, and amortization (or adjusted EBITDA) is a non-GAAP financial measure that is calculated as net income or loss adjusted for the reversal of the allowance associated with the employment-related high wage tax credits in New Mexico, restructuring charges, interest expense, income tax expense, depreciation, depletion, and amortization, and asset retirement obligation accretion. We consider adjusted EBITDA to be useful because it reflects our operating performance before the effects of certain non-cash items and other items that we believe are not indicative of our core operations. We use adjusted EBITDA to assess operating performance and as one of the measures under our performance-based compensation programs for employees. 22 EBITDA (in thousands) Net (Loss) Income Allowance for New Mexico employment credits Restructuring expense Interest expense, including realized and unrealized derivative gains and losses Income tax (benefit) expense Depreciation, depletion, and accretion Total adjustments Adjusted Earnings Before Interest, Taxes, Depreciation, and Amortization 2013 2014 Q1 $ 14,919 - - 213 8,698 14,141 $ 11,317 - - 219 7,171 14,338 Q2 $ 2,026 2,811 - 248 (350) 15,.561 Q3 $ 5..987) - - 851 299 17,263 Q3 $ (a5.5) (2,563) 1,827 1,380 (2,778) 19,649 23,052 21,723 18,270 18,413 17,515 5 37,971 5 33,045 5 20,296 5 12,426 $ 17,160 |
|
|
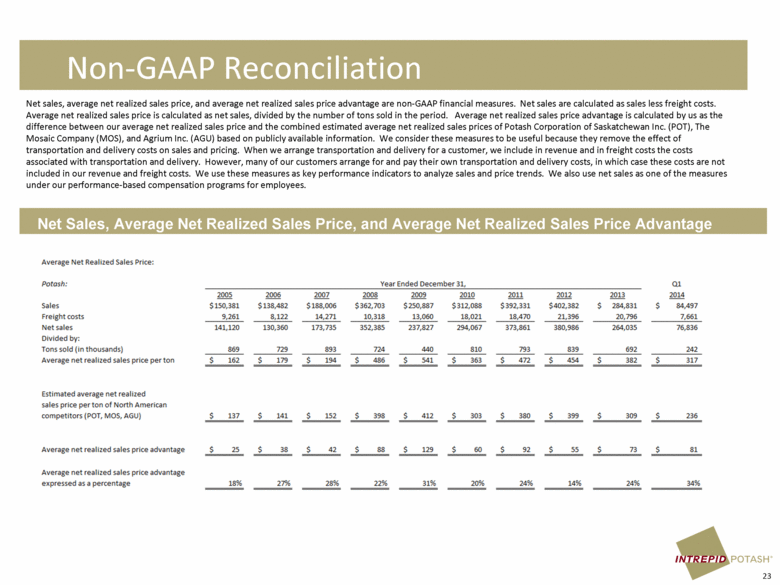
Non-GAAP Reconciliation Net sales, average net realized sales price, and average net realized sales price advantage are non-GAAP financial measures. Net sales are calculated as sales less freight costs. Average net realized sales price is calculated as net sales, divided by the number of tons sold in the period. Average net realized sales price advantage is calculated by us as the difference between our average net realized sales price and the combined estimated average net realized sales prices of Potash Corporation of Saskatchewan Inc. (POT), The Mosaic Company (MOS), and Agrium Inc. (AGU) based on publicly available information. We consider these measures to be useful because they remove the effect of transportation and delivery costs on sales and pricing. When we arrange transportation and delivery for a customer, we include in revenue and in freight costs the costs associated with transportation and delivery. However, many of our customers arrange for and pay their own transportation and delivery costs, in which case these costs are not included in our revenue and freight costs. We use these measures as key performance indicators to analyze sales and price trends. We also use net sales as one of the measures under our performance-based compensation programs for employees. 23 Net Sales, Average Net Realized Sales Price, and Average Net Realized Sales Price Advantage Average Net Realized Sales Price: Potash: Year Ended December 31, Q1 2005 2006 2007 2008 2009 2010 2011 2012 2013 2014 Sales $150,381 $138,482 $188,006 $362,703 $250,887 $312,088 $392,331 $402,382 $ 284,831 $ 84,497 Freight costs 9,261 8,122 14,271 10,318 13,060 18,021 18,470 21,396 20,796 7,661 Net sales 141,120 130,360 173,735 352,385 237,827 294,067 373,86.1 380,986 264,035 76,836 Divided by: Tons sold (in thousands) 869 729 893 724- 440 810 793 S39 692 242 Average net realized sales price per ton $ 162 $ 179 $ 194 $ 486 $ 541 $ 363 $ 4-72 $ 454 5 382 $ 317 Estimated average net realized sales price perton of North American competitors (POT, MOS, AGU) $ 137 $ 141 $ 152 $ 398 $ 412 $ 303 380 $ 399 309 $ 236 Average net realized sales price advantage 25 38 42 SS 129 60 92 55 73 al Average net realized sales price advantage expressed as a percentage is% 27% zs% 22% 31% 20% 24% 14% 24% 34% |
|
|
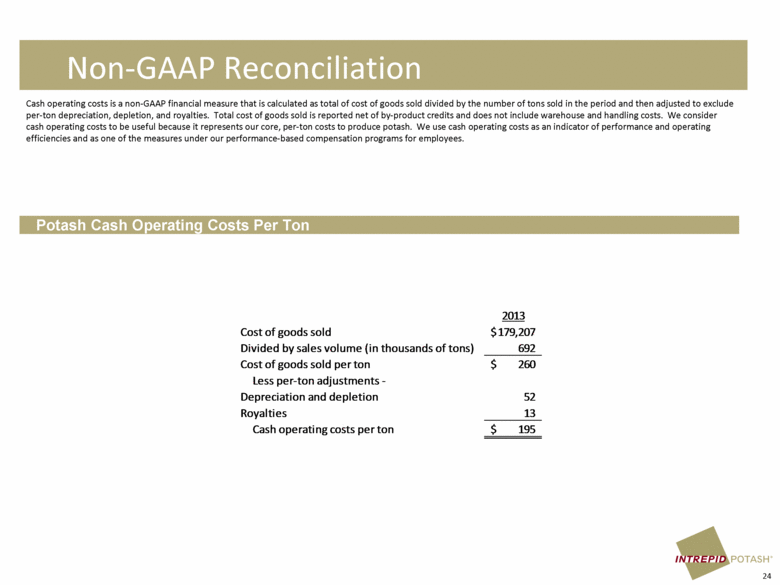
Non-GAAP Reconciliation Cash operating costs is a non-GAAP financial measure that is calculated as total of cost of goods sold divided by the number of tons sold in the period and then adjusted to exclude per-ton depreciation, depletion, and royalties. Total cost of goods sold is reported net of by-product credits and does not include warehouse and handling costs. We consider cash operating costs to be useful because it represents our core, per-ton costs to produce potash. We use cash operating costs as an indicator of performance and operating efficiencies and as one of the measures under our performance-based compensation programs for employees. 24 Potash Cash Operating Costs Per Ton 2013 Cost of goods sold 179,207 $ Divided by sales volume (in thousands of tons) 692 Cost of goods sold per ton 260 $ Less per-ton adjustments - Depreciation and depletion 52 Royalties 13 Cash operating costs per ton 195 $ |
|
|
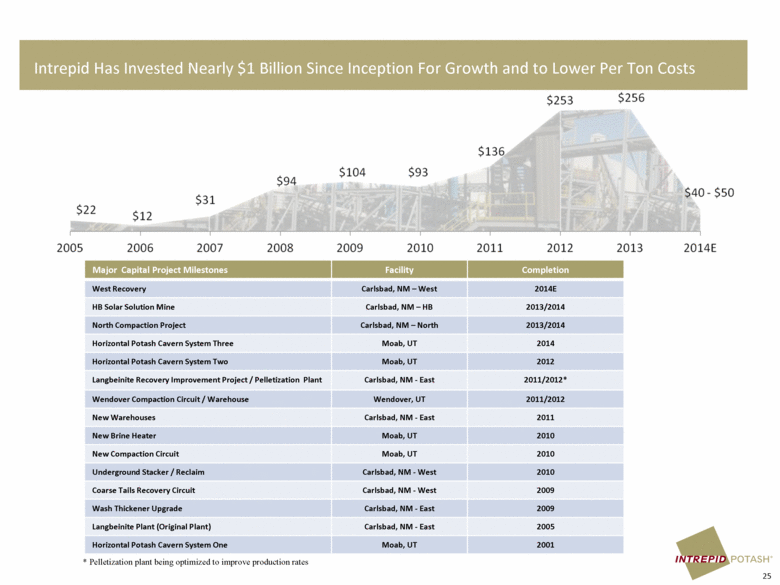
Intrepid Has Invested Nearly $1 Billion Since Inception For Growth and to Lower Per Ton Costs Major Capital Project Milestones Facility Completion West Recovery Carlsbad, NM – West 2014E HB Solar Solution Mine Carlsbad, NM – HB 2013/2014 North Compaction Project Carlsbad, NM – North 2013/2014 Horizontal Potash Cavern System Three Moab, UT 2014 Horizontal Potash Cavern System Two Moab, UT 2012 Langbeinite Recovery Improvement Project / Pelletization Plant Carlsbad, NM - East 2011/2012* Wendover Compaction Circuit / Warehouse Wendover, UT 2011/2012 New Warehouses Carlsbad, NM - East 2011 New Brine Heater Moab, UT 2010 New Compaction Circuit Moab, UT 2010 Underground Stacker / Reclaim Carlsbad, NM - West 2010 Coarse Tails Recovery Circuit Carlsbad, NM - West 2009 Wash Thickener Upgrade Carlsbad, NM - East 2009 Langbeinite Plant (Original Plant) Carlsbad, NM - East 2005 Horizontal Potash Cavern System One Moab, UT 2001 25 * Pelletization plant being optimized to improve production rates |
|
|
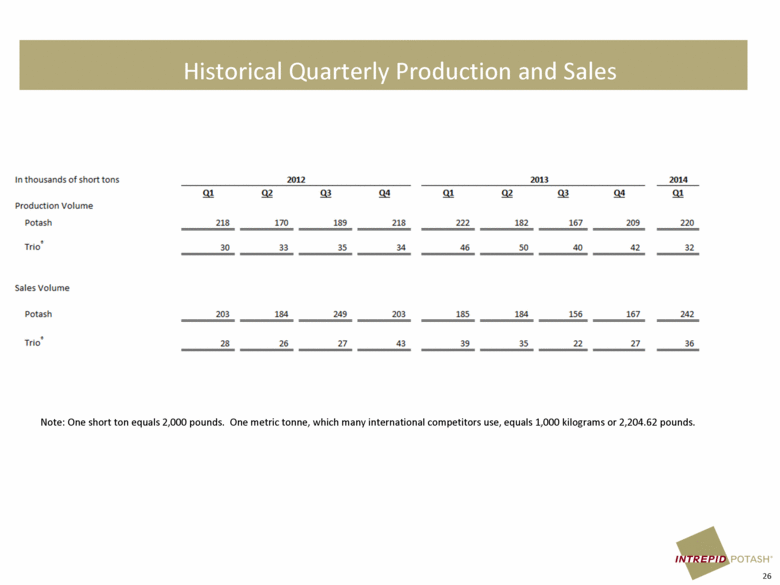
Historical Quarterly Production and Sales 26 Note: One short ton equals 2,000 pounds. One metric tonne, which many international competitors use, equals 1,000 kilograms or 2,204.62 pounds. In thousands of shorttons Production Volume 2012 2013 2014 Q1 Q2 Q3 Q1 Q2 Q3 Q4 Q4 Q1 Potash 218 170 189 218 222 182 167 209 220 Trio 30 33 35 34 46 50 40 42 32 Sales Volume Potash 203 184 249 203 185 184 156 167 242 Trio' 28 26 27 43 39 35 22 27 36 |
|
|
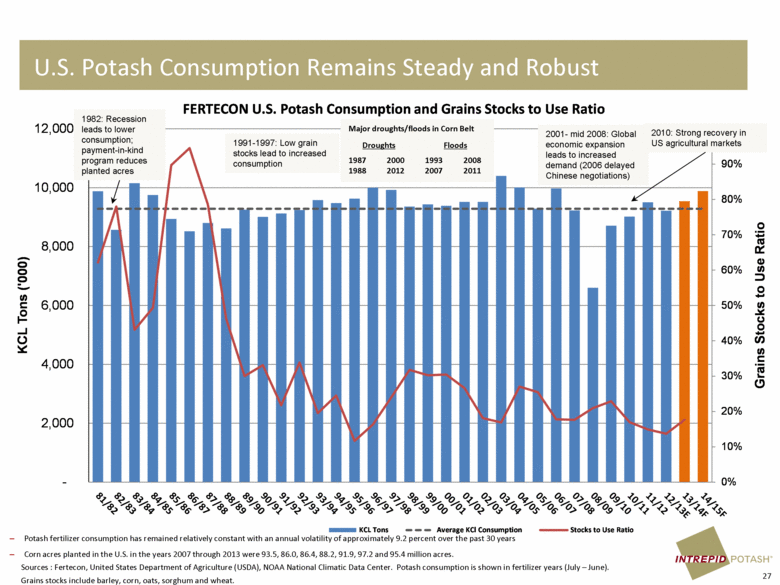
U.S. Potash Consumption Remains Steady and Robust Sources : Fertecon, United States Department of Agriculture (USDA), NOAA National Climatic Data Center. Potash consumption is shown in fertilizer years (July – June). Grains stocks include barley, corn, oats, sorghum and wheat. Potash fertilizer consumption has remained relatively constant with an annual volatility of approximately 9.2 percent over the past 30 years Corn acres planted in the U.S. in the years 2007 through 2013 were 93.5, 86.0, 86.4, 88.2, 91.9, 97.2 and 95.4 million acres. 1982: Recession leads to lower consumption; payment-in-kind program reduces planted acres 1991-1997: Low grain stocks lead to increased consumption 2001- mid 2008: Global economic expansion leads to increased demand (2006 delayed Chinese negotiations) 2010: Strong recovery in US agricultural markets Major droughts/floods in Corn Belt Droughts Floods 1987 1988 2000 2012 1993 2007 2008 2011 27 0% 10% 20% 30% 40% 50% 60% 70% 80% 90% 100% - 2,000 4,000 6,000 8,000 10,000 12,000 Grains Stocks to Use Ratio KCL Tons ('000) FERTECON U.S. Potash Consumption and Grains Stocks to Use Ratio KCL Tons Average KCl Consumption Stocks to Use Ratio |
|
|
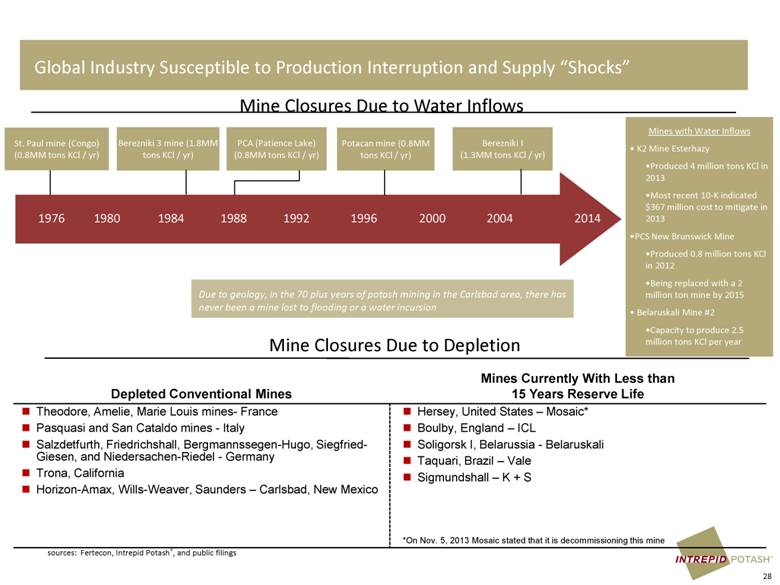
Global Industry Susceptible to Production Interruption and Supply “Shocks” Depleted Conventional Mines Mines Currently With Less than 15 Years Reserve Life Theodore, Amelie, Marie Louis mines- France Pasquasi and San Cataldo mines - Italy Salzdetfurth, Friedrichshall, Bergmannssegen-Hugo, Siegfried-Giesen, and Niedersachen-Riedel - Germany Trona, California Horizon-Amax, Wills-Weaver, Saunders – Carlsbad, New Mexico Hersey, United States – Mosaic* Boulby, England – ICL Soligorsk I, Belarussia - Belaruskali Taquari, Brazil – Vale Sigmundshall – K + S *On Nov. 5, 2013 Mosaic stated that it is decommissioning this mine sources: Fertecon, Intrepid Potash®, and public filings Mine Closures Due to Water Inflows PCA (Patience Lake) (0.8MM tons KCl / yr) Potacan mine (0.8MM tons KCl / yr) Mines with Water Inflows K2 Mine Esterhazy Produced 4 million tons KCl in 2013 Most recent 10-K indicated $367 million cost to mitigate in 2013 PCS New Brunswick Mine Produced 0.8 million tons KCl in 2012 Being replaced with a 2 million ton mine by 2015 Belaruskali Mine #2 Capacity to produce 2.5 million tons KCl per year St. Paul mine (Congo) (0.8MM tons KCl / yr) Berezniki I (1.3MM tons KCl / yr) Berezniki 3 mine (1.8MM tons KCl / yr) Mine Closures Due to Depletion Due to geology, in the 70 plus years of potash mining in the Carlsbad area, there has never been a mine lost to flooding or a water incursion 28 |
|
|
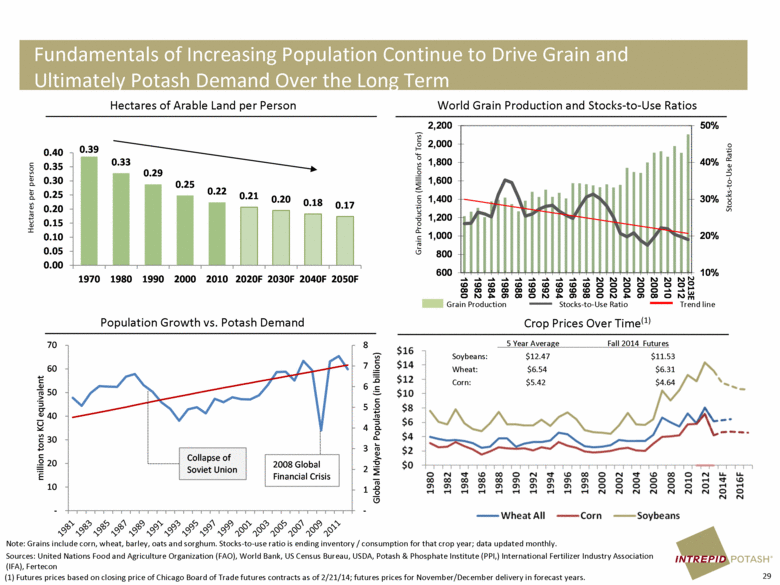
Fundamentals of Increasing Population Continue to Drive Grain and Ultimately Potash Demand Over the Long Term Note: Grains include corn, wheat, barley, oats and sorghum. Stocks-to-use ratio is ending inventory / consumption for that crop year; data updated monthly. Sources: United Nations Food and Agriculture Organization (FAO), World Bank, US Census Bureau, USDA, Potash & Phosphate Institute (PPI,) International Fertilizer Industry Association (IFA), Fertecon (1) Futures prices based on closing price of Chicago Board of Trade futures contracts as of 2/21/14; futures prices for November/December delivery in forecast years. Hectares of Arable Land per Person Hectares per person Crop Prices Over Time(1) World Grain Production and Stocks-to-Use Ratios Grain Production Stocks-to-Use Ratio 5 Year Average Fall 2014 Futures Soybeans: $12.47 $11.53 Wheat: $6.54 $6.31 Corn: $5.42 $4.64 Grain Production (Millions of Tons) Stocks-to-Use Ratio Trend line Population Growth vs. Potash Demand 2013E 29 0.39 0.33 0.29 0.25 0.22 0.21 0.20 0.18 0.17 0.00 0.05 0.10 0.15 0.20 0.25 0.30 0.35 0.40 1970 1980 1990 2000 2010 2020F 2030F 2040F 2050F - 1 2 3 4 5 6 7 8 - 10 20 30 40 50 60 70 Global Midyear Population (in billions) million tons KCl equivalent Collapse of Soviet Union 2008 Global Financial Crisis |
|
|
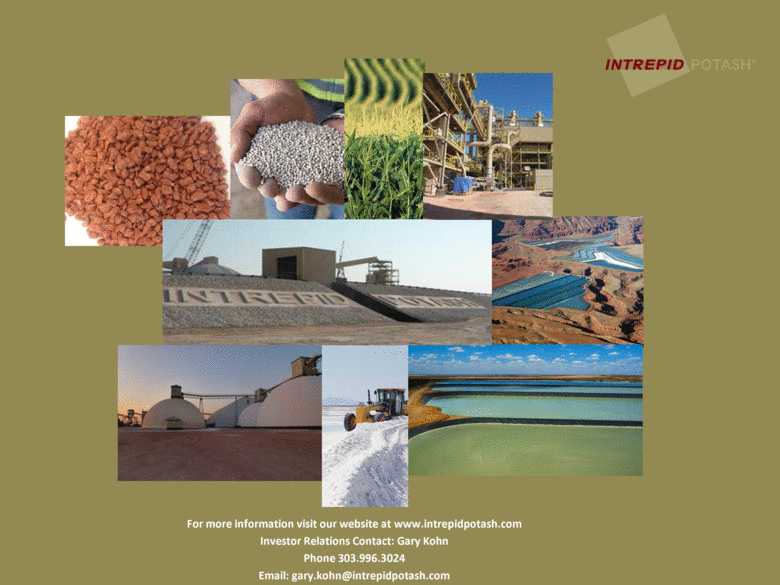
For more information visit our website at www.intrepidpotash.com Investor Relations Contact: Gary Kohn Phone 303.996.3024 Email: gary.kohn@intrepidpotash.com |