Attached files
| file | filename |
|---|---|
| 8-K - FORM 8-K - Apollo Global Management, Inc. | d729996d8k.htm |
 Investor Presentation
May 2014
Exhibit 99.1
Confidential – Not for distribution, in whole or in part, without the express
written consent of Apollo Global Management, LLC. Information contained
herein is as of March 31, 2014 unless otherwise noted |
 Important
Notes
Regarding
the
Use
of
Index
Comparison:
Legal Disclaimer
1
This presentation is confidential and may not be distributed, transmitted or
otherwise communicated to others, in whole or in part, without the express consent of Apollo Global Management, LLC or any of its affiliates
(“Apollo”). This presentation does not constitute an offer to
sell, or the solicitation of an offer to buy, any security, product or service, including interests in the private investment funds discussed herein. The information
contained in this presentation may change at any time without notice and Apollo
does not have any responsibility to update the presentation to account for such change.
Apollo makes no representation or warranty, expressed or implied, with respect
to the accuracy, reasonableness, or completeness of any of the information contained herein, including, but not limited to, information obtained
from third parties. The information contained herein is not intended to provide,
and should not be relied upon for, accounting, legal or tax advice or investment recommendations.
Certain information contained herein may be “forward-looking” in
nature. Due to various risks and uncertainties, actual events or results or the actual performance of a Fund may differ materially from those reflected or
contemplated in such forward-looking information. As such, undue reliance
should not be placed on such information. Forward-looking statements may be identified by the use of terminology including, but not limited to,
“may,” “will,” “should,” “expect,”
“anticipate,” “target,” “project,” “estimate,” “intend,” “continue” or “believe” or the negatives thereof or other variations thereon or comparable terminology.
“Assets Under Management,” or “AUM,” refers to the
investments we manage or with respect to which we have control, including capital we have the right to call from our investors pursuant to their capital commitments to
various funds. Our AUM equals the sum of: (i) the fair value of our private
equity investments plus the capital that we are entitled to call from our investors pursuant to the terms of their capital commitments; (ii) the net asset
value of our credit funds, other than certain collateralized loan obligations
and collateralized debt obligations, which have a fee generating basis other than mark-to-market value of the underlying assets, plus used or available
leverage and/or capital commitments; (iii) the gross asset values or net asset
values of our real estate entities and the structured portfolio vehicle investments included within the funds we manage, which includes the leverage used
by such structured portfolio vehicles; (iv) the incremental value associated
with the reinsurance investments of the portfolio company assets that we manage; and (v) the fair value of any other investments that we manage plus
unused credit facilities, including capital commitments for investments that may
require pre-qualification before investment plus any other capital commitments available for investment that are not otherwise included in the
clauses above. Our AUM measure includes Assets Under Management for which we
charge either no or nominal fees. Our definition of AUM is not based on any definition of Assets Under Management contained in our
operating agreement or in any of our Apollo fund management agreements. We
consider multiple factors for determining what should be included in our definition of AUM. Such factors include but are not limited to (1) our
ability to influence the investment decisions for existing and available assets;
(2) our ability to generate income from the underlying assets in our funds; and (3) the AUM measures that we use internally or believe are used by
other investment managers. Given the differences in the investment strategies
and structures among other alternative investment managers, our calculation of AUM may differ from the calculations employed by other investment
managers and, as a result, this measure may not be directly comparable to
similar measures presented by other investment managers.
Index performance and yield data are shown for illustrative purposes only and
have limitations when used for comparison or for other purposes due to, among
other matters, volatility, credit or other factors (such as number and types of
securities). It may not be possible to directly invest in one or more of these indices and the holdings of any fund managed by Apollo may differ
markedly from the holdings of any such index in terms of levels of
diversification, types of securities or assets represented and other significant factors. Indices are unmanaged, do not charge any fees or expenses, assume
reinvestment of income and do not employ special investment techniques such as
leveraging or short selling. No such index is indicative of the future results of any fund managed by Apollo.
Past performance is not indicative nor a guarantee of future returns. |
 This presentation may contain forward looking statements that are within the
meaning of Section 27A of the Securities Act of 1933 and Section 21E of the Securities Exchange Act of 1934. These statements include,
but are not limited to, discussions related to Apollo’s expectations
regarding the performance of its business, its liquidity and capital resources and other non-historical statements. These forward-looking statements are
based on management’s beliefs, as well as assumptions made by, and
information currently available to, management. When used in this presentation, the words “believe,” “anticipate,” “estimate,” “expect,” “intend”
and similar expressions are intended to identify forward-looking statements.
Although management believes that the expectations reflected in these forward-looking statements are reasonable, it can give no assurance that
these expectations will prove to have been correct. These statements are subject
to certain risks, uncertainties and assumptions. We believe these factors include but are not limited to those described under the section entitled
“Risk Factors” in the Company’s Annual Report on Form 10-K
for the fiscal year ended December 31, 2013 and Quarterly Report on Form 10-Q for the three months ended March 31, 2014, each as filed with the
Securities and Exchange Commission (“SEC”), as such factors may be
updated from time to time in our periodic filings with the SEC, which are accessible on the SEC’s website as www.sec.gov. These factors should
not be construed as exhaustive and should be read in conjunction with the other
cautionary statements that are included in this presentation and in other SEC filings. We undertake no obligation to publicly update or
review any forward-looking statements, whether as a result of new
information, future developments or otherwise. Information contained herein may include information with respect to prior
investment performance of one or more Apollo funds or investments including gross and/or net internal rates of return (“IRR”). Information
with respect to prior performance, while a useful tool in evaluating
Apollo’s investment activities, is not necessarily indicative of actual results that may be achieved for unrealized investments. “Gross IRR” of a private
equity fund represents the cumulative investment-related cash flows for all
of the investors in the fund on the basis of the actual timing of investment inflows and outflows (for unrealized investment assuming disposition of
the respective “as of” dates referenced) aggregated on a gross basis
quarterly, and the return is annualized and compounded before management fees, carried interest and certain other fund expenses (including interest
incurred by the fund itself) and measures the returns on the fund’s
investments as a whole without regard to whether all of the returns would, if distributed, be payable to the fund’s investors. “Net IRR” of a private
equity fund means the gross IRR applicable to all investors, including related
parties which may not pay fees, net of management fees, organizational expenses, transaction costs, and certain other fund expenses (including
interest incurred by the fund itself); the realized and estimated unrealized
value is adjusted such that a percentage up to 20.0% of the unrealized gain is allocated to the general partner, thereby reducing the balance
attributable to fund investors’ carried interest all offset to the extent
of interest income, and measures returns based on amounts that, if distributed, would be paid to investors of the fund, to the extent that a private equity
fund exceeds all requirements detailed within the applicable fund agreement.
This presentation is for informational purposes only and does not constitute an
offer to sell, or the solicitation of an offer to buy, any security, product, service of Apollo including any Apollo sponsored investment fund,
whether an existing or contemplated fund, for which an offer can be made only by
such fund’s Confidential Private Placement Memorandum and in compliance with applicable law.
Unless otherwise noted, information included herein is presented as of the dates
indicated. The information contained herein may change at any time without notice. Apollo does not have any responsibility to update the
presentation to account for such changes.
Apollo makes no representation or warranty, express or implied, with respect to
the accuracy, reasonableness or completeness of any of the information contained herein, including, but not limited to, information obtained
from third parties.
The information contained herein is not intended to provide, and should not be
relied upon for, accounting, legal or tax advice or investment recommendations.
Forward Looking Statements and Other Important Disclosures
2 |
 Agenda
Topic
1)
Apollo Overview
2)
Segment update
3)
Financial Overview
4) Appendix
3 |
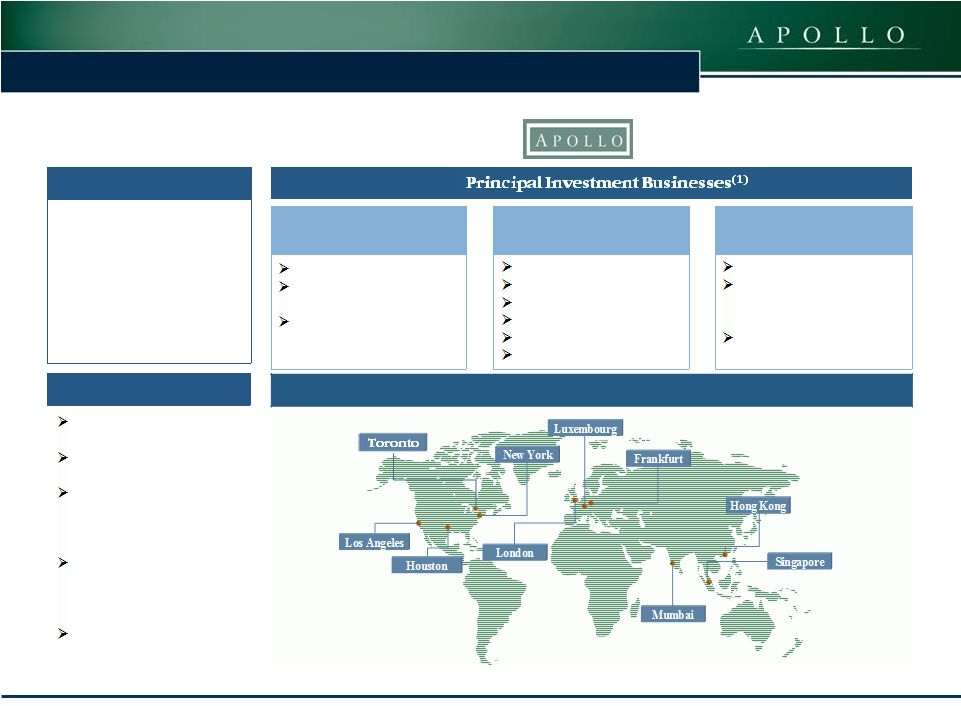 Firm Profile
Founded:
1990
AUM:
$159bn
Employees:
761
Invs. Prof.:
Global offices:
Key Attributes
Value-oriented
Contrarian
Opportunistic across
market cycles and capital
structures
Integrated platform across
asset classes and
geographies
Deep industry knowledge
Private Equity
$48bn AUM
Opportunistic buyouts
Distressed buyouts and
debt investments
Corporate carve-outs
1.
As of March 31, 2014.
Real Estate
$9bn AUM
Residential & Commercial
Global private equity and
distressed debt
investments
Performing fixed income
(CMBS, CRE loans)
Apollo Global Management Overview
Credit
$101bn AUM
U.S. Performing Credit
Opportunistic Credit
European Credit
Non-performing Loans
Structured Credit
Athene
302
Global Footprint
10
4 |
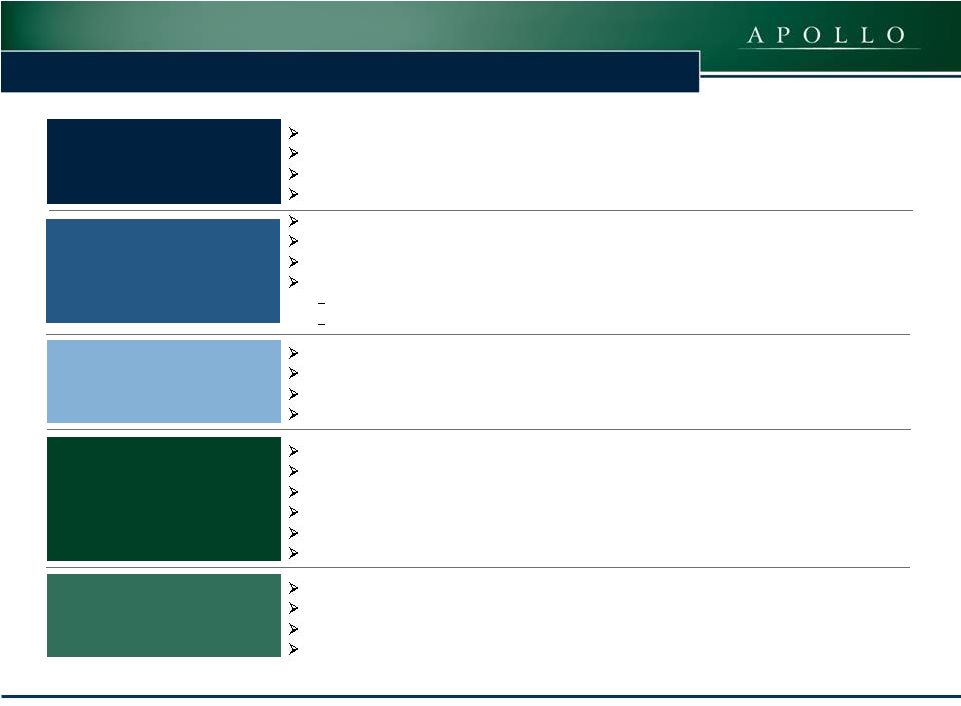 Apollo’s Key Strengths
Diverse and integrated
platform
Strong management
talent
Global fundraising and
originating capability
Strong, consistent
returns through cycles
Attractive financial
profile
Large, diversified, and scalable integrated platform spanning several asset
classes and geographies $159bn of AUM across private equity, credit, real
estate, and permanent capital vehicles 125+
funds
and
managed
accounts
across
multiple
asset
classes
(1)
Deep industry knowledge
5
Multi-disciplined
and
dedicated
fundraising
team
–
PE
Fund
VIII
closed
with
$18.4bn
in
commitments
Diverse global investor base, including marquee LPs
Ability to fundraise and launch funds through the various economic cycles
Long-term
and
diversified
capital
base
(Athene,
PE,
managed
accounts,
etc)
Steady underlying level of fee income
Significant backlog of PE realizations
Variable compensation structure
Significant free cash flow generation
Ample liquidity
Debt / Fee-related EBITDA + 100% net realized carry ratio ~0.4x
Value-oriented, contrarian investor with superior returns
Successful
investment
track
record
across
economic
cycles
–
Firm
for
all
seasons
Apollo PE gross IRR of 39% and net IRR of 26%
Strong credit performance across asset classes
Managing partners worked together for more than 24 years
Collectively own >50% of the Company
Deep bench of investment professionals with strong alignment of interests with
investors Robust governance structure
Note: As of March 31, 2014.
1.
Fund
count
includes
only
those
greater
than
$100mm.
96% of total AUM in funds with contractual life of 7 years or more at
inception 7% of total AUM in permanent capital vehicles with unlimited
duration |
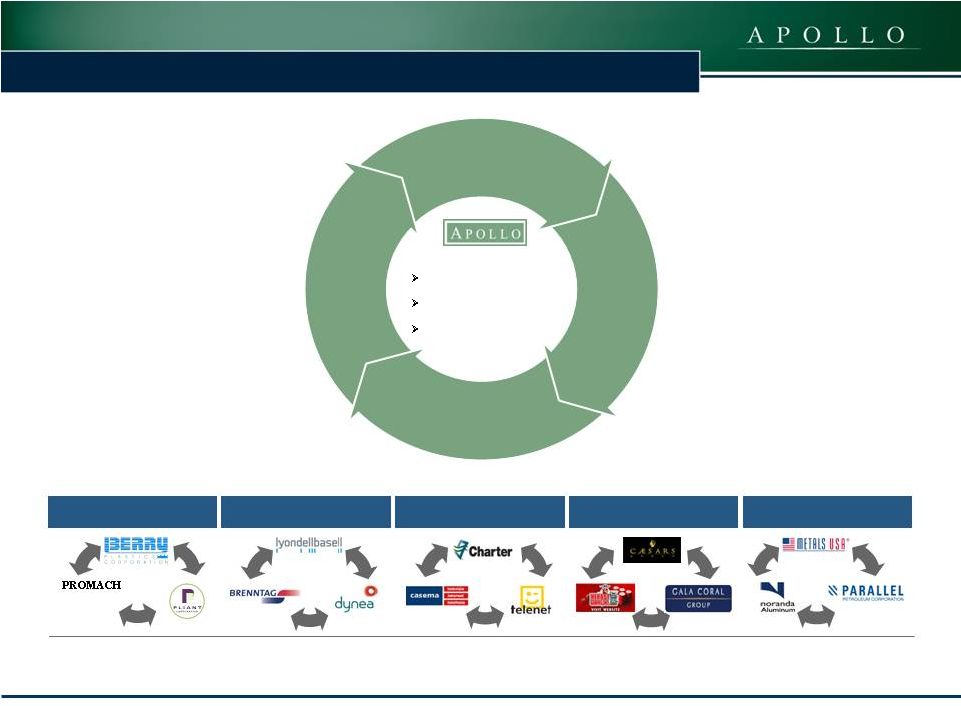 Apollo’s Integrated Business Model
6
Packaging
Chemicals
Cable
Leisure
Natural Resources
Development of industry insight
through:
Industry Insights
Management Relationships
Investment Opportunities
Credit
Investment Opportunities
Market Insights
Market Relationships
Private
Equity
Real
Estate
Over 300 current and former
portfolio companies
Strategic relationships with
industry executives
Significant relationships at
CEO, CFO and board level
Note: The listed companies are a sample of Apollo private equity and
credit investments. The list was compiled based on non-performance criteria and is not representative of all transactions of a given type or investment of any Apollo fund
generally, and are solely intended to be illustrative of the type of investments
across certain core industries that may be made by the Apollo funds. There can be no guarantees that any similar investment opportunities will be available or pursued by
Apollo in the future. The list contains companies which are not currently held
in any Apollo portfolio. Natural Resources is included in Private Equity segment for reporting purposes.
|
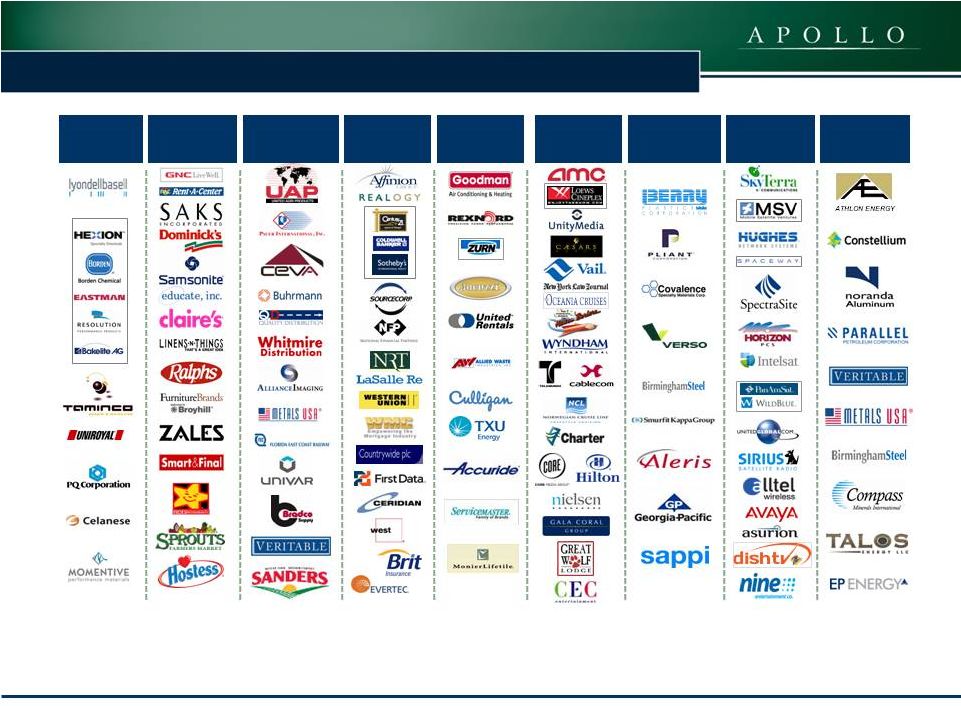 7
Chemicals
Consumer
& Retail
Distribution
&
Transportation
Financial &
Business
Services
Manufacturing
& Industrial
Media, Cable
& Leisure
Packaging &
Materials
Satellite &
Wireless
Commodities
Note: The listed companies are a sample of Apollo private equity and credit
investments. The list was compiled based on non-performance criteria and is not representative of all transactions of a given type or investment of any Apollo fund generally, and are solely intended to be
illustrative of the type of investments across certain core industries that may
be made by the Apollo funds. There can be no guarantees that any similar investment opportunities will be available or pursued by Apollo in the future. The list contains companies which are not currently
held in any Apollo portfolio.
Apollo’s Expertise – Nine Core Industries
|
|
|
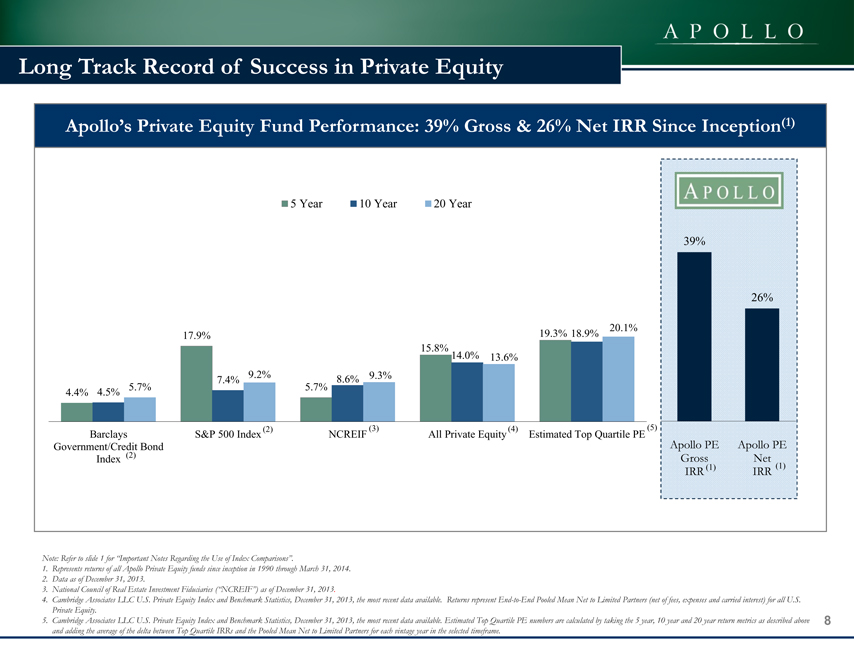
Long Track Record of Success in Private Equity
Apollo’s Private Equity Fund Performance: 39% Gross & 26% Net IRR Since Inception(1)
5 Year 10 Year 20 Year
39%
26%
17.9% 19.3% 18.9% 20.1%
15.8% 14.0% 13.6%
7.4% 9.2% 8.6% 9.3%
4.4% 4.5% 5.7% 5.7%
Barclays S&P 500 Index (2) NCREIF (3) All Private Equity (4) Estimated Top Quartile PE (5)
Government/Credit Bond Apollo PE Apollo PE
Index (2) Gross Net
IRR (1) IRR (1)
Note: Refer to slide 1 for “Important Notes Regarding the Use of Index Comparisons”.
1. Represents returns of all Apollo Private Equity funds since inception in 1990 through March 31, 2014.
2. Data as of December 31, 2013.
3. National Council of Real Estate Investment Fiduciaries (“NCREIF”) as of December 31, 2013.
4. Cambridge Associates LLC U.S. Private Equity Index and Benchmark Statistics, December 31, 2013, the most recent data available. Returns represent End-to-End Pooled Mean Net to Limited Partners (net of fees, expenses and carried interest) for all U.S. Private Equity.
5. Cambridge Associates LLC U.S. Private Equity Index and Benchmark Statistics, December 31, 2013, the most recent data available. Estimated Top Quartile PE numbers are calculated by taking the 5 year, 10 year and 20 year return metrics as described above and adding the average of the delta between Top Quartile IRRs and the Pooled Mean Net to Limited Partners for each vintage year in the selected timeframe.
| 8 |
|
|
|
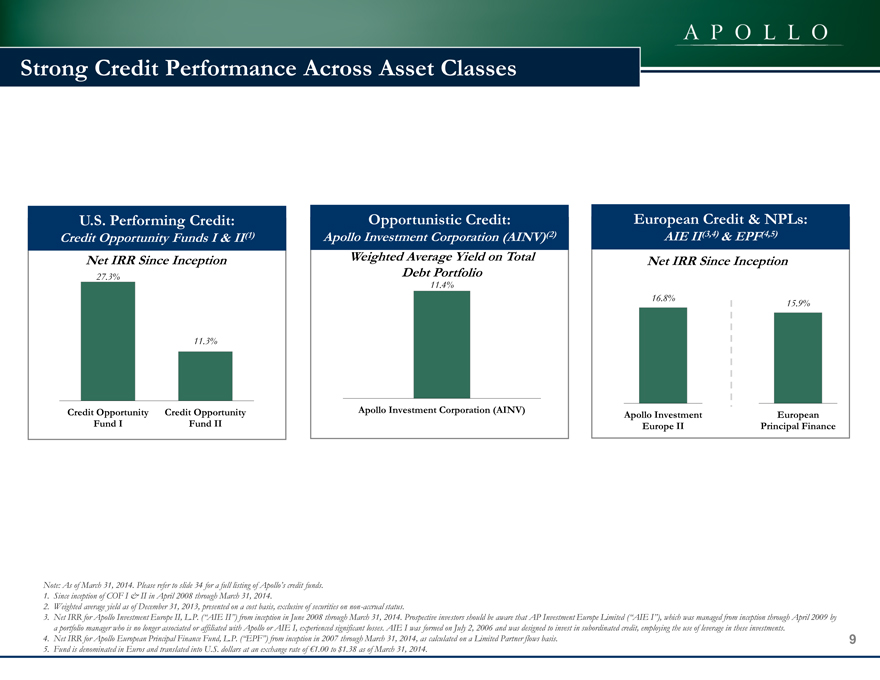
Strong Credit Performance Across Asset Classes
U.S. Performing Credit:
Credit Opportunity Funds I & II(1)
Net IRR Since Inception
27.3%
11.3%
Credit Opportunity Credit Opportunity
Fund I Fund II
Opportunistic Credit:
Apollo Investment Corporation (AINV)(2)
Weighted Average Yield on Total
Debt Portfolio
11.4%
Apollo Investment Corporation (AINV)
European Credit & NPLs:
AIE II(3,4) & EPF(4,5)
Net IRR Since Inception
16.8% 15.9%
Apollo Investment European
Europe II Principal Finance
Note: As of March 31, 2014. Please refer to slide 34 for a full listing of Apollo’s credit funds.
1. Since inception of COF I & II in April 2008 through March 31, 2014.
2. Weighted average yield as of December 31, 2013, presented on a cost basis, exclusive of securities on non-accrual status.
3. Net IRR for Apollo Investment Europe II, L.P. (“AIE II”) from inception in June 2008 through March 31, 2014. Prospective investors should be aware that AP Investment Europe Limited (“AIE I”), which was managed from inception through April 2009 by a portfolio manager who is no longer associated or affiliated with Apollo or AIE I, experienced significant losses. AIE I was formed on July 2, 2006 and was designed to invest in subordinated credit, employing the use of leverage in these investments.
4. Net IRR for Apollo European Principal Finance Fund, L.P. (“EPF”) from inception in 2007 through March 31, 2014, as calculated on a Limited Partner flows basis.
5. Fund is denominated in Euros and translated into U.S. dollars at an exchange rate of €1.00 to $1.38 as of March 31, 2014.
9
|
|
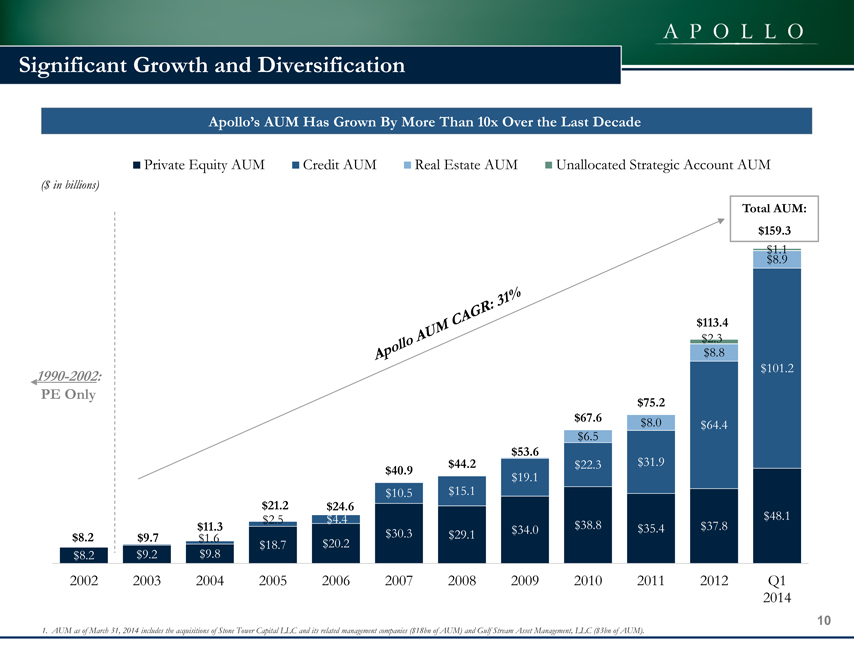
Significant Growth and Diversification
Apollo’s AUM Has Grown By More Than 10x Over the Last Decade
Private Equity AUM Credit AUM Real Estate AUM Unallocated Strategic Account AUM
($ in billions)
Total AUM:
$159.3
$1.1
$8.9
$113.4
$2.3
$8.8
1990-2002: $101.2
PE Only $75.2
$67.6 $8.0 $64.4
$6.5
$53.6
$40.9 $44.2 $22.3 $31.9
$19.1
$10.5 $15.1
$21.2 $24.6
$2.5 $4.4 $48.1
$ 11.3 $30.3 $29.1 $34.0 $38.8 $35.4 $37.8
$8.2 $9.7 $1.6 $18.7 $20.2
$8.2 $9.2 $9.8
2002 2003 2004 2005 2006 2007 2008 2009 2010 2011 2012 Q1
2014
1. AUM as of March 31, 2014 includes the acquisitions of Stone Tower Capital LLC and its related management companies ($18bn of AUM) and Gulf Stream Asset Management, LLC ($3bn of AUM).
10
|
|
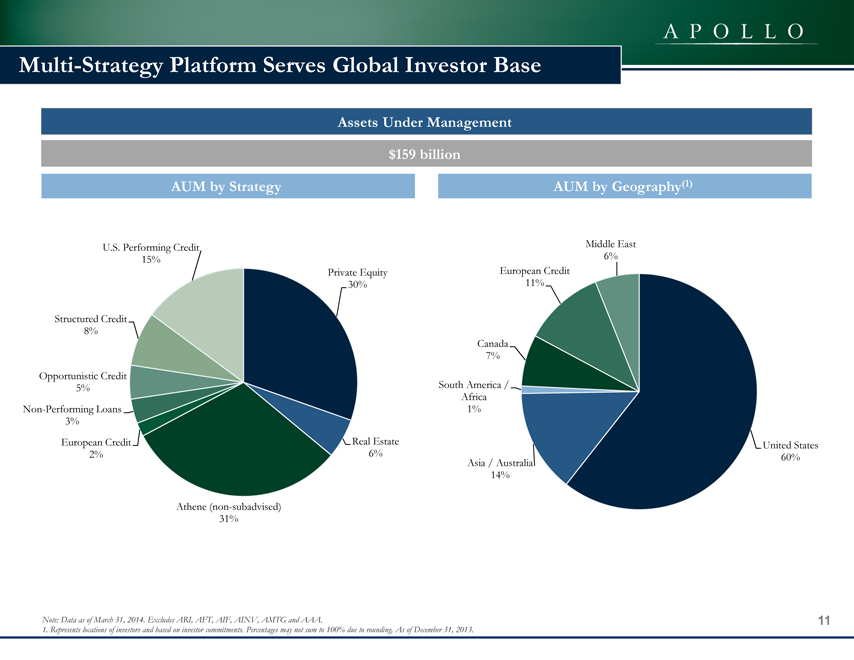
Multi-Strategy Platform Serves Global Investor Base
Assets Under Management
$159 billion
AUM by Strategy AUM by Geography(1)
U.S. Performing Credit
15%
Private Equity
30%
Structured Credit
8%
Opportunistic Credit
5%
Non-Performing Loans
3%
European Credit Real Estate
2% 6%
Athene (non-subadvised)
31%
Middle East
6%
European Credit
11%
Canada
7%
South America /
Africa
1%
United States
Asia / Australia 60%
14%
Note: Data as of March 31, 2014. Excludes ARI, AFT, AIF, AINV, AMTG and AAA.
1. Represents locations of investors and based on investor commitments. Percentages may not sum to 100% due to rounding. As of December 31, 2013.
11
 12
Apollo Has a Clear Path for Continued Growth
Scaling Existing
Businesses
Strategic
Acquisitions and
Alliances
New Product
Development
Geographic
Expansion
Expand Distribution
Channels
Growth Strategies
Apollo will continue to identify opportunities to leverage its existing platform
and diversify into areas with meaningful synergies with its core
business Selected Examples
India PE and credit build-out
Asia build-out and joint ventures
London expansion
Retail closed end funds
Permanent capital vehicles (e.g., REITs)
High net worth raises for credit vehicles
Stone Tower
Gulf Stream
“Flagship”
credit funds
Emerging markets corporate credit
Managed accounts
Real estate mezzanine
Athene
Insurance-linked investment strategies
CLO platform
Energy credit
Favorable Secular Trends
Investors continue to increase
allocations to alternatives
Consolidation of relationships
with branded, scale investment
managers
Increasing constraints on the
global financial system
Emergence of unconstrained
credit as an asset class |
 Agenda
Topic
1)
Apollo Overview
2)
Segment update
3)
Financial Overview
4) Appendix
13 |
|
|
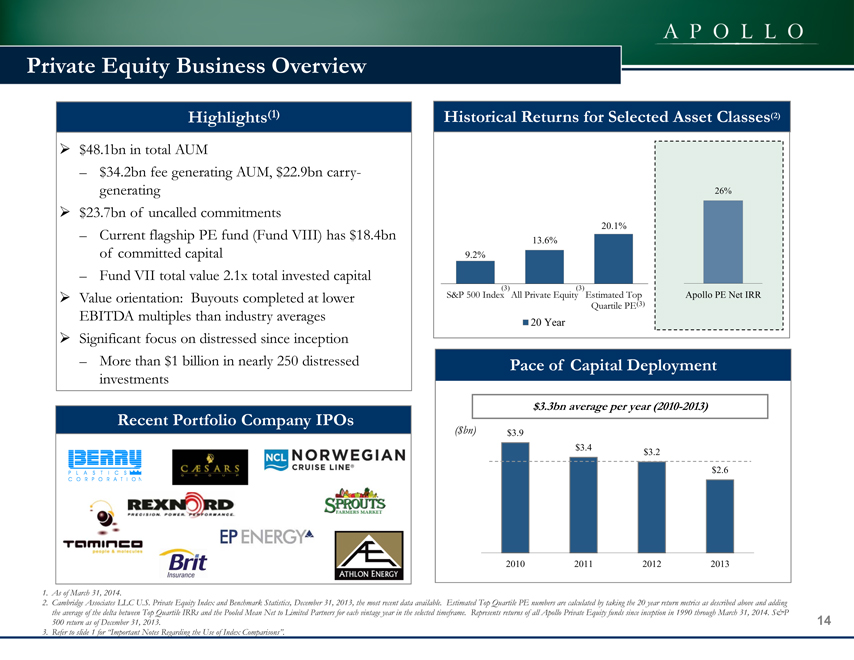
Private Equity Business Overview
Highlights(1)
$48.1bn in total AUM
– $34.2bn fee generating AUM, $22.9bn carry-generating $23.7bn of uncalled commitments
– Current flagship PE fund (Fund VIII) has $18.4bn of committed capital
– Fund VII total value 2.1x total invested capital Value orientation: Buyouts completed at lower EBITDA multiples than industry averages Significant focus on distressed since inception
– More than $1 billion in nearly 250 distressed investments
Historical Returns for Selected Asset Classes(2)
26%
20.1%
13.6%
9.2%
S&P 500 Index(3) All Private Equity(3) Estimated Top Apollo PE Net IRR
Quartile PE(3)
20 Year
Recent Portfolio Company IPOs
Pace of Capital Deployment
$3.3bn average per year (2010-2013)
($bn) $3.9
$3.4 $3.2
$2.6
2010 2011 2012 2013
1. As of March 31, 2014.
2. Cambridge Associates LLC U.S. Private Equity Index and Benchmark Statistics, December 31, 2013, the most recent data available. Estimated Top Quartile PE numbers are calculated by taking the 20 year return metrics as described above and adding the average of the delta between Top Quartile IRRs and the Pooled Mean Net to Limited Partners for each vintage year in the selected timeframe. Represents returns of all Apollo Private Equity funds since inception in 1990 through March 31, 2014. S&P 500 return as of December 31, 2013.
3. Refer to slide 1 for “Important Notes Regarding the Use of Index Comparisons”.
14
 15
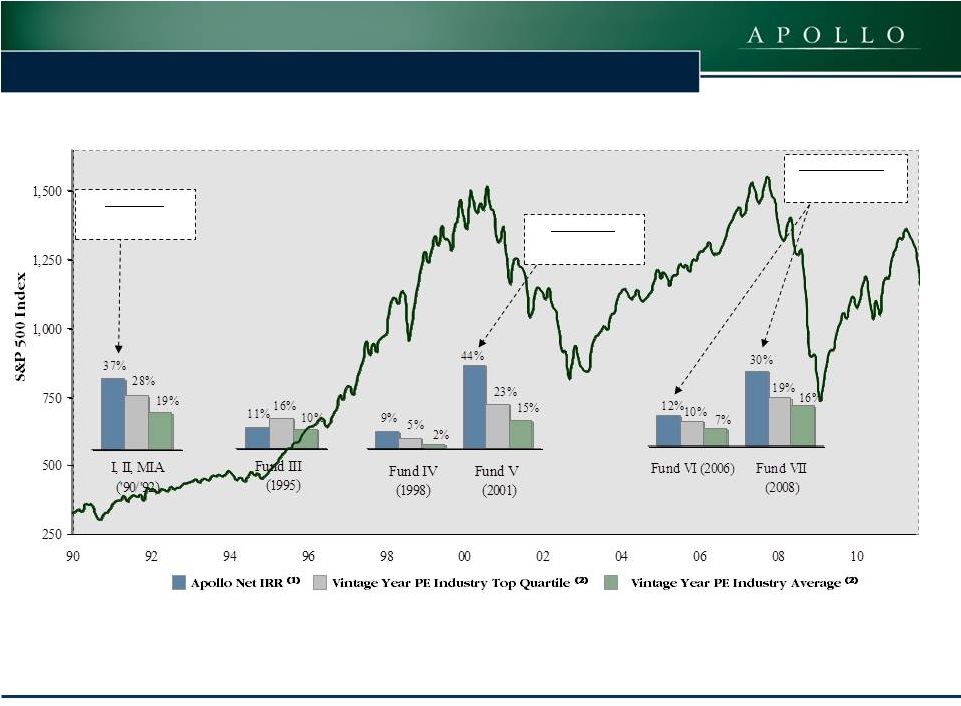
1990 -
1993
$3.4bn invested
2001 -
3Q03
$1.6bn invested
3Q07 –
2Q 2011
$15.5bn invested
Significant Outperformance During Downturns
1.
Represents net IRR for respective Apollo private equity fund as of March 31,
2014. Past performance not indicative of future results; please refer to slide 2 for the definition of net IRR.
2.
Thomson Reuters. Data as of September 30, 3013, the latest data currently
available. Top Quartile benchmarks represent the Upper Quartile Net IRRs for U.S. Buyout Funds of greater than $500 million by vintage year, unless otherwise noted. Vintage Year
Average represents the average net IRR for the same categories as with the Top
Quartile figures. See slide 1 for “Important Notes Regarding the Use of Index Comparisons in this Presentation”. |
|
|
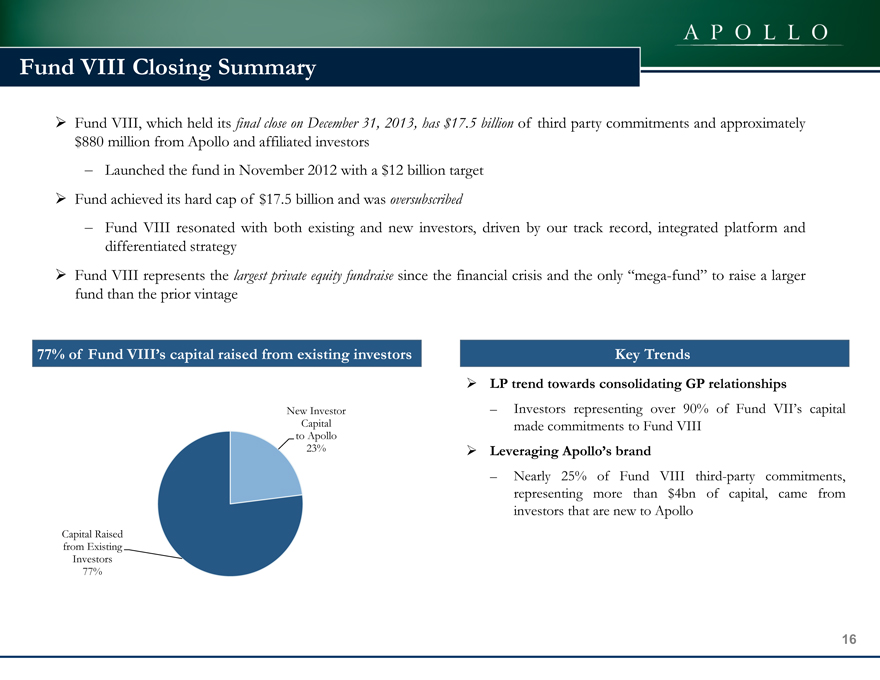
Fund VIII Closing Summary
Fund VIII, which held its final close on December 31, 2013, has $17.5 billion of third party commitments and approximately $880 million from Apollo and affiliated investors
– Launched the fund in November 2012 with a $12 billion target Fund achieved its hard cap of $17.5 billion and was oversubscribed
– Fund VIII resonated with both existing and new investors, driven by our track record, integrated platform and differentiated strategy Fund VIII represents the largest private equity fundraise since the financial crisis and the only “mega-fund” to raise a larger fund than the prior vintage
77% of Fund VIII’s capital raised from existing investors
New Investor Capital to Apollo 23%
Capital Raised from Existing 77% Investors
Key Trends
LP trend towards consolidating GP relationships
– Investors representing over 90% of Fund VII’s capital made commitments to Fund VIII
Cross-selling the Apollo platform
– Approximately 7% of Fund VIII third-party commitments, representing more than $1bn of capital, came from Apollo investors that had not previously invested in Apollo private equity funds
Leveraging Apollo’s brand
– Nearly 25% of Fund VIII third-party commitments, representing more than $4bn of capital, came from investors that are new to Apollo
16
|
|
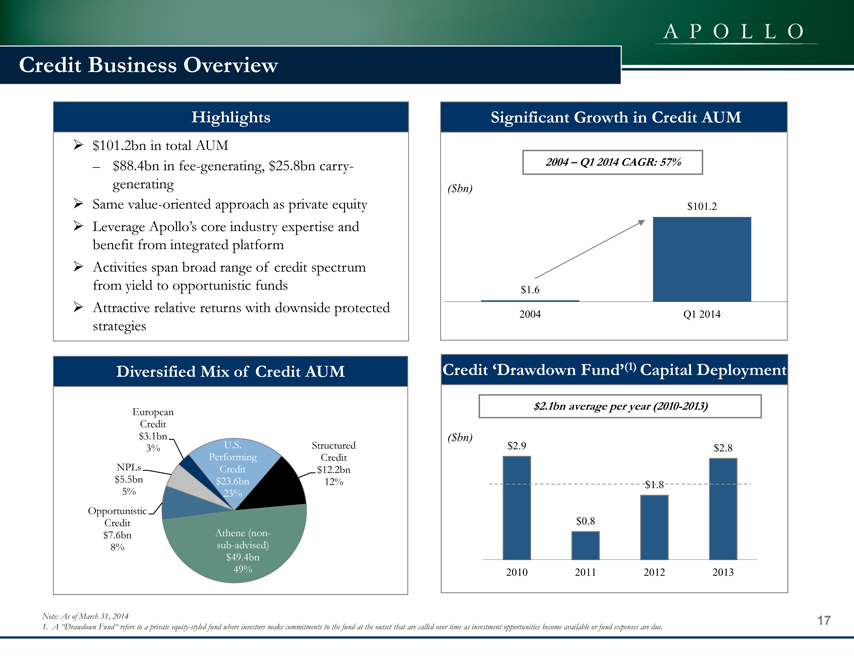
Credit Business Overview
Highlights
$101.2bn in total AUM
– $88.4bn in fee-generating, $25.8bn carry-generating Same value-oriented approach as private equity
Leverage Apollo’s core industry expertise and benefit from integrated platform Activities span broad range of credit spectrum from yield to opportunistic funds Attractive relative returns with downside protected strategies
Significant Growth in Credit AUM
2004 – Q1 2014 CAGR: 57%
($bn)
$101.2
$1.6
2004 Q1 2014
Diversified Mix of Credit AUM
European
Credit
$3.1bn
3% U.S. Structured
Performing Credit
NPLs Credit $12.2bn
$5.5bn $23.6bn 12%
5% 23%
Opportunistic
Credit
$7.6bn Athene (non-
8% sub-advised)
$49.4bn
49%
Credit ‘Drawdown Fund’(1) Capital Deployment
$2.1bn average per year (2010-2013)
($bn)
$2.9 $2.8
$1.8
$0.8
2010 2011 2012 2013
Note: As of March 31, 2014
1. A “Drawdown Fund” refers to a private equity-styled fund where investors make commitments to the fund at the outset that are called over time as investment opportunities become available or fund expenses are due.
17
 Athene Holding Ltd. (“Athene”) is an insurance holding company
focused
on
fixed
annuities
with
approximately
$59bn
in
assets
and
was founded in 2009
Earns the spread between its investment return on assets and
the rate on its liabilities
Originally funded through an Apollo-sponsored permanent
capital vehicle (AP Alternative Assets, L.P.; NYSE Euronext:
AAA)
Led by seasoned management team with significant insurance
experience
Completed transformative Aviva USA acquisition in October
2013, adding approximately $44bn of AUM
Seeks to grow annuity liabilities through three primary
channels; retail issuance, institutional issuance, and acquisition
Athene Asset Management, L.P. (AAM) is a subsidiary of
Apollo and is included within the Credit segment
Provides asset allocation services, direct asset management
services, and a suite of other services to Athene
Team of full-time dedicated investment professionals with
deep experience in asset allocation
100% of Athene’s portfolio is allocated by AAM
Approximately 17% of Athene’s portfolio directly managed
by Apollo through sub-advisory agreements
Apollo business model designed to scale in-line with
Athene’s assets
Assets
Services
Liabilities
Assets
Athene: Differentiated & Strategically Important Growth Driver
18 |
|
|
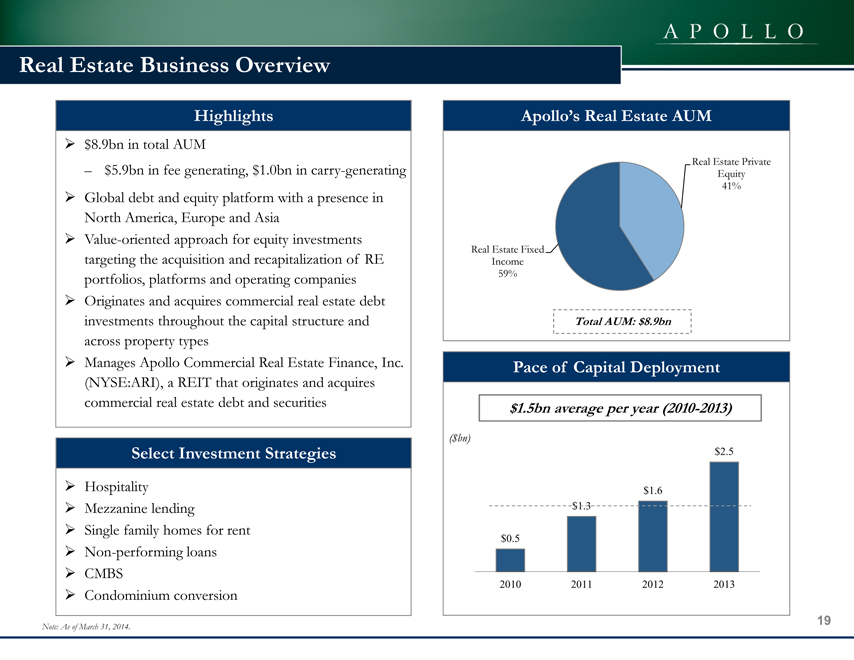
Real Estate Business Overview
Highlights
$8.9bn in total AUM
$5.9bn in fee generating, $1.0bn in carry-generating
Global debt and equity platform with a presence in North America, Europe and Asia
Value-oriented approach for equity investments targeting the acquisition and recapitalization of RE portfolios, platforms and operating companies
Originates and acquires commercial real estate debt investments throughout the capital structure and across property types
Manages Apollo Commercial Real Estate Finance, Inc. (NYSE:ARI), a REIT that originates and acquires commercial real estate debt and securities
Apollo’s Real Estate AUM
Real Estate Private
Equity
41%
Real Estate Fixed
Income
59%
Total AUM: $8.9bn
Select Investment Strategies
Hospitality
Mezzanine lending
Single family homes for rent
Non-performing loans
CMBS
Condominium conversion
Pace of Capital Deployment
$1.5bn average per year (2010-2013)
($bn)
$2.5
$1.6
$1.3
$0.5
2010 2011 2012 2013
Note: As of March 31, 2014.
19
 Agenda
Topic
1)
Apollo Overview
2)
Segment update
3)
Financial Overview
4) Appendix
20 |
 Financial Management Philosophies
Financially conservative
–
Manage leverage and interest coverage ratios prudently
–
Generate significant free cash flow
Focus on Management Business margins and liquidity
–
Stable non-performance based management revenue
–
Disciplined expenditure on compensation and non-compensation
–
Maintain sufficient liquidity in order to service debt obligations and maintain
appropriate cash balances Flexible dividend policy
–
Flexible policy allowing management discretion to retain earnings for
operational or investment needs Committed to maintaining a strong investment
grade rating 21 |
 22
($mm, except per share data)
2011
2012
2013
LTM Q1
2014
Management
business
ENI
–
(pre-tax)
$76
$223
$331
$417
Incentive
business
ENI
(loss)
–
(pre-tax)
(377)
1,411
1,797
1,188
ENI income tax provision
21
159
238
260
Total after-tax ENI (loss)
($322)
$1,476
$1,889
$1,344
Total after-tax ENI (loss) per share
($0.86)
$3.82
$4.80
$3.40
Fee-related EBITDA
197
339
438
560
Fee-related EBITDA + 100% net realized carry
$531
$890
$1,915
$2,103
Distributions
declared
(1)
$314
$539
$1,627
$1,645
Distributions declared per share
$0.83
$1.35
$3.95
$3.43
1.
Amounts include distributions to Class A shareholders, non-controlling
interest in AOG and distribution equivalents on participating securities
Strong Mgt. Business Growth & Significant Free Cash Flow |
 Robust Growth in Fee-Generating AUM
23
($mm)
2011
2012
2013
Q1 2014
Total AUM
$75
$113
$161
$159
39.6%
Fee-generating AUM
$58
$82
$128
$129
42.3%
Fee-generating
AUM
by
Segment:
Private equity
$28
$28
$34
$34
9.2%
Credit
27
50
88
88
70.7%
Real estate
4
4
6
6
25.5%
Total
$58
$82
$128
$129
42.3%
CAGR
(2011-Q1
2014) |
|
|
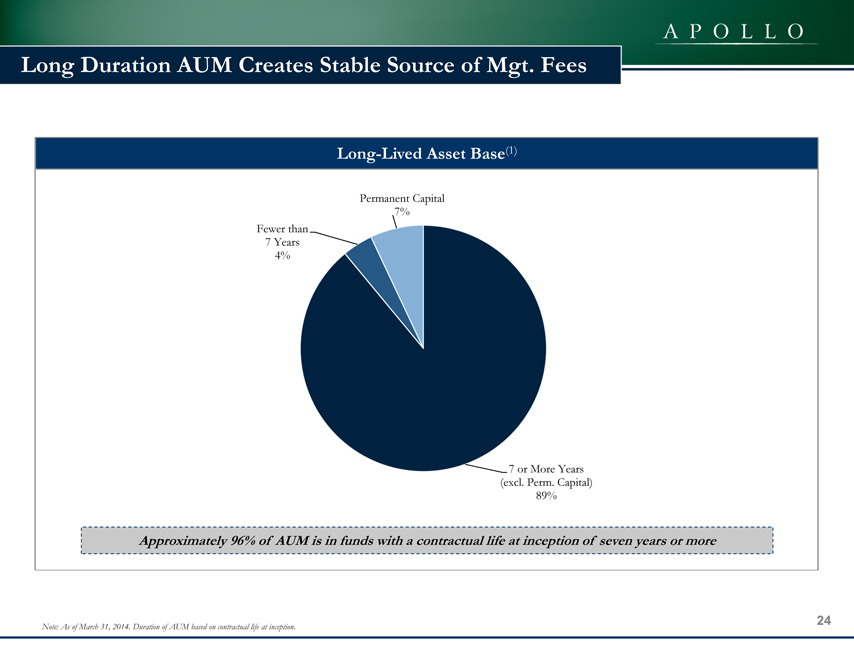
Long Duration AUM Creates Stable Source of Mgt. Fees
Long-Lived Asset Base(1)
Permanent Capital
7%
Fewer than
7 Years
4%
7 or More Years
(excl. Perm. Capital)
89%
Approximately 96% of AUM is in funds with a contractual life at inception of seven years or more
Note: As of March 31, 2014. Duration of AUM based on contractual life at inception.
24
 Management Business Performance
25
($mm, except per share data)
2011
2012
2013
LTM Q1
2014
Management fees
$490
$623
$731
$791
Advisory & transaction fees
82
150
197
265
NII incentive fees -
AINV
45
38
37
36
Total management business revenues
617
811
964
1,092
Compensation expenses
319
344
361
409
Non-compensation expenses
224
257
302
295
Other income (loss) & minority interest
3
12
30
29
76
223
331
417
Mgt. business ENI per share (pre-tax)
$0.21
$0.58
$0.84
$1.05
Non-cash comp
68
69
66
107
Interest expense
41
37
29
25
Depreciation and amortization
11
10
11
11
Fee-related EBITDA
197
339
438
560
Operating
metrics
Mgt. business margin (%)
12%
27%
34%
38%
Mgt. comp % of mgt. revenues
52%
42%
37%
37%
Mgt. non-comp % mgt. revenues
36%
32%
31%
27%
Management business ENI – (pre-tax) |
 Incentive Business Performance
26
1.
Using March 31, 2014, non-GAAP weighted average diluted shares
outstanding. 2.
Carried interest receivable less profit sharing payable on an unconsolidated
basis. ($mm, except per share data)
2011
2012
2013
LTM
Q1 2014
Economic ENI
ENI –
total carry:
Private equity
($449)
$1,668
$2,517
$1,630
Credit
7
481
337
270
Real estate
0
15
5
4
Total carry
($442)
$2,164
$2,859
$1,903
ENI –
total profit sharing expense:
Private equity
$727
$1,030
$709
Credit
36
138
143
146
Real estate
0
7
0
(1)
Total profit sharing expense
$872
$854
Equity method
investment gain / (loss)
5
120
111
138
$1,188
Incentive
business
ENI
(loss)
per
share
(pre-tax)
(1)
($1.01)
$3.65
$4.56
$3.01
Net realized
carry
Realized carry:
Private equity
$571
$813
$2,063
$2,166
Credit
74
180
393
408
Real estate
0
5
1
0
Total realized carry
$997
$2,456
$2,574
Realized profit sharing expense:
Private equity
$273
$383
$883
$933
Credit
37
63
95
97
Real estate
0
0
0
0
Total realized profit sharing expense
$978
$1,030
Net realized carry
$1,478
$1,544
$1,105
$1,173
$1,797
$1,295
$446
$551
$1,021
$516
$335
$645
($377)
($60)
($97)
Incentive business ENI (loss) (pre-tax)
$1,411
$310 |
|
|
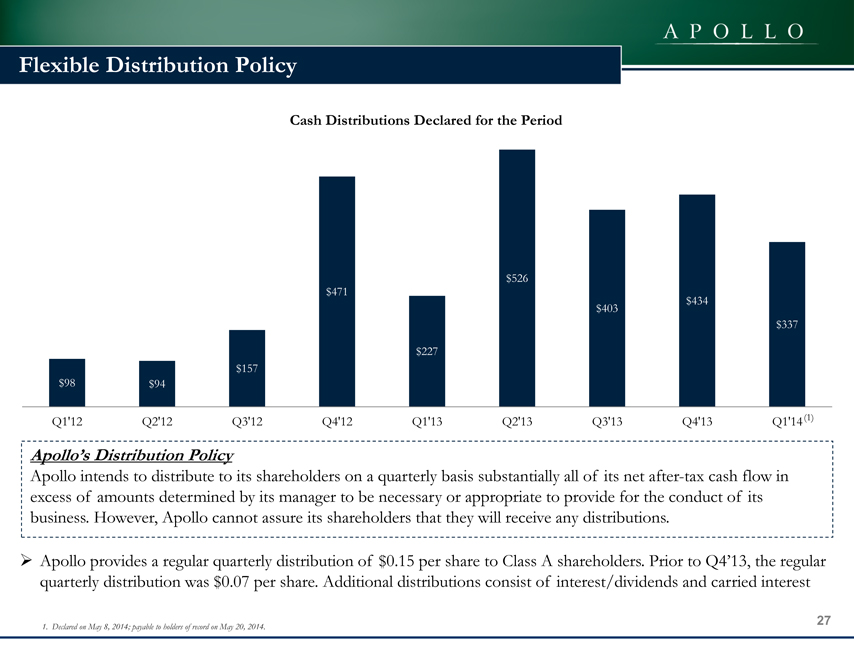
Flexible Distribution Policy
Cash Distributions Declared for the Period
$5
26
$471
$403 $434
$337
$227
$157
$98 $94
Q1’12 Q2’12 Q3’12 Q4’12 Q1’13 Q2’13 Q3’13 Q4’13 Q1’14 (1)
Apollo’s Distribution Policy
Apollo intends to distribute to its shareholders on a quarterly basis substantially all of its net after-tax cash flow in excess of amounts determined by its manager to be necessary or appropriate to provide for the conduct of its business. However, Apollo cannot assure its shareholders that they will receive any distributions.
Apollo provides a regular quarterly distribution of $0.15 per share to Class A shareholders. Prior to Q4’13, the regular quarterly distribution was $0.07 per share. Additional distributions consist of interest/dividends and carried interest
1. Declared on May 8, 2014; payable to holders of record on May 20, 2014.
27
 Strong Financial Condition With Low Levels of Debt
28
1.
Financial condition amounts are shown without the impact of certain Apollo funds
that are required to be consolidated on its financial statements under U.S. GAAP.
2.
Net of profit sharing expense.
3.
Includes total General Partner investments using equity method, fair value
measurements of Apollo Senior Loan Fund, HFA and AAA (of which Apollo has a 2.6% ownership interest), and fair value measurement of Athene and AAA Services Derivatives.
4.
As of May 15, 2014. Based on a share price of $25.28 and 377.9mm shares
outstanding as of March 31, 2014, assuming full exchange of all outstanding Apollo Operating Group units as of such date into Class A shares.
|
 Selected Financial Metrics and Leverage Analysis
29
($mm)
2011
2012
2013
LTM Q1
2014
Fee-related EBITDA
$197
$339
$438
$560
Fee-related EBITDA + 100% of net realized carry
531
890
1,915
2,103
Interest expense
41
37
29
25
Debt
738
738
750
750
Leverage ratios:
Fee-related EBITDA / interest expense
4.8x
9.1x
15.1x
22.5x
Fee-related EBITDA + 100% of net realized carry / interest expense
13.0x
24.0x
66.0x
84.1x
Debt / fee-related EBITDA
3.8x
2.2x
1.7x
1.3x
Debt / fee-related EBITDA + 100% of net realized carry
1.4x
0.8x
0.4x
0.4x |
 Agenda
Topic
1)
Apollo Overview
2)
Segment update
3)
Financial Overview
4) Appendix
30 |
 Bridge to GAAP Financials
31
($mm)
2011
2012
2013
LTM
Q1 2014
Fee-Related EBITDA + 100% net realized carry
$531
$890
$1,915
$2,103
Net unrealized carry
(716)
740
208
(493)
Net unrealized investment income
5
120
111
138
Net interest expense
(41)
(37)
(29)
(25)
Depreciation and amortization
(11)
(10)
(11)
(11)
Non-cash comp
(68)
(69)
(66)
(107)
ENI tax provision
(21)
(159)
(238)
(238)
Economic Net (Loss) Income (post-tax)
($322)
$1,476
$1,890
$1,368
ENI tax provision
21
159
238
238
Income tax provision
(12)
(65)
(108)
(122)
Net (loss) income attributable to non-controlling interests
in Apollo Operating Group
940
(685)
(1,258)
(928)
Non-cash charges related to equity-based compensation
(1,082)
(530)
(60)
(32)
Amortization of intangible assets
(15)
(43)
(43)
(41)
GAAP Net (Loss) Income
($469)
$311
$659
$483 |
 Carried Interest Income Receivable
Note:
Figures
may
not
sum
due
to
rounding.
Amounts
presented
are
on
an
unconsolidated
basis.
32
($mm)
2012
2013
Q1 2014
Private equity funds:
Fund VII
$904
$891
$774
Fund VI
270
698
522
Fund V
134
43
54
Fund IV
11
8
5
Other (AAA, Stanhope)
94
229
219
Total private equity funds
$1,413
$1,868
$1,574
Credit funds:
U.S. performing credit
$402
$180
$163
Opportunistic credit
37
60
49
Structured credit
21
54
61
European credit
18
36
18
Non-performing loans
102
154
120
Total credit funds
$580
$484
$410
Real estate funds
CPI other
$11
$5
$4
AGRE US real estate
-
6
7
Other
-
4
4
Total real estate funds
$11
$15
$15
Total
$2,004
$2,367
$1,999 |
 Structure Chart as of May 9, 2014
33
100%
39.44% of the LP units of certain
Apollo Operating Group Entities
11.82% of
LP
units
31.26% of total voting power
Managing Partners
APO (FC), LLC
Apollo Asset Co., LLC
APO Corp.
Apollo Operating Group
39.44% of the LP units of certain
Apollo Operating Group Entities
39.44% of the LP units of certain
Apollo Operating Group Entities
100%
100%
Intermediate Holding
Companies
Class A Shareholders
(Class A Shares)
AGM
Management, LLC
(Our Manager)
BRH Holdings
GP, Ltd.
(Class B Shares)
BRH
Holdings, L.P.
AP Professional
Holdings, L.P.
(60.56% of Apollo
Operating
Group Units)
Contributing Partners
60.56% of the LP units of each
Apollo Operating Group Entity
88.18% of
LP units
68.74% of total
voting power
100% of LP
units
GP
GP
Note: The organizational structure chart above depicts a simplified version of
the Apollo structure. It does not include all legal entities in the structure. APOLLO GLOBAL MANAGEMENT, LLC
(39.44% of Apollo Operating Group Units) |
 Appendix: Credit Fund Summary
Apollo Fund
Year of Inception
Apollo Fund
Year of Inception
Apollo / Artus Investors 2007 –
1
2007
ALM VII (R) Ltd.
2013
Apollo Credit Liquidity Fund
2007
ALM VII (R)-2 Ltd.
2013
Apollo Credit Opportunity Fund I
2008
ALM VIII
2013
Apollo Credit Opportunity Fund II
2008
ALM X
2014
Apollo Credit Opportunity Fund III
2013
ALME
2013
Apollo Senior Loan Fund
2010
Compass 2005-II
2006
Apollo European Principal Finance
2007
Compass 2007
2007
Apollo European Principal Finance II
2012
Cornerstone CLO
2007
Apollo Investment Corporation (NASDAQ: AINV)
2004
Rampart CLO 2006-I
2006
AP
Investment
Europe
Limited
(1)
2006
Rampart CLO 2007-I
2007
Apollo Investment Europe II
2008
Rashinban
2006
Apollo European Credit Fund
2011
Sextant 2006
2006
Apollo Senior Floating Rate Fund Inc (NYSE: AFT)
2011
Sextant 2007
2007
Apollo Strategic Value Fund
2006
Stone Tower CLO V
2006
Apollo Value Investment Fund
2003
Stone Tower CLO VI
2007
Apollo
Credit
Fund
(2)
2005
Stone Tower CLO VII
2007
Apollo
Credit
Strategies
Fund
(2)
2011
Apollo Financial Credit Investment I
2011
Apollo Structured Credit Recovery Fund II
2012
Apollo Financial Credit Investment II
2013
ALM IV
2011
Apollo Total Return Fund
2014
ALM V
2012
Apollo Structured Credit Recovery Fund III
2014
ALM VI
2012
Apollo Credit Short Opportunities Fund
2014
ALM VII
2012
34
It should not be assumed that future Credit funds or CLOs will equal the
performance of the funds and CLOs on this list, nor should it be assumed that the past performance of the funds and CLOs on this list are indicative or a guarantee of future performance of such funds and CLOs.
(1) Fund is currently winding down. (2) Track record was accumulated by the
investment committee, of which two members are no longer at the firm as of June 30, 2012. Note: As of April 2014, the following CLOs have been called: ALM I and III, Compass 2002-1, 2003-1,
2004-1 and 2005-I, Neptune, Granite Ventures I, II, and III, Stone Tower
CLOs I, II, III, IV. This list excludes CDOs, SIVs, managed accounts and strategic partnerships. The above list is reflective of funds currently in existence as of April 2014 and excludes funds and
investment vehicles that have since been dissolved but previously managed by
Apollo. Additional information on such funds is available upon request.
|