Attached files
| file | filename |
|---|---|
| 8-K - 8-K - CMS ENERGY CORP | a14-12949_18k.htm |
Exhibit 99.1
|
|
American Gas Association May 19 & 20, 2014 |

|
|
This presentation is made as of the date hereof and contains “forward-looking statements” as defined in Rule 3b-6 of the Securities Exchange Act of 1934, Rule 175 of the Securities Act of 1933, and relevant legal decisions. The forward-looking statements are subject to risks and uncertainties. All forward-looking statements should be considered in the context of the risk and other factors detailed from time to time in CMS Energy’s and Consumers Energy’s Securities and Exchange Commission filings. Forward-looking statements should be read in conjunction with “FORWARD-LOOKING STATEMENTS AND INFORMATION” and “RISK FACTORS” sections of CMS Energy’s and Consumers Energy’s Form 10-K for the year ended December 31, 2013 and as updated in subsequent 10-Qs. CMS Energy’s and Consumers Energy’s “FORWARD-LOOKING STATEMENTS AND INFORMATION” and “RISK FACTORS” sections are incorporated herein by reference and discuss important factors that could cause CMS Energy’s and Consumers Energy’s results to differ materially from those anticipated in such statements. CMS Energy and Consumers Energy undertake no obligation to update any of the information presented herein to reflect facts, events or circumstances after the date hereof. The presentation also includes non-GAAP measures when describing CMS Energy’s results of operations and financial performance. A reconciliation of each of these measures to the most directly comparable GAAP measure is included in the appendix and posted on our website at www.cmsenergy.com. CMS Energy provides historical financial results on both a reported (Generally Accepted Accounting Principles) and adjusted (non-GAAP) basis and provides forward-looking guidance on an adjusted basis. Management views adjusted earnings as a key measure of the company’s present operating financial performance, unaffected by discontinued operations, asset sales, impairments, regulatory items from prior years, or other items. These items have the potential to impact, favorably or unfavorably, the company's reported earnings in future periods. Because the company is not able to estimate the impact of these matters, the company is not providing a reconciliation to the comparable future period reported earnings. 1 |

|
|
Mindset . . . . . . . . drives consistent “real” growth. $0.81 _ _ _ _ _ Adjusted EPS (non-GAAP) excluding MTM in 2004-2006 b $1.25 excluding discontinued Exeter operations and accounting changes related to convertible debt and restricted stock Int’l Sale b 10-Year Actual 7% CAGR $1.78 $1.74 $1.08 Dividend Payout 0% 25% 30% 40% 49% 58% 62% 62% 60%-70% 32% 27% 14% 39% 80% 6% Peers 4% 6% 2 5% - 7% 5% - 7% $1.66 |
|
|
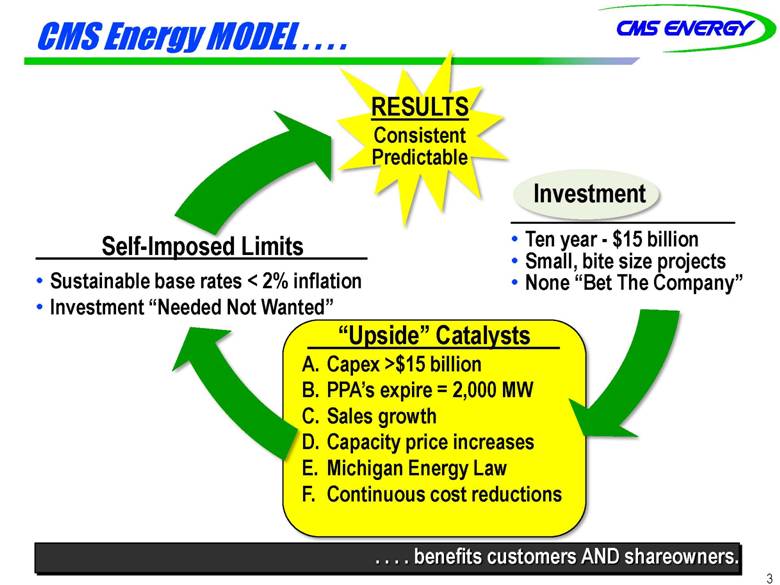
CMS Energy MODEL . . . . 3 Investment Ten year - $15 billion Small, bite size projects None “Bet The Company” “Upside” Catalysts A. Capex >$15 billion B. PPA’s expire = 2,000 MW C. Sales growth D. Capacity price increases E. Michigan Energy Law F. Continuous cost reductions Self-Imposed Limits Sustainable base rates < 2% inflation Investment “Needed Not Wanted” RESULTS Consistent Predictable . . . . benefits customers AND shareowners. |
|
|
A. Visible Investment: Ten-Year Plan . . . . 4 . . . . reflects needed catch-up to further reduce cost and improve reliability. 2013-2022 10-Year Plan Opportunity Level $15 Billion $15 Billion $20+ Billion Opportunity Amount (bils) Generation capacity PPA replacement $1.7 ROA return Higher renewables .3 Gas conversions & expansion 1.0 Electric reliability 2.0 Total Opportunities $5.0 X Rate Base 5%-7% Customer base rates <2 >4 Upside? |

|
|
Visible Investment: Catch-Up . . . . 5 2013 Pct of Market Cap Cap Inv OCF Liquidity CMS 21% 20% 24% Peers 18 16 20 21% 20% 24% . . . . creates unique opportunity; with OCF already stronger than peers. Amount (billions) $1.8 CMS Peers _ _ _ _ _ Source: 10K; actual amounts through 2012 smoothed for illustration $1.5 Restructuring Catch Up |

|
|
Gas Investment Growing. . . . 6 . . . . as a mix of total. Base Rate Increases <2% <2% Capital Investment “Checklist” Add Customer Value Reduce O&M Costs Reduce Fuel Costs Mandated by State or Federal Regulators $8 $11 $13 Upside: Creates headroom for more investments Rate Base 25% 32% |
|
|
Visible Investment: Gas Distribution . . . . 7 . . . . investing $2 billion over the next 5 years. New Customers Inspection Storage Compression Transmission 50,000 New customers $200 Million 1,700 Miles $100 Million 23 Wells $100 Million 800 Miles $450 Million 19,000 + Horsepower $400 Million 32 Miles $200 Million Includes switching Commission approved Main Replacement |
|
|
Propane to Gas Switching . . . . 8 . . . . adds to organic growth. Opportunity Gas Customer Growth 32% 20% 36% 1.7 Million gas customers 250,0000 propane users |
|
|
B. PPA’s Expire . . . . 9 . . . . replacement not yet in plan! Ten-year Capacity Growth ~780 MW 1,240 MW ~Potential for 3,000 MW of owned capacity MW PPA 2,600 capacity ~30% ~8,600 MW 540 MW 410 MW Shortfall Owned (6,000) 780 MW 8,600 MW Owned (8,020) PPA 580 |
|
|
New Capacity Opportunities . . . . Replace PPA With New Build Full Year Impact Customer Bill Investor (EPS) (mils) 1,000 MW of PPA’s expire - $325 0 ¢ Add 1,000 MW owned capacity + 325 + 5 Impact Flat Incremental Step-up Not in Plan 2 points Build - Thetford Expand - Zeeland Buy - ? LT PPA 10 . . . . upside not in plan. + 5¢ Upside: Capacity Options |

|
|
C. Sales Growth . . . . . . . even after Energy Efficiency. Annual Electric Salesa Economic Indicators Annual Industrial Sales Grand Rapids Michigan U.S Building Permits* + 39% +25% +16% GDP (real) 2010 thru 2012 14 11 7 Population 2010 Census thru July 2013 3 0 2 Unemployment February 2014 6.2% 7.7% 6.7% *Annualized numbers March thru February _ _ _ _ _ a Weather normalized vs prior year b Negative with “E1” 11 Growth Upside? Upside? |
|
|
D. Capacity Price Market Increases . . . . 12 . . . . could add value to the 700 MW “DIG” plant. Capacity price < ($ kW per month) Today (mils) Future Scenarios (mils) $5 +$30 $55 $35 +$50 Opportunity Upside: Conditions improving |
|
|
E. Michigan Energy Law Revisit . . . . Historical test year 12-18 months regulatory lag No cap on ROA 13 10% renewables by 2015 Energy efficiency standards File-and-implement 10% ROA cap Adaptability Reliability Affordability Environmental protection Before 2008 TODAY 2015 Improvements . . . . builds on 2008 Law! Upside More renewables Better process |
|
|
Michigan Governor’s Race . . . . 14 . . . . focus on non-energy issues. Mark Schauer Democrat, Challenger Rick Snyder Republican, Incumbent Campaign Issues Education Jobs Roads Detroit On Energy On ROA 37% 48% As Senate Democratic Leader, Mark played a key role in the successful passage of the 2008 Energy Law. “Choice creates a lot of challenges and problems, essentially trying to arbitrage markets.” -Governor Rick Snyder *Polling data from most recent poll, CEA/Hickman Analytics, 4/24-4/30 |
|
|
F. Continuous O&M Cost Reductions . . . . 15 . . . . holds down rates and allows better system reliability. _ _ _ _ _ a O&M Change excluding major storms Amount (mils) $ |
|
|
Self-Initiated Cost Control . . . . 16 . . . . creates more headroom for capital investment. Average Annual O&M Change +6% Peers -2% CMS Flat -2% Average -3% Plan Conservatively Upside? _ _ _ _ _ a -8% Before reinvestment |
|
|
$? $49M Gas Customer Bills . . . . . . . . down 10% over the last three years! 17 Settled $16M 2012 2013 2014 2015 $0 Investment $0 Stay-out O&M bills down 10%! -- |
|
|
Electric Residential Bills Competitive . . . . 18 O&M Tax Cross Winds Self-initiated Rate design, regulatory ROA Policy, Legislator Consumers higher than Midwest peer avg Below Midwest peers . . . . industrial rates improving through cooperative steps. Electric Rate Case Avoided Industrial Electric Rate (vs Midwest Average) |
|
|
Key Takeaways . . . . 19 . . . . distinguish CMS favorably with customers and owners. _ _ _ _ _ a Adjusted EPS (non-GAAP) excluding MTM in 2004-2006 EPS a “Real” Growth (No “Resets”) $2.00 Core Fundamentals 10-Year Visible Investment Among Best In Cost Control Conservative Planning Supportive Regulatory Catalysts Upside Target 5% - 7% Actual = 7% +11% Target 6% - 8% Actual EPS = 8% +7% +12% +12% +4% +7% +7% +7% +8% 7% 5% 7% 5% |
|
|
Appendix |
|
|
Continuous Cost Reduction . . . . 21 . . . . a way of life at CMS. Past Progress $100k Each $60k Each Future Examples Fuel Mix Benefits MW Employees 2016 Retire Coal - 900 - 300 2016 Add GCC + 540 + 20 Total -360 - 280 Future Savings (mils) $25 Future Annual Savings (mils) 2002-2012 Actions completed $25 2013 EGWP, OPEB & other 50 Future savings $75 People Productivity = $64 million Headcount |
|
|
Capacity Diversity . . . . 22 . . . . evolving to cleaner generation while becoming more cost competitive. 2006 Sold Palisades -800 -650 2009 Purchased Zeeland GCC +930 +22 2013-2014 Build Wind Farms +205 +4 2016 Suspend Operation of Coal Units -900 -300 2016 Add Gas Combined Cycle +542 +23 Total -23 -901 |
|
|
Liquidity (as of 3/31/14) . . . . . . . . strong and conservative. Availability CMS Energy 5-year revolver - 2018 Consumers Energy Cash AR Facility – Nov 2015 5-year revolver - 2018 $548 mils 650 250 758 $2.2 Billion Financing Timing Parent Debt February Continuous Equity March 2016 Term Loan Spring Refinancing Consumers Letter Spring of Credit Renewal Securitization Bonds Summer Utility Debt Fall Commercial Paper Fall 2014 Plan 23 2013 Liquiditya Pct of Market Cap CMS Peers 18 25% _ _ _ _ _ a Annual average |

|
|
Operating Cash Flow Growth . . . . Amount (bils) $ Investment Cash flow before dividend _ _ _ _ _ a Non-GAAP NOLs & Credits $0.7 $0.6 $0.5 $0.4 $0.4 $0.2 $0.1 Gross operating cash flowa up $0.1 billion per year . . . . self-funds investment and strategy. Up $0.5 Billion $2.1 Interest Working capital and taxes $1.6 $1.9 $2.0 $1.7 $1.8 $1.45 $2.2 $1.4 $1.5 24 2013 Pct of Market Cap Cap Inv OCF CMS 13% 15% Peers 18 16 21% 20% |

|
|
Credit Ratings . . . . . . . . just upgraded, more ahead? Consistent Performance Less Risk Customer Focus Constructive Regulation Good Energy Policy Reflects Present Prior 2002 Scale S&P / Fitch Moody’s S&P (March) Moody’s (January) Fitch (February) A+ A1 A A2 Consumers Secured A- A3 BBB+ Baa1 BBB Baa2 BBB- Baa3 BB+ Ba1 CMS Unsecured BBB Baa2 BBB- Baa3 BB+ Ba1 BB Ba2 BB- Ba3 B+ B1 B B2 B- B3 Outlook Positive Stable Stable 25 |
|
|
Capital Expenditures 26 New Gas Plant Capacity 2014-2018 Plan 2013 2014 2015 2016 2017 2018 Total (mils) (mils) (mils) (mils) (mils) (mils) (mils) Electric Distribution $199 $190 $197 $202 $211 $208 $1,008 Generation 89 96 93 88 60 155 492 New Customers 48 47 38 39 38 34 196 Other 96 102 81 82 84 61 410 Electric Base Capital $432 $435 $409 $411 $393 $458 $2,106 Gas Distribution $177 $152 $181 $177 $193 $212 $915 New Customers 45 45 40 36 36 35 192 Other 88 60 53 53 49 44 259 - Gas Base Capital $310 $257 $274 $266 $278 $291 $1,366 Total Base Capital $742 $692 $683 $677 $671 $749 $3,472 Investment Choices Environmental $292 $280 $200 $122 $114 $111 $827 Electric Reliability 102 156 208 108 129 133 734 Gas Infrastructure 117 182 198 178 202 211 971 New Gas Plant Capacity - - - 155 10 100 265 Renewables 83 163 9 - - - 172 Consumers Smart Energy 66 84 134 175 120 - 513 Ludington Hydro & other 62 90 55 58 56 145 404 Total Choices $722 $- $955 $- $804 $796 $631 $700 $- $3,886 Total Utility $1,464 $1,647 $1,487 $1,473 $1,302 $1,449 $7,358 |
|
|
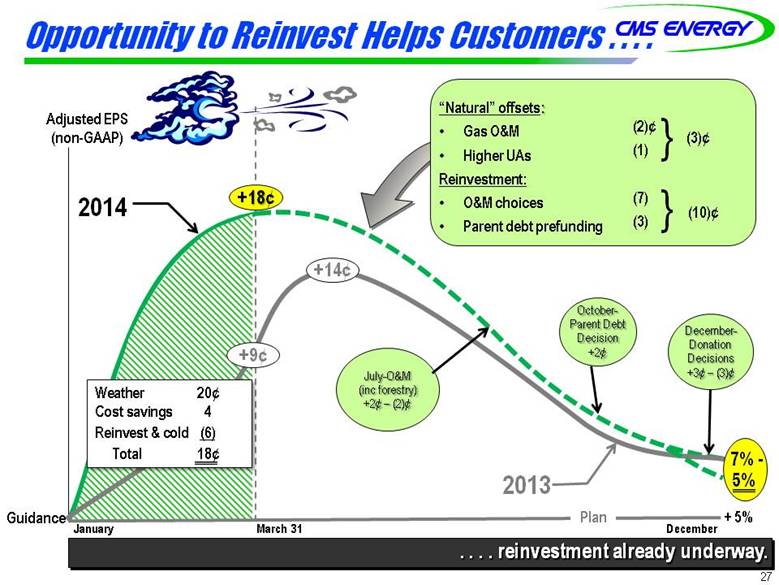
Opportunity to Reinvest Helps Customers . . . . 27 . . . . reinvestment already underway. 2014 2013 +14¢ +9¢ Adjusted EPS (non-GAAP) +18¢ Guidance 7% - 5% (2)¢ (1) (7) (3) } } (3)¢ (10)¢ “Natural” offsets: Gas O&M Higher UAs Reinvestment: O&M choices Parent debt prefunding January March 31 December + 5% Plan Weather 20¢ Cost savings 4 Reinvest & cold (6) Total 18¢ December- Donation Decisions +3¢ – (3)¢ October- Parent Debt Decision +2¢ July-O&M (inc forestry) +2¢ – (2)¢ |
|
|
28 Electric Utility Financial & Operating Statistics Count on Us Years Ended December 31 2013 2012 2011 2010 2009 2008 ELECTRIC REVENUE AND POWER COSTS ($ Millions ) Residential $1,819 $1,785 $1,678 $1,614 $1,387 $1,414 Commercial 1,301 1,228 1,197 1,166 1,099 1,129 Industrial 772 781 754 749 677 810 Other 34 38 39 40 36 32 Total revenue from customers $3,926 $3,832 $3,698 $3,569 $3,199 $3,385 Wholesale 24 23 21 20 19 22 Retail open access/direct access 46 53 43 54 31 15 Intersystem 114 54 91 99 94 113 Miscellaneous 63 59 60 60 64 59 Total electric utility revenue $4,173 $4,031 $3,913 $3,802 $3,407 $3,594 Fuel for electric generation $541 $517 $559 $520 $460 $483 Purchased and interchange power 1,450 1,425 1,348 1,308 1,232 1,388 DEPRECIATION AND AMORTIZATION $494 $459 $412 $450 $441 $438 OPERATING INCOME $793 $743 $712 $672 $488 $576 NET INCOME $363 $325 $333 $303 $194 $271 DELIVERIES (Million kWhs) System sales Residential 12,793 12,901 12,931 12,968 12,386 12,854 Commercial 10,908 10,950 10,903 11,026 11,211 11,969 Industrial 8,647 9,685 9,544 9,061 9,290 10,563 Other 209 220 224 235 230 225 Total sales to ultimate customers 32,557 33,756 33,602 33,290 33,117 35,611 Wholesale 341 347 332 325 328 333 Retail open access/direct access 3,996 3,981 3,901 4,079 2,326 1,541 Intersystem 2,379 1,711 1,349 1,394 1,277 1,176 Total electric system deliveries 39,273 39,795 39,184 39,088 37,048 38,661 AVERAGE ELECTRIC REVENUE (¢ per kWh) Residential 14.22 13.84 12.98 12.45 11.20 11.00 Commercial 11.93 11.21 10.98 10.58 9.80 9.43 Industrial 8.93 8.06 8.21 8.27 7.29 7.67 Other 16.27 17.27 17.41 17.02 15.65 14.22 Total 12.06 11.35 11.01 10.72 9.66 9.51 ELECTRIC CUSTOM ERS BILLED (At December 31) Residential 1,573,802 1,571,873 1,571,319 1,569,183 1,566,980 1,584,752 Commercial 296,396 206,627 207,490 209,464 210,223 208,931 Industrial 8,588 8,706 8,691 8,702 8,770 8,505 Retail open access/direct access 1,01 1,065 1,078 1,095 861 642 Other 1,363 1,320 1,349 1,287 1,282 2,045 Total 1,791,230 1,789,591 1,789,878 1,789,731 1,788,115 1,804,875 AUTHORIZED RETURN ON EQUITY 10.30% 10.30% 10.70% 10.70% 10.70% 10.70% EARNED RETURN ON EQUITY-FINANCIAL 10.90% 10.20% 11.00% 10.60% 6.40%1 9.40% RATE BASE ($ Millions) 13 month average $8,374 $7,741 $7,442 $6,315 $6,459 $6,175 COOLING DEGREE DAYS 2 Normal degree days in calendar year 665 607 584 571 578 579 Actual degree days 675 942 767 884 379 542 Warmer (colder) than normal (%) 2 55 31 55 (34) (6) Increase (decrease) from normal in: Electric deliveries (millions of kWh) 395 502 513 855 (461) 146 HEADCOUNT total utility) 7,435 7,221 7,452 7,551 7,787 7,727 1 9.1% excluding Big Rock Decommissioning refund 2 CDD base 65 degrees, Lansing weather station, normal equals average of preceding 15 year time period CMS Energy Investor Relations One Energy Plaza, Jackson, MI 49201 517-188-2590 www.cmsenergy.com |
|
|
29 Electric Utility Financial & Operating Statistics Count on Us Years Ended December 31 2013 2012 2011 2010 2009 2008 FUEL COST ($ per MMBtu) Coal 2.90 2.98 2.94 2.51 2.37 2.01 Oil 19.47 19.08 18.55 10.98 9.59 11.54 Gas 4.68 3.16 4.95 5.57 6.57 10.94 Weighted average for all fuels 3.07 3.05 3.18 2.71 2.56 2.47 FUEL COST FOR GENERATION (%) Coal 89.2 84.9 83.5 88.2 90.6 81.0 Oil 1.8 1.5 2.1 3.3 2.5 4.1 Gas 8.6 13.6 14.3 8.4 6.8 14.6 Nox allowances 0.4 4.0 0.1 0.1 0.1 0.3 POWER GENERATED (Millions of kWhs) Coal 15,951 14,027 15,468 17,879 17,255 17,701 Oil 4 6 7 21 14 41 Gas 1,415 3,003 1,912 1,043 565 804 Renewable energy (hydro, wind ‘12) 704 433 425 365 466 454 Net pumped storage 1 (371) (295) (365) (366) (303) (382) Total net generation 17,703 17,174 17,447 18,942 17,997 18,618 Purchased and interchange: Non-unity generation 13,121 14,539 12,674 12,003 11,538 13,643 Net interchange power 3,656 4,151 6,825 6,045 6,925 6,653 Total net purchased and interchange power 16,777 18,690 19.499 18,048 18,463 20,296 Total net power supply 34,480 35,864 36.946 36,990 36,460 38,914 POWER GENERATED (%) Total net generation 51.3 47.9 47.2 51.2 49.4 47.8 Non-utility generation 38.1 40.5 34.3 32.5 31.6 35.1 Net interchange power 10.6 11.6 18.5 16.3 19.0 17.1 Total net purchased and interchange power 48.7 52.1 52.8 48.8 50.6 52.2 Total net power supply 100.0 100.0 100.0 100.0 100.0 100.0 NET DEMONSTRATED CAPABILITY AT PEAK (MW) Coal 2,799 2,846 2,823 2,828 2,850 2,850 Oil and gas 1,795 1,795 1,810 1,814 1,814 1,997 Combustion turbine 342 348 465 517 661 661 Renewable energy (hydro, wind ‘12) 89 176 77 74 74 73 Pumped storage 953 954 955 955 955 955 Total owned generation 5.984 6,119 6,130 6,180 6,354 6,536 P&I power capability 2,619 2,488 2,458 3,058 2,600 3,050 Total owned and P&I 8,603 8,607 8,588 9,246 8,954 9,586 NET DEMONSTRATED ED CAPABILITY AT PEAK (%) Total owned generation 69.6 71.1 71.4 66.9 71.0 68.2 P&I power capability 30.4 28.9 28.6 33.1 29.0 31.8 Total owned and P&I 100.0 100.0 100.0 100.0 100.0 100.0 Peak load (MW) 2 8,509 9,006 8,930 8,190 7,756 7,705 Reserve capacity (%) 6 4 4 11 17 22 Net demonstrated capacity, summer (MW) 5,984 6,119 6,091 6,151 6,353 6,353 Load factor (%) 3 52.5 48.7 50.2 55.3 55.9 59.2 1 Consumers’ portion of the Ludington pumped storage facility 2 Includes Retail Open Access customers 3 Includes bundled service customers CMS Energy Investor Relations One Energy Plaza, Jackson, MI 49201 517-788-2590 www.cmsenergy.com |
|
|
30 Gas Utility Financial & Operating Statistics Count on Us Years Ended December 31 2013 2012 2011 2010 2009 2048 GAS REVENUE AND COST OF GAS ($ Millions) Residential $1,515 51,415 51,655 51,677 51,808 $1,971 Commercial 399 351 438 449 511 598 Industrial 69 65 89 88 101 124 Other 2 2 3 3 3 5 Total sales revenue $1,985 $1,833 $2,185 $2,217 $2,423 $2,698 Transportation fees 62 58 613 53 4-8 45 Miscellaneous 101 91 95 84 85 84 Total gas utility revenue $2,148 $1,982 $2,340 $2,354 $2,556 $2,827 Cost of gas sold 1,187 1,110 1,430 1,516 1,778 2,079 Gas utility revenue net of cost of gas $961 $872 $902 $838 $778 $740 DEPRECIATION, DEPLETION AND AMORTIZATION $138 $133 $130 $122 $118 $136 OPERATING INCOME $334 $240 $272 $252 $201 $190 NET INCOME $168 $110 $130 $127 $96 589 SALES AND DELIVERIES (Bcf) Residential 169 139 157 152 163 171 Commercial 54 44 50 47 52 57 Industrial 10 9 11 10 11 12 Total gas sales 1 233 192 218 209 226 240 Gas transportation deliveries 119 137 119 108 93 98 Total gas sales and transportation deliveries 352 329 337 317 319 338 GAS CUSTOMERS BILLED (at December 31) Residential 1,589,407 1,582:123 1,579,835 1,576,520 1,574,246 1,577,853 Commercial 119,441 118,781 118,223 117,860 118,199 118,870 Industrial 6,026 6,437 6,721 6,938 7,073 6,961 Transportation 3,523 3:347 3,179 3,005 2,725 2,507 Total customers 1,718,397 1,710,688 1,707,958 1,704,323 1,702,243 1,706,201 AVERAGE GAS REVENUE ($ per Mcf) Residential $8.96 $10.18 $10.54 $11.03 $11.09 $11.53 Commercial 7.39 7.98 8.76 9.55 9.83 10.49 Industrial 6.90 7.22 8.09 8.813 9.18 10.33 Transportation - 0.83 0.87 0.88 0.82 0.82 0.70 GAS SUPPLY (MMcf) Gas cost recovery 175,812 145,400 175,431 176,247 205,329 219,848 Gas customer choice 62,807 48,923 48,338 36,389 26,816 25,211 Total 238,619 194,323 223,769 212,636 232,145 245,059 WORKING GAS STORAGE CAPACITY (Bcf) 143 143 142 142 142 142 AVERAGE COST OF GAS SOLD (S per Mel)' Gas cost recovery $4.93 $5.84 $6.42 $7.09 $7.57 $8.36 Gas customer choice 5.17 5.41 6.56 7.48 8.72 9.99 AUTHORIZED RETURN ON EQUITY 10.30% 10.30% 10.50% 10.55% 10.55% 10.55% EARED RETURN ON EQUITY-FINANCIAL 12.30% 8.60% 10.50% 10.90% 9.90% 9.20% RATE BASE ($ Millions) 13 month average $3,187 $3,138 $3,110 $2,867 $2,778 $2,638 I-EATING DEGREE DAYS 4 Normal degree days in calendar year 6,516 6:626 6,678 6,731 6,732 6,741 Actual degree days 6,924 5,714 6,606 6,305 6,913 6,965 Colder (warmer) than normal (%) 6.3 (13.8) (1.1) (6.3) 2.7 3.3 Increase (decrease) from normal in: Gas deliveries (Bcf) 16.5 (22.9) (0.4) (6.4) 4.8 4.1 1 Includes Gas Customer Choice sales 2 Average gas revenue for transportation excludes amounts related to MCV and off-system transportation 3 Includes pipeline transportation charges 4 HDD base 65 degrees, seven weather station average: normal equals average of preceding 15 year tine period CMS Energy Investor Relations One Energy Plaza, Jackson, MI 49201 517-788-2590 www.comsenergy.com |
|
|
31 As of December 31, 2013 Independent Power Production Capacity Primary Ownership Gross In-Service Under LT Plant Fuel Interest Capacity Year Contract State Craven Wood 50% 50 1990 100% NC DIG Natural Gas 100 710 2001 61 MI Filer City Coal 50 73 1990 100 MI Genesee Wood 50 40 1996 100 MI Grayling Wood 50 38 1992 100 MI MI Power Natural Gas 100 224 1999 40 MI Total MW 1.034 (net owned) 1.135 |
|
|
GAAP Reconciliation |
|
|
33 2003 2004 2005 2006 2007 2008 2009 2010 2011 2012 2013 Reported earnings (loss) per share - GAAP ($0.30) $0.64 ($0.44) ($0.41) ($1.02) $1.20 $0.91 $1.28 $1.58 $1.42 $1.66 After-tax items: Electric and gas utility 0.21 (0.39) - - (0.07) 0.05 0.33 0.03 - 0.17 - Enterprises 0.74 0.62 0.04 (0.02) 1.25 (0.02) 0.09 (0.03) (0.11) (0.01) * Corporate interest and other 0.16 (0.03) 0.04 0.27 (0.32) (0.02) 0.01 * (0.01) * * Discontinued operations (income) loss (0.16) 0.02 (0.07) (0.03) 0.40 (*) (0.08) 0.08 (0.01) (0.03) * Asset impairment charges, net - - 1.82 0.76 0.60 - - - - - - Cumulative accounting changes 0.16 0.01 - - - - - - - - - Adjusted earnings per share, including MTM - non-GAAP $0.81 $0.87 $1.39 $0.57 $0.84 $1.21 (a) $1.26 $1.36 $1.45 $1.55 $1.66 Mark-to-market impacts 0.03 (0.43) 0.51 Adjusted earnings per share, excluding MTM - non-GAAP NA $0.90 $0.96 $1.08 NA NA NA NA NA NA NA * Less than $500 thousand or $0.01 per share. (a) $1.25 excluding discontinued Exeter operations and accounting changes related to convertible debt and restricted stock. Earnings Per Share By Year GAAP Reconciliation (Unaudited) |
|
|
34 2012 2013 2014 2015 2016 2017 2018 Consumers Operating Income + Depreciation & Amortization 1,635 $ (a) 1,740 $ 1,820 $ 1,876 $ 1,952 $ 2,054 $ 2,162 $ Enterprises Project Cash Flows 17 16 25 30 28 35 36 Gross Operating Cash Flow 1,652 $ 1,756 $ 1,845 $ 1,906 $ 1,980 $ 2,089 $ 2,198 $ (411) (335) (395) (356) (730) (739) (748) Net cash provided by operating activities 1,241 $ 1,421 $ 1,450 $ 1,550 $ 1,250 $ 1,350 $ 1,450 $ (a) excludes $(59) million 2012 disallowance related to electric decoupling CMS Energy Reconciliation of Gross Operating Cash Flow to GAAP Operating Activities (unaudited) (mils) Other operating activities including taxes, interest payments and working capital |