Attached files
| file | filename |
|---|---|
| 8-K - CURRENT REPORT - Western New England Bancorp, Inc. | wfd-8k_051514.htm |
Exhibit 99.1

W ESTFIELD F INANCIAL , I NC . A NNUAL M EETING OF S HAREHOLDERS M AY 15, 2014

AGENDA 1. Welcoming Remarks 2. Introductions 3. Procedural Matters Relating to the Conduct of the Annual Meeting 4. Presentation of the Four Proposals before the Annual Meeting 5. Opening of Polls and Balloting 6. Closing of Polls 7. Annual Report of the Company 8. Report of the Inspector of Elections 9. Adjournment of Formal Portion of the Annual Meeting 10. General Question and Answer Period

F ORWARD – LOOKING STATEMENTS Today’s presentation may contain forward - looking statements, which may be identified by the use of such words as “believe,” “expect,” “anticipate,” “should,” “planned,” “estimated” and “potential . ” Examples of forward - looking statements include, but are not limited to, estimates with respect to our financial condition and results of operation and business that are subject to various factors which could cause actual results to differ materially from these estimates . These factors include, but are not limited to : • changes in the interest rate environment that reduce margins; • changes in the regulatory environment; • the highly competitive industry and market area in which we operate; • general economic conditions, either nationally or regionally, resulting in, among other things, a deterioration in credit quality; • changes in business conditions and inflation; • changes in credit market conditions; • changes in the securities markets which affect investment management revenues; • increases in Federal Deposit Insurance Corporation deposit insurance premiums and assessments ; • changes in technology used in the banking business; • the soundness of other financial services institutions; • certain of our intangible assets may become impaired in the future; • our controls and procedures may fail or be circumvented; • new lines of business or new products and services, including the additions of the Westfield Wealth Management and Insurance Group; • changes in key management personnel ; • r ecent or proposed legislative and regulatory initiatives; • severe weather, natural disasters, acts of war or terrorism and other external events; and • other factors set forth in our Annual Report on Form 10 - K for this year ended December 31, 2013, and other reports filed by us with the Securities and Exchange Commission (“SEC ”). Any or all of our forward - looking statements in today’s presentation or in any other public statements we make may turn out to be wrong . They can be affected by inaccurate assumptions we might make or known or unknown risks and uncertainties . Consequently, no forward - looking statements can be guaranteed . We disclaim any obligation to subsequently revise any forward - looking statements to reflect events or circumstances after the date of such statements, or to reflect the occurrence of anticipated or unanticipated events .

J AMES C. H AGAN P RESIDENT AND C HIEF E XECUTIVE O FFICER

W ESTFIELD F INANCIAL H IGHLIGHTS D ECEMBER 2013 VS D ECEMBER 2012 ▪ Earnings Per Share 2013: $0.34 Increase of $0.08, or 31% ▪ Total Loans: $637 million Increase of $43 million, or 7.1% ▪ Total Deposits: $817 million Increase of $64 million, or 8.5% ▪ Capital Ratios and Credit Quality remain strong

N ORTHERN C ONNECTICUT B ANKING C ENTER F IRST ENTRY INTO THE C ONNECTICUT M ARKET ▪ Full service banking center in Granby, CT . o Commercial lending reach through North Central Connecticut . o Bloomfield, East Granby, Windsor, West Hartford and greater Hartford . o Targeting areas with more affluent customers, including the Farmington Valley, which offers a strong residential lending opportunity . o We compete well against national banks and have solid expertise in small business and commercial lending when compared to smaller community banks . Ted Horan Thomas Glynn Brenda Glazier

▪ First Quarter 2014 announced the launch of Westfield Wealth Management and Insurance Group. ▪ Formed a strategic alliance with Charter Oak Insurance Agency, a general agency of Massachusetts Mutual Insurance Co. o Charter Oak and Mass Mutual are within the Westfield Bank footprint. o Mass Mutual Trust is local to the area and provides in - person trust services to Westfield Bank customers. o Strategic alliance provides an ongoing revenue stream to Westfield Bank through referral based activity – the Bank does not have any significant operating expenses. W EALTH M ANAGEMENT & I NSURANCE N EW SOURCE OF NON INTEREST INCOME

SELECTED FINANCIAL HIGHLIGHTS Leo R. Sagan Jr., Chief Financial Officer

Q UARTERLY D ILUTED E ARNINGS P ER S HARE C REATING POSITIVE EPS MOMENTUM $0.04 $0.06 $0.07 $0.08 $0.08 $0.08 $0.09 $0.09 $0.00 $0.02 $0.04 $0.06 $0.08 $0.10 Q2 2012 Q3 2012 Q4 2012 Q1 2013 Q2 2013 Q3 2013 Q4 2013 Q1 2014
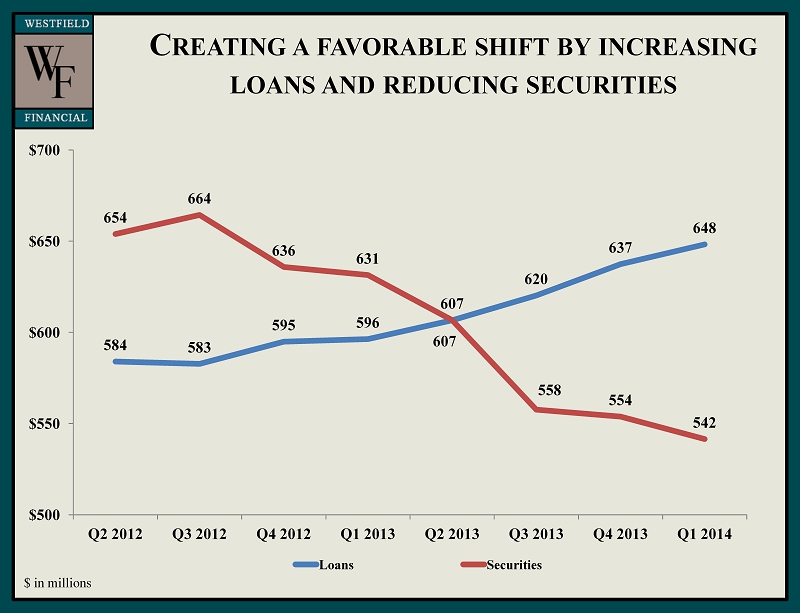
C REATING A FAVORABLE SHIFT BY INCREASING LOANS AND REDUCING SECURITIES 584 583 595 596 607 620 637 648 654 664 636 631 607 558 554 542 $500 $550 $600 $650 $700 Q2 2012 Q3 2012 Q4 2012 Q1 2013 Q2 2013 Q3 2013 Q4 2013 Q1 2014 Loans Securities $ in millions

C OMMERCIAL L OANS G ROWTH OF 10.3% FROM 1Q 2013 $320 $340 $360 $380 $400 $420 Q2 2012 Q3 2012 Q4 2012 Q1 2013 Q2 2013 Q3 2013 Q4 2013 Q1 2014 358 355 372 369 372 383 399 407 $ in millions

C ONSISTENTLY S TRONG C REDIT Q UALITY Mar 31, 2014 Dec 31, 2013 Mar 31, 2013 Allowance for loan losses as a 1.17% 1.17% 1.27% percentage of total loans Nonperforming loans as a 0.48% 0.41% 0.50% percentage of total loans Nonperforming assets as a 0.24% 0.20% 0.23% percentage of total assets

T OTAL D EPOSITS S TEADY GROWTH WHICH IMPROVES FRANCHISE VALUE $700 $725 $750 $775 $800 $825 Q2 2012 Q3 2012 Q4 2012 Q1 2013 Q2 2013 Q3 2013 Q4 2013 Q1 2014 748 754 753 772 783 794 817 807 $ in millions

S TRONG C APITAL B ASE As of December 31, 2013 Total Capital/Risk Weighted Assets Tier 1 Capital/Risk Weighted Assets Tier 1 Capital/Total Adjusted Assets 5.00% 12.28% 0.00% 3.00% 6.00% 9.00% 12.00% 15.00% 18.00% 21.00% 24.00% Well Capitalized Westfield Financial 6.00% 20.21% 0.00% 3.00% 6.00% 9.00% 12.00% 15.00% 18.00% 21.00% 24.00% Well Capitalized Westfield Financial 10.00% 21.17% 0.00% 3.00% 6.00% 9.00% 12.00% 15.00% 18.00% 21.00% 24.00% Well Capitalized Westfield Financial

T HANK Y OU