Attached files
| file | filename |
|---|---|
| 8-K - FORM 8-K - CNL LIFESTYLE PROPERTIES INC | d726357d8k.htm |
| EX-99.1 - PRESS RELEASE - CNL LIFESTYLE PROPERTIES INC | d726357dex991.htm |
 CNL
Lifestyle Properties, Inc. Owning America’s Lifestyle
®
First Quarter 2014 Update
May 14, 2014
Exhibit 99.2 |
 2
Forward Looking Statements
Certain statements in this document may constitute forward-looking statements within the meaning
of Section 27A of the Securities Act of 1933, as amended (the “Securities Act”) and
of Section 21E of the Securities Exchange Act of 1934, as amended (the “Exchange Act”). CNL Lifestyle Properties,
Inc. (herein also referred to as the “Company”) intends that all such forward-looking
statements be covered by the safe-harbor provisions for forward- looking statements of
Section 27A of the Securities Act and Section 21E of the Exchange Act, as applicable.
All statements, other than statements that relate solely to historical facts, including, among others,
statements regarding the Company’s future financial position, business strategy, projected
levels of growth, projected costs and projected financing needs, are forward-looking statements. Those statements
include statements regarding the intent, belief or current expectations of the management team, as
well as the assumptions on which such statements are based, and generally are identified by the
use of words such as “may,” “will,” “seeks,” “anticipates,” “believes,” “estimates,” “expects,” “plans,” “intends,”
“should,” “continues,” “pro forma” or similar expressions.
Forward-looking statements are not guarantees of future performance and actual results may
differ materially from those contemplated by such forward-looking statements due to a variety of
risks, uncertainties and other factors, including but not limited to, the factors detailed in
our Annual Report on Form 10-K for the year ended December 31, 2013, and other documents filed from time to time wit
the Securities and Exchange Commission.
Many of these factors are beyond the Company’s ability to control or predict. Such factors
include, but are not limited to: changes in general economic conditions in the U.S. or globally
(including financial market fluctuations); risks associated with our investment strategy; risks associated with the real
estate markets in which the Company invests; risks of doing business internationally and global
expansion, including unfamiliarity with new markets and currency risks; risks associated with
the use of debt to finance the Company’s business activities, including refinancing and interest rate risk and the
Company’s failure to comply with its debt covenants; the Company’s failure to obtain, renew
or extend necessary financing or to access the debt or equity markets; competition for
properties and/or tenants in the markets in which the Company engages in business; the impact of current and future
environmental, zoning and other governmental regulations affecting the Company’s properties; the
Company’s ability to make necessary improvements to properties on a timely or
cost-efficient basis; risks related to development projects or acquired property value-add conversions, if applicable (including
construction delays, cost overruns, the Company’s inability to obtain necessary permits and/or
public opposition to these activities); defaults on or non- renewal of leases by tenants;
failure to lease properties at all or on favorable terms; unknown liabilities in connection with acquired properties or liabilities
caused by property managers or operators; the Company’s failure to successfully manage growth or
integrate acquired properties and operations; material adverse actions or omissions by any
joint venture partners; increases in operating costs and other expense items and costs, uninsured losses or
losses in excess of the Company’s insurance coverage; the impact of outstanding or potential
litigation; risks associated with the Company’s tax structuring; the Company’s
failure to qualify and maintain its status as a real estate investment trust and the Company’s ability to protect its intellectual
property and the value of its brand. Management believes these forward-looking statements are
reasonable; however, such statements are necessarily dependent on assumptions, data or methods
that may be incorrect or imprecise and the Company may not be able to realize them. Investors are
cautioned not to place undue reliance on any forward-looking statements which are based on current
expectations. All written and oral forward-looking statements attributable to the
Company or persons acting on its behalf are qualified in their entirety by these cautionary statements. Further, forward-
looking statements speak only as of the date they are made and the Company undertakes no obligation to
update or revise forward-looking statements to reflect changed assumptions, the occurrence
of unanticipated events or changes to future operating results over time unless otherwise required by law. |
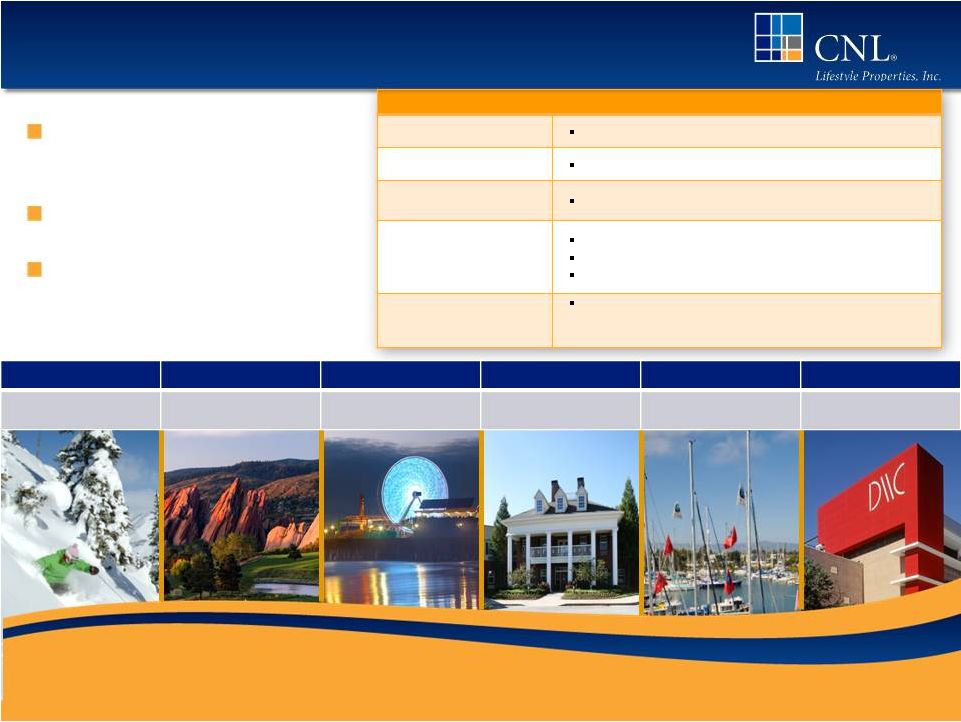 CNL
Lifestyle Properties, Inc. Portfolio of 146 lifestyle-oriented
properties and six loans as of
May 6, 2014
Diversified by asset type,
geography and operator
Iconic assets and industry-
leading operators
Ski & Mountain
Golf
Attractions
Senior Housing
Marinas
Additional
•
24 properties
•
48 properties
•
24 properties
•
30 properties
•
17 properties
•
3 properties
3
CNL Lifestyle Properties, Inc.
Summary REIT Information
GAAP Total Assets
$2.7 billion
Property Focus
Demographically Driven / Lifestyle-Oriented
Geographic
Diversification
37 states and 2 Canadian provinces
Established Assets
Conservative Capital Structure
Leasing and Preferred Return Structures
Diversified Portfolio
Exit Strategy
The board of directors will consider a listing, merger,
sale or other liquidity opportunities on or before
December 31, 2015 |
 Recent Highlights
Amended our advisory agreement effective April 1, 2014 to reduce
all advisory
fees, including the elimination of all acquisition fees on equity and debt,
performance fees and disposition fees, as well as a reduction in
asset
management fees to 0.075% monthly (0.90% annually)
Jefferies LLC, a leading global investment banking and advisory firm, is currently
assisting in the evaluation of various strategic alternatives to
provide liquidity to
shareholders
During Q1 2014, acquired one senior housing property for $15.3 million
Foreclosed on the Myrtle Waves water park and engaged a third-party manager to
operate the property
Actively working to close remaining four Pacifica senior housing
portfolio properties
for approximately $93 million
Over $10 million of owner capital invested into various portfolio assets in Q1
2014 Completed the transition of four leased marinas to a third-party
manager in April 2014
Approved a plan to sell existing golf portfolio consisting of 48
properties
4 |
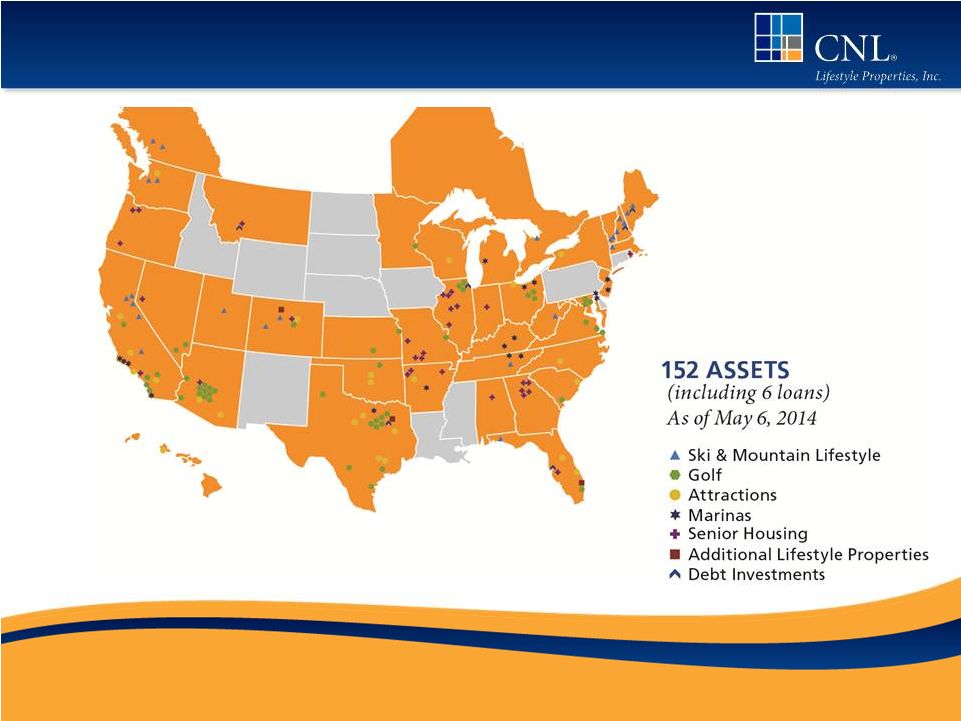 Geographic Diversification
5 |
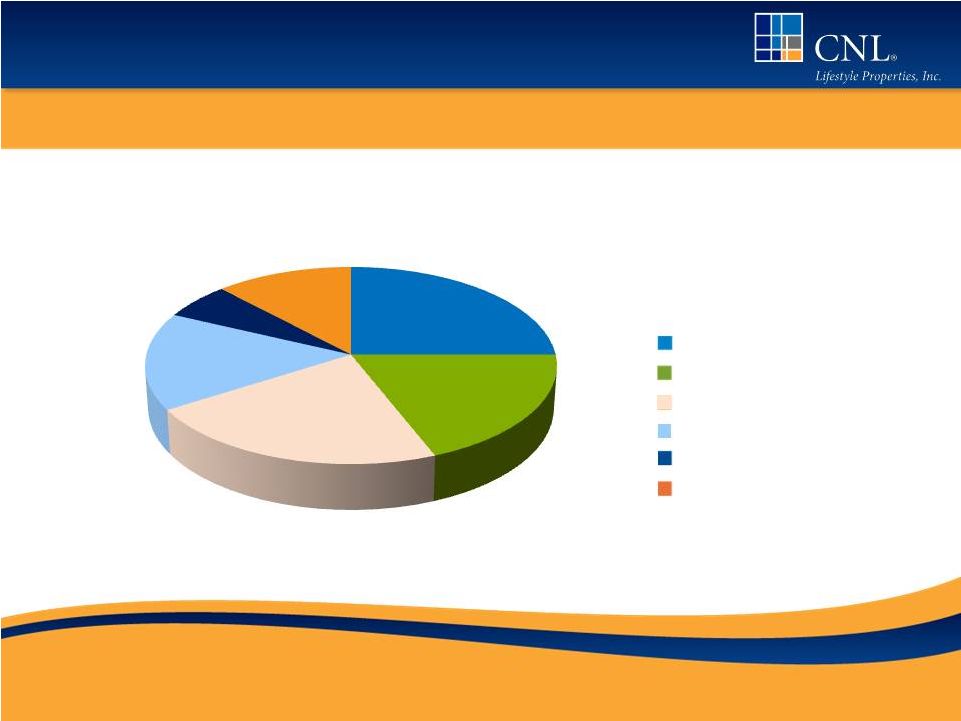 The portfolio is broadly diversified across asset classes to
mitigate against seasonality and volatility
Sector Diversification
As of May 6, 2014
Ski & Mountain Lifestyle (24)
Golf (48)
Attractions (24)
Senior Housing (30)
Marinas (17)
Additional Lifestyle Properties (3)
By Initial Purchase Price
6
25%
19%
22%
16%
6%
12% |
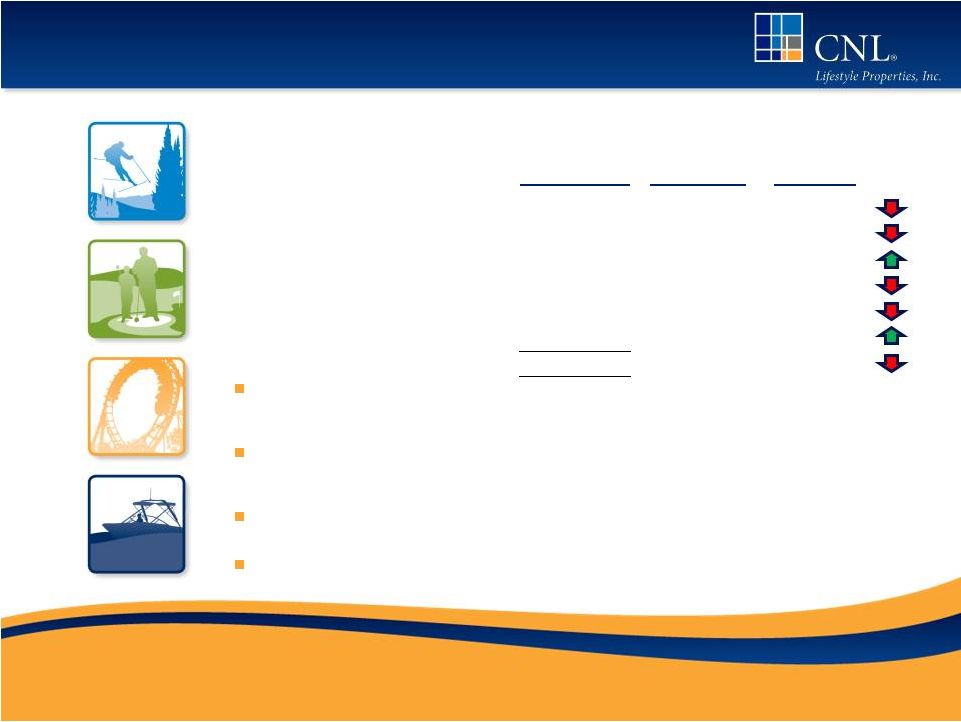
 Q1
2014 Sector Performance 7
146 properties as of May 6, 2014
Source: CNL Lifestyle Properties, Inc. March 31, 2014 Form 10-Q
Past performance is not indicative of future returns.
Ski & Mountain
24 properties
Golf
48 properties
Attractions
24 properties
Senior Housing
30 properties
Marinas
17 properties
Additional Lifestyle
3 properties
-
Poor snow conditions
in the west,
particularly in
California, for
2013/2014 ski
season.
-
Golf rounds are down -
consistent with the 4.5%
industry decrease in
overall rounds played
YTD through March
2014 as reported by
Golf Datatech.
-
Attractions portfolio
outperformed the prior year
due to favorable weather in
Southern California and
expense management
throughout the offseason at
many of the other
properties. Early season
pass sales for the portfolio
are up double digits in terms
of units and revenue.
Steady performance at
Dallas Market Center.
Multifamily property
experienced an increase in
EBITDA due to the
completion of renovations
of 247 units and
subsequent lease up.
-
-
Revenue and EBITDA were
down compared to prior year
due to record-breaking cold
where temperatures fell to
unprecedented levels.
Largest marina partially shut
down due to ice storm
damage. Management
transitioned the last four
leased marinas to managed
structures in April 2014.
-
Occupancy and Revenue
per Occupied Unit both up
over the last year. Average
occupancy for the entire
portfolio was 90.2% as of
March 31, 2014 exceeding
the industry average of
89.8%. Expenses at certain
properties impacted by
severe winter storms. |
 Same-Store Property Performance
8
Three Months Ended March 31, 2014 Compared to Same Period 2013
Note: Includes results for comparable leased and managed properties owned for the
entirety of 2014 and 2013. Source: CNL Lifestyle Properties, Inc.
March 31, 2014 Form 10-Q Past performance is not indicative of future
returns. The decreases in both revenue and EBITDA are primarily due to the
performance of the ski and mountain lifestyle
and
marina
sectors
-
Ski
resorts
in
the
west
(particularly
California)
experienced
unusually
warm, drought
conditions
Attractions portfolio benefited from the warm dry conditions in Southern
California and tight expense controls at many
properties
throughout
the
offseason
-
Early
season
pass
sales
show
double
digit
growth
over
prior
year
both in terms of units and revenues
Marina and senior housing portfolios were lower due to cold temperatures resulting
in higher costs and the partial closing of our largest marina due to ice
storm damage TTM lease coverage was 1.39x through Q1 2014 vs. 1.48x through
Q4 2013 primarily due to poor performance at our western ski assets
# of
Properties
Revenue
EBITDA
Ski and Mountain Lifestyle
17
-5.7%
-8.0%
Golf
48
-1.0%
-0.2%
Attractions
21
7.7%
11.9%
Senior Housing
20
3.5%
-4.9%
Marinas
17
-12.5%
-41.7%
Additional Lifestyle
1
42.6%
68.6%
124
-3.9%
-7.2% |
 Full
Year Financial Summary (in Millions) 9
Source: CNL Lifestyle Properties, Inc. 2013 Form 10-K and March 31, 2014 Form
10-Q The Company believes that its presentation of historical
non-GAAP financial measures provides useful supplementary information to and facilitates additional analysis by investors.
These historical non-GAAP financial measures are in addition to, not a
substitute for, or superior to, measures of financial performance prepared in accordance with U.S. Generally
Accepted Accounting Principles. See reconciliation to GAAP net income (loss)
contained in the Appendix. Past performance is not indicative of future
returns. $89.6
$97.7
$67.2
$69.8
$-
$20.0
$40.0
$60.0
$80.0
$100.0
$120.0
2011
2012
2013
TTM Mar 2014
$138.8
$168.1
$186.6
$179.2
$
$50.0
$100.0
$150.0
$200.0
2011
2012
2013
TTM Mar
2014
$96.6
$114.3
$122.9
$123.1
$-
$20.0
$40.0
$60.0
$80.0
$100.0
$120.0
2011
2012
2013
TTM Mar 2014
-
First quarter 2014 results reflected:
A reduction in distributions from unconsolidated entitles due to
the sale of 42 senior housing properties owned through 3 JV’s
and
Increased interest expense from new borrowings
Offset partially by an increase in rental income from properties
acquired after Q1 2013 and a reduction in asset management
fees
2013 FFO impacted by non-cash, non-recurring impairment
provision, $58.1 million of which has not been added back in
deriving FFO
Adjusted EBITDA
MFFO
FFO |
 Credit Metrics
Interest Coverage (1)
(1) Calculated as adjusted EBITDA divided by interest
expense (2) Net debt is total debt less cash
(3) Debt includes line of credit
Net Debt / Adjusted EBITDA (2)
10
Debt / GAAP Total Assets (3)
Source: CNL Lifestyle Properties, Inc. 2013 Form 10-K and March 31, 2014 Form
10-Q The Company believes that its presentation of historical
non-GAAP financial measures provides useful supplementary information to and facilitates additional analysis by investors.
These historical non-GAAP financial measures are in addition to, not a
substitute for, or superior to, measures of financial performance prepared in accordance with U.S.
Generally Accepted Accounting Principles. See reconciliation to GAAP net income
(loss) contained in the Appendix. Past performance is not indicative of
future returns. Year
Coverage
2011
2.4x
2012
2.5x
2013
2.6x
TTM Mar 2014
2.4x
Year
Coverage
2011
5.5x
2012
6.3x
2013
6.1x
Mar 2014
6.5x
Consolidated
Leverage Including Share
Year
Coverage
of Unconsolidated Entities
2011
32.0%
43.3%
2012
38.7%
45.3%
2013
44.6%
48.1%
Mar 2014
45.9%
49.0% |
 Key
Credit Information 11
Weighted average interest rate is 5.68% (5.77% without JV debt)
70% fixed rate debt, 10% hedged and 20% variable rate debt
No significant near-term maturities
Note: Chart as of March 31, 2014. 2014 maturities are expected to be
refinanced or retired with proceeds from asset sales. |
 Management Initiatives
Proactive Portfolio Management and Optimization
Focused asset management to continue to drive performance and value
Continue to dispose of non-core assets and reinvest in new ski, attractions
or senior housing properties or invest in improvements and enhancements
to existing assets to further drive revenue and expense reduction
Streamline and rebalance portfolio
Liquidity Options Study
Continue working with Jefferies LLC to evaluate strategic alternatives to
maximize value and provide liquidity to shareholders
12 |
 Conclusion & Summary
13
Portfolio performance is solid except for certain locations impacted by extreme
weather
Positive momentum heading into the main attractions season
Continuing the process of selling certain non-core assets and recycling capital
including the marketing of our 48 property golf portfolio
Strategically deploying excess cash into new acquisitions, improvements at
existing properties or repayment or debt
In the early stages of evaluating strategic alternatives with Jefferies LLC
|
 Contact Information
14
For more information about
CNL Lifestyle Properties, please contact
CNL Client Services at 866-650-0650. |
 Appendix
15
Appendix |
 Reconciliation of FFO and MFFO to Net Loss
16
Source: CNL Lifestyle Properties, Inc. March 31, 2014 Form 10-Q
The Company believes that its presentation of historical non-GAAP financial
measures provides useful supplementary information to and facilitates additional analysis by investors.
These historical non-GAAP financial measures are in addition to, not a
substitute for, or superior to, measures of financial performance prepared in accordance with U.S.
Generally Accepted Accounting Principles.
Past performance is not indicative of future returns.
2014
2013
Net loss
(20,353)
$
(23,299)
$
Adjustments:
Depreciation and amortization
(1)
36,859
36,183
Impairment of real estate assets
(1)
3,314
-
Net effect of FFO adjustment from unconsolidated entities
(2)
1,731
6,044
Total funds from operations
21,551
18,928
Acquisition fees and expenses
(3)
724
367
Straight-line adjustments for leases and notes receivable
(1)(4)
(3,426)
(486)
Amortization of above/below market intangible assets and liabilities
(1)
376
336
Accretion of discounts/amortization of premiums
3
-
MFFO adjustments from unconsolidated entities:
(2)
Straight-line adjustments for leases and notes receivable
(4)
14
(68)
Amortization of above/below market intangible assets and
liabilities 12
(4)
Modified funds from operations
19,254
$
19,073
$
Weighted average number of shares of common stock
322,639
316,382
outstanding (basic and diluted)
FFO per share (basic and diluted)
0.07
$
0.06
$
MFFO per share (basic and diluted)
0.06
$
0.06
$
Three Months Ended
March 31,
(1) Includes amounts related to the
properties that are classified as assets held for sale and for
which the related results are classified as income (loss) from discontinued
operations in the accompanying condensed consolidated statements of
operations. (2) This amount represents our share of
the FFO or MFFO adjustments allowable under the NAREIT or IPA
definitions, respectively, multiplied by the percentage of
income or loss recognized under the HLBV method. (3) In evaluating investments in real estate, management
differentiates the costs to acquire the investment from the
operations derived from the investment. By adding back
acquisition fees and expense relating to business combinations, management
believes MFFO provides useful supplemental information of its
operating performance and will also allow comparability between
real estate entities regardless of their level of acquisition
activities. Acquisition fees and expenses include payments to our
advisor or third parties. Acquisition fees and expenses relating to
business combinations under GAAP are considered operating
expenses and as expenses included in the determination of net
income (loss) and income (loss) from continuing operations,
both of which are performance measures under GAAP. All paid and
accrued acquisition fees and expenses will have negative effects on
returns to investor the potential for future distributions, and
cash flows generated by us, unless earnings from operations or
net sales proceeds from the disposition of properties are generated
to cover the purchase price of the property.
(4) Under GAAP, rental receipts are allocated to periods using
various methodologies. This may result in income recognition
that is significantly different than underlying contract terms.
By adjusting for these items (to reflect such payments from a GAAP
accrual basis to a cash basis of disclosing the rent and lease
payments), MFFO provides useful supplemental information on the
realized economic impact of lease terms and debt investments,
providing insight on the contractual cash flows of such lease
terms and debt investments, and aligns results with management’s analysis of
operating performance.
|
 Reconciliation of Adjusted EBITDA to Net
Income (Loss)
17
Source: CNL Lifestyle Properties, Inc. March 31, 2014 Form 10-Q
The Company believes that its presentation of historical non-GAAP financial
measures provides useful supplementary information to and facilitates additional analysis by investors.
These historical non-GAAP financial measures are in addition to, not a
substitute for, or superior to, measures of financial performance prepared in accordance with U.S.
Generally Accepted Accounting Principles.
Past performance is not indicative of future returns.
2014
2013
Net loss
(20,353)
$
(23,299)
$
Loss from discontinued operations
1,608
1,642
Interest and other (income) expense
(2)
(327)
Interest expense and loan cost amortization
19,060
16,264
Equity in (earnings) loss of unconsolidated entities
(1)
(4,299)
1,123
Depreciation and amortization
31,934
28,758
Straight-line adjustments for leases and notes receivables
(2)
(3,426)
(486)
Cash distributions from unconsolidated entities
(1)
3,120
11,326
Adjusted EBITDA
27,642
$
35,001
$
Three Months Ended
March 31,
(1) Investments in our unconsolidated joint ventures are accounted for under the HLBV method of accounting. Under this method, we recognize income or loss based on
the change in liquidating proceeds we would receive from a
hypothetical liquidation of our investments based on depreciated book value. We adjust EBITDA for equity in earnings
(loss) of our unconsolidated entities because we believe this is not
reflective of the joint ventures’ operating performance or cash flows available for distributions to us. We believe
cash distributions from our unconsolidated entities, exclusive of any
financing transactions, are reflective of their operating performance and its impact to us and have been added
back to adjusted EBITDA above.
(2) We believe that adjusting for straight-line adjustments for
leased properties and mortgages and other notes receivable is appropriate because they are non-cash adjustments and
reflect the actual cash receipts received by us from our tenants and
borrowers. |