Attached files
| file | filename |
|---|---|
| 8-K - 8-K - AMERIANA BANCORP | d724359d8k.htm |
 AMERIANA BANCORP
ANNUAL MEETING
THURSDAY, MAY 15, 2014
|
CEO
PRESENTATION
: ASBI
Exhibit 99.1 |
 FORWARD-LOOKING
STATEMENT
This presentation contains forward-looking statements, which
include statements about Ameriana’s future financial
performance, business plans and strategies. They often include
words like “believe,”
“expect,”
“anticipate,”
“estimate,”
and
“intend”
or future or conditional verbs such as “will,”
“would,”
“should,”
“could”
or “may.”
Forward-looking statements involve
future risks and uncertainties because of factors that could
cause actual results to differ materially from those expressed or
implied. Specific risk factors and other uncertainties that could
affect the accuracy of forward-looking statements are included in
Ameriana’s Form 10-K for the year ended December 31, 2013.
Ameriana does not undertake any obligation to update forward-
looking statements made in this document. |
 AMERIANA BANCORP
ANNUAL FINANCIAL
PERFORMANCE
(IN THOUSANDS)
Year Ended
December 31,
2013
2012
Interest Income
$16,980
$18,032
Interest Expense
3,003
3,845
Net Interest Income
13,977
14,187
Provision for Loan Losses
755
1,145
Non-Interest Income
5,801
5,181
Non-Interest Expense
16,095
15,827
Income before Income Taxes
2,928
2,396
Income Tax Expense
741
556
Net Income
$ 2,187
$ 1,840 |
 AMERIANA BANCORP
QUARTERLY FINANCIAL
PERFORMANCE
(IN THOUSANDS)
Three Months
Ended March 31,
2014
2013
$
4,474
$ 4,291
758
762
3,716
3,529
150
255
1,364
1,512
3,917
3,960
1,013
826
284
212
$ 729
$
614
Interest Income
Interest Expense
Net Interest Income
Provision for Loan Losses
Non-Interest Income
Non-Interest Expense
Income before Income Taxes
Income Tax Expense
Net Income |
 AMERIANA BANK CAPITAL
(AS OF 3/31/14)
Bank
Peer*
Tier 1 Leverage Capital
9.38%
10.02%
Tier 1 RBC/Risk Wtd. Assets
14.13
14.75
Total RBC/Risk Wtd. Assets
15.38
15.94
Source: FDIC UBPR 3/31/2014
*Peer
group
defined
by
FDIC
for
Ameriana
is
“Peer
Group
3”
–
insured
commercial
banks having assets between $300 million and $1 billion
|
 KEY
METRICS (AS OF 3/31/14)
Bank
Peer*
Non-accrual Loans/Total Loans
1.63%
1.27%
NCL+ OREO/Lns. + OREO
3.26
2.21
Net Loss/Avg. Loans
0.05
0.13
ALLL/Total Loans
1.29
1.58
Current Rest. Loans/Total Loans
2.86
0.68
Source: FDIC UBPR 3/31/2014
*Peer
group
defined
by
FDIC
for
Ameriana
is
“Peer
Group
3”
–
insured
commercial
banks having assets between $300 million and $1 billion
|
 AMERIANA BANCORP
FINANCIAL PERFORMANCE
(FIRST QUARTER 2014)
Positive Factors:
*On a fully tax-equivalent basis
•
Net income of $729,000, or $0.24 per diluted share, for the
quarter was $115,000, or 18.7%, improvement over the first
quarter of 2013
•
Loan repurchase resulting in $173,000 of interest income
provided increase in net interest income
•
Net interest margin of 3.72%*, 1 bp lower than the same
quarter of 2013
•
Declared a quarterly dividend of $0.02 per share, which
represented a $0.01 per share increase |
 Source: FDIC
UBPR 3/31/2014 Source: FDIC UBPR 3/31/2014
*Peer
group
defined
by
FDIC
for
Ameriana
is
“Peer
Group
3”
–
insured
commercial banks having assets between $300 million and $1 billion
AMERIANA BANCORP
FINANCIAL PERFORMANCE
(FIRST QUARTER 2014)
Assets per employee is improving ($ per million)
o
$3.33 compared to $3.10 in the same quarter in 2013,
($3.23 at 12/31/2013 and $2.89 at 12/31/2012)
Yield on loans compares favorably to peer group* results
o
5.19% compared to average yield of 5.14% for the first
quarter of 2014
Positive Factors:
•
• |
 AMERIANA BANCORP
FINANCIAL PERFORMANCE
•
•
•
•
•
Funding costs are somewhat higher than peer
Assets per employee remains lower than peer (i.e. excess
capacity)
DDAs, although increasing, remain below high-performing
peer banks
Other non-personnel expenses are higher than peer
Personnel expense, due to number of offices, is higher than
peer
Negative Factors: |
 FINANCIAL PERFORMANCE
(FIRST QUARTER 2014)
Profitability: (% of Avg. Assets)
Bank
Peer*
Interest Expense
0.62%
0.44%
Other Operating Expense
0.86
0.90
Occupancy Expense
0.53
0.37
Personnel Expense
1.83
1.59
Total Overhead Expense
3.21
2.87
Efficiency Ratio
72.19
67.83
Assets Per Employee ($ in millions)
$3.33
$4.78
Average Personnel Expense
60.29
71.75
Source: FDIC UBPR 3/31/2014
banks having assets between $300 million and $1 billion
*Peer
group
defined
by
FDIC
for
Ameriana
is
“Peer
Group
3”
–
insured
commercial
Per Employee ($ in thousands) |
 FINANCIAL PERFORMANCE
(FIRST QUARTER 2014)
Profitability: (%)
Bank
Peer
Avg. Earning Assets/Avg. Assets
88.99%
93.97%
Avg. Int. Bearing Fds/Avg. Assets
83.53
76.92
Int. Income/Avg
. Earning Assets
4.37
4.19
NII/Average Earning Assets
3.68
3.71
Net Loans/Avg. Assets
66.89
63.22
Source: FDIC UBPR 3/31/2014
*Peer
group
defined
by
FDIC
for
Ameriana
is
“Peer
Group
3”
–
insured
commercial
banks having assets between $300 million and $1 billion
|
 FINANCIAL PERFORMANCE
(FIRST QUARTER 2014)
Profitability: (%)
Bank
Peer
AFS Securities/Avg. Assets
8.95%
19.81%
DDA/Avg. Assets
5.85
10.93
Core Deposits/Avg. Assets
76.92
77.77
FHLB/Avg. Assets
7.16
2.43
Source: FDIC UBPR
3/31/2014
*Peer
group
defined
by
FDIC
for
Ameriana
is
“Peer
Group
3”
–
insured commercial
banks having assets between $300 million and $1 billion
|
 TOTAL
LOANS (DOLLARS IN THOUSANDS)
$325,864
$326,573
$317,595
$317,087
$318,287
$316,959
$317,536
12/31/2008
12/31/2009
12/31/2010
12/31/2011
12/31/2012
12/31/2013
3/31/2014 |
 TOTAL
DEPOSITS (DOLLARS IN THOUSANDS)
$324,406
$338,381
$337,978
$337,250
$356,703
$362,701
$373,030
12/31/2008
12/31/2009
12/31/2010
12/31/2011
12/31/2012
12/31/2013
3/31/2014 |
 NET
INTEREST INCOME (DOLLARS IN THOUSANDS)
$11,793
$12,689
$13,411
$13,924
$14,187
$13,977
$3,716
2008
2009
2010
2011
2012
2013
1Q14 |
 NET
INTEREST MARGIN (ON A FULLY TAX-EQUIVALENT BASIS)
3.08%
3.08%
3.63%
3.73%
3.71%
3.63%
3.72%
2008
2009
2010
2011
2012
2013
1Q14 |
 NON-PERFORMING LOANS
(DOLLARS IN THOUSANDS)
$6,219
$9,053
$11,247
$8,828
$7,604
$5,058
$5,162
12/31/2008
12/31/2009
12/31/2010
12/31/2011
12/31/2012
12/31/2013
3/31/2014 |
 NON-ACCRUAL LOANS
(AS OF 3/31/2014)
($ in thousands)
Single-family residences –
Countrywide
originations (10 loans)
$ 2,078
Residential condominium development
1,515
Commercial
781
Commercial real estate
422
Sub-total
4,796
Single-family residences (6
loans)
331
Consumer (4 loans)
Total
$ 5,161
34 |
 NON-PERFORMING LOANS/TOTAL
LOANS
1.91%
2.78%
3.54%
2.79%
2.39%
1.60%
1.62%
12/31/2008
12/31/2009
12/31/2010
12/31/2011
12/31/2012
12/31/2013
3/31/2014 |
 OREO
(DOLLARS IN THOUSANDS)
$3,881
$5,517
$9,067
$7,545
$6,326
$5,172
$5,262
12/31/2008
12/31/2009
12/31/2010
12/31/2011
12/31/2012
12/31/2013
3/31/2014 |
 OTHER
REAL ESTATE OWNED (AS OF 3/31/2014)
($ in thousands)
Retail strip center (partially occupied) and two outlots
$ 2,451
Single
family
residence
–
rented
783
Developed commercial land
820
Undeveloped land and developed residential building lots
750
Undeveloped land
214
Developed commercial lot
113
Four single-family residences (unrelated)
131
Sub-total
Total
5,040
$ 5,262 |
 OREO/TOTAL LOANS
1.19%
1.69%
2.85%
2.38%
1.99%
1.63%
1.66%
12/31/2008
12/31/2009
12/31/2010
12/31/2011
12/31/2012
12/31/2013
3/31/2014 |
 NET
CHARGE-OFFS (DOLLARS IN THOUSANDS)
$936
$1,166
$1,726
$1,465
$1,038
$1,002
$42
2008
2009
2010
2011
2012
2013
1Q14
* |
 NET
CHARGE-OFFS/AVG. LOANS 0.30%
0.35%
0.54%
0.47%
0.33%
0.31%
0.01%
2008
2009
2010
2011
2012
2013
1Q14 |
 ALLOWANCE FOR LOAN LOSSES
(DOLLARS IN THOUSANDS)
$2,991
$4,005
$4,212
$4,132
$4,239
$3,993
$4,100
12/31/2008
12/31/2009
12/31/2010
12/31/2011
12/31/2012
12/31/2013
3/31/2014 |
 ALLOWANCE FOR LOAN
LOSSES/TOTAL LOANS
0.92%
1.23%
1.33%
1.30%
1.34%
1.26%
1.29%
12/31/2008
12/31/2009
12/31/2010
12/31/2011
12/31/2012
12/31/2013
3/31/2014 |
 TROUBLED DEBT
RESTRUCTURINGS (TDRS)
(DOLLARS IN THOUSANDS)
$0
$268
$8,393
$9,016
$12,171
$11,558
$11,998
12/31/2008
12/31/2009
12/31/2010
12/31/2011
12/31/2012
12/31/2013
3/31/2014 |
 TROUBLED DEBT
RESTRUCTURINGS
(TDRS
-
AS
OF
3/31/2013)
($ in thousands)
Hotel loan
$ 3,752
Pass
Undeveloped commercial land
1,464
Substandard
Residential condominium development
1,515
Non-accrual
Undeveloped land –
two parcels –
same borrower
984
Substandard
Developed commercial land
1,013
Pass
Subtotal
8,728
Single-family residence (4 loans)
424
Substandard
Single-family residence (10 loans)
1,179
Non-accrual
Single-family residence (2 loans)
91
Single-family
residence
–
Countrywide
originations
(2
loans)
382
923
Commercial (3 loans)
253
Commercial real estate
15
$11,998
Pass
Single-family
residence
–
Countrywide
origination
(3
loans)
Pass
Non-accrual
Non-accrual
Pass
Total |
 •
To be a relevant and robust
alternative to “banking as usual”
in central Indiana
•
To grow into new markets by
doing what it takes to become a
fully established, leading citizen
and business advocate in each
neighborhood we serve
•
To uphold and act on our core
values of being a true
community bank
OUR
VISION |
 To
engage every customer in a meaningful dialogue regarding their financial
needs and provide advice and financial solutions that
assist them in achieving their goals
OUR MISSION |
 Ethics:
Honesty, Integrity, Responsibility
Customers:
Service, Satisfaction, Relationships
Associates:
Talent, Teamwork, Personal Leadership
Community:
Service, Involvement, Leadership
Diversity:
Respect, Appreciation
OUR VALUES |
 AMERIANA BUSINESS
STRATEGY
•
Customer needs client strategy focused on building long-
term relationships
•
Disciplined, relationship-building culture along all
business units
•
Business units
o
Commercial
o
Consumer
o
Mortgage
o
Insurance
o
Financial Management
•
Primary focus is value creation through growth in
Indianapolis and legacy markets |
 AMERIANA COMMERCIAL
STRATEGY
•
C&I / Owner-Occupied CRE / Investment Real Estate
•
Focused on small business and middle market clients
•
Target loan size is $25,000 -
$5 million
•
Working capital lines, equipment financing, letters of credit,
term real estate and interest rate risk tools available
•
SBA Lending expertise
•
Experienced lending team, primarily focused on
Indianapolis market
•
Full suite of depository products, online money
management tools, merchant processing, insurance and
401(k) plan expertise |
 AMERIANA CONSUMER
LENDING STRATEGY
•
Consumer lending focused on residential mortgage,
home equity, auto and other closed-end loans
Mortgage originators located in key markets within our
footprint
Fully-automated Loan Origination System in compliance
with all current regulations
Online consumer application system
•
•
• |
 AMERIANA RETAIL CUSTOMER
STRATEGY
•
Relationship development focused on meeting financial
lifecycle needs and building products per household
•
On-The-Go Checking is key acquisition product
•
Focused on in-branch experience, as well as Electronic
Delivery Channels:
o
ATM access
o
Telephone Banking
o
Call Center
o
Online Banking
o
Mobile Banking –
check deposit, bill pay, alerts, etc.
o
e-Account Opening |
 GROWTH IN CUSTOMER
RELATIONSHIPS BANK-WIDE |
 GROWTH IN CROSS
SELL/MULTIPLE PRODUCTS
128% Increase |
 GROWTH IN DEPOSIT FEE
INCOME
(OTHER FEES AND SERVICE CHARGES)
44% Increase
$-
$500,000
$1,000,000
$1,500,000
$2,000,000
$2,500,000
$3,000,000
2007
2008
2009
2010
2011
2012
2013
Fee Income Trend 2007 -
2013
Fee Income |
 SHIFT
IN DEPOSIT MIX CDs
61%
Non-
Maturity
Deposits
39%
CDs
40%
Non-
Maturity
Deposits
60%
12/31/13
12/31/08 |
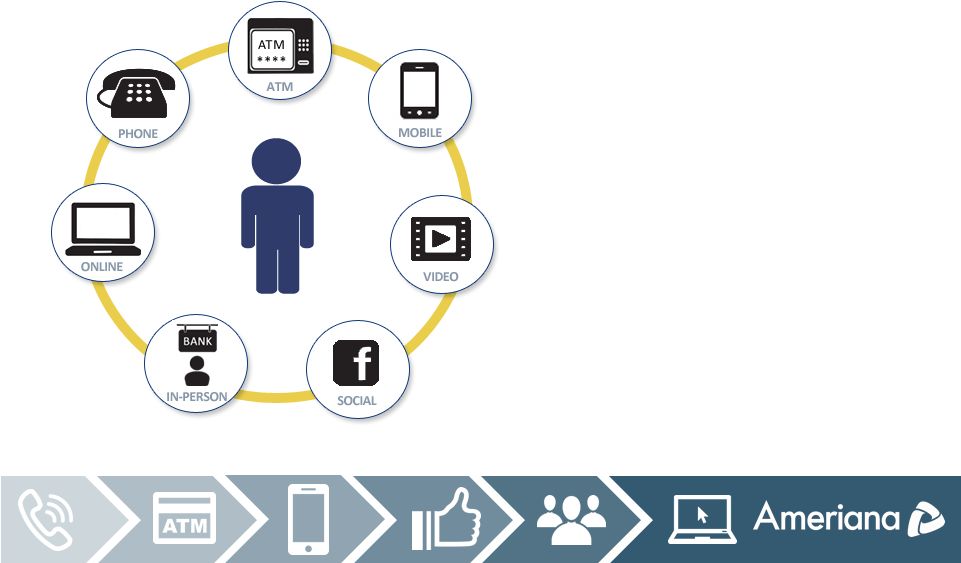 OMNI-CHANNEL INTEGRATION
•
The Connected Consumer
•
Simultaneous Channel
Usage
•
Experiential Brand
•
Knowledge-based Delivery |
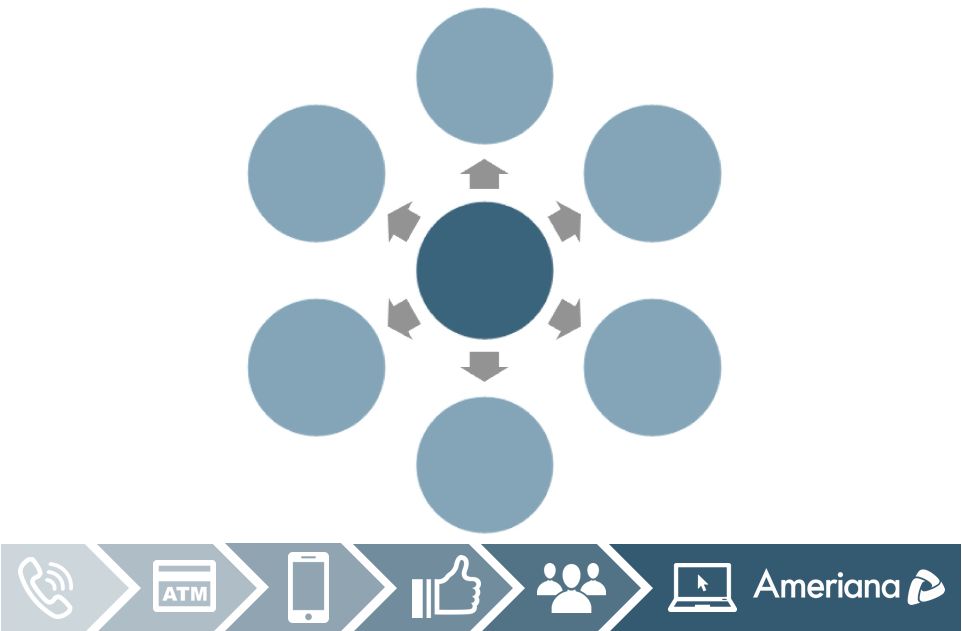
 SURROUND THE CUSTOMER
Employees
Online &
Mobile Banking
Customer Care
Facility
Environment
Word of Mouth
Advertising
Direct Mail /
Newsletters
Media
Policies
Community
Outreach
Investor
Relations
Monthly
Statement
Customer
Communication
Social Media
Sponsorships
& Events
Debit Card
Customer Brand Experience
Customer Brand Experience |
 NEW
PRODUCTS AND SERVICES
Mobile Banking App (iPhone, iPad, Android
smartphones)
o
Business Mobile App
Instant Issue Check Card
e-Account Opening
Online Loan Application
Health Savings Accounts (HSAs)
Check Deposit, Bill Pay, Alerts
•
•
•
•
•
• |
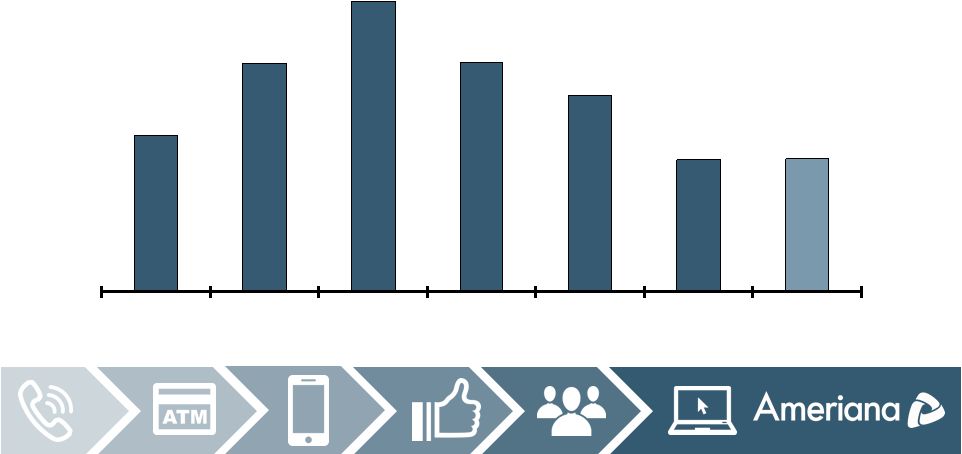
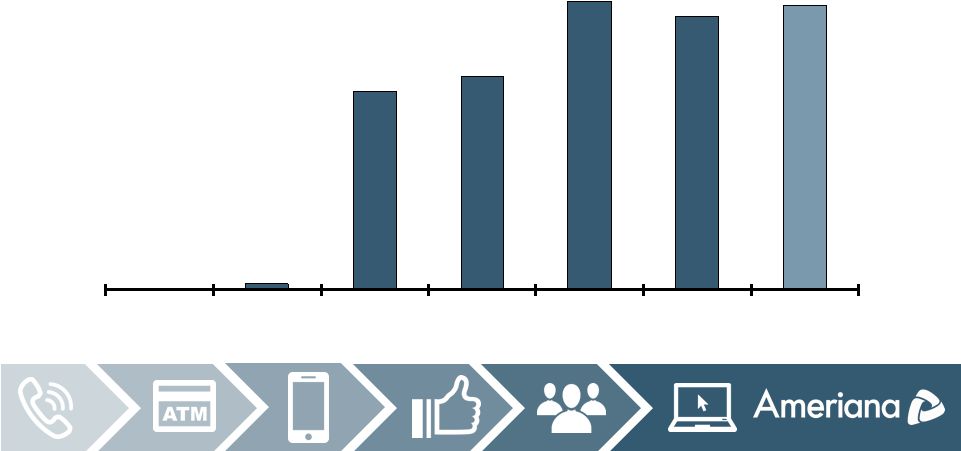
 CUSTOMER PREFERENCES
55% will buy
a service
that helps
them use
data to
improve their
lives
76% prefer
virtual
channels for
basic
banking
transactions
2.5 monthly
visits by
mobile
bankers
users
1/3 of mobile
users will
bank via
phone
65% prefer
branch for
advice and
personalized
attention
83% open to
new advisory
services,
including
financial
education.
Customer |
 HAMILTON COUNTY STORES |
 BROAD
RIPPLE DEVELOPMENT 59
& COLLEGE AVENUE
TH |
 BROAD
RIPPLE DEVELOPMENT 59
TH
&
COLLEGE
AVENUE |
 Other sites will be
evaluated in Marion County, such as Downtown, Mass Ave., etc.
BRANCH OPENING TIMELINE
2014
2015
2016
Noblesville
(Summer)
Allisonville
(Summer)
•
•
Broad
•
Plainfield
•
Ripple
(2Q) |
 REGULATORY AND
ENTERPRISE RISK
MANAGEMENT
•
Experienced ERM Team
o
Janelle
Gamble,
SVP
–
Chief
Risk
Officer
+
Compliance
and
CRA Officer
Gloria Corbin, BSA
Stephanie Cunningham, Compliance
Ron Holloway, Loan Review
Joan Kerulis and Debra Hay, Audit |
 COMMUNITY OUTREACH
Corporate Sponsorship of the Humane Society for Hamilton
County –
Ameriana Bank Foster Program
o
2013 Corporate Sponsor of the Year
Checking It Forward
o
$43,400 donated to 34 non-profit organizations in 2013
o
Approximately 868 accounts opened through the program
Help Our Heroes –
to benefit the USO of Indiana
o
Nearly $600 in monetary donations, more than 60 boxes of items
Marketplace at Westfield
230.5 hours of volunteering by non-exempt associates
Numerous other community-focused events and countless
volunteer hours from exempt associates
•
•
•
•
•
• |
 2014
EARNINGS TARGETS BANK
$2,850,000
BANCORP
$2,286,000 |
 STOCK
PERFORMANCE Source: SNL Financial
Change %
As of 5/7/2014
YTD
1 Year
3 Years
SNL Bank & Thrift
(3.46)
16.50
34.26
SNL Bank < $500mm
7.29
21.65
43.87
KBW Bank
(3.08)
16.38
32.33
NASDAQ Bank
(5.68)
18.32
36.84
SNL Micro Cap
2.99
16.91
49.76
ASBI
5.66
50.54
181.63 |
 AMERIANA FRANCHISE
HIGHLIGHTS
Focused on maintaining and improving shareholder
value
Improved operating fundamentals
o
Growth strategies focused on building relationships,
growing deposits and fee revenue
Investments in Indianapolis area are producing results
Well-capitalized with ability to support further organic
growth
Able to effectively manage to increased regulatory
requirements
19 quarters of profitability through first quarter of 2014
•
•
•
•
•
• |
 QUESTIONS? |