Attached files
| file | filename |
|---|---|
| 8-K - 8-K - 1ST SOURCE CORP | srce-8kx51314.htm |

Investor Presentation

Except for historical information, the matters discussed may include “forward-looking statements.” Generally, words such as “believe,” “possible,” “expect,” “intend,” “estimate,” “anticipate,” “project,” “will,” “contemplate,” “seek,” “plan,” “assume,” “targeted,” “continue,” “remain,” “should,” “indicate,” “would,” “may” indicate forward-looking statements. Those statements are subject to material risks and uncertainties. 1st Source cautions readers not to place undue reliance on any forward-looking statements, which speak only as of the date made. 1st Source may make other written or oral forward-looking statements from time to time. The audience is advised that various important factors could cause 1st Source’s actual results or circumstances for future periods to differ materially from those anticipated or projected in such forward-looking statements. Such factors, among others, include changes in laws, regulations or accounting principles generally accepted in the United States; 1st Source’s competitive position within its markets served; increasing consolidation within the banking industry; unforeseen changes in interest rates; unforeseen downturns in the local, regional or national economies or in the industries in which 1st Source has credit concentrations; and other risks discussed in 1st Source’s filings with the Securities and Exchange Commission, including its Annual Report on Form 10-K, which filings are available from the SEC. 1st Source undertakes no obligation to publicly update or revise any forward- looking statements. Forward-looking Statement Disclosure 2
This presentation contains financial information determined by methods other than those prescribed by accounting principles generally accepted in the United States ("GAAP'). Management uses these "non-GAAP" financial measures in its analysis of the Company's capital and performance. Management believes that the ratio of tangible common shareholders’ equity to tangible assets is important to investors who are interested in evaluating the adequacy of the Company's capital levels. Management believes that pre-tax, pre-provision earnings is important to investors as it shows earnings trends without giving effect to provision for credit losses. You should not view these disclosures as a substitute for results determined in accordance with GAAP, and they are not necessarily comparable to non-GAAP measures used by other companies. The limitations associated with these measures are the risks that persons might disagree as to the appropriateness of items comprising these measures and that different companies might calculate these measures differently. Non-GAAP Financial Disclaimer 3
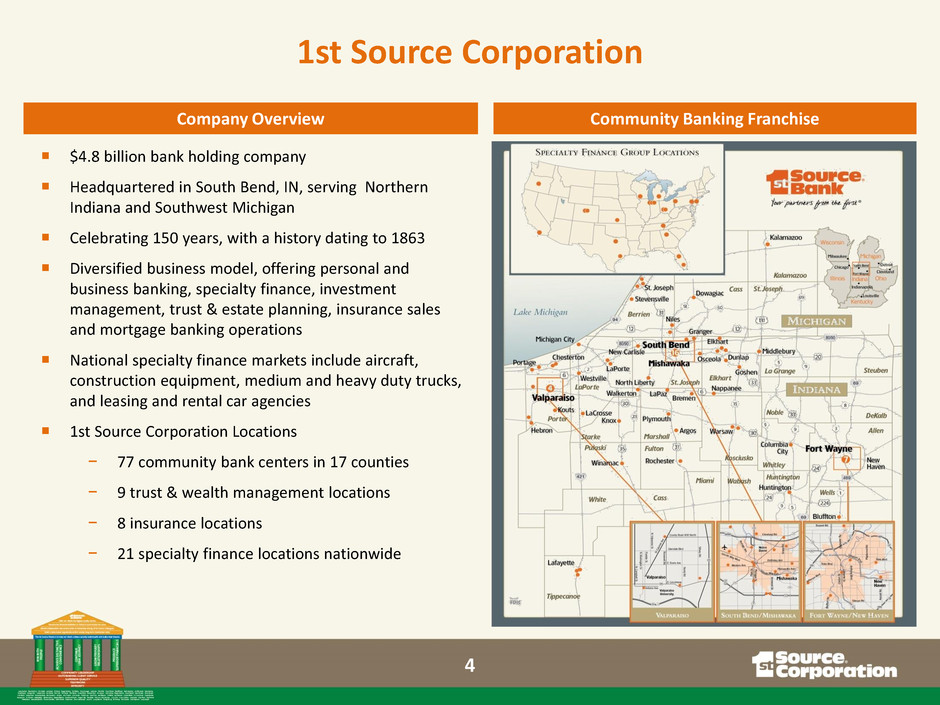
$4.8 billion bank holding company Headquartered in South Bend, IN, serving Northern Indiana and Southwest Michigan Celebrating 150 years, with a history dating to 1863 Diversified business model, offering personal and business banking, specialty finance, investment management, trust & estate planning, insurance sales and mortgage banking operations National specialty finance markets include aircraft, construction equipment, medium and heavy duty trucks, and leasing and rental car agencies 1st Source Corporation Locations − 77 community bank centers in 17 counties − 9 trust & wealth management locations − 8 insurance locations − 21 specialty finance locations nationwide 1st Source Corporation Company Overview Community Banking Franchise 4
1st Source Corporation 5

Christopher J. Murphy III Chairman of the Board President and Chief Executive Officer (elected to Board of Directors in 1972) Seasoned Leadership Team SRCE Experience Years Experience Position Name President, 1st Source Bank Executive VP – Wealth Management, Private Banking, Insurance and Information Technology President and Chief Operating Officer, Specialty Finance Group, 1st Source Bank Chief Financial Officer and Treasurer 38 41 Chief Credit Officer 34 39 27 37 18 46 15 30 12 23 Executive VP, Secretary and General Counsel 13 31 James R. Seitz Allen R. Qualey Steven J. Wessell John B. Griffith Andrea G. Short Jeffrey L. Buhr 6
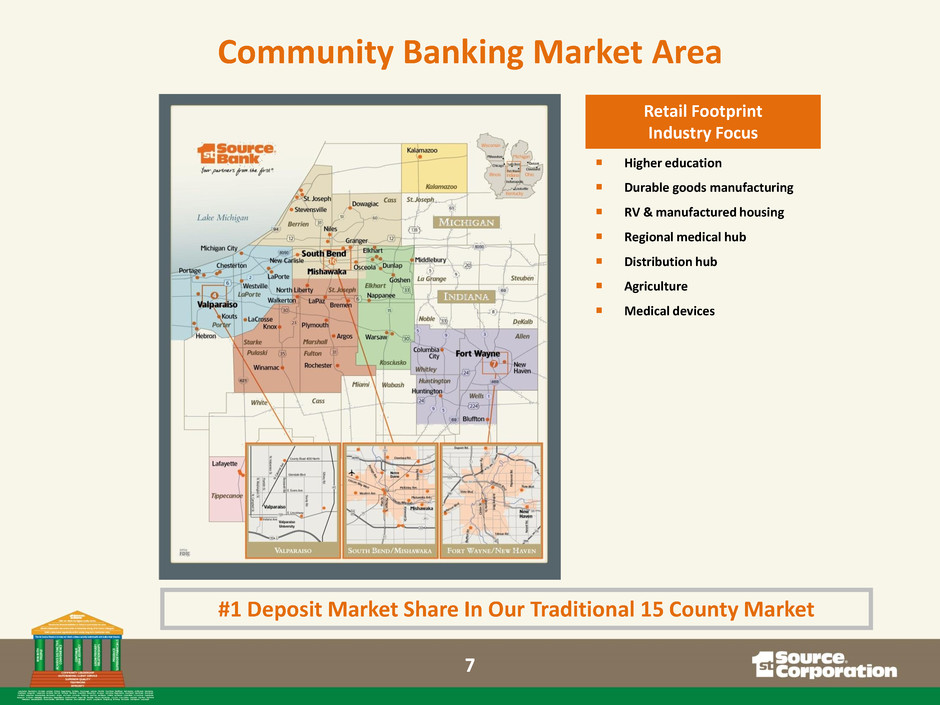
Retail Footprint Industry Focus Higher education Durable goods manufacturing RV & manufactured housing Regional medical hub Distribution hub Agriculture Medical devices #1 Deposit Market Share In Our Traditional 15 County Market Community Banking Market Area 7
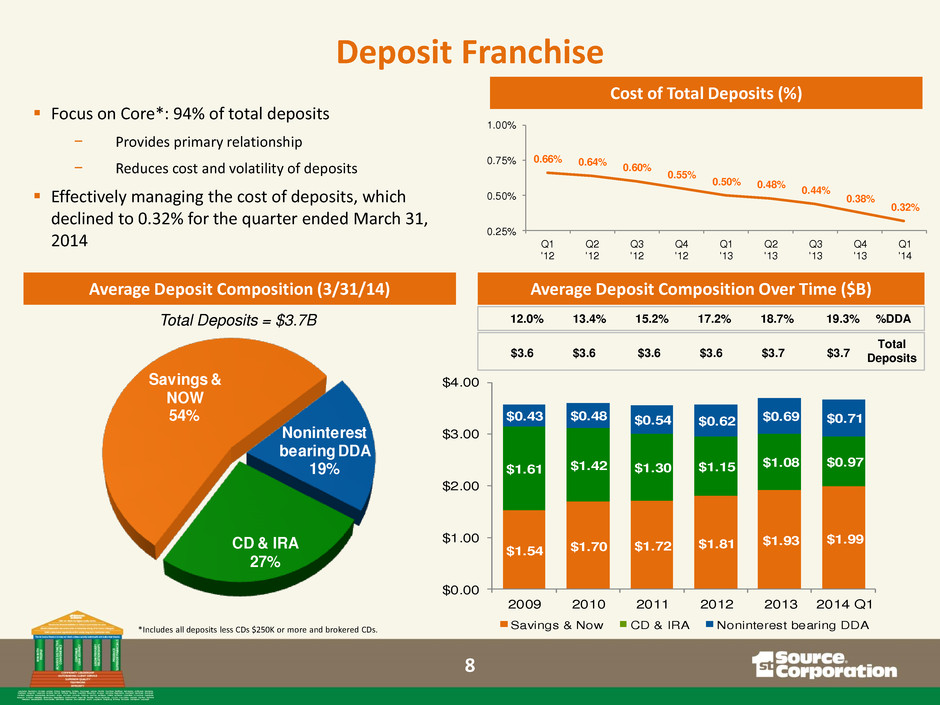
12.0% 13.4% 15.2% 17.2% 18.7% 19.3% %DDA Noninterest bearing DDA 19% CD & IRA 27% Savings & NOW 54% $ .54 $1.70 $1.72 $1.81 $1.93 $1.99 $1.61 $1.42 $1.30 $1.15 $1.08 $0.97 $0.43 $0.48 $0.54 $0.62 $0.69 $0.71 $0.00 $1.00 $2.00 $3.00 $4.00 2009 2010 2011 2012 2013 2014 Q1 Savings & Now CD & IRA Noninterest bearing DDA Focus on Core*: 94% of total deposits − Provides primary relationship − Reduces cost and volatility of deposits Effectively managing the cost of deposits, which declined to 0.32% for the quarter ended March 31, 2014 0.66% 0.64% 0.60% 0.55% 0.50% 0.48% 0.44% 0.38% 0.32% 0.25% 0.50% 0.75% 1.00% Q1 '12 Q2 '12 Q3 '12 Q4 '12 Q1 '13 Q2 '13 Q3 '13 Q4 '13 Q1 '14 $3.6 $3.6 $3.6 $3.6 $3.7 $3.7 Total Deposits Cost of Total Deposits (%) Average Deposit Composition Over Time ($B) Average Deposit Composition (3/31/14) Total Deposits = $3.7B Deposit Franchise 8 *Includes all deposits less CDs $250K or more and brokered CDs.
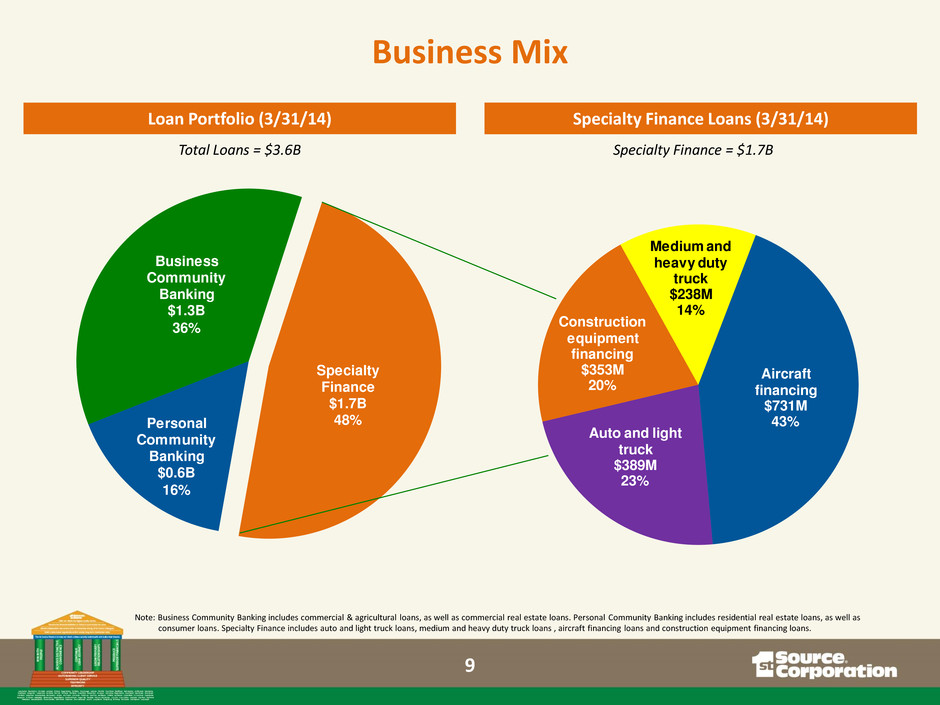
Aircraft financing $731M 43% Auto and light truck $389M 23% Construction equipment financing $353M 20% Medium and heavy duty truck $238M 14% Specialty Finance $1.7B 48%Personal Community Banking $0.6B 16% Business Community Banking $1.3B 36% Loan Portfolio (3/31/14) Specialty Finance Loans (3/31/14) Total Loans = $3.6B Specialty Finance = $1.7B Business Mix Note: Business Community Banking includes commercial & agricultural loans, as well as commercial real estate loans. Personal Community Banking includes residential real estate loans, as well as consumer loans. Specialty Finance includes auto and light truck loans, medium and heavy duty truck loans , aircraft financing loans and construction equipment financing loans. 9

Aircraft Financing ($731M) − Aircraft financing consists of financings for new and used general aviation aircraft (including helicopters) for private and corporate aircraft users, aircraft distributors and dealers, air charter operators, air cargo carriers, and other aircraft operators Auto and Light Truck Division ($389M) − Auto/light truck rental consists of financings to automobile rental and leasing companies, light truck rental and leasing companies, and special purpose vehicles Construction Equipment Financing ($353M) − Construction equipment financing includes financing of equipment (i.e., asphalt and concrete plants, bulldozers, excavators, cranes, and loaders, etc.) to the construction industry Medium and Heavy Duty Truck Division ($238M) − The medium and heavy duty truck division provides financing for highway tractors and trailers and delivery trucks to the commercial trucking industry and trash and recycling equipment for municipalities and private businesses as well as equipment for landfills Specialty Finance Group Services Note: Figures above refer to outstanding loans as of March 31, 2014. 10
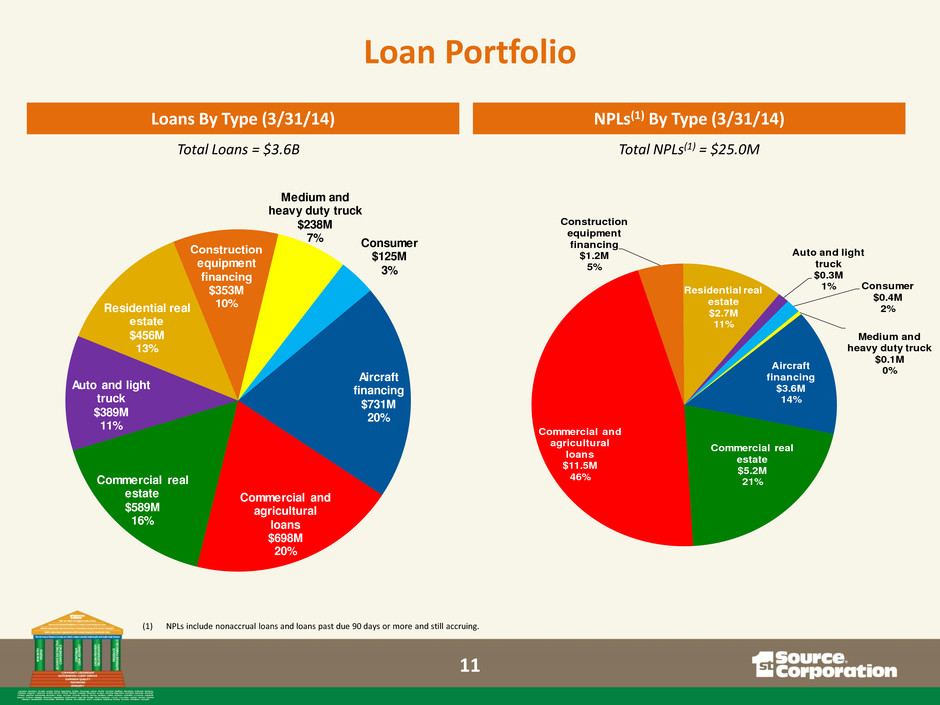
Aircraft financing $731M 20% Commercial and agricultural loans $698M 20% Commercial real estate $589M 16% Auto and light truck $389M 11% Residential real estate $456M 13% Construction equipment financing $353M 10% Medium and heavy duty truck $238M 7% Consumer $125M 3% Aircraft financing $3.6M 14% Commercial real estate $5.2M 21% Commercial and agricultural loans $11.5M 46% Construction equipment financing $1.2M 5% Residential real estate $2.7M 11% Auto and light truck $0.3M 1% Consumer $0.4M 2% Medium and heavy duty truck $0.1M 0% Loans By Type (3/31/14) NPLs(1) By Type (3/31/14) Total Loans = $3.6B Total NPLs(1) = $25.0M Loan Portfolio (1) NPLs include nonaccrual loans and loans past due 90 days or more and still accruing. 11
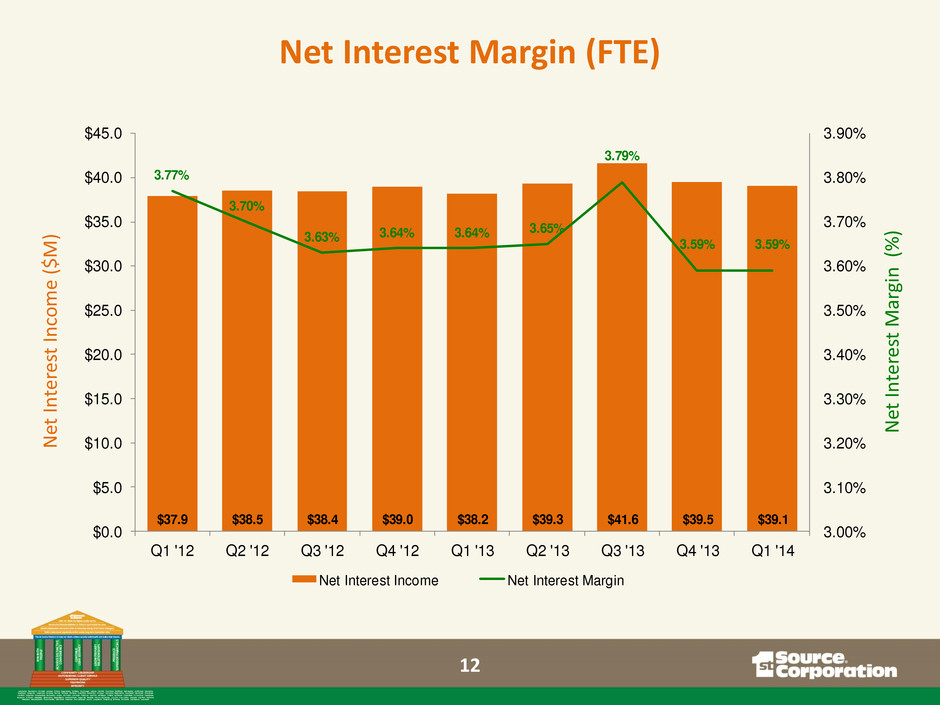
$37.9 $38.5 $38.4 $39.0 $38.2 $39.3 $41.6 $39.5 $39.1 3.77% 3.70% 3.63% 3.64% 3.64% 3.65% 3.79% 3.59% 3.59% 3.00% 3.10% 3.20% 3.30% 3.40% 3.50% 3.60% 3.70% 3.80% 3.90% $0.0 $5.0 $10.0 $15.0 $20.0 $25.0 $30.0 $35.0 $40.0 $45.0 Q1 '12 Q2 '12 Q3 '12 Q4 '12 Q1 '13 Q2 '13 Q3 '13 Q4 '13 Q1 '14 Net Interest Income Net Interest Margin N et In te re st In com e ($ M ) N et In te re st M ar gi n ( % ) Net Interest Margin (FTE) 12
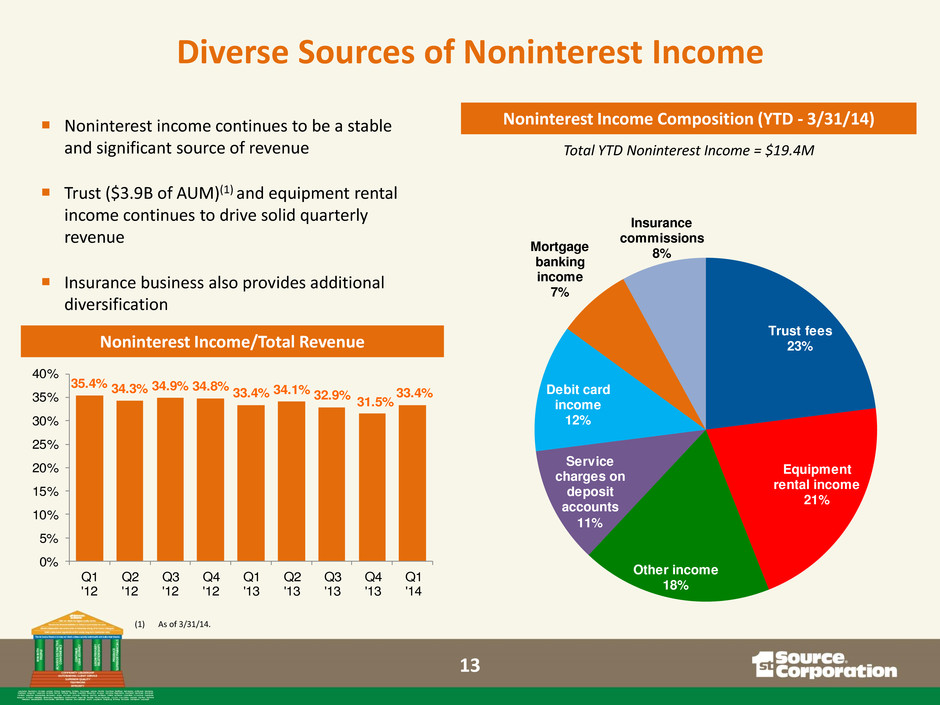
Trust fees 23% Equipment rental income 21% Other income 18% Service charges on deposit accounts 11% Debit card income 12% Mortgage banking income 7% Insurance commissions 8% Noninterest income continues to be a stable and significant source of revenue Trust ($3.9B of AUM)(1) and equipment rental income continues to drive solid quarterly revenue Insurance business also provides additional diversification 35.4% 34.3% 34.9% 34.8% 33.4% 34.1% 32.9% 31.5% 33.4% 0% 5% 10% 15% 20% 25% 30% 35% 40% Q1 '12 Q2 '12 Q3 '12 Q4 '12 Q1 '13 Q2 '13 Q3 '13 Q4 '13 Q1 '14 Noninterest Income/Total Revenue Noninterest Income Composition (YTD - 3/31/14) Total YTD Noninterest Income = $19.4M Diverse Sources of Noninterest Income (1) As of 3/31/14. 13
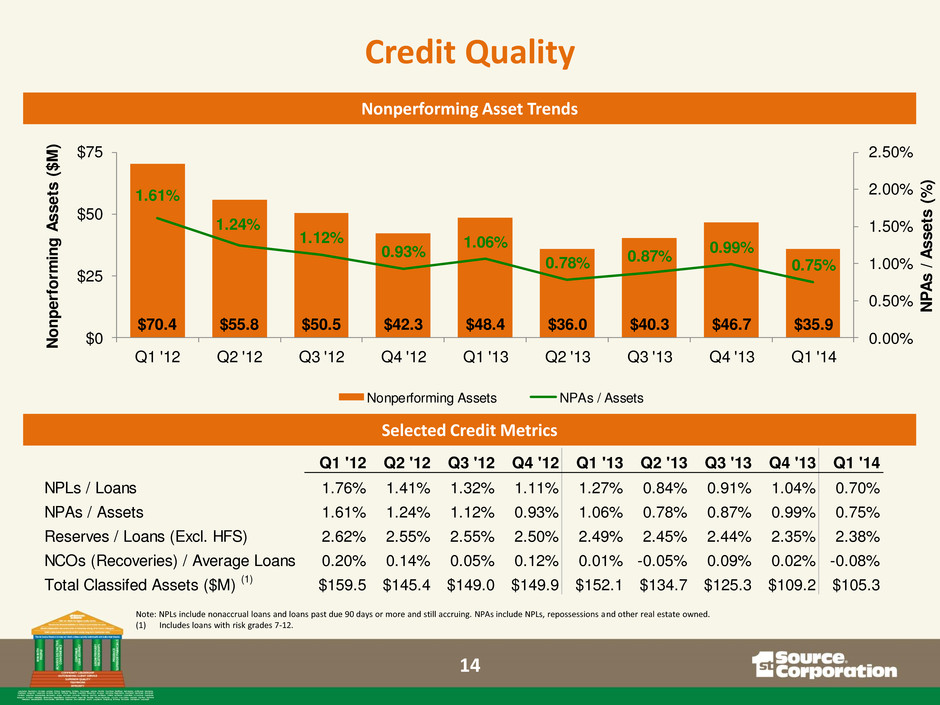
$70.4 $55.8 $50.5 $42.3 $48.4 $36.0 $40.3 $46.7 $35.9 1.61% 1.24% 1.12% 0.93% 1.06% 0.78% 0.87% 0.99% 0.75% 0.00% 0.50% 1.00% 1.50% 2.00% 2.50% $0 $25 $50 $75 Q1 '12 Q2 '12 Q3 '12 Q4 '12 Q1 '13 Q2 '13 Q3 '13 Q4 '13 Q1 '14 NPA s / A sse ts ( %) Non per form ing Ass ets ($M ) Nonperforming Assets NPAs / Assets Nonperforming Asset Trends Selected Credit Metrics Credit Quality Q1 '12 Q2 '12 Q3 '12 Q4 '12 Q1 '13 Q2 '13 Q3 '13 Q4 '13 Q1 '14 NPLs / Loans 1.76% 1.41% 1.32% 1.11% 1.27% 0.84% 0.91% 1.04% 0.70% NPAs / Assets 1.61% 1.24% 1.12% 0.93% 1.06% 0.78% 0.87% 0.99% 0.75% Reserves / Loans (Excl. HFS) 2.62% 2.55% 2.55% 2.50% 2.49% 2.45% 2.44% 2.35% 2.38% NCOs (Recoveries) / Average Loans 0.20% 0.14% 0.05% 0.12% 0.01% -0.05% 0.09% 0.02% -0.08% Total Classifed Assets ($M) (1) $159.5 $145.4 $149.0 $149.9 $152.1 $134.7 $125.3 $109.2 $105.3 Note: NPLs include nonaccrual loans and loans past due 90 days or more and still accruing. NPAs include NPLs, repossessions and other real estate owned. (1) Includes loans with risk grades 7-12. 14
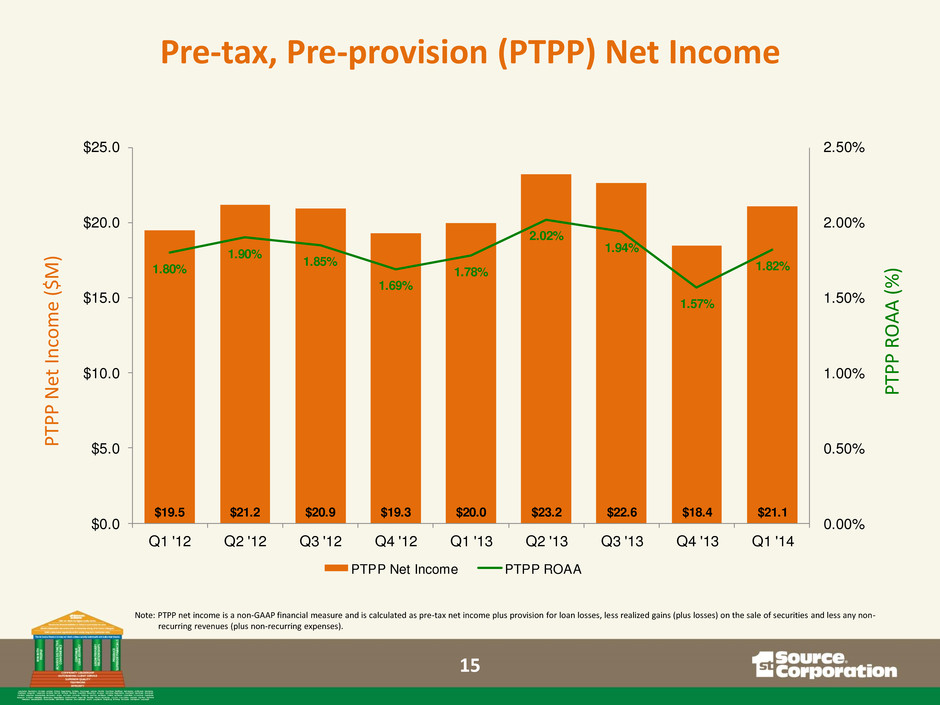
$19.5 $21.2 $20.9 $19.3 $20.0 $23.2 $22.6 $18.4 $21.1 1.80% 1.90% 1.85% 1.69% 1.78% 2.02% 1.94% 1.57% 1.82% 0.00% 0.50% 1.00% 1.50% 2.00% 2.50% $0.0 $5.0 $10.0 $15.0 $20.0 $25.0 Q1 '12 Q2 '12 Q3 '12 Q4 '12 Q1 '13 Q2 '13 Q3 '13 Q4 '13 Q1 '14 PTPP Net Income PTPP ROAA P TP P N et In com e ($ M ) P TP P R O AA (% ) Pre-tax, Pre-provision (PTPP) Net Income Note: PTPP net income is a non-GAAP financial measure and is calculated as pre-tax net income plus provision for loan losses, less realized gains (plus losses) on the sale of securities and less any non- recurring revenues (plus non-recurring expenses). 15
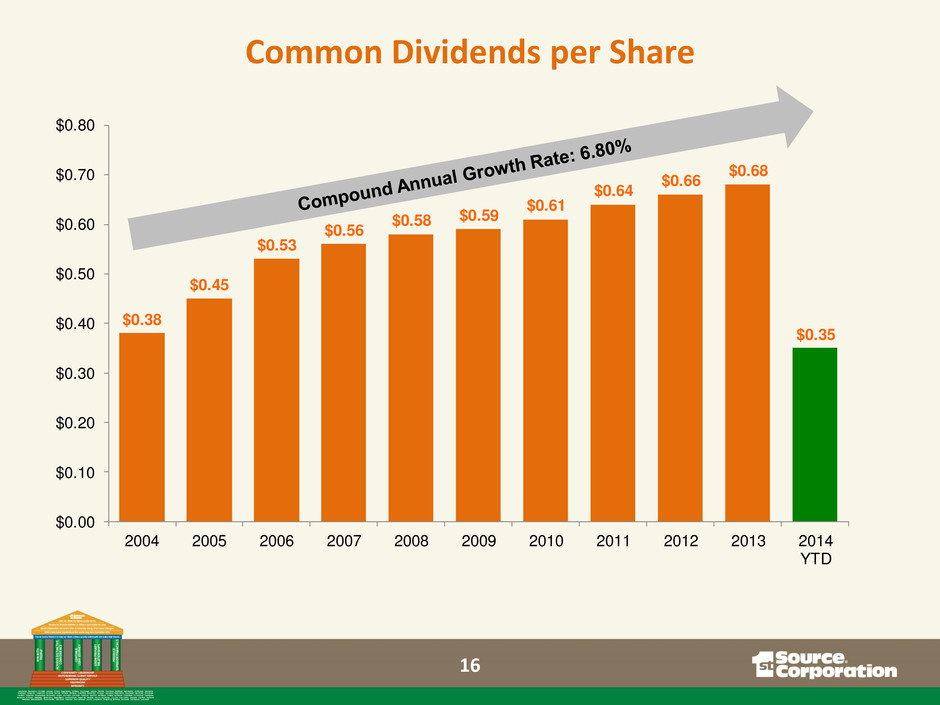
$0.38 $0.45 $0.53 $0.56 $0.58 $0.59 $0.61 $0.64 $0.66 $0.68 $0.35 $0.00 $0.10 $0.20 $0.30 $0.40 $0.50 $0.60 $0.70 $0.80 2004 2005 2006 2007 2008 2009 2010 2011 2012 2013 2014 YTD Common Dividends per Share 16
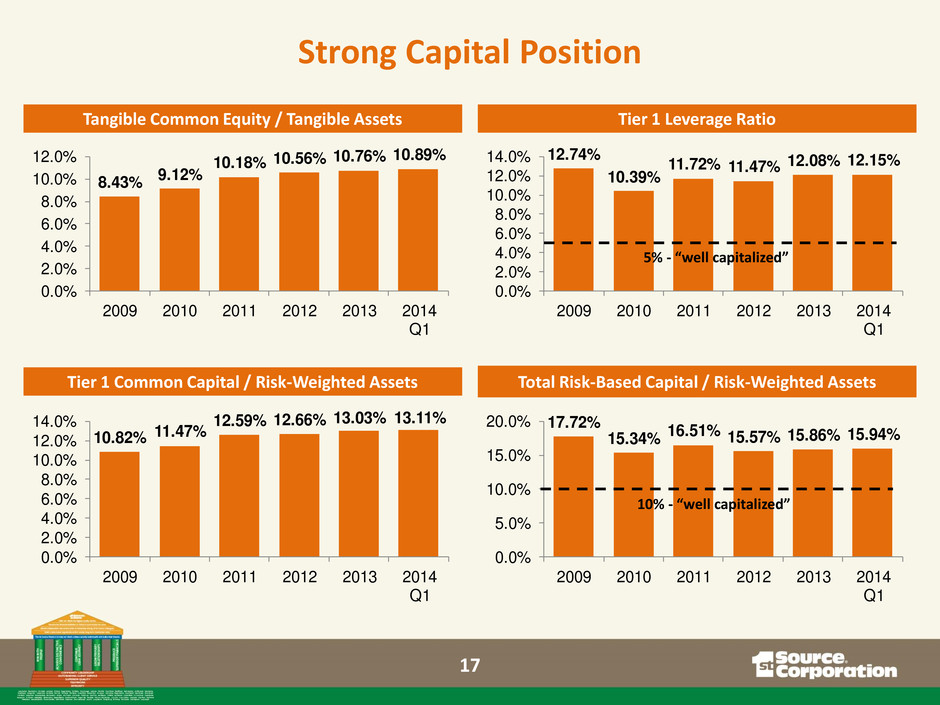
8.43% 9.12% 10.18% 10.56% 10.76% 10.89% 0.0% 2.0% 4.0% 6.0% 8.0% 10.0% 12.0% 2009 2010 2011 2012 2013 2014 Q1 12.74% 10.39% 11.72% 11.47% 12.08% 12.15% 0.0% 2.0% 4.0% 6.0% 8.0% 10.0% 12.0% 14.0% 2009 2010 2011 201 2013 2014 Q1 10.82% 11.47% 12.59% 12.66% 13.03% 13.11% 0.0% 2.0% 4.0% 6.0% 8.0% 10.0% 12 14. 2009 2010 2011 2012 2013 2014 Q1 17.72% 15.34% 16.51% 15.57% 15.86% 15.94% 0.0% 5.0% 10.0% 15.0% 20 2009 2010 2011 201 2013 2014 Q1 Tangible Common Equity / Tangible Assets Tier 1 Common Capital / Risk-Weighted Assets Total Risk-Based Capital / Risk-Weighted Assets Tier 1 Leverage Ratio 5% - “well capitalized” 10% - “well capitalized” Strong Capital Position 17
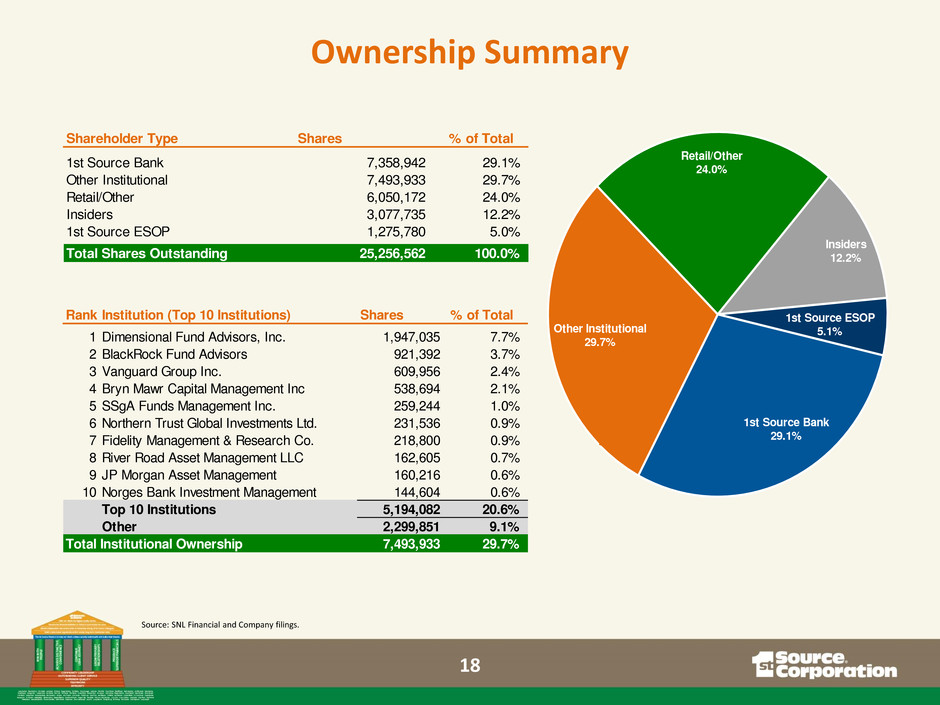
Ownership Summary Source: SNL Financial and Company filings. Rank Institution (Top 10 Institutions) Shares % of Total 1 Dimensional Fund Advisors, Inc. 1,947,035 7.7% 2 BlackRock Fund Advisors 921,392 3.7% 3 Vanguard Group Inc. 609,956 2.4% 4 Bryn Mawr Capital Management Inc 538,694 2.1% 5 SSgA Funds Management Inc. 259,244 1.0% 6 Northern Trust Global Investments Ltd. 231,536 0.9% 7 Fidelity Management & Research Co. 218,800 0.9% 8 River Road Asset Management LLC 162,605 0.7% 9 JP Morgan Asset Management 160,216 0.6% 10 Norges Bank Investment Management 144,604 0.6% Top 10 Institutions 5,194,082 20.6% Other 2,299,851 9.1% Total Institutional Ownership 7,493,933 29.7% Shareholder Type Shares % of Total 1st Source Bank 7,358,942 29. % Other Institutional 7,493,933 29.7% Retail/Other 6,050,172 24. % Insiders 3,077,735 12.2% 1st Sourc ESOP 1,275,780 5. % Total Shares Outstanding 25,256,5 100. % 1st Source Bank 29.1% Other Institutional 29.7% Retail/Other 24.0% Insiders 12.2% 1st Source ESOP 5.1% 18
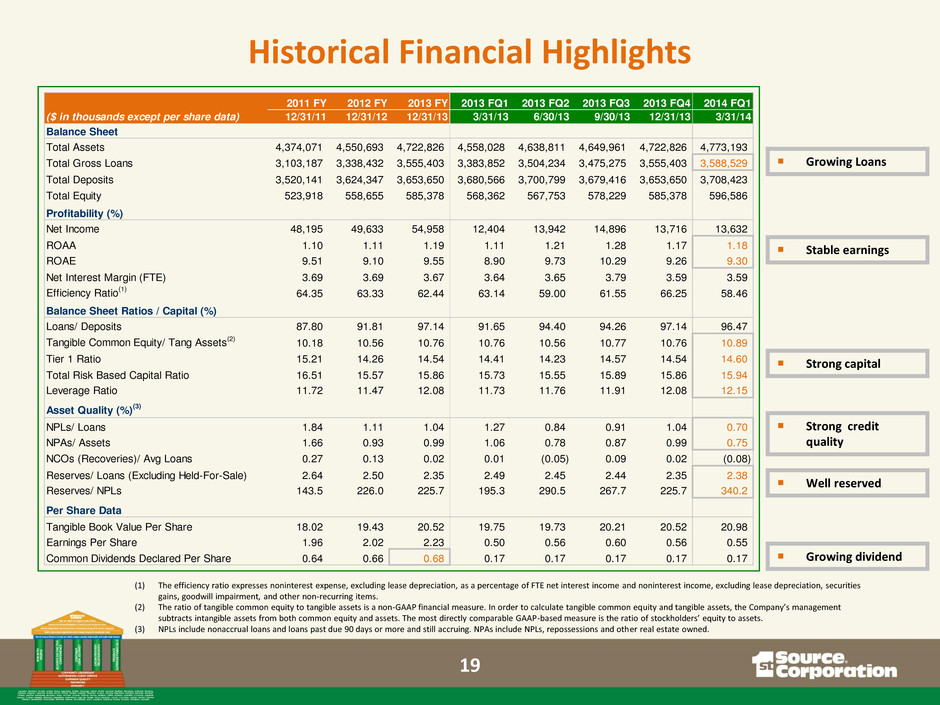
Growing Loans Stable earnings Strong capital Well reserved Growing dividend Historical Financial Highlights 2011 FY 2012 FY 2013 FY 2013 FQ1 2013 FQ2 2013 FQ3 2013 FQ4 2014 FQ1 ($ in thousands except per share data) 12/31/11 12/31/12 12/31/13 3/31/13 6/30/13 9/30/13 12/31/13 3/31/14 Balance Sheet Total Assets 4,374,071 4,550,693 4,722,826 4,558,028 4,638,811 4,649,961 4,722,826 4,773,193 Total Gross Loans 3,103,187 3,338,432 3,555,403 3,383,852 3,504,234 3,475,275 3,555,403 3,588,529 Total Deposits 3,520,141 3,624,347 3,653,650 3,680,566 3,700,799 3,679,416 3,653,650 3,708,423 Total Equity 523,918 558,655 585,378 568,362 567,753 578,229 585,378 596,586 Profitability (%) Net Income 48,195 49,633 54,958 12,404 13,942 14,896 13,716 13,632 ROAA 1.10 1.11 1.19 1.11 1.21 1.28 1.17 1.18 ROAE 9.51 9.10 9.55 8.90 9.73 10.29 9.26 9.30 Net Interest Margin (FTE) 3.69 3.69 3.67 3.64 3.65 3.79 3.59 3.59 Efficiency Ratio (1) 64.35 63.33 62.44 63.14 59.00 61.55 66.25 58.46 Balance Sheet Ratios / Capital (%) Loans/ Deposits 87.80 91.81 97.14 91.65 94.40 94.26 97.14 96.47 Tangible Common Equity/ Tang Assets (2) 10.18 10.56 10.76 10.76 10.56 10.77 10.76 10.89 Tier 1 Ratio 15.21 14.26 14.54 14.41 14.23 14.57 14.54 14.60 Total Risk Based Capital Ratio 16.51 15.57 15.86 15.73 15.55 15.89 15.86 15.94 Leverage Ratio 11.72 11.47 12.08 11.73 11.76 11.91 12.08 12.15 Asset Quality (%) (3) NPLs/ Loans 1.84 1.11 1.04 1.27 0.84 0.91 1.04 0.70 NPAs/ Assets 1.66 0.93 0.99 1.06 0.78 0.87 0.99 0.75 NCOs (Recoveries)/ Avg Loans 0.27 0.13 0.02 0.01 (0.05) 0.09 0.02 (0.08) Reserves/ Loans (Excluding Held-For-Sale) 2.64 2.50 2.35 2.49 2.45 2.44 2.35 2.38 Reserves/ NPLs 143.5 226.0 225.7 195.3 290.5 267.7 225.7 340.2 Per Share Data Tangible Book Value Per Share 18.02 19.43 20.52 19.75 19.73 20.21 20.52 20.98 Earnings Per Share 1.96 2.02 2.23 0.50 0.56 0.60 0.56 0.55 Common Dividends Declared Per Share 0.64 0.66 0.68 0.17 0.17 0.17 0.17 0.17 (1) The efficiency ratio expresses noninterest expense, excluding lease depreciation, as a percentage of FTE net interest income and noninterest income, excluding lease depreciation, securities gains, goodwill impairment, and other non-recurring items. (2) The ratio of tangible common equity to tangible assets is a non-GAAP financial measure. In order to calculate tangible common equity and tangible assets, the Company’s management subtracts intangible assets from both common equity and assets. The most directly comparable GAAP-based measure is the ratio of stockholders’ equity to assets. (3) NPLs include nonaccrual loans and loans past due 90 days or more and still accruing. NPAs include NPLs, repossessions and other real estate owned. Strong credit quality 19
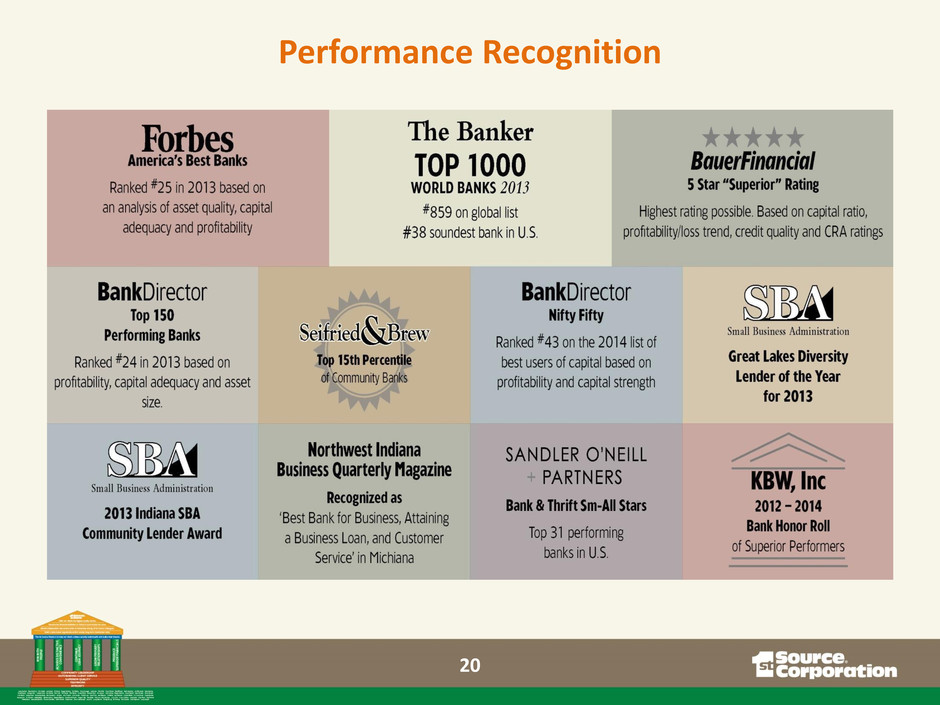
Performance Recognition 20
Consistent and superior financial performance Comprehensive portfolio of products drives loan and revenue growth Diversification of product mix and geography with asset generation capability Leading market share in community banking markets Stable credit quality, strongly reserved Seasoned executive management team Strong capital position provides opportunity for increased shareholder return Investment Considerations 21
