Attached files
| file | filename |
|---|---|
| 8-K - FORM 8-K - Xylem Inc. | d726800d8k.htm |
 XYLEM
INC. INVESTOR PRESENTATION
OPPENHEIMER
9
TH
ANNUAL
INDUSTRIAL
GROWTH
CONFERENCE
Exhibit 99.1 |
 XYLEM PROPRIETARY / CONFIDENTIAL
FORWARD-LOOKING STATEMENTS
2
This document contains information that may constitute “forward-looking
statements.” Forward-looking statements by their nature address matters that
are, to different degrees, uncertain. Generally, the words “anticipate,” “estimate,” “expect,”
“project,” “intend,” “plan,” “believe,”
“target” and similar expressions identify forward-looking statements, which generally
are not historical in nature. However, the absence of these words or similar expressions does
not mean that a statement is not forward-looking.
These forward-looking statements include, but are not limited to, statements about the
separation of Xylem Inc. (the “Company”) from ITT Corporation in 2011,
capitalization of the Company, future strategic plans and other statements that describe
the Company’s business strategy, outlook, objectives, plans, intentions or goals, and any discussion of future
operating or financial performance. All statements that address operating performance, events or
developments that we expect or anticipate will occur in the future — including
statements relating to orders, revenues, operating margins and earnings per share growth,
and statements expressing general views about future operating results — are forward-looking
statements.
Caution should be taken not to place undue reliance on any such forward-looking statements
because they involve risks, uncertainties and other factors that could cause actual
results to differ materially from those expressed or implied in, or reasonably inferred
from, such statements. The Company undertakes no obligation to publicly update or revise any forward-
looking statements, whether as a result of new information, future events or otherwise, except
as required by law. In addition, forward-looking statements are subject to certain
risks and uncertainties that could cause actual results to differ materially from the
Company’s historical experience and our present expectations or projections. These risks and uncertainties include,
but are not limited to, those set forth in Item 1A of our Annual Report on Form 10-K, and
those described from time to time in subsequent reports filed with the Securities and
Exchange Commission. |
 INVESTMENT HIGHLIGHTS |
 XYLEM PROPRIETARY / CONFIDENTIAL
4
•
Focused Pure Water Play
•
Leading Market Positions
•
Fortress Brands & World Class
Distribution
•
Diverse Geographic & End
Market Exposure
•
Large Installed Base Drives
Recurring Revenue
•
Strong Financial Position &
Cash Flow Generation
$3.8B
WHY SHOULD YOU INVEST IN XYLEM?
STRONG FOUNDATION & FUNDAMENTALS WITH OPPORTUNITY TO OUTPERFORM
|
 XYLEM PROPRIETARY / CONFIDENTIAL
SPECIALIZED BREADTH IN THE WATER CYCLE
5
•
Global Water Industry: $500B
•
Public Utilities
•
Design & Build Firms
•
Equipment & Service Providers
•
Industry Consists of Two Sectors
•
Water & Waste Water
Infrastructure
•
To Serve End Users
•
Xylem’s SAM: $35B
•
Technology Intensive & High
Value Equipment
•
Critical Applications
•
Knowledge-Based Services
•
Long-Term Growth Driven by
Macro Trends & Growing Water
Challenges
UNIQUELY POSITIONED TO SOLVE THE WORLD’S GROWING WATER CHALLENGES
|
 XYLEM PROPRIETARY / CONFIDENTIAL
JOURNEY FROM A PORTFOLIO OF
BUSINESSES TO A SOLUTION PORTFOLIO
6
MULTITRODE
*
* Zenon is a registered trademark of GE
EVOLUTION TO A LEADING GLOBAL WATER TECHNOLGY PROVIDER
|
 GLOBAL BUSINESS OVERVIEW |
 XYLEM PROPRIETARY / CONFIDENTIAL
GLOBAL MARKET PRESENCE
8
REVENUE BY GEOGRAPHY
(2013 Revenue)
GLOBAL SCALE & LOCAL PRESENCE PROVIDE A COMPETITIVE ADVANTAGE
•
360+ Global Locations
•
50 Emerging Market Sales & Service Centers
•
11 Emerging Market Production Facilities
•
Reaching Customers in More Than 150 Countries
A Growing Emerging Market
Presence …
Today ~20%
United States
Europe
Asia Pac
Rest of World
38%
36%
12%
14% |
 XYLEM PROPRIETARY / CONFIDENTIAL
DIVERSE CUSTOMER BASE
9
REVENUE BY END MARKET
(2013 Revenue)
UNDERSTANDING & ANTICIPATING OUR CUSTOMERS NEEDS
Industrial
45%
Public Utility
34%
Commercial
11%
Residential
7%
Agriculture
3% |
 XYLEM PROPRIETARY / CONFIDENTIAL
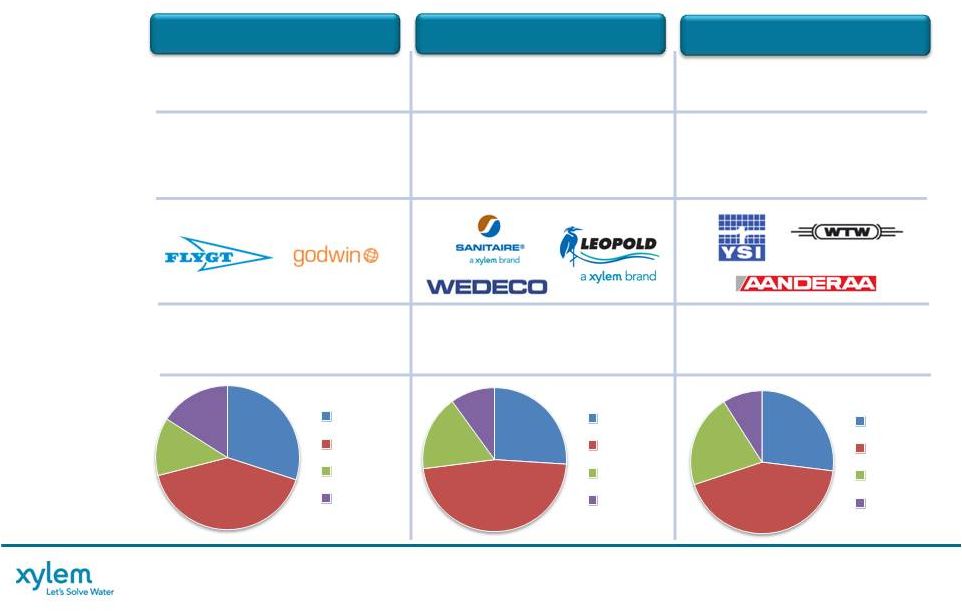
FOCUSED ON KEY GROWTH END MARKETS
10
LEADING POSITIONS & ATTRACTIVE LONG-TERM GROWTH OPPORTUNITIES
•
Strong Brands
•
Diverse Market Applications
INDUSTRIAL ($1.7B)
PUBLIC UTILITY ($1.3B)
COMMERCIAL ($400M)
(2013 Revenue)
•
Market Leading Positions
•
Large Installed Base
•
LT Growth Opportunities
•
Market Leading Positions
•
Large Installed Base
•
LT Growth Opportunities
•
US & Europe Pent-Up
Demand
•
Emerging Market
Infrastructure
Development
•
Steady Growth from
Maintenance & Repair
Business
•
New Product Launches
•
Demand for Energy
Efficient Solutions
•
Regulatory Standards
•
Emerging Market Key
Account Strategy
•
Light Industrial
•
Energy
•
Mining
•
Construction
•
Food & Beverage
•
Marine
•
Underserved Markets
•
Adjacent Mkt Expansion
•
LT
Growth
Opportunities |
 XYLEM PROPRIETARY / CONFIDENTIAL
SERVING CRITICAL NEEDS
11
GLOBAL LEADER IN WATER APPLICATION SOLUTIONS
REVENUE BY APPLICATION
(2013 Revenue)
Water Infrastructure Includes Transport, Treatment and Test Applications
…
Which Are
Integrated into the Most Critical Water Infrastructure Systems for Both Public Utility and
Large Industrial Customers
Applied Water Includes Building Services, Industrial Water and Irrigation Applications
…
Which Are Key Elements Systems for Commercial, Residential, Industrial and Ag
Customers
Transport
47%
Treatment
8%
Test
8%
Building Svcs
18%
Industrial Water
16%
Irrigation
3% |
 XYLEM PROPRIETARY / CONFIDENTIAL
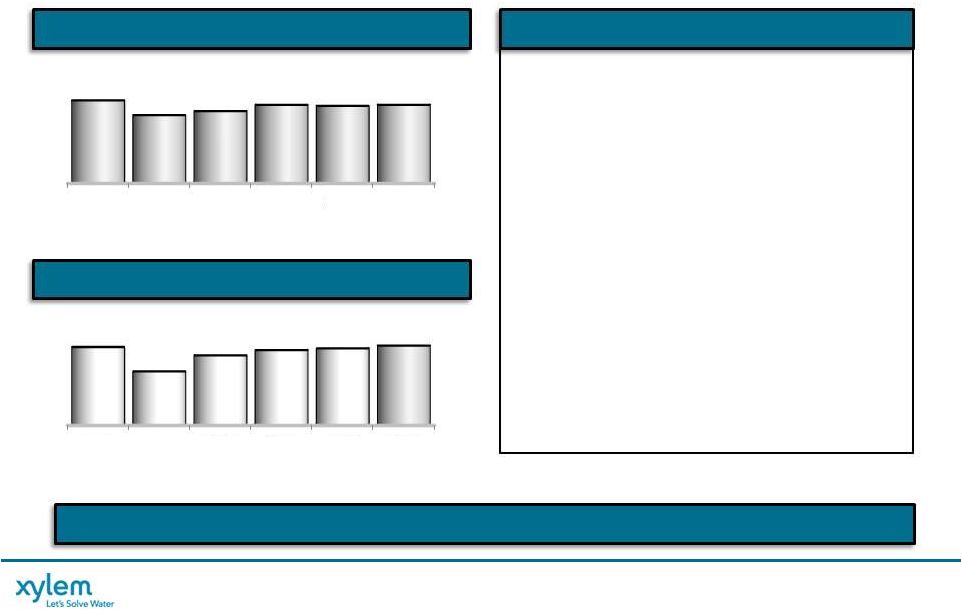
HISTORICAL XYLEM PERFORMANCE
OM%: 10.8%
10.8% 12.6% 12.7%
12.9% 11.8% OPPORTUNITY
TO
ACCELERATE
GROWTH
AND
IMPROVE
OPERATING
PERFORMANCE
$M
$M
12
REVENUE
OPERATING INCOME & MARGIN*
* See appendix for non-GAAP reconciliations
GM%: 34.7%
36.4% 37.9% 38.4%
39.6% 39.1% $M
GROSS PROFIT & MARGIN
2008
2009
2010
2011
2012
2013
3,291
2,849
3,202
3,803
3,791
3,837
2008
2009
2010
2011
2012
2013
1,141
1,037
1,214
1,461
1,502
1,499
2008
2009
2010
2011
2012
2013
356
307
403
482
489
451
‘08-’13 Revenue up 17%; 3% CAGR
•
New Product Development
•
Emerging Market Growth
•
Analytics and Dewatering Platforms
100 Bps Operating Margin Expansion
•
Pricing Improvements; Lean & Global Sourcing
•
Deployed ~$100M in Restructuring
•
Includes $33M Stand-Alone Costs
•
2013 impacted by lower Public Utility CAPEX
spending and weak European market conditions
-13%
12% 19% 1%
Organic*:
-9% 3% 7%
-1%
Growth:
0%
0% |
 XYLEM PROPRIETARY / CONFIDENTIAL
HISTORICAL XYLEM PERFORMANCE
* See appendix for non-GAAP reconciliations
Margin %: 12.9%
13.6% 15.7% 16.7%
17.1% 16.2% $M
EBITDA*
Reinvest %:
1.2x
1.2x
1.5x
1.4x
1.2x
1.3%
Ratio
$M
CAPEX
$M
R&D
% of :
1.9%
2.2%
2.3%
2.6%
2.8% 2.7%
Revenue
STRONG CASH GENERATION FUNDS CONTINUED GROWTH INVESTMENT
2008
2009
2010
2011
2012
2013
425
387
504
637
649
622
2008
2009
2010
2011
2012
2013
64
63
74
100
106
104
2008
2009
2010
2011
2012
2013
67
62
94
126
112
126
Strong Operating Cash Flow Generation
Generate, Reinvest, Grow
•
EBITDA Up 47% Since 2008; 8% CAGR
•
Better Price Execution
•
Increase in Portfolio Profitability
•
Improved Productivity
•
Increasing R&D Investment
•
Capex Reinvestment Ratio >1
13 |
 XYLEM PROPRIETARY / CONFIDENTIAL
STRONG FINANCIAL POSITION
BALANCED CAPITAL DEPLOYMENT TO ENHANCE SHAREHOLDER RETURNS
14
* See appendix for non-GAAP reconciliations
CAPITAL SUMMARY
March 31, 2014
Cash
466
Debt
1,243
Net Debt
777
Shareholders’
Equity
2,229
Net Capital
3,006
Net Debt to Net Capital
26%
Liquidity and Cash Management
•
Access to Revolver and Commercial Paper
for Short-Term Liquidity Requirements
•
No Debt Maturities Until 2016 & 2021
Pension & OPEB
•
Status: 103% (Funded Plans); 67% (Overall)
CAPITAL DEPLOYMENT STRATEGY
Return Capital to Shareholders
Invest in Organic Growth Initiatives
Inorganic Growth Investments
•
Differentiated Product Development
•
Maintenance & Investment Capex
•
Dividends
•
Share Repurchase Programs
•
Acquire Bolt-on and Close-to-Core
Companies
•
Strategic & Financial Filters Drive Disciplined
Approach
•
Proven Track Record |
 REVIEW OF
1Q EARNINGS PERFORMANCE
& 2014 OUTLOOK
Note: Forward Looking information presented on slides
17 & 18 were as of April 29, 2014. Please review the
Forward Looking Statements on slide 2, and note that the
Company undertakes no obligation to publicly update or
revise any forward-looking statements, whether as a
result of new information, future events or otherwise,
except as required by law. |
 XYLEM PROPRIETARY / CONFIDENTIAL
16
BUSINESS UPDATE
SOLID 1ST QUARTER PERFORMANCE ... ON TRACK TO DELIVER 2014
* See appendix for non-GAAP reconciliations
Highlights
1st
Quarter
Financial
Summary
Strong
finish
to
the
1
Quarter
…
March
performance
offset
slow
start
Emerging Markets off to fast start, Europe slowly recovering
Volume & cost actions drive significant Op Margin expansion & Earnings growth
Operating improvements on track to deliver full year savings
Orders of $993M up 3% …
Ending Backlog $793M, 2014 Shippable Backlog up 6%
Revenue of $906M up 3%, with growth in both segments
Operating
Margin*
of
10.4%, up 150 bps; strong incremental margin performance
Earnings
Per
Share*
$0.34 up 26%
Free Cash Flow* usage $3M …
Seasonality and Working Capital investment
st |
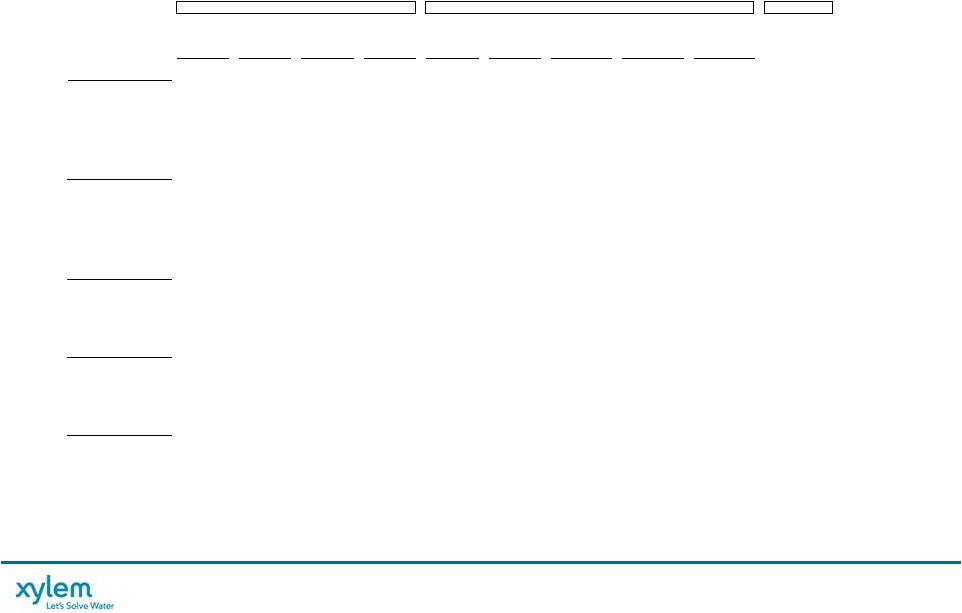
 XYLEM PROPRIETARY / CONFIDENTIAL
17
2014 GROWTH PROFILE (As of April 29, 2014)
Industrial
Public Utility
•
Emerging Market infrastructure
investment; Slow Capex recovery in
U.S./Europe
•
Opex stable in US & Europe
(34% of ’13 Revenue)
Commercial
•
Emerging Market growth & new product
launches
•
Weak U.S. institutional bldg mkt; Europe
slow to recover
(11% of ’13 Revenue)
Agriculture
•
Tough year-over-year comparison
following strong 2012 & 2013
performance
(3% of ’13 Revenue)
Residential
•
Cold winter subsides in U.S.; U.S. housing
recovery moderates; Europe stabilizes
•
Tough 2Q comp (2Q’13 U.S. +18% vs. PY)
(7% of ’13 Revenue)
Up Low
Single Digit
Up Low
Single Digit
Up Low
Single Digit
Up Low
Single Digit
Flat to Up
Low Single
Digit
Xylem 2014
Organic Growth
•
Improving global Capex environment
•
Driving market share gains
•
Mining headwinds continue
(45% of ’13 Revenue)
STABLE MARKET CONDITIONS …
EXPECTATIONS REMAIN UNCHANGED |
 XYLEM PROPRIETARY / CONFIDENTIAL
18
(Dollars, In Millions, except EPS)
REVENUE
* See appendix for non-GAAP reconciliations
OPERATING INCOME*
EPS*
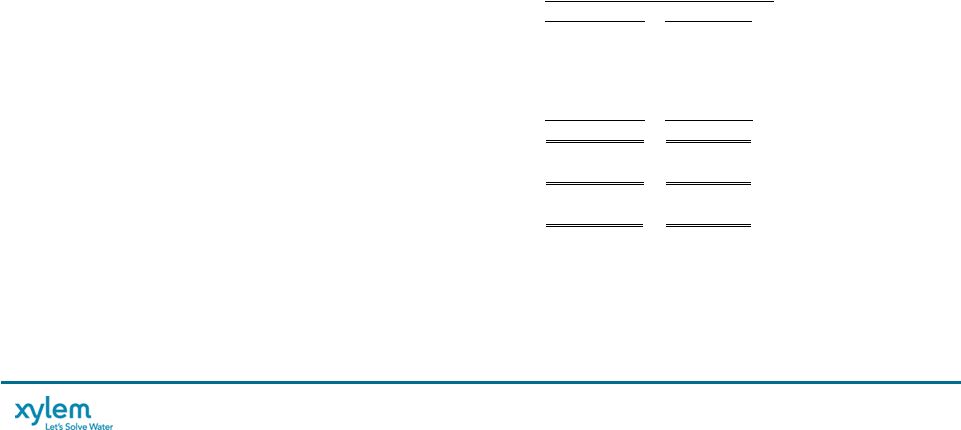
2014 XYLEM OUTLOOK
(As of April 29, 2014)
$3,900 to $3,980
$490 to $525
$1.85 to $2.00
Op
Margin
FREE CASH FLOW*
Higher Income, Working Cap
Improvement, and Lower Capex
Spend
ROIC
~11%
DIVIDENDS/SHARE
REPURCHASES
~225
Targeting 100 Bps Improvement
Expected 10% Annual Dividend
Increase, ~$130M for Share
Repurchases
3,837
451
1.67
198
154
10.0%
2013
2014
2013
2014
2013
2014
2013
2014E
2013
2014
2013
2014
11.8%
12.6% to 13.2%
~310-345
COST FOCUS EXPECTED TO DRIVE SOLID EARNINGS GROWTH …
MARKET RECOVERY FUELS UPSIDE |
 CLOSING SUMMARY |
 XYLEM PROPRIETARY / CONFIDENTIAL
20
HOW WILL XYLEM IMPROVE PERFORMANCE?
The Xylem Management System
(“XMS”) defines how we create
value.
It integrates our key strategic
operating processes to drive
superior growth and operational
excellence, efficient capital
deployment, and strong,
consistent leadership
TOP PRIORITIES
FOCUSED ON EXECUTION & DRIVING ACCOUNTABILITY
Accelerate Revenue Growth
Improve Operating Cost Position
Embed Continuous Improvement Tools
Optimize Integrated Front End
•
Invest & Implement Global CRM Tool
•
Differentiated Product Innovation
Emerging Market Expansion
•
•
Expand Global Sourcing Capabilities
Manage General & Administrative Costs
Drive Lean Six Sigma More Consistently,
Deeper and Across the Entire Organization
•
•
•
Rebalance Portfolio & Product Investments
•
REIGNITE “XMS” |
 XYLEM PROPRIETARY / CONFIDENTIAL
21 |
 APPENDIX |
 XYLEM PROPRIETARY / CONFIDENTIAL
WATER INFRASTRUCTURE
Market Size: $20B
2013 Revenues: $2.5B
2013 Op Margin*: 13.1%
APPLIED WATER
Market Size: $15B
2013 Revenues: $1.4B
2013 Op Margin*: 12.7%
23
SEGMENT OVERVIEW
64%
36%
Segment Split
(3
rd
Party Revenue)
UNIQUE PORTFOLIO PROVIDES FOR
INNOVATIVE SOLUTIONS
BROAD PRODUCT PORTFOLIO BACKED
BY APPLICATION EXPERTISE
* See appendix for non-GAAP reconciliations
•
World’s Largest Waste Water Pump
& Dewatering Services Provider
•
Broad Portfolio of Filtration,
Biological and Disinfection
Technologies
•
Industry-Leading Water &
Environment Analytics Platform
•
Leading Global Provider of a Broad
Range of Energy-Efficient Solutions
with a Large & Diverse Customer Base
•
U.S. Leader in Building Services
Equipment & Solutions
•
U.S. Leader in Industrial Water
Technologies |
 XYLEM PROPRIETARY / CONFIDENTIAL
Herford, Germany;
Brown Deer, WI;
Zelienople, PA
24
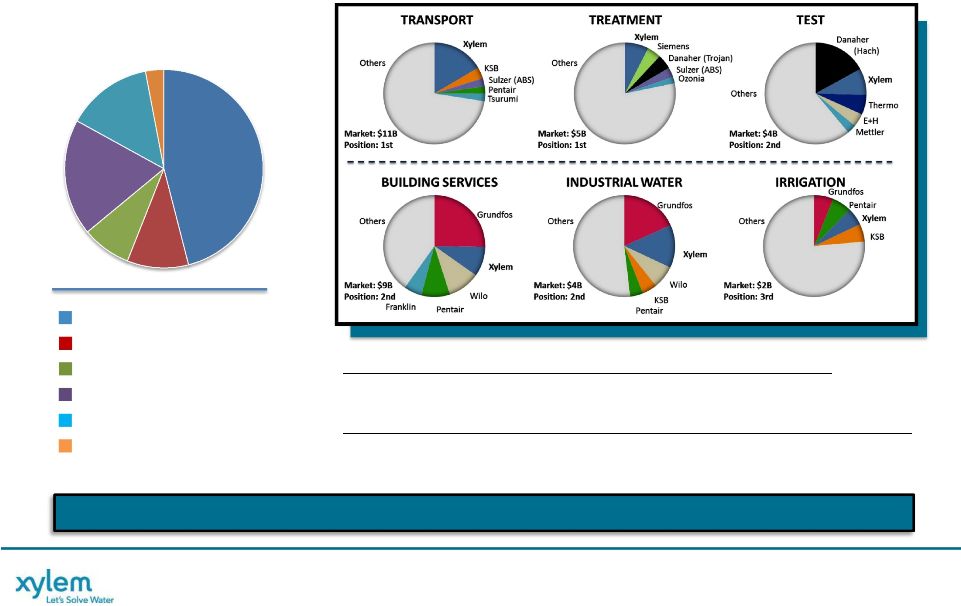
WATER INFRASTRUCTURE
SEGMENT OVERVIEW
Market Size:
2013 Revenues:
Key Products
& Services:
2013 Revenues
by Geography:
Key Facilities:
Key Brands:
$11B
$1,812M
$5B
$329M
$4B
$298M
Water & Waste Water Pumps
Dewatering (Sales & Rentals)
Aftermarket Parts & Services
Biological
U.V. and Ozone Disinfection
Filtration
Analytical Instrumentation,
Doppler and Level Measurement,
Water Quality and Environmental
Monitoring Systems
Emmaboda, Sweden;
Baroda, India; Shenyang, China;
Bridgeport, NJ
Yellow Springs, OH;
Weilheim, Germany;
Bergen, Norway
U.S.
Europe
Asia
Pacific
Other
26%
U.S.
Europe
Asia
Pacific
Other
U.S.
Europe
Asia
Pacific
Other
10%
17%
47%
30%
41%
13%
16%
27%
43%
21%
9%
TRANSPORT
TREATMENT
TEST |
 XYLEM PROPRIETARY / CONFIDENTIAL
WATER INFRASTRUCTURE
Growth:
-10%
17% 25%
0% 1%
Organic*:
-4%
2%
7%
0% -2% OM%:
13.0% 14.7%
14.9% 14.9% 15.1%
13.1%
‘08-’13 Revenue up 35%; 6% CAGR
•
Resilient Through the Downturn
•
Growth Driven by Acquisitions,
Emerging Markets & Product
Launches
•
Public Utility CAPEX Slowdown
•
European Crisis
Recent Market Conditions Negatively
Impacted Operating Margins
•
Operating Productivity Funds
Incremental Strategic Investments
•
Decline in Dewatering related to
Fracking along with weak Public
Utility CAPEX and European market
conditions impacted 2013
$M
$M
25
REVENUE
OPERATING INCOME & MARGIN*
HIGHLIGHTS
* See appendix for non-GAAP reconciliations
2008
2009
2010
2011
2012
2013
1,824
1,651
1,930
2,416
2,425
2,457
2008
2009
2010
2011
2012
2013
237
242
288
359
365
323
LEVERAGE & RECENT COST REDUCTION ACTIONS ACCELRATE LONG-TERM GROWTH
|
 XYLEM PROPRIETARY / CONFIDENTIAL
26
APPLIED WATER SYSTEMS
SEGMENT OVERVIEW
Market Size:
2013 Revenues:
Key Products
& Services:
2013 Revenues
by Geography:
Key Facilities:
Key Brands:
$9B
$696M
$4B
$600M
HVAC Pumps, Valves & Heat
Exchangers, Drives & Controls,
Waste Water Pumps, Pressure
Boosters, Fire Protection
Auburn, NY; Buffalo, NY; Cegled, Hungary; Chihuahua, Mexico; Dallas, TX; Hoddesdon, UK;
Montecchio, Italy; Morton Grove, IL; Nanjing, China; Stockerau, Austria; Strzelin,
Poland; Wolverhampton, UK Pumps & Pumping Systems
Heat Exchangers, Drives & Controls
Membrane Filtration
Fire Protection
$2B
$102M
Groundwater & Surface Pumps
Packaged Systems, Drives &
Controls
BUILDING SERVICES
INDUSTRIAL WATER
IRRIGATION
58%
16%
10%
16%
U.S.
Europe
Asia Pacific
Other
45%
37%
9%
9%
U.S.
Europe
Asia Pacific
Other
52%
33%
1%
14%
U.S.
Europe
Asia Pacific
Other |
 APPLIED WATER
Growth: -18%
6%
9%
-1% 1%
Organic*:
OM%:
11.8% 9.9%
12.1% 12.0%
12.4% 12.7% STRONG OPERATING PERFORMANCE DESPITE
CHALLENGED MARKETS ‘08-’13 Revenue Down 5%
•
Residential & Commercial Building
Decline
•
Growth Driven By New Product
Launches
–
Energy-Efficient Solutions
–
Emerging Markets Penetration
Strong Operating Performance
•
Margin Expansion Driven by Customer
& Operational Excellence Initiatives
•
Continued to Fund Future Growth
Investments
$M
$M
27
REVENUE
OPERATING INCOME & MARGIN*
* See appendix for non-GAAP reconciliations
HIGHLIGHTS
2008
2009
2010
2011
2012
2013
180
124
161
173
177
183
2008
2009
2010
2011
2012
2013
1,527
1,254
1,327
1,444
1,424
1,444
-15%
6%
7%
1%
0% |
 XYLEM PROPRIETARY / CONFIDENTIAL
ACQUISITION SCORECARD
Completed
On Track
Not Achieved
28
Laing
$30
2009
Nova
$384
2010
Godwin
$585
2010
OI
$25
2010
YSI
$310
2011
Through
2012
MJK
$13
2012
$29
2012
PIMS
$57
2013
MultiTrode
$26
2013
Acquisition
Invested
$M
Year
Completed
Strategic
Fit
Gross
Margin
Accretive
Risk Adj.
Cost of
Capital
Mid-
Teens
ROIC
Cash
Return
7-9 Years
EPS
Accretive
After Yr 1
Added
~200 Bps
Added
~$0.45
IRR >
Heartland |
 29
2014 FINANCIAL GUIDANCE SUMMARY
Q1 2014 EARNINGS RELEASE
* Excluding Restructuring & Realignment costs, and special tax items
2014 Full Year
Growth
Revenue
Total Growth
Organic
FX/Acquisition
Xylem Consolidated
$3,900 to $3,980
2% to 4%
1% to 3%
1%
Water Infrastructure
$2,500 to $2,540
2% to 4%
2% to 3%
1%
Applied Water
$1,470
to $1,490
2% to 3%
1% to 2%
1%
Segment Margin *
14.1% to 14.6%
+90 bps to +140 bps
Operating
Margin *
12.6%
to 13.2%
+80 bps to
+140 bps
EPS *
$1.85 to $2.00
Up 11% to 20%
Free Cash Flow Conversion
~100%
Guidance
Assumptions:
Operating
Tax Rate *
~21%
Unchanged from 2013
Share
Count
~185M
Q2: 185.5; ~$130M for Share Repurchases in 2014
Restructuring &
Realignment Costs
~$40 to $50
‘14
Rest. Savings ~$15M; Realignment Cost $10-$15
Financial
Outlook
2014E vs. 2013
SOLID START TO 2014 …
AFFIRMING FULL YEAR GUIDANCE
(Dollars In Millions, Except per Share Data) |
 XYLEM PROPRIETARY / CONFIDENTIAL
30
NON-GAAP MEASURES
“Organic revenue" and "Organic orders”
defined as revenue and orders, respectively, excluding the impact of foreign currency
fluctuations, “Constant currency”
defined as financial results adjusted for currency translation impacts by translating current
period and prior period activity using the same currency conversion rate. This
approach is used for countries whose functional currency is not the U.S. dollar.
“EBITDA”
defined
as
earnings
before
interest,
taxes,
depreciation,
amortization
expense,
and
share-based
compensation.
“Adjusted
EBITDA”
reflects
the adjustment to EBITDA to exclude non-recurring restructuring and realignment costs.
“Adjusted
Operating
Income",
"Adjusted
Segment
Operating
Income",
and
“Adjusted
EPS”
defined
as
operating
income
and
earnings
per
share,
“Free Cash Flow”
defined as net cash from operating activities, as reported in the Statement of Cash Flow,
less capital expenditures as well as Management views key performance indicators
including revenue, gross margins, segment operating income and margins, orders growth, free cash
flow, working capital, and backlog, among others. In addition, we consider certain measures to
be useful to management and investors evaluating our operating performance for the
periods presented, and provide a tool for evaluating our ongoing operations, liquidity and management of assets. This
information can assist investors in assessing our financial performance and measures our
ability to generate capital for deployment among competing strategic alternatives and
initiatives. These metrics, however, are not measures of financial performance under GAAP and should not be considered a
substitute for revenue, operating income, net income, earnings per share (basic and diluted)
or net cash from operations as determined in accordance with GAAP. We consider the
following non-GAAP measures, which may not be comparable to similarly titled measures reported by other companies,
to be key performance indicators:
“Realignment costs”
defined as non-recurring costs not included in restructuring costs that are incurred as part of actions taken to
reposition our business, including items such as professional fees, relocation,
travel and other costs. adjusted to exclude non-recurring restructuring and realignment costs and tax-related
special items.
adjustments for other significant items that impact current results which management believes
are not related to our ongoing operations and performance. Our definition of free
cash flows does not consider non-discretionary cash payments, such as debt.
intercompany transactions, and contributions from acquisitions and divestitures.
Divestitures include sales of portions of our business that did not meet the
criteria for classification as a discontinued operation or insignificant portions of our business that we did not classify as a discontinued operation.
The period-over-period change resulting from foreign currency fluctuations assumes no
change in exchange rates from the prior period. |
 XYLEM PROPRIETARY / CONFIDENTIAL
31
Constant Currency
(A)
(B)
(C)
(D)
(E)
(F) = B+C+D+E
(G) = F/A
(H) = (F - C) / A
Change
% Change
Change
% Change
Revenue
Revenue
CY v. PY
CY v. PY
FX Contribution
Eliminations
Adj. CY v. PY
Adj. CY v. PY
Current Year
Prior Year
Year Ended December 31, 2013
Xylem Inc.
3,837
3,791
46
1%
(82)
(3)
-
(39)
-1%
1%
Water infrastructure
2,457
2,425
32
1%
(82)
4
-
(46)
-2%
1%
Applied Water
1,444
1,424
20
1%
-
(9)
(6)
5
0%
0%
Year Ended December 31, 2012
Xylem Inc.
3,791
3,803
(12)
0%
(94)
108
-
2
0%
3%
Water infrastructure
2,425
2,416
9
0%
(94)
80
(1)
(6)
0%
4%
Applied Water
1,424
1,444
(20)
-1%
-
32
(3)
9
1%
1%
Year Ended December 31, 2011
Xylem Inc.
3,803
3,202
601
19%
(264)
(111)
-
226
7%
15%
Water Infrastructure
2,416
1,930
486
25%
(264)
(87)
2
137
7%
21%
Applied Water
1,444
1,327
117
9%
-
(28)
(1)
88
7%
7%
Year Ended December 31, 2010
Xylem Inc.
3,202
2,849
353
12%
(263)
6
-
96
3%
13%
Water infrastructure
1,930
1,651
279
17%
(247)
(8)
-
24
1%
16%
Applied Water
1,327
1,254
73
6%
(16)
15
-
72
6%
7%
Year Ended December 31, 2009
Xylem Inc.
2,849
3,291
(442)
-13%
(7)
158
-
(291)
-9%
-9%
Water infrastructure
1,651
1,824
(173)
-9%
-
109
(1)
(65)
-4%
-4%
Applied Water
1,254
1,527
(273)
-18%
(7)
53
-
(227)
-15%
-14%
Note: Due to rounding the sum of segment amounts may not agree to Xylem totals.
Acquisitions /
Divestitures
Xylem Inc. Non-GAAP Reconciliation
Reported vs. Organic & Constant Currency Revenue
($ Millions)
(As Reported - GAAP)
(As Adjusted - Organic) |
 XYLEM PROPRIETARY / CONFIDENTIAL
32
2008
2009
2010
2011
2012
2013
Revenue
3,291
2,849
3,202
3,803
3,791
3,837
Operating Income
315
276
388
395
443
363
Operating Margin
9.6%
9.7%
12.1%
10.4%
11.7%
9.5%
Restructuring & Realignment
41
31
15
-
24
64
Separation Costs*
-
-
-
87
22
-
Special Charges
-
-
-
-
-
24
Adjusted Operating Income
356
307
403
482
489
451
Adjusted Operating Margin
10.8%
10.8%
12.6%
12.7%
12.9%
11.8%
Standalone Costs
-
-
-
5
28
-
Adj. Operating Income, excl. Standalone Costs
356
307
403
487
517
451
Adjusted Operating Margin, excl. Standalone Costs
10.8%
10.8%
12.6%
12.8%
13.6%
11.8%
Xylem Inc. Non-GAAP Reconciliation
Adjusted Operating Income
($ Millions)
* 2013 separation costs are not excluded from adjusted operating income.
|
 XYLEM PROPRIETARY / CONFIDENTIAL
33
2013
2012
2011
2010
2009
2008
Total Revenue
• Total Xylem
3,837
3,791
3,803
3,202
2,849
3,291
• Water Infrastructure
2,457
2,425
2,416
1,930
1,651
1,824
• Applied Water
1,444
1,424
1,444
1,327
1,254
1,527
Operating Income
• Total Xylem
363
443
395
388
276
315
• Water Infrastructure
271
342
343
276
227
220
• Applied Water
167
170
160
158
109
162
Operating Margin
• Total Xylem
9.5%
11.7%
10.4%
12.1%
9.7%
9.6%
• Water Infrastructure
11.0%
14.1%
14.2%
14.3%
13.7%
12.1%
• Applied Water
11.6%
11.9%
11.1%
11.9%
8.7%
10.6%
Separation Costs
• Total Xylem
-
22
87
-
-
-
• Water Infrastructure
-
4
16
-
-
-
• Applied Water
-
2
13
-
-
-
Special Charges
• Total Xylem
24
-
-
-
-
• Water Infrastructure
4
-
-
-
-
• Applied Water
-
-
-
-
-
Restructuring & Realignment Costs
• Total Xylem
64
24
-
15
31
41
• Water Infrastructure
48
19
-
12
15
17
• Applied Water
16
5
-
3
15
18
Adjusted Operating Income*
• Total Xylem
451
489
482
403
307
356
• Water Infrastructure
323
365
359
288
242
237
• Applied Water
183
177
173
161
124
180
Adjusted Operating Margin*
• Total Xylem
11.8%
12.9%
12.7%
12.6%
10.8%
10.8%
• Water Infrastructure
13.1%
15.1%
14.9%
14.9%
14.7%
13.0%
• Applied Water
12.7%
12.4%
12.0%
12.1%
9.9%
11.8%
*Adjusted Operating Income excludes non-recurring separation, restructuring &
realignment costs Xylem Inc. Non-GAAP Reconciliation
Adjusted Operating Income
($ Millions) |
 XYLEM PROPRIETARY / CONFIDENTIAL
34
2013
2012
2011
2010
2009
2008
Net Cash - Operating Activities
324
396
449
395
370
408
Capital Expenditures
(126)
(112)
(126)
(94)
(62)
(67)
Free Cash Flow, including separation costs
198
284
323
301
308
341
Cash Paid for Separation Costs (incl. Capex)
-
28
65
-
-
-
Free Cash Flow, excluding separation costs*
198
312
388
301
308
341
Net Income
228
297
279
329
263
224
Separation Costs, net of tax (incl. tax friction)
-
16
72
0
0
0
Net Income, excluding separation costs*
228
313
351
329
263
224
Free Cash Flow Conversion
87%
100%
111%
91%
117%
152%
* Separation costs are not excluded in 2013
Year Ended
Xylem Inc. Non-GAAP Reconciliation
Net Cash - Operating Activities vs. Free Cash Flow
($ Millions) |
 XYLEM PROPRIETARY / CONFIDENTIAL
35
2008
2009
2010
2011
2012
2013
Net Income
224
263
329
279
297
228
Separation Costs, Net of Tax*
-
-
-
72
16
-
Restructuring & Realignment, Net of Tax
28
22
11
-
17
46
Special Charges, Net of Tax
-
-
-
-
-
23
Adjusted Net Income before Special Tax Items
252
285
340
351
330
297
Special Tax Items
-
(61)
(43)
7
-
14
Adjusted Net Income
252
224
297
358
330
311
Diluted Earnings per Share
$1.22
$1.42
$1.78
$1.50
$1.59
$1.22
Separation Costs per Share*
$0.00
$0.00
$0.00
$0.39
$0.09
$0.00
Restructuring & Realignment Costs per Share
$0.14
$0.11
$0.06
$0.00
$0.09
$0.25
Special Charges per Share
-
-
-
-
-
$0.13
Adjusted Diluted EPS before Special Tax Items
$1.36
$1.53
$1.84
$1.89
$1.77
$1.60
Special Tax Items per Share
$0.00
($0.32)
($0.23)
$0.04
$0.00
$0.07
Adjusted Diluted EPS
$1.36
$1.21
$1.61
$1.93
$1.77
$1.67
* Separation costs are not excluded in 2013
Xylem Inc. Non-GAAP Reconciliation
Adjusted Diluted EPS
($ Millions, except per share amounts) |
 XYLEM PROPRIETARY / CONFIDENTIAL
36
2008
2009
2010
2011
2012
2013
Pre-Tax Income
312
277
388
383
388
298
Interest Expense (Income),
net -
-
-
17
51
52
Depreciation
and Amortization 72
79
101
137
142
149
Stock Compensation
-
-
-
13
22
27
EBITDA
384
356
489
550
603
526
Separation Costs*
-
-
-
87
22
64
Restructuring
& Realignment 41
31
15
-
24
32
Adjusted
EBITDA 425
387
504
637
649
622
Revenue
3,291
2,849
3,202
3,803
3,791
3,837
Adjusted EBITDA Margin
12.9%
13.6%
15.7%
16.7%
17.1%
16.2%
* Separation costs are not excluded in 2013
Xylem Inc. Non-GAAP Reconciliation
EBITDA and Adjusted EBITDA
($ Millions) |
 XYLEM PROPRIETARY / CONFIDENTIAL
37
Constant Currency
(A)
(B)
(C)
(D)
(E)
(F) = B+C+D+E
(G) = F/A
(H) = (F -
C) / A
Change
% Change
Change
% Change
Revenue
Revenue
2014 v. 2013
2014 v. 2013
FX Contribution
Eliminations
Adj. 2014 v. 2013
Adj. 2014 v. 2013
2014
2013
Quarter Ended March 31
Xylem Inc.
906
879
27
3%
(5)
4
-
26
3%
4%
Water infrastructure
568
551
17
3%
(5)
7
1
20
4%
5%
Applied Water
355
345
10
3%
-
(3)
(1)
6
2%
2%
Note: Due to rounding the sum of segment amounts may not agree to Xylem totals.
Acquisitions /
Divestitures
Xylem Inc. Non-GAAP Reconciliation
Reported vs. Organic & Constant Currency Revenue
($ Millions)
(As Reported -
GAAP)
(As Adjusted -
Organic)
Constant Currency
(A)
(B)
(C)
(D)
(E)
(F) = B+C+D+E
(G) = F/A
(H) = (F -
C) / A
Change
% Change
Change
% Change
Orders
Orders
2014 v. 2013
2014 v. 2013
FX Contribution
Eliminations
Adj. 2014 v. 2013
Adj. 2014 v. 2013
2014
2013
Quarter Ended March 31
Xylem Inc.
993
962
31
3%
(7)
3
-
27
3%
4%
Water infrastructure
619
601
18
3%
(7)
6
2
19
3%
4%
Applied Water
394
378
16
4%
-
(4)
(3)
9
2%
2%
Note: Due to rounding the sum of segment amounts may not agree to Xylem totals.
Acquisitions /
Divestitures
Xylem Inc. Non-GAAP Reconciliation
Reported vs. Organic & Constant Currency Order Growth
($ Millions)
(As Reported -
GAAP)
(As Adjusted -
Organic) |
 XYLEM PROPRIETARY / CONFIDENTIAL
38
Q1
2014
2013
Total Revenue
•
Total Xylem
906
879
•
Water Infrastructure
568
551
•
Applied Water
355
345
Operating Income
•
Total Xylem
76
66
•
Water Infrastructure
46
42
•
Applied Water
41
40
Operating Margin
•
Total Xylem
8.4%
7.5%
•
Water Infrastructure
8.1%
7.6%
•
Applied Water
11.5%
11.6%
Restructuring & Realignment Costs
•
Total Xylem
18
12
•
Water Infrastructure
12
10
•
Applied Water
6
2
Adjusted Operating Income*
•
Total Xylem
94
78
•
Water Infrastructure
58
52
•
Applied Water
47
42
Adjusted Operating Margin*
•
Total Xylem
10.4%
8.9%
•
Water Infrastructure
10.2%
9.4%
•
Applied Water
13.2%
12.2%
Xylem Inc. Non-GAAP Reconciliation
Adjusted Operating Income
($ Millions)
*Adjusted Operating Income excludes restructuring & realignment costs.
|
 XYLEM PROPRIETARY / CONFIDENTIAL
39
Q1 2013
Q1 2014
As Reported
Adjustments
Adjusted
As Reported
Adjustments
Adjusted
Total Revenue
879
879
906
906
Operating Income
66
12
a
78
76
18
a
94
Operating Margin
7.5%
8.9%
8.4%
10.4%
Interest Expense
(13)
(13)
(14)
(14)
Other Non-Operating Income (Expense)
(2)
(2)
(1)
(1)
Income before Taxes
51
12
63
61
18
79
Provision for Income Taxes
(10)
(3)
b
(13)
(12)
(4)
b
(16)
Net Income
41
9
50
49
14
63
Diluted Shares
186.4
186.4
185.8
185.8
Diluted EPS
0.22
$
0.05
$
0.27
$
0.27
$
0.07
$
0.34
$
a
Restructuring & realignment costs
b
Net tax impact of restructuring & realignment costs and special tax items
Xylem Inc. Non-GAAP Reconciliation
Adjusted Diluted EPS
($ Millions, except per share amounts)
*******
*******
*******
******* |
 XYLEM PROPRIETARY / CONFIDENTIAL
40
2014
2013
Net Cash - Operating Activities
22
$
20
$
Capital Expenditures
(25)
(30)
Free Cash Flow
(3)
$
(10)
$
Net Income
49
$
41
$
Free Cash Flow Conversion
-6%
-24%
Xylem Inc. Non-GAAP Reconciliation
Net Cash - Operating Activities vs. Free Cash Flow
($ Millions)
Three Months Ended
**
**
**
**
**
*****************
*****************
*****************
*****************
*****************
*****************
*****************
*****************
*****************
*****************
*****************
********* |
 XYLEM PROPRIETARY / CONFIDENTIAL
41
NYSE: XYL
Phil De Sousa, Investor Relations Officer
(914) 323-5930
Dawn Powell, Investor Relations Coordinator
(914) 323-5931
http://investors.xyleminc.com
*****************************
*****************************
*****************************
***************************** |