Attached files
| file | filename |
|---|---|
| 8-K - 8-K - OneMain Holdings, Inc. | a14-12771_18k.htm |
Exhibit 99.1
SPRINGLEAF HOLDINGS, INC. ANNOUNCES FIRST QUARTER 2014 RESULTS
Evansville, IN, May 14, 2014 – Springleaf Holdings, Inc. (NYSE:LEAF), today reported net income for the first quarter of 2014 of $52 million, or $0.45 per diluted share, compared with a net loss of $10 million in the first quarter of 2013, or $0.10 per diluted share (based on the pre-initial public offering share count of 100 million shares). Net income in the quarter included a $55 million pretax net gain from the sale of $1 billion of real estate unpaid principal balance in March 2014.
Core Earnings (a non-GAAP measure) for our Core Consumer Operations for the quarter were $50 million, versus $25 million in the prior year quarter, and Core Earnings per diluted share (a non-GAAP measure) were $0.43 for the first quarter versus $0.25 in the prior year quarter1.
First Quarter Highlights
· Branch consumer net finance receivables reached $3.2 billion at March 31, 2014, an increase of $600 million, or 23% from the prior year, and up 1% from the fourth quarter 2013
· Average receivables per branch were $3.8 million at March 31, 2014, up 24% from the prior year quarter and 1% from the fourth quarter 2013
· Risk-adjusted yield for our Consumer segment in the quarter was 21.92%, up 60 basis points from the fourth quarter 2013
· The company completed the sale of $1 billion of real estate loans from its Non-Core Portfolio on March 31, 2014
· The company prepaid in full the remaining $750 million principal balance on its secured term loan, originally due 2019
Commenting on Springleaf’s first quarter results, Jay Levine, President and CEO of Springleaf said, “Springleaf’s results during the first quarter reflect the strength of the Core Consumer Operations and the success of our strategic initiatives. Our branches performed well in what is traditionally our slowest origination quarter and our SpringCastle Portfolio contributed nicely on the back of strong credit performance. Our liquidity and funding profile improved as we accelerated the wind down of our Non-Core Portfolio with the sale of over $1 billion in real estate loans.”
1 Excludes the impact of charges related to accelerated repayment/repurchase of debt, fair value adjustments on debt and earnings attributable to non-controlling interests
Core Consumer Operations: (Reported on a historical accounting basis, which is a non-GAAP measure. Refer to the reconciliation of non-GAAP to comparable GAAP measures, below.)
Branch Operations
Consumer and Insurance pretax income was $49 million in the quarter versus $40 million in the first quarter of 2013, and up from $41 million in the fourth quarter of 20132.
Net finance receivables reached $3.2 billion at the end of the quarter, an increase of 23% from the prior year and 1% from the prior quarter, driven by the company’s focus on increasing personal loan originations through its branch network.
Net interest income of $169 million increased 37% from the prior year, driven by 23% growth in average net finance receivables and yield expansion of 154 basis points to 26.93% in the current quarter. Net interest income increased 3% from the prior quarter. Yield benefited from the change in the state-by-state mix of loan originations, in addition to greater focus on risk-based pricing. Risk adjusted yield, representing yield less net charge-off, was 21.92% in the quarter, down 29 basis points from the first quarter of 2013 and up 60 basis points from the fourth quarter of 20133.
The delinquency ratio was 2.45% at quarter end, up 46 basis points from the prior year, which reflects a higher level of new customer originations. The delinquency ratio improved 15 basis points from the prior quarter. The annualized net charge-off ratio was 5.01% in the quarter, versus 3.18% in the prior year and 5.02% in the prior quarter. The annualized net charge-off ratio in the quarter was adversely affected by lower recoveries as the company sold a significant portion of previously charged-off accounts in 20133.
The annualized gross charge-off ratio was 5.56% in the quarter, up 110 basis points from the prior year quarter and up 7 basis points from the fourth quarter 20133. Recoveries continued to normalize in the quarter at 55 basis points versus 128 basis points in the prior year quarter, largely due to the impact of the sale of previously charged-off accounts in June 2013.
2 Consumer and Insurance segments reflect historical accounting basis (which is a basis of accounting other than U.S. GAAP). Pretax income excludes impact of charges related to accelerated repayment / repurchase of debt.
3 The charge-off ratio for 1Q13 excludes $14.5 million of additional charge-offs recorded in March 2013 related to our change in charge-off policy for personal loans.
Acquisitions & Servicing (Results reflect the acquisition of the $3.8 billion SpringCastle portfolio in April 2013, and the initiation of servicing activities in September 2013.)
Our portion of the Acquisitions and Servicing segment and related servicing contributed $31 million to the company’s consolidated pretax income in the quarter4. The entire Acquisitions and Servicing segment generated pretax income of $39 million in the quarter, with net interest income of $124 million and yield of 24.40%. Actual net finance receivables at quarter-end were $2.3 billion, down from $2.5 billion at December 31, 2013. The principal balance of the portfolio was $3.0 billion at quarter-end versus $3.2 billion at December 31, 2013.
The delinquency ratio for the Acquisitions and Servicing segment was 6.33% at the end of the quarter, an improvement of 185 basis points from the prior quarter, while the annualized net charge-off ratio was 8.67%, up 21 basis points from 8.46% in the fourth quarter 2013.
Legacy Real Estate and Other Non-Core
Excluding the recent sales, repurchases and repayments of debt and fair value adjustments on debt, the Non-Core Portfolio (consisting of legacy real estate loans) and Other Non-Core activities generated a pretax loss of $44 million in the quarter, including $41 million attributable to the legacy real estate loan portfolio5. Other Non-Core activities resulted in a loss of $3 million in the quarter.
Sale of Legacy Real Estate Loans
On March 31, 2014, the company sold to three different parties a total of $1.0 billion of real estate loans serviced by PennyMac. The sales generated proceeds of approximately $816 million, earning a pretax net gain of approximately $55 million. The proceeds from the sales were used to help fully pay down the secured term loan due in 2019. This transaction reflects an acceleration of the liquidation of the legacy real estate loan portfolio.
Liquidity and Capital Resources
As of March 31, 2014, the company had $764 million of cash and cash equivalents, in addition to $1 billion of cumulative available undrawn revolving loan capacity. The company had total outstanding debt of $11.7 billion at quarter-end, in a variety of debt instruments principally including $4.7 billion unsecured debt, $3.7 billion in mortgage securitizations and $3.3 billion in consumer loan securitizations. In March 2014, the company prepaid, without penalty or premium, the entire $750 million outstanding principal balance of the 2019 secured term loan, plus accrued and unpaid interest.
4 Excludes impact of one-time items related to fair value adjustments on debt.
5 Real Estate segment and Other Non-Core reflect historical accounting basis (which is a basis of accounting other than U.S. GAAP). Excludes impact of charges related to the sale of real estate loans and related trust assets, accelerated repayment / repurchase of debt, and fair value adjustments on debt.
2014 Guidance
The company has previously established 2014 guidance ranges for certain metrics related to its Core Consumer Operations. This quarter the company is revising its previously provided ranges as follows:
|
|
|
FY 2013(1) |
|
1Q14(2) |
|
2014 Guidance |
|
2014 Guidance |
|
|
Consumer Net Finance Receivables at YE
|
|
$3.14bn
|
|
$3.16bn
|
|
$3.60bn - $3.75bn
|
|
$3.60bn - $3.75bn
|
|
|
|
|
|
|
|
|
|
|
|
|
|
Consumer Yield |
|
25.84% |
|
26.93% |
|
26.75% - 27.25% |
|
27.00% - 27.50% |
|
|
|
|
|
|
|
|
|
|
|
|
|
Consumer Risk-Adjusted Yield(3)
|
|
22.03%
|
|
21.92%
|
|
22.00% - 23.00%
|
|
22.00% - 22.50%
|
|
|
|
|
|
|
|
|
|
|
|
|
|
Acquisitions & Servicing Pretax Income(4) |
|
$109mm |
|
$31mm |
|
$85mm - $105mm |
|
$95mm - $115mm |
|
(1) Net Finance Receivables represents data as of December 31, 2013. All other metrics represent data for the year ended December 31, 2013.
(2) Net Finance Receivables represents data as of March 31, 2014. All other metrics represent data for the quarter ended March 31, 2014.
(3) Risk Adjusted Yield = Yield less Net Charge-off rates. For FY 2013, charge-off rates exclude impact from change in charge-off policy, the sale of charged-off accounts in June 2013, and recovery sale buybacks in 3Q13 and 4Q13.
(4) Excludes impact of charges related to fair value adjustments on debt.
Use of Non-GAAP Measures
We report the operating results of our Core Consumer Operations, Non-Core Portfolio and Other Non-Core using the same accounting basis that we employed prior to 2010 when we were acquired by Fortress (the “Fortress Acquisition”), which we refer to as “historical accounting basis,” to provide a consistent basis for both management and other interested third parties to better understand our operating results. The historical accounting basis (which is a basis of accounting other than U.S. GAAP) also provides better comparability of the operating results of these segments to our competitors and other companies in the financial services industry. The historical accounting basis is not applicable to Acquisitions and Servicing since this segment resulted from the purchase of the SpringCastle Portfolio on April 1, 2013 and therefore, was not affected by the Fortress Acquisition.
Pretax Core Earnings is a key performance measure used by management in evaluating the performance of our Core Consumer Operations. Pretax Core Earnings represents our income (loss) before provision for (benefit from) income taxes on a historical accounting basis and excludes results of operations from our Non-Core Portfolio (legacy real estate loans) and other non-originating legacy operations, gains (losses) resulting from accelerated long-term debt
repayment and repurchases of long-term debt related to Consumer, gains (losses) on fair value adjustments on debt related to Core Consumer Operations (attributable to Springleaf) and results of operations attributable to non-controlling interests. Pretax Core Earnings provides us with a key measure of our Core Consumer Operations’ performance as it assists us in comparing its performance on a consistent basis. Management believes Pretax Core Earnings is useful in assessing the profitability of our core business and uses Pretax Core Earnings in evaluating our operating performance. Pretax Core Earnings is a non-GAAP measure and should be considered in addition to, but not as a substitute for or superior to, operating income, net income, operating cash flow, and other measures of financial performance prepared in accordance with U.S. GAAP.
Conference Call Information
Springleaf management will host a conference call and webcast to discuss the first quarter results and other general matters at 10:00 am Eastern on Wednesday, May 14, 2014. Both the call and webcast are open to the general public. The general public is invited to listen to the call by dialing 877-330-3668 (U.S. domestic), or 678-304-6859 (international), conference ID 30546448, or via a live audio webcast through the Investor Relations section of the website. For those unable to listen to the live broadcast, a replay will be available on our website or by dialing 800-585-8367 (U.S. domestic), or 404-537-3406, conference ID 30546448, beginning approximately two hours after the event. The replay of the conference call will be available through May 28, 2014. An investor presentation will be available by visiting the Investor Relations page of Springleaf’s website at www.springleaf.com on Wednesday, May 14, 2014, prior to the start of the conference call.
Forward Looking Statements
This press release contains “forward-looking statements” within the meaning of the U.S. federal securities laws. Forward-looking statements include, without limitation, statements concerning plans, objectives, goals, projections, strategies, future events or performance, our 2014 guidance ranges and underlying assumptions and other statements, which are not statements of historical facts. Statements preceded by, followed by or that otherwise include the words “anticipate,” “appears,” “believe,” “foresee,” “intend,” “should,” “expect,” “estimate,” “project,” “plan,” “may,” “could,” “will,” “are likely” and similar expressions are intended to identify forward-looking statements. These statements involve predictions of our future financial condition, performance, plans and strategies, and are thus dependent on a number of factors including, without limitation, assumptions and data that may be imprecise or incorrect.
Specific factors that may impact performance or other predictions of future actions include, but are not limited to: changes in general economic conditions, including the interest rate environment and the financial markets; levels of unemployment and personal bankruptcies; shifts in residential real estate values; shifts in collateral values, delinquencies, or credit losses; natural or accidental events such as earthquakes, hurricanes, tornadoes, fires, or floods; war, acts of terrorism, riots, civil disruption, pandemics, or other events disrupting business or commerce; our ability to successfully realize the benefits of the SpringCastle Portfolio; the effectiveness of our credit risk scoring models; changes in our ability to attract and retain employees or key executives; changes in the competitive environment in which we operate; changes in federal, state and local laws, regulations, or regulatory policies and practices; potential liability relating to real estate and personal loans which we have sold or may sell in the future, or relating to securitized loans; the costs and effects of any litigation or governmental inquiries or investigations; our continued ability to access the capital markets or the sufficiency of our current sources of funds to satisfy our cash flow requirements; our ability to generate sufficient cash to service all of our indebtedness; the potential for downgrade of our debt by rating agencies; and other risks described in the “Risk Factors” section of the Company’s Form 2013 10-K filed with the SEC on April 15, 2014. Forward-looking statements involve known and unknown risks, uncertainties and other factors which may cause the actual results, performance or achievements of the Company to be materially different from any future results, performance or achievements expressed or implied by such forward-looking statements. We caution you not to place undue reliance on these forward-looking statements that speak only as of the date they were made. We do not undertake any obligation to publicly release any revisions to these forward-looking statements to reflect events or circumstances after the date of this presentation or to reflect the occurrence of unanticipated events. You should not rely on forward looking statements as the sole basis upon which to make any investment decision.
CONSOLIDATED STATEMENTS OF OPERATIONS (UNAUDITED)
(dollars in thousands except earnings (loss) per share)
|
Three Months Ended March 31, |
|
2014 |
|
2013 |
| ||
|
|
|
|
|
|
| ||
|
Interest income |
|
$ |
552,637 |
|
$ |
413,038 |
|
|
|
|
|
|
|
| ||
|
Interest expense |
|
205,420 |
|
231,293 |
| ||
|
|
|
|
|
|
| ||
|
Net interest income |
|
347,217 |
|
181,745 |
| ||
|
|
|
|
|
|
| ||
|
Provision for finance receivable losses |
|
160,878 |
|
94,486 |
| ||
|
|
|
|
|
|
| ||
|
Net interest income after provision for |
|
|
|
|
| ||
|
finance receivable losses |
|
186,339 |
|
87,259 |
| ||
|
|
|
|
|
|
| ||
|
Other revenues: |
|
|
|
|
| ||
|
Insurance |
|
38,419 |
|
32,900 |
| ||
|
Investment |
|
9,461 |
|
10,124 |
| ||
|
Net loss on repurchases and repayments of debt |
|
(6,615 |
) |
- |
| ||
|
Net loss on fair value adjustments on debt |
|
(16,867 |
) |
(241 |
) | ||
|
Net gain on sales of real estate loans and related trust assets |
|
55,186 |
|
- |
| ||
|
Other |
|
1,820 |
|
873 |
| ||
|
Total other revenues |
|
81,404 |
|
43,656 |
| ||
|
|
|
|
|
|
| ||
|
Other expenses: |
|
|
|
|
| ||
|
Operating expenses: |
|
|
|
|
| ||
|
Salaries and benefits |
|
92,519 |
|
78,428 |
| ||
|
Other operating expenses |
|
57,709 |
|
51,610 |
| ||
|
Insurance losses and loss adjustment expenses |
|
18,365 |
|
14,754 |
| ||
|
Total other expenses |
|
168,593 |
|
144,792 |
| ||
|
|
|
|
|
|
| ||
|
Income (loss) before provision for (benefit from) income taxes |
|
99,150 |
|
(13,877 |
) | ||
|
|
|
|
|
|
| ||
|
Provision for (benefit from) income taxes |
|
30,518 |
|
(4,263 |
) | ||
|
|
|
|
|
|
| ||
|
Net income (loss) |
|
68,632 |
|
(9,614 |
) | ||
|
|
|
|
|
|
| ||
|
Net income attributable to non-controlling interests |
|
16,308 |
|
- |
| ||
|
|
|
|
|
|
| ||
|
Net income (loss) attributable to Springleaf Holdings, Inc. |
|
$ |
52,324 |
|
$ |
(9,614 |
) |
|
|
|
|
|
|
| ||
|
Share Data: |
|
|
|
|
| ||
|
Weighted average number of shares outstanding: |
|
|
|
|
| ||
|
Basic |
|
114,788,439 |
|
100,000,000 |
| ||
|
Diluted |
|
115,144,858 |
|
100,000,000 |
| ||
|
Earnings (loss) per share: |
|
|
|
|
| ||
|
Basic |
|
$ |
0.46 |
|
$ |
(0.10 |
) |
|
Diluted |
|
$ |
0.45 |
|
$ |
(0.10 |
) |
CORE KEY METRICS
(dollars in thousands)
|
At or for the Three Months Ended March 31, |
|
2014 |
|
2013 |
| ||
|
|
|
|
|
|
| ||
|
Consumer |
|
|
|
|
| ||
|
|
|
|
|
|
| ||
|
Net finance receivables |
|
$ |
3,159,163 |
|
$ |
2,558,787 |
|
|
Number of accounts |
|
826,703 |
|
717,307 |
| ||
|
|
|
|
|
|
| ||
|
Average net receivables |
|
$ |
3,138,022 |
|
$ |
2,546,829 |
|
|
|
|
|
|
|
| ||
|
Yield |
|
26.93 |
% |
25.39 |
% | ||
|
|
|
|
|
|
| ||
|
Gross charge-off ratio* |
|
5.56 |
% |
6.74 |
% | ||
|
Recovery ratio |
|
(0.55) |
% |
(1.27) |
% | ||
|
Charge-off ratio* |
|
5.01 |
% |
5.47 |
% | ||
|
|
|
|
|
|
| ||
|
Delinquency ratio |
|
2.45 |
% |
1.99 |
% | ||
|
|
|
|
|
|
| ||
|
Origination volume |
|
$ |
721,816 |
|
$ |
659,514 |
|
|
Number of accounts |
|
161,241 |
|
160,028 |
| ||
|
|
|
|
|
|
| ||
|
Acquisitions and Servicing |
|
|
|
|
| ||
|
|
|
|
|
|
| ||
|
Net finance receivables |
|
$ |
2,342,576 |
|
- |
| |
|
Number of accounts |
|
323,570 |
|
- |
| ||
|
|
|
|
|
|
| ||
|
Average net receivables |
|
$ |
2,425,968 |
|
- |
| |
|
|
|
|
|
|
| ||
|
Yield |
|
24.40 |
% |
- |
| ||
|
|
|
|
|
|
| ||
|
Net charge-off ratio |
|
8.67 |
% |
- |
| ||
|
|
|
|
|
|
| ||
|
Delinquency ratio |
|
6.33 |
% |
- |
| ||
* The gross charge-off ratio and charge-off ratio for the three months ended March 31, 2013 reflect $14.5 million of additional charge-offs recorded in March 2013 (on a historical accounting basis) related to our change in charge-off policy for personal loans effective March 31, 2013. Excluding these additional charge-offs, our Consumer gross charge-off ratio would have been 4.46% and our Consumer charge-off ratio would have been 3.18% for the three months ended March 31, 2013.
RECONCILIATION OF PGAAP AND HISTORICAL INCOME (LOSS) (NON-GAAP)
|
(dollars in thousands) |
|
|
|
|
| ||
|
|
|
|
|
|
| ||
|
Three Months Ended March 31, |
|
2014 |
|
2013 |
| ||
|
|
|
|
|
|
| ||
|
Income (loss) before provision for (benefit from) income taxes - push-down accounting basis |
|
$ |
99,150 |
|
$ |
(13,877 |
) |
|
Interest income adjustments |
|
(36,867 |
) |
(50,180 |
) | ||
|
Interest expense adjustments |
|
28,560 |
|
35,336 |
| ||
|
Provision for finance receivable losses adjustments |
|
360 |
|
3,450 |
| ||
|
Repurchases and repayments of long-term debt adjustments |
|
(4,884 |
) |
- |
| ||
|
Fair value adjustments on debt |
|
8,298 |
|
15,205 |
| ||
|
Sales of finance receivables held for sale originated as held for investment adjustments |
|
(117,362 |
) |
- |
| ||
|
Amortization of other intangible assets |
|
1,126 |
|
1,410 |
| ||
|
Other |
|
418 |
|
1,319 |
| ||
|
Loss before benefit from income taxes - historical accounting basis |
|
$ |
(21,201 |
) |
$ |
(7,337 |
) |
PRETAX CORE EARNINGS (NON-GAAP) RECONCILIATION
|
(dollars in thousands) |
|
|
|
|
| ||
|
|
|
|
|
|
| ||
|
Three Months Ended March 31, |
|
2014 |
|
2013 |
| ||
|
|
|
|
|
|
| ||
|
Loss before benefit from income taxes - historical accounting basis |
|
$ |
(21,201 |
) |
$ |
(7,337 |
) |
|
Adjustments: |
|
|
|
|
| ||
|
Pretax operating loss - Non-Core Portfolio Operations |
|
104,882 |
|
44,714 |
| ||
|
Pretax operating loss - Other/non-originating legacy operations |
|
2,751 |
|
2,854 |
| ||
|
Net loss from accelerated repayment/repurchase of debt - Consumer |
|
1,429 |
|
- |
| ||
|
Net loss on fair value adjustments on debt - Core Consumer Operations (attributable to Springleaf) |
|
7,927 |
|
- |
| ||
|
Pretax operating income attributable to non-controlling interests |
|
(16,308 |
) |
- |
| ||
|
Pretax core earnings |
|
$ |
79,480 |
|
$ |
40,231 |
|
Springleaf Holdings Inc.
Contact:
Craig Streem, 812-468-5752
craig.streem@springleaf.com
|
|
1Q 2014 Earnings Presentation Three Months Ended March 31, 2014 May 14, 2014 |

|
|
Important Information The following pages are part of a presentation by Springleaf Holdings, Inc. (the "Company") in connection with reporting quarterly financial results and are intended to be viewed as part of that presentation. No representation is made that the information in these pages are complete. For additional financial, statistical and business related information, as well as information regarding business and segment trends, see the earnings release and financial supplement included as exhibits to the Company's Current Report on Form 8-K, which was filed today and the Company’s 2013 Annual Report on Form 10-K, which was filed on April 15, 2014 with the Securities and Exchange Commission and are available on the Company's website (www.springleaf.com) and the SEC's website (www.sec.gov.). Forward Looking Statements This presentation contains “forward-looking statements” within the meaning of the U.S. federal securities laws. Forward-looking statements include, without limitation, statements concerning plans, objectives, goals, projections, strategies, future events or performance, our 2014 guidance ranges and underlying assumptions and other statements, which are not statements of historical facts. Statements preceded by, followed by or that otherwise include the words “anticipate,” “appears,” “believe,” “foresee,” “intend,” “should,” “expect,” “estimate,” “project,” “plan,” “may,” “could,” “will,” “are likely” and similar expressions are intended to identify forward-looking statements. These statements involve predictions of our future financial condition, performance, plans and strategies, and are thus dependent on a number of factors including, without limitation, assumptions and data that may be imprecise or incorrect. Specific factors that may impact performance or other predictions of future actions include, but are not limited to: changes in general economic conditions, including the interest rate environment and the financial markets; levels of unemployment and personal bankruptcies; shifts in residential real estate values; shifts in collateral values, delinquencies, or credit losses; natural or accidental events such as earthquakes, hurricanes, tornadoes, fires, or floods; war, acts of terrorism, riots, civil disruption, pandemics, or other events disrupting business or commerce; our ability to successfully realize the benefits of the SpringCastle Portfolio; the effectiveness of our credit risk scoring models; changes in our ability to attract and retain employees or key executives; changes in the competitive environment in which we operate; changes in federal, state and local laws, regulations, or regulatory policies and practices; potential liability relating to real estate and personal loans which we have sold or may sell in the future, or relating to securitized loans; the costs and effects of any litigation or governmental inquiries or investigations; our continued ability to access the capital markets or the sufficiency of our current sources of funds to satisfy our cash flow requirements; our ability to generate sufficient cash to service all of our indebtedness; the potential for downgrade of our debt by rating agencies; and other risks described in the “Risk Factors” section of the Company’s Form 10-K filed with the SEC on April 15, 2014. Forward-looking statements involve known and unknown risks, uncertainties and other factors which may cause the actual results, performance or achievements of the Company to be materially different from any future results, performance or achievements expressed or implied by such forward-looking statements. We caution you not to place undue reliance on these forward-looking statements that speak only as of the date they were made. We do not undertake any obligation to publicly release any revisions to these forward-looking statements to reflect events or circumstances after the date of this presentation or to reflect the occurrence of unanticipated events. You should not rely on forward looking statements as the sole basis upon which to make any investment decision. 2 |
|
|
3 Non-GAAP Financial Measures We present core earnings as a non-GAAP financial measure” in this presentation. This measure is derived on the basis of methodologies other than in accordance with accounting principles generally accepted in the United States of America Please refer to the Financial Supplement hereto for a quantitative reconciliation from historical pretax income (loss) to pretax core earnings. We also present our segment financial information on a historical accounting basis (which is a basis of accounting other than U.S. GAAP) in this presentation. This information represents a non-GAAP measure” which uses the same accounting basis that we employed prior to the Fortress Acquisition. This presentation provides a consistent basis to better understand our operating results. Please refer to the Financial Supplement hereto for quantitative reconciliations from our push-down accounting pretax income (loss) to our historical pretax income (loss) for the first quarter 2014 and the first and fourth quarter 2013. |

|
|
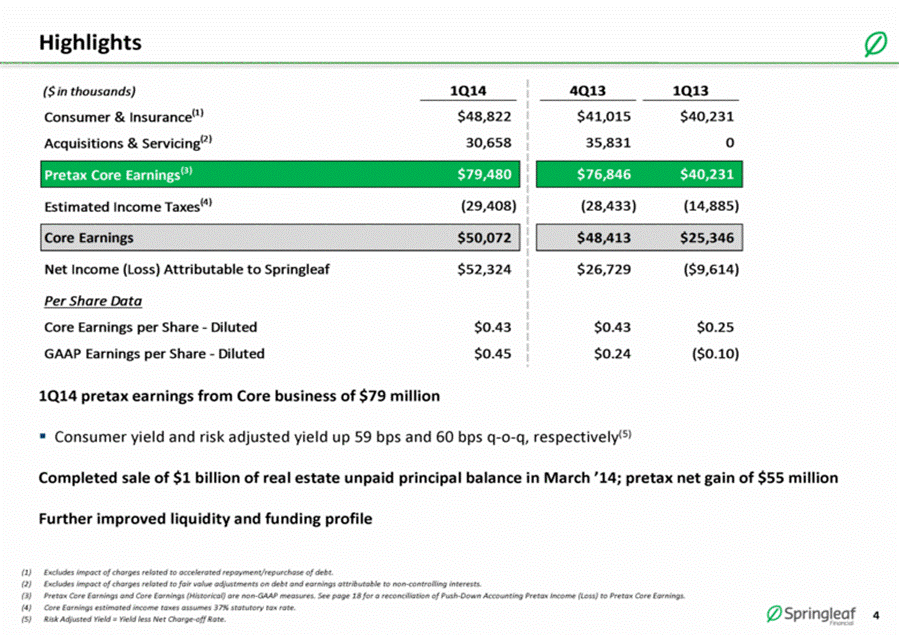
Highlights 1Q14 pretax earnings from Core business of $79 million Consumer yield and risk adjusted yield up 59 bps and 60 bps q-o-q, respectively(5) Completed sale of $1 billion of real estate unpaid principal balance in March ’14; pretax net gain of $55 million Further improved liquidity and funding profile Excludes impact of charges related to accelerated repayment/repurchase of debt. Excludes impact of charges related to fair value adjustments on debt and earnings attributable to non-controlling interests. Pretax Core Earnings and Core Earnings (Historical) are non-GAAP measures. See page 18 for a reconciliation of Push-Down Accounting Pretax Income (Loss) to Pretax Core Earnings. Core Earnings estimated income taxes assumes 37% statutory tax rate. Risk Adjusted Yield = Yield less Net Charge-off Rate. ($ in thousands) 1Q14 4Q13 1Q13 Consumer & Insurance (1) $48,822 $41,015 $40,231 Acquisitions & Servicing (2) 30,658 35,831 0 Pretax Core Earnings (3) $79,480 $76,846 $40,231 Estimated Income Taxes (4) (29,408) (28,433) (14,885) Core Earnings $50,072 $48,413 $25,346 Net Income (Loss) Attributable to Springleaf $52,324 $26,729 ($9,614) Per Share Data Core Earnings per Share - Diluted $0.43 $0.43 $0.25 GAAP Earnings per Share - Diluted $0.45 $0.24 ($0.10) |
|
|
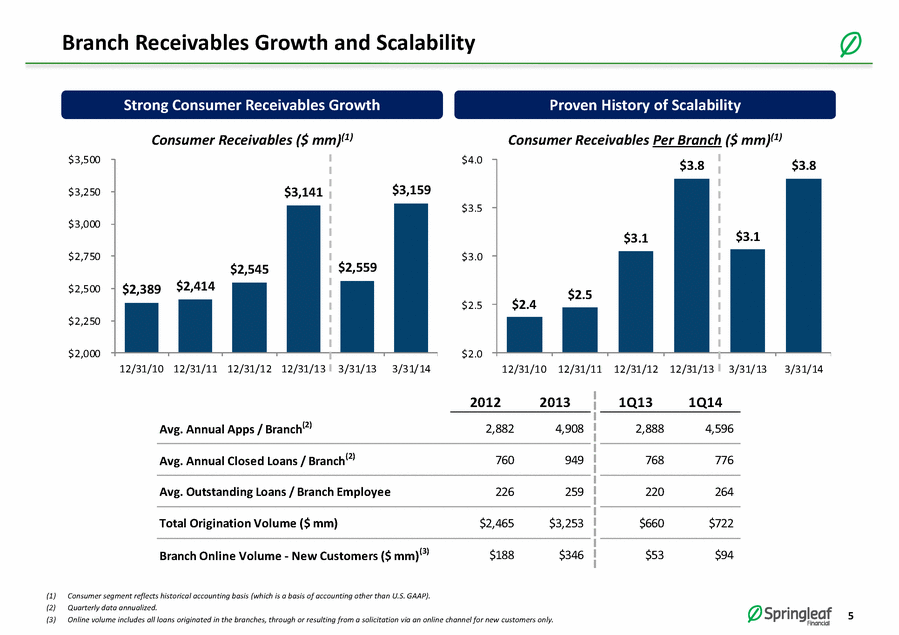
5 Branch Receivables Growth and Scalability Proven History of Scalability (1) Consumer segment reflects historical accounting basis (which is a basis of accounting other than U.S. GAAP). (2) Quarterly data annualized. (3) Online volume includes all loans originated in the branches, through or resulting from a solicitation via an online channel for new customers only. Consumer Receivables Per Branch ($ mm)(1) $2.4 $2.5 $3.1 $3.8 $3.1 $3.8 $2.0 $2.5 $3.0 $3.5 $4.0 12/31/10 12/31/11 12/31/12 12/31/13 3/31/13 3/31/14 2012 2013 1Q13 1Q14 Avg. Annual Apps / Branch(2) 2,882 4,908 2,888 4,596 Avg. Annual Closed Loans / Branch(2) 760 949 768 776 Avg. Outstanding Loans / Branch Employee 226 259 220 264 Total Origination Volume ($ mm) $2,465 $3,253 $660 $722 Branch Online Volume - New Customers ($ mm)(3) $188 $346 $53 $94 Strong Consumer Receivables Growth Consumer Receivables ($ mm)(1) $2,389 $2,414 $2,545 $3,141 $2,559 $3,159 $2,000 $2,250 $2,500 $2,750 $3,000 $3,250 $3,500 12/31/10 12/31/11 12/31/12 12/31/13 3/31/13 3/31/14 |
|
|
6 4.0% 3.6% 3.8% 3.2% 5.0% 5.0% 18.9% 20.5% 22.0% 22.2% 21.3% 21.9% 22.9% 24.1% 25.8% 25.4% 26.3% 26.9% 0.0% 5.0% 10.0% 15.0% 20.0% 25.0% 30.0% 2011 2012 2013 1Q13 4Q13 1Q14 Net Charge-off Ratio Risk Adjusted Yield Consumer Loan Performance Yield Continues to Trend Up (2) (1) Risk Adjusted Yield = Yield less Net Charge-off Rate. (2) Consumer segment reflects historical accounting basis (which is a basis of accounting other than U.S. GAAP). (3) Charge-off rate excludes impact from change in charge-off policy in March 2013, sale of charged-off accounts in June 2013 and recovery sale buybacks in 3Q13 and 4Q13. (4) Charge-off rate excludes impact from change in charge-off policy in March 2013. Risk adjusted yield has grown almost 1000 bps over the last 5 years, including an increase of 60 bps q-o-q(1) Enhanced analytics driving real time risk-adjusted pricing (4) (3) (3) Yield 22.9% 24.1% 25.8% 25.4% 26.3% 26.9% Charge-offs (4.0%) (3.6%) (3.8%) (3.2%) (5.0%) (5.0%) Risk-Adjusted Yield 18.9% 20.5% 22.0% 22.2% 21.3% 21.9% |

|
|
7 Acquisitions and Servicing (1) Excludes impact of one-time items related to the fair value adjustments on debt. (2) At purchase represents data at time of settlement on April 1, 2013. (3) Charge-off Rate calculated based on Principal Balance. SpringCastle Portfolio Pretax income for 1Q14 of $31 million(1); includes servicing fee income Life to date pretax income (12 months) of $140 million(1) Springleaf equity investment of $202 million at acquisition Continued favorable collateral performance SpringCastle Credit Performance Collateral & Funding Structure Avg. Charge-off Rate (%)(3) (2) 12.1% 10.3% 10.1% 9.0% 10.0% 11.0% 12.0% 13.0% At Purchase 4Q13 1Q14 At Purchase(2) 12/31/13 3/31/14 Principal Balance $3.8bn $3.2bn $3.0bn Wtd. Avg. Coupon 18.3% 18.3% 18.1% Accounts 415,000 344,000 324,000 Avg. Balance $9,500 $9,300 $9,300 Avg. Charge-off Rate(3) 12.1% 10.3% 10.1% Outstanding Debt (Class A&B) $2.6bn $2.0bn $1.8bn SpringCastle Portfolio has exhibited solid performance since April ’13 acquisition; servicing transferred in Sept ’13 |

|
|
8 Liquidity and Funding (1) Real Estate segment reflects historical accounting basis (which is a basis of accounting other than U.S. GAAP) (2) Includes SpringCastle debt and 2014-A consumer securitization. Strong and stable liquidity position $764 million cash and $1 billion committed undrawn funding capacity from 3 major banks Prepaid $750 million secured term loan due 2019 Completed $559 million consumer securitization in March 2014 (COF: 2.62%); strong investor demand Driving down weighted average cost of funds to 5.38% in 1Q14, down 10 bps from FY 2013(1,2) Completed sale of $1 billion of real estate unpaid principal balance Real estate net finance receivables of $8.1 billion as of 3/31/14, down $2.2 billion since 3/31/13 41% 28% 31% Total Debt: $11.7bn Diverse Funding Sources Consumer Securitizations(2) Mortgage Securitizations Unsecured / Hybrid Legacy Real Estate Segment Portfolio Run-off $13,327 $11,858 $10,553 $9,336 $8,083 $0 $3,000 $6,000 $9,000 $12,000 $15,000 12/31/10 12/31/11 12/31/12 12/31/13 3/31/14 Real Estate Receivables ($ mm)(1) March 2014: Sale of $1bn RE UPB |

|
|
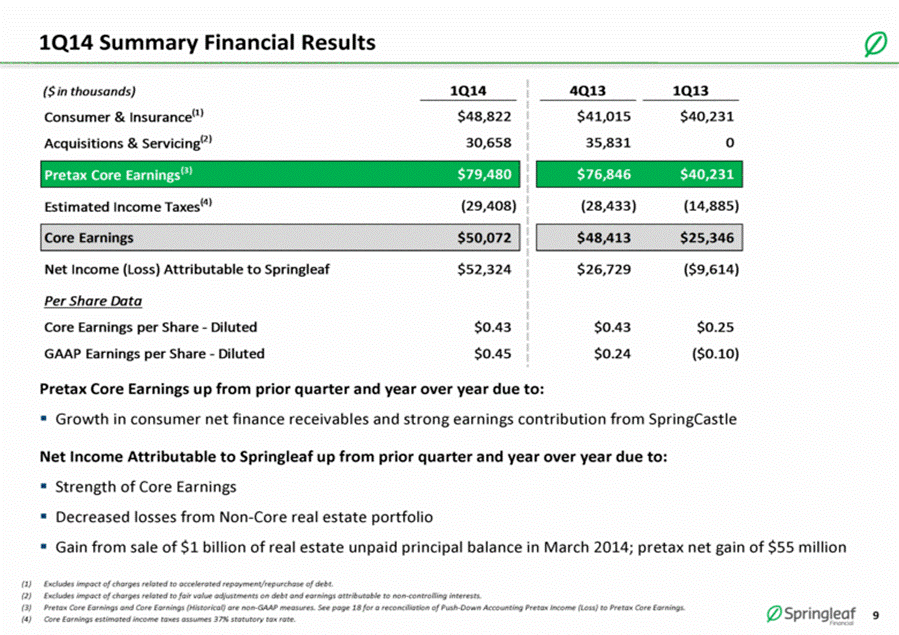
1Q14 Summary Financial Results Pretax Core Earnings up from prior quarter and year over year due to: Growth in consumer net finance receivables and strong earnings contribution from SpringCastle Net Income Attributable to Springleaf up from prior quarter and year over year due to: Strength of Core Earnings Decreased losses from Non-Core real estate portfolio Gain from sale of $1 billion of real estate unpaid principal balance in March 2014; pretax net gain of $55 million Excludes impact of charges related to accelerated repayment/repurchase of debt. Excludes impact of charges related to fair value adjustments on debt and earnings attributable to non-controlling interests. Pretax Core Earnings and Core Earnings (Historical) are non-GAAP measures. See page 18 for a reconciliation of Push-Down Accounting Pretax Income (Loss) to Pretax Core Earnings. Core Earnings estimated income taxes assumes 37% statutory tax rate. ($ in thousands) 1Q14 4Q13 1Q13 Consumer & Insurance (1) $48,822 $41,015 $40,231 Acquisitions & Servicing (2) 30,658 35,831 0 Pretax Core Earnings (3) $79,480 $76,846 $40,231 Estimated Income Taxes (4) (29,408) (28,433) (14,885) Core Earnings $50,072 $48,413 $25,346 Net Income (Loss) Attributable to Springleaf $52,324 $26,729 ($9,614) Per Share Data Core Earnings per Share - Diluted $0.43 $0.43 $0.25 GAAP Earnings per Share - Diluted $0.45 $0.24 ($0.10) |
|
|
10 2014 Updated Guidance (1) Net Finance Receivables represents targeted range at 2014 year end; all other metrics represent targeted ranges for the full year 2014. (2) Risk Adjusted Yield = Yield less Net Charge-off Rate. Core Consumer Operations(1) FY 2014E Range Guidance as of 12/31/13 Guidance as of 3/31/14 Consumer Net Finance Receivables $3.60bn $3.75bn $3.60bn $3.75bn Consumer Yield 26.75% 27.25% 27.00% 27.50% Consumer Risk Adjusted Yield(2) 22.00% 23.00% 22.00% 22.50% Acquisitions & Servicing Pretax Income $85mm $105mm $95mm $115mm |

|
|
11 Financial Supplement |

|
|
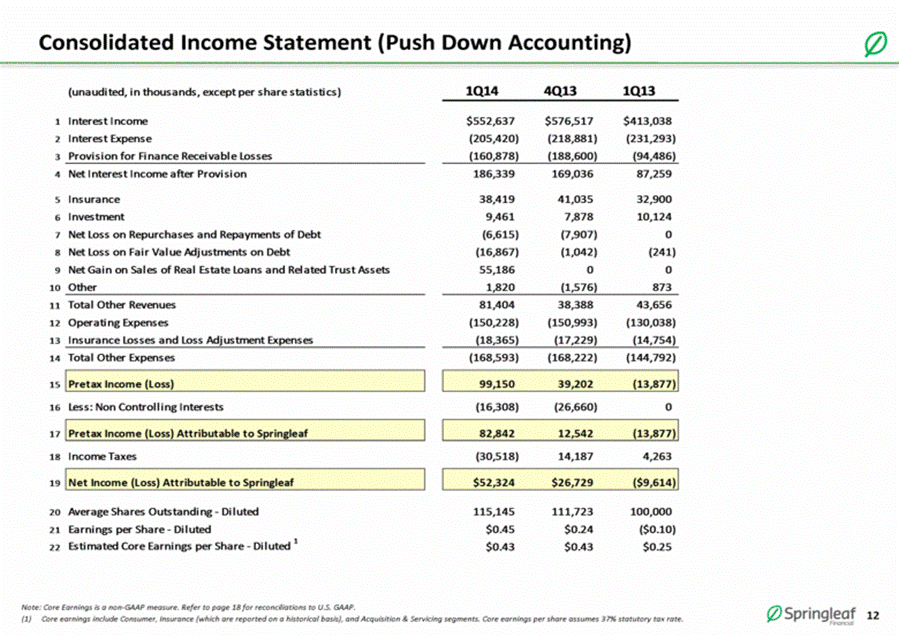
Consolidated Income Statement (Push Down Accounting) Note: Core Earnings is a non-GAAP measure. Refer to page 18 for reconciliations to U.S. GAAP. Core earnings include Consumer, Insurance (which are reported on a historical basis), and Acquisition & Servicing segments. Core earnings per share assumes 37% statutory tax rate. (unaudited, in thousands, except per share statistics) 1Q14 4Q13 1Q13 1 Interest Income $552,637 $576,517 $413,038 2 Interest Expense (205,420) (218,881) (231,293) 3 Provision for Finance Receivable Losses (160,878) (188,600) (94,486) 4 Net Interest Income after Provision 186,339 169,036 87,259 5 Insurance 38,419 41,035 32,900 6 Investment 9,461 7,878 10,124 7 Net Loss on Repurchases and Repayments of Debt (6,615) (7,907) 0 8 Net Loss on Fair Value Adjustments on Debt (16,867) (1,042) (241) 9 Net Gain on Sales of Real Estate Loans and Related Trust Assets 55,186 0 0 10 Other 1,820 (1,576) 873 11 Total Other Revenues 81,404 38,388 43,656 12 Operating Expenses (150,228) (150,993) (130,038) 13 Insurance Losses and Loss Adjustment Expenses (18,365) (17,229) (14,754) 14 Total Other Expenses (168,593) (168,222) (144,792) 15 Pretax Income (Loss) 99,150 39,202 (13,877) 16 Less: Non Controlling Interests (16,308) (26,660) 0 17 Pretax Income (Loss) Attributable to Springleaf 82,842 12,542 (13,877) 18 Income Taxes (30,518) 14,187 4,263 19 Net Income (Loss) Attributable to Springleaf $52,324 $26,729 ($9,614) 20 Average Shares Outstanding - Diluted 115,145 111,723 100,000 21 Earnings per Share - Diluted $0.45 $0.24 ($0.10) 22 Estimated Core Earnings per Share - Diluted 1 $0.43 $0.43 $0.25 |
|
|
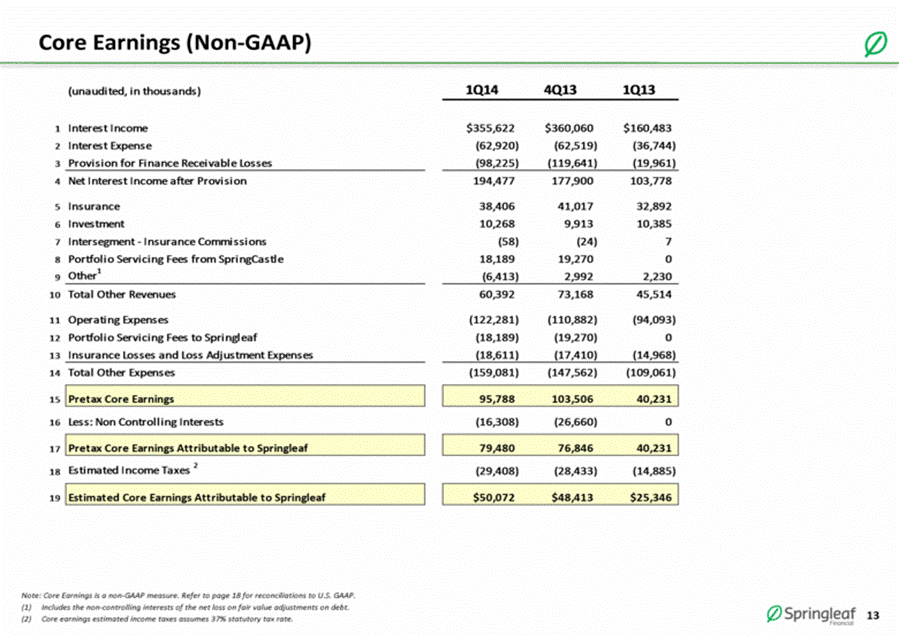
Core Earnings (Non-GAAP) Note: Core Earnings is a non-GAAP measure. Refer to page 18 for reconciliations to U.S. GAAP. Includes the non-controlling interests of the net loss on fair value adjustments on debt. Core earnings estimated income taxes assumes 37% statutory tax rate. (unaudited, in thousands) 1Q14 4Q13 1Q13 1 Interest Income $355,622 $360,060 $160,483 2 Interest Expense (62,920) (62,519) (36,744) 3 Provision for Finance Receivable Losses (98,225) (119,641) (19,961) 4 Net Interest Income after Provision 194,477 177,900 103,778 5 Insurance 38,406 41,017 32,892 6 Investment 10,268 9,913 10,385 7 Intersegment - Insurance Commissions (58) (24) 7 8 Portfolio Servicing Fees from SpringCastle 18,189 19,270 0 9 Other 1 (6,413) 2,992 2,230 10 Total Other Revenues 60,392 73,168 45,514 11 Operating Expenses (122,281) (110,882) (94,093) 12 Portfolio Servicing Fees to Springleaf (18,189) (19,270) 0 13 Insurance Losses and Loss Adjustment Expenses (18,611) (17,410) (14,968) 14 Total Other Expenses (159,081) (147,562) (109,061) 15 Pretax Core Earnings 95,788 103,506 40,231 16 Less: Non Controlling Interests (16,308) (26,660) 0 17 Pretax Core Earnings Attributable to Springleaf 79,480 76,846 40,231 18 Estimated Income Taxes 2 (29,408) (28,433) (14,885) 19 Estimated Core Earnings Attributable to Springleaf $50,072 $48,413 $25,346 |
|
|
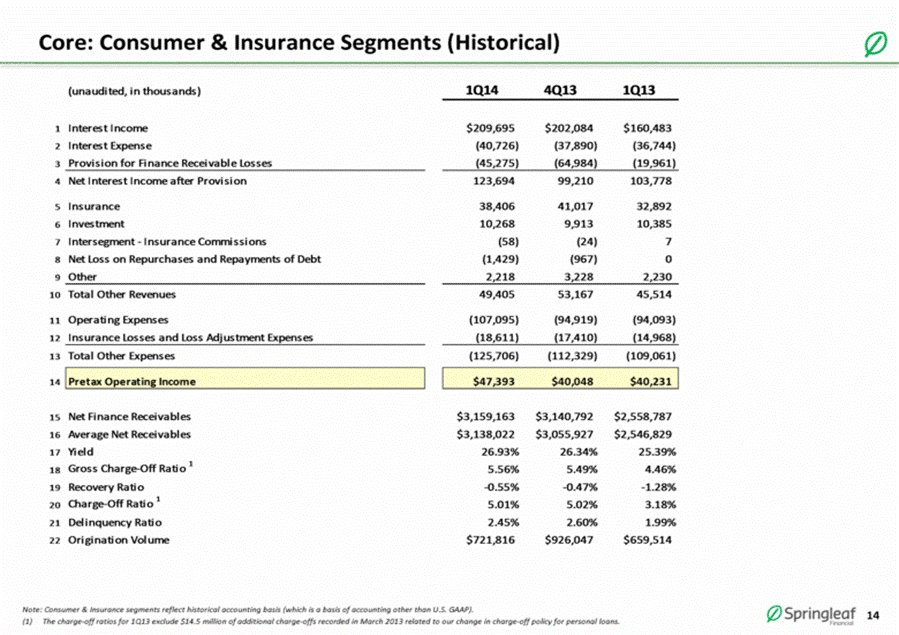
Core: Consumer & Insurance Segments (Historical) Note: Consumer & Insurance segments reflect historical accounting basis (which is a basis of accounting other than U.S. GAAP). The charge-off ratios for 1Q13 exclude $14.5 million of additional charge-offs recorded in March 2013 related to our change in charge-off policy for personal loans. (unaudited, in thousands) 1Q14 4Q13 1Q13 1 Interest Income $209,695 $202,084 $160,483 2 Interest Expense (40,726) (37,890) (36,744) 3 Provision for Finance Receivable Losses (45,275) (64,984) (19,961) 4 Net Interest Income after Provision 123,694 99,210 103,778 5 Insurance 38,406 41,017 32,892 6 Investment 10,268 9,913 10,385 7 Intersegment - Insurance Commissions (58) (24) 7 8 Net Loss on Repurchases and Repayments of Debt (1,429) (967) 0 9 Other 2,218 3,228 2,230 10 Total Other Revenues 49,405 53,167 45,514 11 Operating Expenses (107,095) (94,919) (94,093) 12 Insurance Losses and Loss Adjustment Expenses (18,611) (17,410) (14,968) 13 Total Other Expenses (125,706) (112,329) (109,061) 14 Pretax Operating Income $47,393 $40,048 $40,231 15 Net Finance Receivables $3,159,163 $3,140,792 $2,558,787 16 Average Net Receivables $3,138,022 $3,055,927 $2,546,829 17 Yield 26.93% 26.34% 25.39% 18 Gross Charge-Off Ratio 1 5.56% 5.49% 4.46% 19 Recovery Ratio -0.55% -0.47% -1.28% 20 Charge-Off Ratio 1 5.01% 5.02% 3.18% 21 Delinquency Ratio 2.45% 2.60% 1.99% 22 Origination Volume $721,816 $926,047 $659,514 |
|
|
15 Core: Acquisitions & Servicing Segment (1) Springleaf incurs 47% of servicing expenses. The remaining 53% is netted through non-controlling interests. (2) Principal Balance is a non-GAAP measure. (unaudited, in thousands) 1Q14 4Q13 1 Interest Income $145,927 $157,976 2 Interest Expense (22,194) (24,629) 3 Provision for Finance Receivable Losses (52,950) (54,657) 4 Net Interest Income after Provision 70,783 78,690 5 Portfolio Servicing Fees from SpringCastle 18,189 19,270 6 Net Loss on Fair Value Adjustments on Debt (16,867) (1,085) 7 Other 309 339 8 Total Other Revenues 1,631 18,524 9 Operating Expenses (15,186) (15,963) 10 Portfolio Servicing Fees to Springleaf 1 (18,189) (19,270) 11 Total Other Expenses (33,375) (35,233) 12 Pretax Operating Income 39,039 61,981 13 Less: Non Controlling Interests 1 (16,308) (26,660) 14 Pretax Operating Income Attributable to Springleaf $22,731 $35,321 15 Net Finance Receivables $2,342,576 $2,505,349 16 Average Net Receivables $2,425,968 $2,576,495 17 Principal Balance 2 $3,013,781 $3,207,090 18 Yield 24.40% 24.33% |

|
|
16 Non-Core: Real Estate Segment (Historical) Note: Real Estate segment reflects historical accounting basis (which is a basis of accounting other than U.S. GAAP). (1) The loss ratio for 1Q14 excludes $2.2 million of recoveries on charged-off real estate loans resulting from a sale of our previously charged-off real estate loans in March 2014, net of $0.2 million reserve for subsequent buybacks. (unaudited, in thousands) 1Q14 4Q13 1Q13 1 Interest Income $155,044 $162,746 $187,031 2 Interest Expense (111,797) (118,658) (154,379) 3 Provision - TDR (45,141) (42,733) (48,131) 4 Provision - Non-TDR (16,187) (23,687) (21,951) 5 Net Interest Income after Provision (18,081) (22,332) (37,430) 6 Intersegment - Insurance Commissions 70 33 28 7 Net Loss on Repurchases and Repayments of Debt (10,023) (10,967) 0 8 Net Gain on Fair Value Adjustments on Debt 8,298 11,462 14,964 9 Net Loss on Sales of Real Estate Loans and Related Trust Assets (62,176) 0 0 10 Other (1,351) (2,771) (1,149) 11 Total Other Revenues (65,182) (2,243) 13,843 12 Operating Expenses (21,619) (20,229) (21,127) 13 Total Other Expenses (21,619) (20,229) (21,127) 14 Pretax Operating Loss ($104,882) ($44,804) ($44,714) 15 Net Finance Receivables $8,083,432 $9,335,357 $10,254,900 16 Average Net Receivables $9,048,824 $9,469,892 $10,404,039 17 TDR Finance Receivables $3,048,969 $3,263,249 $2,927,489 18 Loss Ratio 1 1.72% 2.39% 1.94% 19 Delinquency Ratio 8.32% 8.04% 7.54% |

|
|
17 Non-Core: Other (Historical) Note: Other reflects historical accounting basis (which is a basis of accounting other than U.S. GAAP). (unaudited, in thousands) 1Q14 4Q13 1Q13 1 Interest Income $5,104 $7,735 $15,344 2 Interest Expense (2,143) (2,806) (4,834) 3 Provision for Finance Receivable Losses (965) (3,185) (993) 4 Net Interest Income after Provision 1,996 1,744 9,517 5 Insurance 16 22 20 6 Investment 29 125 1,286 7 Intersegment - Insurance Commissions (12) (9) (35) 8 Net Loss on Repurchases and Repayments of Debt (47) (94) 0 9 Other 644 (2,143) 73 10 Total Other Revenues 630 (2,099) 1,344 11 Operating Expenses (5,377) (19,135) (13,715) 12 Total Other Expenses (5,377) (19,135) (13,715) 13 Pretax Operating Loss ($2,751) ($19,490) ($2,854) 14 Net Finance Receivables $123,055 $148,642 $287,178 |

|
|
Reconciliation – Push-Down Accounting to Historical / Pretax Core Earnings Pretax earnings attributable to Springleaf Holdings, Inc. (SHI), which excludes non-controlling interests. (unaudited, in thousands) 1Q14 4Q13 1Q13 1 Push-Down Accounting Pretax Income (Loss) Attributable to Springleaf 1 $82,842 $12,542 ($13,877) 2 Interest Income (36,867) (45,976) (50,180) 3 Interest Expense 28,560 34,898 35,336 4 Provision for Finance Receivable Losses 360 (646) 3,450 5 Net Interest Income after Provision (7,947) (11,724) (11,394) 6 Insurance 3 4 12 7 Investment 836 2,160 1,547 8 Net Gain on Repurchases and Repayments of Debt (4,884) (4,121) 0 9 Net Loss on Fair Value Adjustments on Debt 8,298 11,419 15,205 10 Net Gain on Sales of Real Estate Loans and Related Trust Assets (117,362) 0 0 11 Other 0 229 281 12 Total Other Revenues (113,109) 9,691 17,045 13 Operating Expenses 951 747 1,103 14 Insurance Losses and Loss Adjustment Expenses (246) (181) (214) 15 Total Other Expenses 705 566 889 16 Historical Pretax Income (Loss) Attributable to Springleaf 1 ($37,509) $11,075 ($7,337) |

|
|
19 Appendix: Consumer Loan Credit Performance Charge-off Trends(1) (1) Consumer segment reflects historical accounting basis (which is a basis of accounting other than U.S. GAAP). (2) The net charge-off ratio for 1Q13 excludes $14.5 million of additional charge-offs recorded in March 2013 related to our change in charge-off policy for personal loans. (3) The net charge-off ratio for 2013 excludes $22.7 million of recoveries on charged-off personal loans resulting from a sale of our charged-off finance receivables in June 2013, net of a $2.7 million adjustment for the subsequent buyback of certain personal loans. Gross Charge-off Recovery Net Charge-off Ratio (2) Gross Charge-off Net Charge-off Recovery 4.2% 3.8% 3.6% 4.3% 3.7% 2.7% 2.9% 4.5% 3.2% 3.2% 3.8% 5.0% 5.0% 5.5% 5.3% 4.8% 5.6% 4.5% 5.5% 5.6% 1.3% 1.0% 1.1% 1.2% 1.3% 0.5% 0.6% 0.0% 1.5% 3.0% 4.5% 6.0% 7.5% 1Q11 2Q11 3Q11 4Q11 1Q12 2Q12 3Q12 4Q12 1Q13 2Q13 3Q13 4Q13 1Q14 (3) (3) (3) June 2013: Sale of C/O Accounts |
