Attached files
| file | filename |
|---|---|
| 8-K - 8-K - HollyFrontier Corp | hfc-form8xkasmpresentation.htm |
Annual Shareholder Meeting May 14, 2014

2
3

Agenda 4 1. Financial Performance 2. Margin Environment 3. Margin Drivers 4. Total Shareholder Returns 5. Cash Distribution Strategy 6. Strategic Accomplishments 7. 2014 Outlook

5 2013 Financial Performance 2013 EPS -57% vs 2012 2013 Net Income -57% vs 2012 2013 EBITDA -51% vs 2012 $0 $2 $4 $6 $8 $10 2012 2013 $8.38 $3.64 EPS $0 $500 $1,000 $1,500 $2,000 2012 2013 $1,727 $736 Net Income $0 $1,000 $2,000 $3,000 $4,000 2012 2013 $3,097 $1,515 EBITDA

6 Margin Environment Margins above 5-year average range the first half of 2013 across all regions before declining to 5 year low levels for the second half of the year 2013 MidCon 321 Crack Spread 32% below 2012 2013 MidCon 321 Crack Spread $22.30 2012 MidCon 321 Crack Spread $32.59
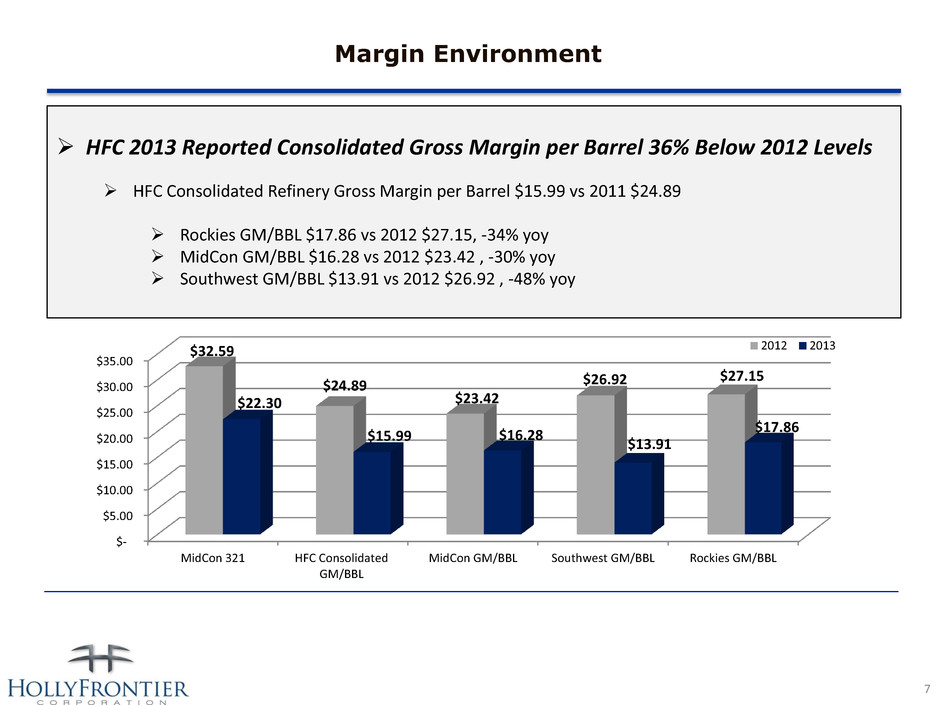
7 Margin Environment HFC 2013 Reported Consolidated Gross Margin per Barrel 36% Below 2012 Levels HFC Consolidated Refinery Gross Margin per Barrel $15.99 vs 2011 $24.89 Rockies GM/BBL $17.86 vs 2012 $27.15, -34% yoy MidCon GM/BBL $16.28 vs 2012 $23.42 , -30% yoy Southwest GM/BBL $13.91 vs 2012 $26.92 , -48% yoy $- $5.00 $10.00 $15.00 $20.00 $25.00 $30.00 $35.00 MidCon 321 HFC Consolidated GM/BBL MidCon GM/BBL Southwest GM/BBL Rockies GM/BBL $32.59 $24.89 $23.42 $26.92 $27.15 $22.30 $15.99 $16.28 $13.91 $17.86 2012 2013
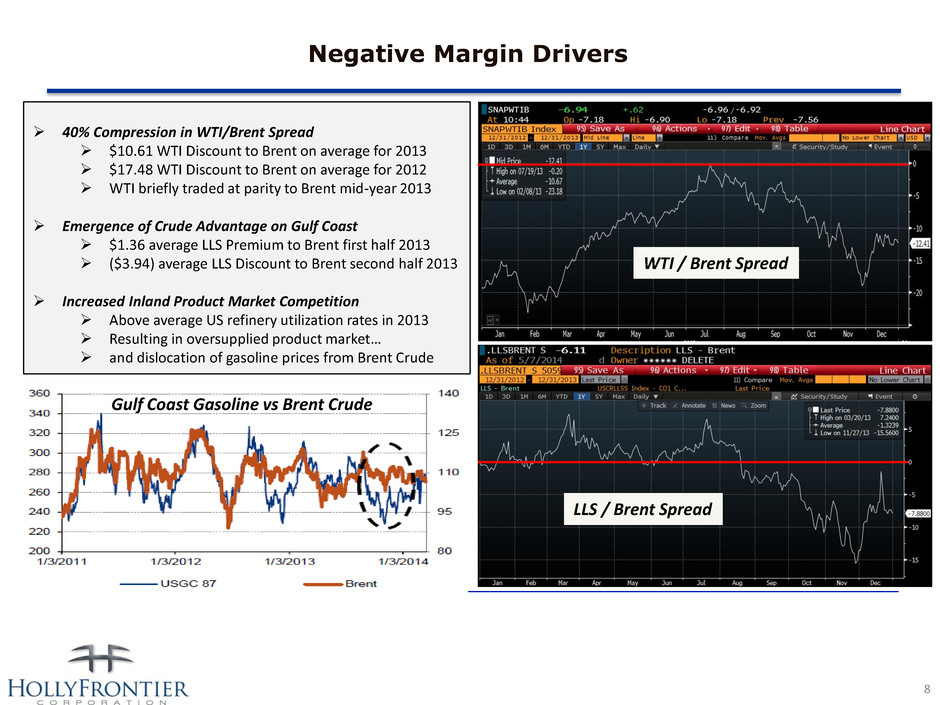
8 Negative Margin Drivers 40% Compression in WTI/Brent Spread $10.61 WTI Discount to Brent on average for 2013 $17.48 WTI Discount to Brent on average for 2012 WTI briefly traded at parity to Brent mid-year 2013 Emergence of Crude Advantage on Gulf Coast $1.36 average LLS Premium to Brent first half 2013 ($3.94) average LLS Discount to Brent second half 2013 Increased Inland Product Market Competition Above average US refinery utilization rates in 2013 Resulting in oversupplied product market… and dislocation of gasoline prices from Brent Crude WTI / Brent Spread LLS / Brent Spread Gulf Coast Gasoline vs Brent Crude

-10% 0% 10% 20% 30% 40% 50% 60% WNR VLO MPC PSX DK TSO HFC PBF ALJ 53% 50% 48% 48% 40% 35% 14% 12% -6% Full Year 2013 Performance Price Appreciation Total Return Total 2013 Shareholder Return 9 HFC Total 2013 Share Price Appreciation 7% Compared to Sector Average 29% 12/31/12 Stock Price $46.55 12/31/13 Stock Price $49.69 HFC Total 2013 Shareholder Return 14% Compared to Sector Average 33% $3.20 per share cash dividends paid in 2013 **HFC split adjusted * FY 2013 calculated off closing prices from 12/31/2012 and 12/31/2013
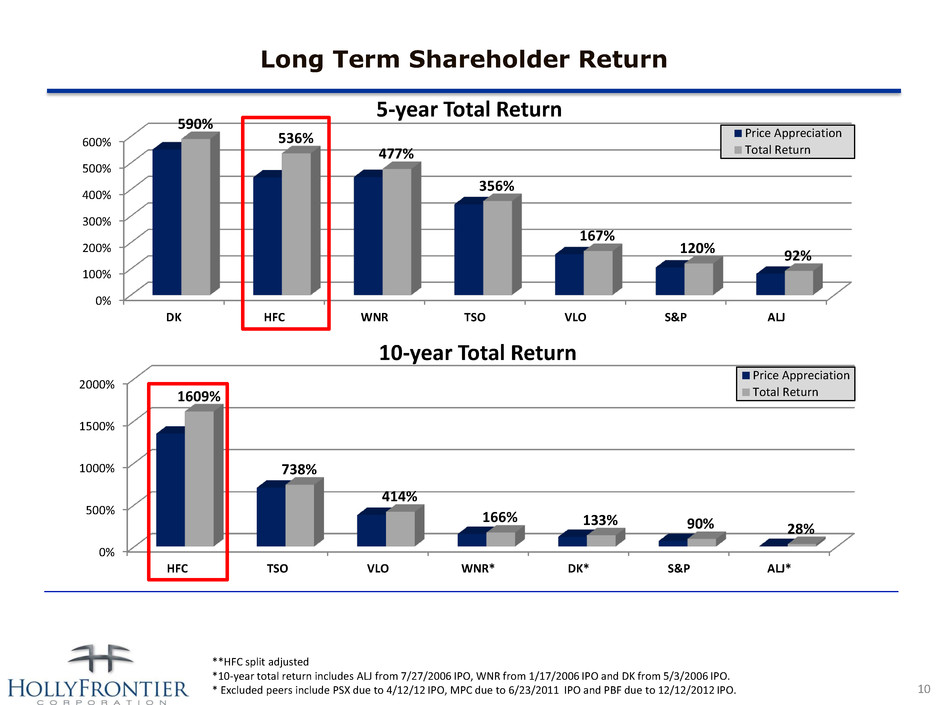
0% 100% 200% 300% 400% 500% 600% DK HFC WNR TSO VLO S&P ALJ 590% 536% 477% 356% 167% 120% 92% 5-year Total Return Price Appreciation Total Return 0% 500% 1000% 1500% 2000% HFC TSO VLO WNR* DK* S&P ALJ* 1609% 738% 414% 166% 133% 90% 28% 10-year Total Return Price Appreciation Total Return Long Term Shareholder Return 10 **HFC split adjusted *10-year total return includes ALJ from 7/27/2006 IPO, WNR from 1/17/2006 IPO and DK from 5/3/2006 IPO. * Excluded peers include PSX due to 4/12/12 IPO, MPC due to 6/23/2011 IPO and PBF due to 12/12/2012 IPO.
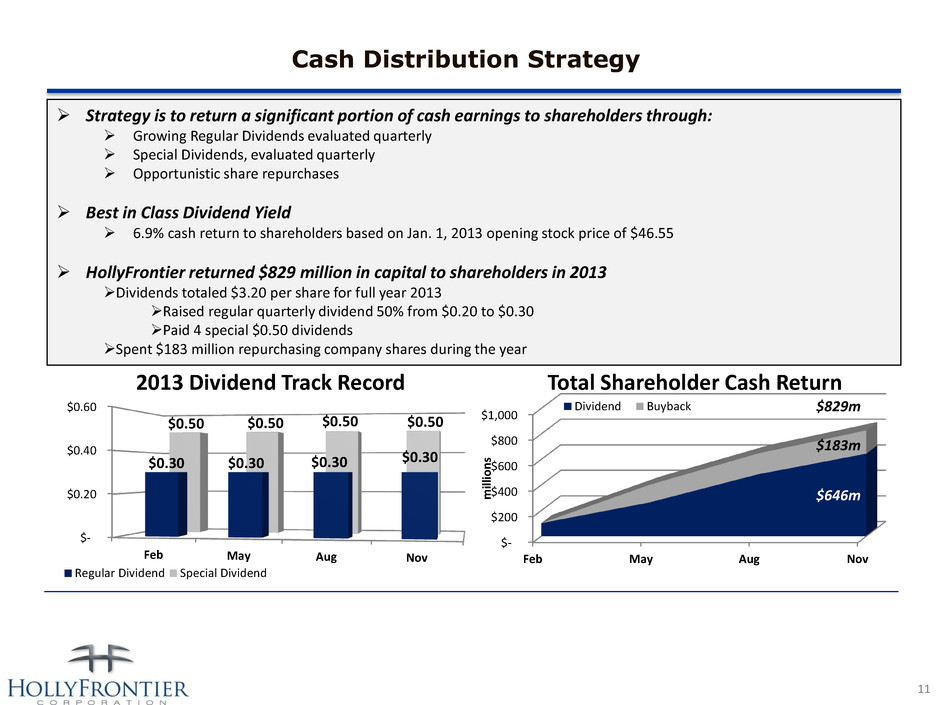
Cash Distribution Strategy 11 Strategy is to return a significant portion of cash earnings to shareholders through: Growing Regular Dividends evaluated quarterly Special Dividends, evaluated quarterly Opportunistic share repurchases Best in Class Dividend Yield 6.9% cash return to shareholders based on Jan. 1, 2013 opening stock price of $46.55 HollyFrontier returned $829 million in capital to shareholders in 2013 Dividends totaled $3.20 per share for full year 2013 Raised regular quarterly dividend 50% from $0.20 to $0.30 Paid 4 special $0.50 dividends Spent $183 million repurchasing company shares during the year $- $0.20 $0.40 $0.60 Feb May Aug Nov $0.30 $0.30 $0.30 $0.30 $0.50 $0.50 $0.50 $0.50 2013 Dividend Track Record Regular Dividend Special Dividend $- $200 $400 $600 $800 $1,000 Feb May Aug Nov m ill io n s Total Shareholder Cash Return Dividend Buyback $646m $183m $829m

12 Goal of Generating High Long-Term Return on Capital Employed 10-year average ROCE of 27% 20-year average ROCE of 20% 10 and 20 year average ROCE calculated by taking the average of ROCE’s for the years 1994-2013. ROCE calculated by dividing net income by the sum of total debt and shareholder capital. For HFC pre-merger, legacy HOC/FTO earnings, debt and equity were combined. FTO legacy financials adjusted for LIFO accounting change in relevant years. -5% 5% 15% 25% 35% 45% 55% 65% ROCE 20-year average 10-year average

13 2013 Strategic Accomplishments Improved Health and Safety Performance 28% reduction in safety events 37% reduction in process safety incidents Debt Redemption – May 2013 Redeemed all outstanding 9.875% Senior Notes Due 2017 Woods Cross Expansion Project: Permit and Ground Breaking – Expected completion late 2015 Refinery expansion from 31,000 BPD to 45,000 BPP Incremental production to flow down UNEV pipeline to Las Vegas which trades at seasonal premium El Dorado Naphtha Fractionation: Ground Breaking – Expected completion Spring 2015 Improves liquid yields reducing byproducts such as fuel gas, propane and butane Approximately $95 million project with an estimated 3 year payback Holly Energy Partner’s Crude Gathering System Expansion: Announcement – Expected completion August 2014 Expanding New Mexico crude gathering capacity from 30,000 BPD to 100,000 BPD Expansion project improves the Navajo Refinery’s crude supply flexibility and provides connections to major clearing points

14 2014 Outlook Continued Focus on Safety and Reliability Strategic Capital Deployment Broaden Marketing Footprint Continuation of Cash Distribution Strategy

15 Data 12/31/2008 12/31/2013 Dividend ALJ 9.15$ 16.54$ 1.02$ PSX* 34.00$ 77.13$ 1.78$ DK 5.29$ 34.41$ 2.09$ HFC 9.11$ 49.69$ 8.24$ MPC* 39.00$ 91.73$ 3.19$ TSO 13.17$ 58.50$ 1.52$ VLO 19.77$ 50.40$ 2.43$ PBF* 26.00$ 31.46$ 1.20$ WNR 7.76$ 42.41$ 2.38$ S&P 903.25$ 1,848.36$ 137.80$ 5-year Total Return: 2009-2013 1 /31/2003 12/31/2013 Dividend ALJ* 16.00$ 16.54$ 4.00$ PSX* 34.00$ 77.13$ 1.78$ DK* 16.00$ 34.41$ 2.83$ HFC 3.44$ 49.69$ 9.09$ MPC* 39.00$ 91.73$ 3.19$ TSO 7.29$ 58.50$ 2.57$ VLO 10.58$ 50.40$ 3.97$ PBF* 26.00$ 31.46$ 1.20$ WNR* 17.00$ 42.41$ 2.82$ S&P 1,111.92$ 1,848.36$ 260.46$ 10-year Total Return: 2004-2013 HollyFrontier 2013 2012 2011 2010 2009 2008 2007 2006 2005 2004 Net Income 735,842 1,727,172 1,023,397 103,964 19,533 126,636 334,128 266,566 167,658 83,879 LT Debt (ex HEP) 189,889 471,565 688,882 328,290 328,260 - - - - 25,000 Shareh ld Equity 5,999,620 6,052,954 5,835,900 1,288,139 1,207,781 541,540 593,794 466,094 377,351 339,916 ROCE 11.89% 26.47% 15.68% 6.43% 1.27% 23.38% 56.27% 57.19% 44.43% 22.99% HollyFrontier 2003 2002* 2001 2000 1999 1998 1997 1996 1995 1994 Net Income 46,053 18,825 73,450 11,445 19,937 15,167 13,087 19,234 18,120 20,717 LT Debt (ex HEP) 8,571 17,143 34,286 42,857 56,595 70,341 75,516 86,290 54,565 68,840 Shareholder Equity 268,609 228,494 201,734 129,581 128,880 114,349 105,121 96,243 80,043 64,772 ROCE 16.61% 7.66% 31.12% 6.64% 10.75% 8.21% 7.24% 10.54% 13.46% 15.51%
