Attached files
UNITED STATES
SECURITIES AND EXCHANGE COMMISSION
Washington, D.C. 20549
FORM 10-Q
|
[x] |
QUARTERLY REPORT PURSUANT TO SECTION 13 OR 15(d) OF THE SECURITIES EXCHANGE ACT OF 1934 |
|
|
|
For the quarterly period ended March 31, 2014
OR
|
[ ] |
TRANSITION REPORT PURSUANT TO SECTION 13 OR 15(d) OF THE SECURITIES EXCHANGE ACT OF 1934 |
For the transition period from __________ to __________
Commission File Number: 000-54755
CĪON Investment Corporation
(Exact name of registrant as specified in its charter)
|
Maryland |
|
45-3058280 |
|||
|
(State or other jurisdiction of incorporation or organization) |
|
(I.R.S. Employer Identification No.) |
|||
|
3 Park Avenue, 36th
Floor |
|
10016 |
|||
|
(Address of principal executive offices) |
|
(Zip Code) |
||||
|
|
(212) 418-4700 |
|
|
||
|
|
(Registrant’s telephone number, including area code) |
|
|
||
|
|
|
|
|
||
|
|
Not applicable |
|
|
||
|
|
(Former name, former address and former fiscal year, if changed since last report) |
|
|
||
Indicate by check mark whether the registrant (1) has filed all reports required to be filed by Section 13 or 15(d) of the Securities Exchange Act of 1934 during the preceding 12 months (or for such shorter period that the registrant was required to file such reports), and (2) has been subject to such filing requirements for the past 90 days.
Yes [x] No [ ]
Indicate by check mark whether the registrant has submitted electronically and posted on its corporate Web site, if any, every Interactive Data File required to be submitted and posted pursuant to Rule 405 of Regulation S-T (§232.405 of this chapter) during the preceding 12 months (or for such shorter period that the registrant was required to submit and post such files).
Yes [ ] No [ ]
Indicate by check mark whether the registrant is a large accelerated filer, an accelerated filer, a non-accelerated filer, or a smaller reporting company. See the definitions of “large accelerated filer,” “accelerated filer” and “smaller reporting company” in Rule 12b-2 of the Exchange Act.
|
Large Accelerated Filer [ ] |
|
Accelerated Filer [ ] |
|
Non-Accelerated Filer [x] (Do not check if a smaller reporting company) |
|
Smaller Reporting Company [ ] |
Indicate by check mark whether the registrant is a shell company (as defined in Rule 12b-2 of the Exchange Act).
Yes [ ] No [x]
The number of shares of the registrant’s common stock, $0.001 par value, outstanding as of May 8, 2014 was 28,211,914.
CĪON INVESTMENT CORPORATION
FORM 10-Q
PART I – FINANCIAL INFORMATION
Item 1. Financial Statements
CĪON Investment Corporation
Consolidated Balance Sheets
|
|
|
March 31, |
|
December 31, |
|||
|
|
|
2014 |
|
2013 |
|||
|
|
|
(unaudited) |
|
|
|||
|
Assets |
|||||||
|
Investments, at fair value (amortized cost of $151,796,526 |
|
|
|
|
|
||
|
and $103,414,685, respectively) |
$ |
153,511,647 |
|
$ |
104,518,913 |
||
|
Cash |
|
515,066 |
|
|
449,912 |
||
|
Due from counterparty(1) |
|
68,368,923 |
|
|
40,703,777 |
||
|
Reimbursement from IIG, net(2) |
|
- |
|
|
545,593 |
||
|
Prepaid expenses |
|
45,520 |
|
|
98,990 |
||
|
Interest receivable on investments |
|
690,552 |
|
|
415,416 |
||
|
Receivable due on investments sold |
|
6,892,579 |
|
|
535,513 |
||
|
Unrealized appreciation on total return swap(1) |
|
2,756,542 |
|
|
1,548,617 |
||
|
Receivable due on total return swap(1) |
|
2,809,575 |
|
|
1,801,665 |
||
|
Total assets |
$ |
235,590,404 |
|
$ |
150,618,396 |
||
|
|
|
|
|
|
|
|
|
|
Liabilities and Shareholders' Equity |
|||||||
|
Liabilities |
|
|
|
|
|
||
|
Payable for investments purchased |
$ |
7,567,520 |
|
$ |
3,462,700 |
||
|
Shareholders' distributions payable(3) |
|
- |
|
|
895,704 |
||
|
Accounts payable and accrued expenses |
|
665,319 |
|
|
608,938 |
||
|
Due to IIG - other(2) |
|
378,803 |
|
|
- |
||
|
Due to IIG - offering expenses(2) |
|
591,475 |
|
|
550,000 |
||
|
Accrued capital gains incentive fee on unrealized appreciation(4) |
|
917,225 |
|
|
530,569 |
||
|
Total liabilities |
|
10,120,342 |
|
|
6,047,911 |
||
|
|
|
|
|
|
|
|
|
|
Commitments and contingencies (Note 4 and Note 10) |
|
|
|
|
|
||
|
|
|
|
|
|
|
|
|
|
Shareholders' Equity |
|
|
|
|
|
||
|
Common stock, $0.001 par value; 500,000,000 shares authorized; |
|
|
|
|
|
||
|
23,991,865 and 15,510,178 shares issued and outstanding, respectively(2) |
|
23,992 |
|
|
15,510 |
||
|
Capital in excess of par value |
|
221,901,275 |
|
|
142,402,255 |
||
|
Accumulated distributions in excess of net investment income |
|
(926,868) |
|
|
(500,125) |
||
|
Accumulated net unrealized appreciation on investments |
|
1,715,121 |
|
|
1,104,228 |
||
|
Accumulated net unrealized appreciation on total return swap(1) |
|
2,756,542 |
|
|
1,548,617 |
||
|
Total shareholders' equity |
|
225,470,062 |
|
|
144,570,485 |
||
|
|
|
|
|
|
|
|
|
|
Total liabilities and shareholders' equity |
$ |
235,590,404 |
|
$ |
150,618,396 |
||
|
|
|
|
|
|
|
|
|
|
Net asset value per share of common stock at end of period |
$ |
9.40 |
|
$ |
9.32 |
||
|
|
|
|
|
|
|
|
|
|
Shares of common stock outstanding |
|
23,991,865 |
|
|
15,510,178 |
||
|
|
|
|
|
|
|
|
|
|
(1) See Note 7 for a discussion of the Company’s total return swap agreement. |
|||||||
|
(2) See Note 4 for a discussion of expense reimbursements from ICON Investment Group, LLC, or IIG. |
|||||||
|
(3) See Note 5 for a discussion of the source of distributions paid by the Company. |
|||||||
|
(4) See Note 2 and Note 4 for a discussion of the methodology employed by the Company in calculating the capital gains incentive fee. |
|||||||
|
|
|
|
|
|
|
|
|
|
See accompanying notes to consolidated financial statements. |
|||||||
1
Consolidated Statements of Operations
(unaudited)
|
|
|
|
Three Months |
|
Three Months |
||
|
|
|
|
Ended |
|
Ended |
||
|
|
|
|
March 31, 2014 |
|
March 31, 2013 |
||
|
Investment income |
|
|
|
|
|
||
|
Interest income |
$ |
2,200,781 |
|
$ |
68,126 |
||
|
|
|
|
|
|
|
|
|
|
Operating expenses |
|
|
|
|
|
||
|
Management fees |
|
908,807 |
|
|
44,742 |
||
|
Administrative services expense |
|
415,395 |
|
|
263,555 |
||
|
Capital gains incentive fee(1) |
|
525,326 |
|
|
117,023 |
||
|
Offering expense - IIG |
|
591,475 |
|
|
- |
||
|
General and administrative(2) |
|
1,058,128 |
|
|
508,863 |
||
|
Total expenses |
|
3,499,131 |
|
|
934,183 |
||
|
Less: expense reimbursement from IIG(3) |
|
(1,048,858) |
|
|
(819,373) |
||
|
Net operating expenses |
|
2,450,273 |
|
|
114,810 |
||
|
Net investment loss |
|
(249,492) |
|
|
(46,684) |
||
|
|
|
|
|
|
|
|
|
|
Realized and unrealized gains |
|
|
|
|
|
||
|
Net realized gain on investments |
|
173,714 |
|
|
4,533 |
||
|
Net change in unrealized appreciation on investments |
|
610,893 |
|
|
124,282 |
||
|
Net realized gain on total return swap(4) |
|
2,963,479 |
|
|
286,337 |
||
|
Net change in unrealized appreciation on total return swap(4) |
|
1,207,925 |
|
|
250,676 |
||
|
Total net realized and unrealized gains |
|
4,956,011 |
|
|
665,828 |
||
|
|
|
|
|
|
|
|
|
|
Net increase in net assets resulting from operations |
$ |
4,706,519 |
|
$ |
619,144 |
||
|
|
|
|
|
|
|
|
|
|
Per share information—basic and diluted |
|
|
|
|
|
||
|
|
|
|
|
|
|
|
|
|
Net increase in net assets per share resulting from operations |
$ |
0.24 |
|
$ |
0.53 |
||
|
|
|
|
|
|
|
|
|
|
Weighted average shares of common stock outstanding |
|
19,995,555 |
|
|
1,164,423 |
||
|
|
|
|
|
|
|
|
|
|
(1) |
See Note 2 and Note 4 for a discussion of the methodology employed by the Company in calculating the capital gains incentive fee. |
||||||
|
(2) |
See Note 9 for details of the Company's general and administrative expense. See Note 2 for details of the Company's organization costs and offering expenses included in general and administrative expense. |
||||||
|
(3) |
See Note 4 for a discussion of expense reimbursements from IIG. |
||||||
|
(4) |
See Note 7 for a discussion of the Company’s total return swap agreement. |
||||||
|
|
|
|
|
|
|
|
|
|
See accompanying notes to consolidated financial statements. |
|||||||
2
CĪON Investment Corporation
Consolidated Statements of Changes in Net Assets
(unaudited)
|
|
|
|
Three Months |
|
Three Months |
||
|
|
|
|
Ended |
|
Ended |
||
|
|
|
|
March 31, 2014 |
|
March 31, 2013 |
||
|
Changes in net assets from operations: |
|
|
|
|
|
||
|
|
Net investment loss |
$ |
(249,492) |
|
$ |
(46,684) |
|
|
|
Net realized gain on investments |
|
173,714 |
|
|
4,533 |
|
|
|
Net change in unrealized appreciation on investments |
|
610,893 |
|
|
124,282 |
|
|
|
Net realized gain on total return swap(1) |
|
2,963,479 |
|
|
286,337 |
|
|
|
Net change in unrealized appreciation on total return swap(1) |
|
1,207,925 |
|
|
250,676 |
|
|
|
|
Net increase in net assets resulting from operations |
|
4,706,519 |
|
|
619,144 |
|
Shareholder distributions:(2) |
|
|
|
|
|
||
|
|
Net realized gain on total return swap |
|
|
|
|
|
|
|
|
Net interest and other income from TRS portfolio |
|
(2,360,371) |
|
|
(80,614) |
|
|
|
Net gain on TRS loan sales |
|
(603,108) |
|
|
(123,575) |
|
|
|
Net realized gain on investments |
|
(173,714) |
|
|
(4,577) |
|
|
|
Other sources |
|
(177,251) |
|
|
- |
|
|
|
|
Net decrease in net assets from shareholder distributions |
|
(3,314,444) |
|
|
(208,766) |
|
Changes in net assets from capital share transactions: |
|
|
|
|
|
||
|
|
Issuance of common stock, net of issuance costs of $7,750,349 and $1,127,904, respectively |
|
77,173,549 |
|
|
11,007,314 |
|
|
|
Reinvestment of shareholder distributions |
|
2,333,953 |
|
|
31,413 |
|
|
|
Amortization of deferred offering expenses |
|
- |
|
|
(246,575) |
|
|
|
|
Net increase in net assets resulting from capital share transactions |
|
79,507,502 |
|
|
10,792,152 |
|
|
|
|
|
|
|
|
|
|
Total increase in net assets |
|
80,899,577 |
|
|
11,202,530 |
||
|
Net assets at beginning of period |
|
144,570,485 |
|
|
4,487,115 |
||
|
Net assets at end of period |
$ |
225,470,062 |
|
$ |
15,689,645 |
||
|
|
|
|
|
|
|
|
|
|
Net asset value per share of common stock at end of period |
$ |
9.40 |
|
$ |
9.16 |
||
|
Shares of common stock outstanding at end of period |
|
23,991,865 |
|
|
1,712,123 |
||
|
|
|
|
|
|
|
|
|
|
(1) See Note 7 for a discussion of the Company’s total return swap agreement. |
|
|
|
|
|
||
|
(2) See Note 5 for a discussion of the source of distributions paid by the Company. |
|
|
|
|
|
||
|
|
|
|
|
|
|
|
|
|
See accompanying notes to consolidated financial statements. |
|||||||
3
CĪON Investment Corporation
Consolidated Statements of Cash Flows
(unaudited)
|
|
Three Months |
|
Three Months |
|||||
|
|
Ended |
|
Ended |
|||||
|
|
March 31, 2014 |
|
March 31, 2013 |
|||||
|
Operating activities: |
|
|
|
|
|
|||
|
Net increase in net assets resulting from operations |
$ |
4,706,519 |
|
$ |
619,144 |
|||
|
Adjustments to reconcile net increase in net assets resulting from |
|
|
|
|
|
|||
|
operations to net cash used in operating activities: |
|
|
|
|
|
|||
|
|
Net accretion of discount on investments |
|
(46,476) |
|
|
(2,151) |
||
|
|
Proceeds from principal repayment of investments |
|
5,289,381 |
|
|
15,000 |
||
|
|
Purchase of investments |
|
(66,996,829) |
|
|
(6,653,990) |
||
|
|
Decrease (increase) in short term investments |
|
379,952 |
|
|
(2,802,013) |
||
|
|
Proceeds from sale of investments |
|
13,165,845 |
|
|
504,375 |
||
|
|
Net realized gain on investments |
|
(173,714) |
|
|
(4,533) |
||
|
|
Net unrealized appreciation on investments |
|
(610,893) |
|
|
(124,282) |
||
|
|
Net unrealized appreciation on total return swap(1) |
|
(1,207,925) |
|
|
(250,676) |
||
|
|
Increase in due from counterparty |
|
(27,665,146) |
|
|
(2,761,406) |
||
|
|
Decrease (increase) in reimbursement from IIG, net(2) |
|
545,593 |
|
|
(310,500) |
||
|
|
Decrease in prepaid expenses |
|
53,470 |
|
|
44,432 |
||
|
|
Increase in interest receivable on investments |
|
(275,136) |
|
|
(40,550) |
||
|
|
Increase in receivable due on investments sold |
|
(6,357,066) |
|
|
(519,375) |
||
|
|
Increase in receivable due on total return swap(1) |
|
(1,007,910) |
|
|
(414,694) |
||
|
|
Increase in payable for investments purchased |
|
4,104,820 |
|
|
1,497,500 |
||
|
|
Increase in accrued capital gains incentive fee on unrealized appreciation |
|
386,656 |
|
|
- |
||
|
|
Increase in accounts payable and accrued expenses |
|
56,381 |
|
|
369,518 |
||
|
|
Increase in due to IIG - other |
|
378,803 |
|
|
- |
||
|
|
Increase in due to IIG - offering expenses |
|
41,475 |
|
|
- |
||
|
Net cash used in operating activities |
|
(75,232,200) |
|
|
(10,834,201) |
|||
|
|
|
|
|
|
|
|
|
|
|
Financing activities: |
|
|
|
|
|
|||
|
|
Gross proceeds from issuance of common stock |
|
84,923,898 |
|
|
12,135,218 |
||
|
|
Commissions and dealer manager fees paid |
|
(7,750,349) |
|
|
(1,150,853) |
||
|
|
Reinvestment of shareholder distributions |
|
2,333,953 |
|
|
31,413 |
||
|
|
Shareholder distributions paid(3) |
|
(4,210,148) |
|
|
(117,605) |
||
|
|
Repayment of financing arrangement |
|
- |
|
|
(54,422) |
||
|
Net cash provided by financing activities |
|
75,297,354 |
|
|
10,843,751 |
|||
|
|
|
|
|
|
|
|
|
|
|
Net increase in cash |
|
65,154 |
|
|
9,550 |
|||
|
Cash, beginning of period |
|
449,912 |
|
|
- |
|||
|
Cash, end of period |
$ |
515,066 |
|
$ |
9,550 |
|||
|
|
|
|
|
|
|
|
|
|
|
Supplemental non-cash financing activities: |
|
|
|
|
|
|||
|
|
Deferred offering expenses charged to shareholders' equity |
$ |
- |
|
$ |
246,575 |
||
|
|
Shareholders' distributions payable |
$ |
- |
|
$ |
91,161 |
||
|
|
|
|
|
|
|
|
|
|
|
(1) See Note 7 for a discussion of the Company’s total return swap agreement. |
||||||||
|
(2) See Note 4 for a discussion of expense reimbursements from IIG. |
||||||||
|
(3) See Note 5 for a discussion of the source of distributions paid by the Company. |
||||||||
|
|
|
|
|
|
|
|
|
|
|
See accompanying notes to consolidated financial statements. |
||||||||
4
CĪON Investment Corporation
Consolidated Schedule of Investments
March 31, 2014
(unaudited)
|
Portfolio Company(a) |
|
Index Rate(b) |
|
Industry |
|
Principal/Par |
|
Amortized |
|
Fair |
||||
|
Senior Secured First Lien Term Loans - 37.4% |
|
|
|
|
|
|
|
|
|
|
||||
|
|
5.11, Inc., L+500, 1.00% LIBOR Floor, 2/28/2020 |
|
2 Month LIBOR |
|
Retail |
|
$ |
5,625,000 |
|
$ |
5,597,175 |
|
$ |
5,667,188 |
|
|
ABRA, Inc., L+600, 1.25% LIBOR Floor, 5/10/2018(d) |
|
3 Month LIBOR |
|
Automotive |
|
|
7,100,823 |
|
|
7,041,570 |
|
|
7,029,815 |
|
|
Accruent, LLC, P+350, 2.25% Base Rate Floor, 11/25/2019 |
|
Prime |
|
High Tech Industries |
|
|
4,488,750 |
|
|
4,477,528 |
|
|
4,477,528 |
|
|
Collision Holding Company, LLC, L+775, 1.25% LIBOR Floor, 5/10/2018 |
|
3 Month LIBOR |
|
Automotive |
|
|
1,568,127 |
|
|
1,552,568 |
|
|
1,552,445 |
|
|
Custom Ecology, Inc., L+550, 1.25% LIBOR Floor, 6/26/2019 |
|
3 Month LIBOR |
|
Environmental Industries |
|
|
1,895,675 |
|
|
1,878,576 |
|
|
1,902,784 |
|
|
Distribution International, Inc., L+650, 1.00% LIBOR Floor, 7/16/2019 |
|
3 Month LIBOR |
|
Construction & Building |
|
|
2,481,250 |
|
|
2,463,256 |
|
|
2,487,453 |
|
|
ECI Acquisition Holdings, Inc., L+625, 1.00% LIBOR Floor, 3/11/2019(e) |
|
3 Month LIBOR |
|
High Tech Industries |
|
|
8,267,337 |
|
|
8,226,854 |
|
|
8,226,000 |
|
|
F+W Media, Inc., L+650, 1.25% LIBOR Floor, 6/30/2019(f) |
|
3 Month LIBOR |
|
Media: Diversified & Production |
|
|
9,633,864 |
|
|
9,273,754 |
|
|
9,513,441 |
|
|
H.D. Vest, Inc., L+450, 1.25% LIBOR Floor, 12/18/2018 |
|
3 Month LIBOR |
|
Banking, Finance, Insurance & Real Estate |
|
|
593,656 |
|
|
589,789 |
|
|
590,688 |
|
|
ILC Industries, LLC, L+650, 1.50% LIBOR Floor, 7/11/2018 |
|
3 Month LIBOR |
|
Consumer Goods: Non-Durable |
|
|
4,314,432 |
|
|
4,330,191 |
|
|
4,319,825 |
|
|
Merrill Corp., L+475, 1.00% LIBOR Floor, 3/8/2018 |
|
1 Month LIBOR |
|
Services: Business |
|
|
625,217 |
|
|
619,946 |
|
|
630,949 |
|
|
National Surgical Hospitals, Inc., L+450, 1.25% LIBOR Floor, 8/1/2019 |
|
1 Month LIBOR |
|
Healthcare & Pharmaceuticals |
|
|
3,482,500 |
|
|
3,447,675 |
|
|
3,512,972 |
|
|
Packaging Coordinators, Inc., L+425, 1.25% LIBOR Floor, 5/10/2020 |
|
6 Month LIBOR |
|
Containers, Packaging & Glass |
|
|
1,500,000 |
|
|
1,496,250 |
|
|
1,492,500 |
|
|
Plano Molding Co., Inc., L+425, 1.00% LIBOR Floor, 10/11/2018 |
|
3 Month LIBOR |
|
Consumer Goods: Non-Durable |
|
|
2,484,375 |
|
|
2,470,064 |
|
|
2,484,375 |
|
|
Royall & Company, L+425, 1.00% LIBOR Floor, 3/5/2018 |
|
3 Month LIBOR |
|
Services: Business |
|
|
5,000,000 |
|
|
4,987,500 |
|
|
5,037,500 |
|
|
SK Spice S.Á.R.L, L+825, 1.25% LIBOR Floor, 9/30/2018(g) |
|
3 Month LIBOR |
|
Chemicals, Plastics & Rubber |
|
|
1,771,100 |
|
|
1,736,564 |
|
|
1,771,100 |
|
|
Smile Brands Group, Inc., L+625, 1.25% LIBOR Floor, 8/16/2019 |
|
12 Month LIBOR |
|
Healthcare & Pharmaceuticals |
|
|
4,975,000 |
|
|
4,881,114 |
|
|
4,998,631 |
|
|
Sprint Industrial Holdings, LLC, L+575, 1.25% LIBOR Floor, 5/14/2019 |
|
3 Month LIBOR |
|
Energy: Oil & Gas |
|
|
1,191,000 |
|
|
1,180,322 |
|
|
1,199,933 |
|
|
Survey Sampling International, LLC, L+450, 1.00% LIBOR Floor, 12/12/2019 |
|
3 Month LIBOR |
|
Services: Business |
|
|
3,250,000 |
|
|
3,218,843 |
|
|
3,233,750 |
|
|
Tectum Holdings, Inc., L+425, 1.25% LIBOR Floor, 9/12/2018 |
|
3 Month LIBOR |
|
Automotive |
|
|
2,250,000 |
|
|
2,244,375 |
|
|
2,250,000 |
|
|
The TOPPS Company, Inc., L+600, 1.25% LIBOR Floor, 10/2/2018 |
|
3 Month LIBOR |
|
Consumer Goods: Non-Durable |
|
|
2,104,725 |
|
|
2,065,190 |
|
|
2,104,725 |
|
|
Travel Leaders Group, LLC, L+600, 1.00% LIBOR Floor, 12/5/2018 |
|
3 Month LIBOR |
|
Services: Consumer |
|
|
4,838,750 |
|
|
4,562,894 |
|
|
4,778,266 |
|
|
Trimark USA, LLC, L+625, 1.00% LIBOR Floor, 5/11/2019 |
|
3 Month LIBOR |
|
Beverage, Food & Tobacco |
|
|
5,000,000 |
|
|
4,952,305 |
|
|
5,037,500 |
|
Total Senior Secured First Lien Term Loans |
|
|
|
|
|
|
|
|
|
83,294,303 |
|
|
84,299,368 |
|
|
Senior Secured Second Lien Term Loans - 20.9% |
|
|
|
|
|
|
|
|
|
|
|
|
|
|
|
|
The Active Network, Inc., L+850, 1.00% LIBOR Floor, 11/15/2021 |
|
3 Month LIBOR |
|
High Tech Industries |
|
|
2,820,000 |
|
|
2,806,419 |
|
|
2,890,500 |
|
|
Camp International Holding Company, L+725, 1.00% LIBOR Floor, 11/30/2019 |
|
1 Month LIBOR |
|
Services: Business |
|
|
2,029,000 |
|
|
2,029,000 |
|
|
2,073,384 |
|
|
Drew Marine Group, Inc., L+700, 1.00% LIBOR Floor, 5/19/2021(g) |
|
3 Month LIBOR |
|
Chemicals, Plastics & Rubber |
|
|
5,000,000 |
|
|
5,003,270 |
|
|
5,050,000 |
|
|
Elements Behavioral Health, Inc., L+825, 1.00% LIBOR Floor, 2/11/2020 |
|
3 Month LIBOR |
|
Healthcare & Pharmaceuticals |
|
|
5,000,000 |
|
|
4,950,761 |
|
|
4,950,000 |
|
|
GCA Services Group, Inc., L+800, 1.25% LIBOR Floor, 11/1/2020 |
|
6 Month LIBOR |
|
Services: Consumer |
|
|
800,000 |
|
|
796,435 |
|
|
814,500 |
|
|
H.D. Vest, Inc., L+800, 1.25% LIBOR Floor, 6/18/2019 |
|
3 Month LIBOR |
|
Banking, Finance, Insurance & Real Estate |
|
|
854,000 |
|
|
844,663 |
|
|
849,730 |
|
|
Healogics, Inc., L+800, 1.25% LIBOR Floor, 2/5/2020 |
|
6 Month LIBOR |
|
Healthcare & Pharmaceuticals |
|
|
500,000 |
|
|
495,711 |
|
|
512,085 |
|
|
Landslide Holdings, Inc., L+725, 1.00% LIBOR Floor, 2/25/2021 |
|
3 Month LIBOR |
|
Services: Business |
|
|
4,810,000 |
|
|
4,809,092 |
|
|
4,864,113 |
|
|
Learfield Communications, Inc., L+775, 1.00% LIBOR Floor, 10/9/2021 |
|
3 Month LIBOR |
|
Media: Broadcasting & Subscription |
|
|
1,417,333 |
|
|
1,403,550 |
|
|
1,452,766 |
|
|
Securus Technologies Holdings, Inc., L+775, 1.25% LIBOR Floor, 4/30/2021 |
|
3 Month LIBOR |
|
Telecommunications |
|
|
3,500,000 |
|
|
3,461,450 |
|
|
3,500,000 |
|
|
SESAC Holdco II, LLC, L+875, 1.25% LIBOR Floor, 8/8/2019 |
|
1 Month LIBOR |
|
Media: Broadcasting & Subscription |
|
|
1,500,000 |
|
|
1,521,274 |
|
|
1,530,000 |
|
|
SMG, L+825, 1.00% LIBOR Floor, 2/27/2021 |
|
2 Month LIBOR |
|
Hotel, Gaming & Leisure |
|
|
6,220,000 |
|
|
6,220,000 |
|
|
6,359,950 |
|
|
Sprint Industrial Holdings, LLC, L+1,000, 1.25% LIBOR Floor, 11/14/2019 |
|
3 Month LIBOR |
|
Energy: Oil & Gas |
|
|
500,000 |
|
|
490,858 |
|
|
505,000 |
|
|
Tectum Holdings, Inc., P+700, 2.00% Base Rate Floor, 3/12/2019 |
|
Prime |
|
Automotive |
|
|
4,650,000 |
|
|
4,626,750 |
|
|
4,638,375 |
|
|
Telecommunications Management, LLC, L+800, 1.00% LIBOR Floor, 10/30/2020(f) |
|
3 Month LIBOR |
|
Media: Broadcasting & Subscription |
|
|
675,178 |
|
|
670,131 |
|
|
683,618 |
|
|
Trimark USA, LLC, L+900, 1.00% LIBOR Floor, 8/12/2019 |
|
3 Month LIBOR |
|
Beverage, Food & Tobacco |
|
|
5,000,000 |
|
|
4,901,879 |
|
|
5,031,250 |
|
|
WP CPP Holdings, LLC, L+775, 1.00% LIBOR Floor, 4/30/2021 |
|
3 Month LIBOR |
|
Aerospace & Defense |
|
|
1,435,000 |
|
|
1,427,825 |
|
|
1,458,319 |
|
Total Senior Secured Second Lien Term Loans |
|
|
|
|
|
|
|
|
|
46,459,068 |
|
|
47,163,590 |
|
|
|
|
|
|
|
|
|
|
|
|
|
|
|
|
|
|
See accompanying notes to consolidated financial statements. |
||||||||||||||
5
CĪON Investment Corporation
Consolidated Schedule of Investments
March 31, 2014
(unaudited)
|
Portfolio Company(a) |
|
Index Rate(b) |
|
Industry |
|
Principal/Par |
|
Amortized |
|
Fair |
||||
|
Collateralized Securities - 4.9% |
|
|
|
|
|
|
|
|
|
|
|
|
|
|
|
|
Ivy Hill Middle Market Credit Fund VII, Ltd. Class E Notes, L+565, 1.00% LIBOR Floor, 10/20/2025(g) |
|
3 Month LIBOR |
|
Diversified Financials |
|
|
2,000,000 |
|
|
1,850,000 |
|
|
1,876,020 |
|
|
Ivy Hill Middle Market Credit Fund VII, Ltd. Subordinated Notes, Residual, 10/20/2025(g) |
|
N/A |
|
Diversified Financials |
|
|
2,000,000 |
|
|
1,896,000 |
|
|
1,892,300 |
|
|
JFIN CLO 2014, Ltd. Class E Notes, L+500, 4/20/2025(g) |
|
3 Month LIBOR |
|
Diversified Financials |
|
|
2,500,000 |
|
|
2,293,438 |
|
|
2,297,152 |
|
|
JPMorgan Chase Bank, N.A. Credit Link Note, L+1,225, 12/20/2021(g) |
|
3 Month LIBOR |
|
Diversified Financials |
|
|
5,000,000 |
|
|
5,000,000 |
|
|
4,979,500 |
|
Total Collateralized Securities |
|
|
|
|
|
|
|
|
|
11,039,438 |
|
|
11,044,972 |
|
|
Short Term Investments - 4.9%(h) |
|
|
|
|
|
|
|
|
|
|
|
|
|
|
|
|
First American Treasury Obligations Fund, Class Z Shares(i) |
|
|
|
|
|
|
11,003,717 |
|
|
11,003,717 |
|
|
11,003,717 |
|
Total Short Term Investments |
|
|
|
|
|
|
|
|
|
11,003,717 |
|
|
11,003,717 |
|
|
TOTAL INVESTMENTS - 68.1% |
|
|
|
|
|
|
|
|
$ |
151,796,526 |
|
$ |
153,511,647 |
|
|
OTHER ASSETS IN EXCESS OF LIABILITIES - 31.9% |
|
|
|
|
|
|
|
|
|
|
|
$ |
71,958,415 |
|
|
NET ASSETS - 100% |
|
|
|
|
|
|
|
|
|
|
|
$ |
225,470,062 |
|
|
|
|
|
|
|
|
|
|
|
|
|
|
|
|
|
|
TOTAL RETURN SWAP - 1.2% |
|
|
|
|
|
Notional |
|
|
|
|
Unrealized Appreciation |
|||
|
|
Citibank TRS Facility (see Note 6) |
|
|
|
|
|
$ |
230,257,406 |
|
|
|
|
$ |
2,756,542 |
|
|
|
|
|
|
|
|
|
|
|
|
|
|
|
|
|
(a) |
All of the Company's debt investments are issued by eligible U.S. portfolio companies, as defined in the Investment Company Act of 1940, as amended, or the 1940 Act, except for investments specifically identified as non-qualifying per note (g) below. The Company does not control and is not an affiliate of any of the portfolio companies in its investment portfolio. |
|||||||||||||
|
(b) |
The 1, 2, 3, 6 and 12 month London Interbank Offered Rate, or LIBOR, rates were 0.15%, 0.19%, 0.23%, 0.33% and 0.56%, respectively, as of March 31, 2014. The prime rate was 3.25% as of March 31, 2014. The applicable LIBOR rate as of March 31, 2014 for the loan listed may not be the applicable LIBOR rate, as the loan may have been priced or repriced based on a LIBOR rate prior to March 31, 2014. |
|||||||||||||
|
(c) |
Fair value determined by the Company’s board of directors (see Note 8). |
|||||||||||||
|
(d) |
The Company is committed to fund an additional $1,330,668 as of March 31, 2014 (see Note 6 and Note 10). The Company is committed to fund an additional $188,175 as of May 8, 2014. |
|||||||||||||
|
(e) |
The Company is committed to fund an additional $1,724,000 as of March 31 and May 8, 2014 (see Note 6 and Note 10). |
|||||||||||||
|
(f) |
Position or portion thereof unsettled as of March 31, 2014. |
|||||||||||||
|
(g) |
The investment is not a qualifying asset under the 1940 Act. A business development company may not acquire any asset other than qualifying assets, unless, at the time the acquisition is made, qualifying assets represent at least 70% of that company’s total assets as defined under Section 55 of the 1940 Act. As of March 31, 2014, 92.1% of the Company’s total assets represented qualifying assets. In addition, as described in Note 7, the Company calculates its compliance with the qualifying asset test on a “look through” basis by treating each loan underlying the total return swap as either a qualifying asset or non-qualifying asset based on whether the obligor is an eligible portfolio company. On this basis, 79.6% of the Company’s total assets represented qualifying assets as of March 31, 2014. |
|||||||||||||
|
(h) |
Short term investments represent an investment in a fund that invests in highly liquid investments with original maturity dates of three months or less. |
|||||||||||||
|
(i) |
Effective yield as of March 31, 2014 is <0.01%. |
|||||||||||||
|
|
|
|
|
|
|
|
|
|
|
|
|
|
|
|
|
See accompanying notes to consolidated financial statements. |
||||||||||||||
6
CĪON Investment Corporation
Consolidated Schedule of Investments
December 31, 2013
|
Portfolio Company(a) |
|
Index Rate(b) |
|
Industry |
|
Principal/Par |
|
Amortized |
|
Fair |
||||
|
Senior Secured First Lien Term Loans - 42.7% |
|
|
|
|
|
|
|
|
|
|
||||
|
|
ABRA, Inc., L+600, 1.25% LIBOR Floor, 5/10/2018(d) |
|
3 Month LIBOR |
|
Automotive |
|
$ |
5,980,924 |
|
$ |
5,921,292 |
|
$ |
5,921,115 |
|
|
Captive Resources Midco, LLC, L+550, 1.25% LIBOR Floor, 10/31/2018 |
|
3 Month LIBOR |
|
Banking, Finance, Insurance & Real Estate |
|
|
987,500 |
|
|
972,809 |
|
|
987,500 |
|
|
CHI Overhead Doors, L+425, 1.25% LIBOR Floor, 3/18/2019 |
|
3 Month LIBOR |
|
Construction & Building |
|
|
936,944 |
|
|
932,772 |
|
|
938,701 |
|
|
Collision Holding Company, LLC, L+775, 1.25% LIBOR Floor, 5/10/2018 |
|
3 Month LIBOR |
|
Automotive |
|
|
1,568,127 |
|
|
1,552,492 |
|
|
1,552,445 |
|
|
Custom Ecology, Inc., L+550, 1.25% LIBOR Floor, 6/26/2019 |
|
3 Month LIBOR |
|
Environmental Industries |
|
|
1,900,450 |
|
|
1,882,554 |
|
|
1,909,952 |
|
|
Distribution International, Inc., L+650, 1.00% LIBOR Floor, 7/16/2019 |
|
3 Month LIBOR |
|
Construction & Building |
|
|
2,487,500 |
|
|
2,468,327 |
|
|
2,476,555 |
|
|
F+W Media, Inc., L+650, 1.25% LIBOR Floor, 6/30/2019 |
|
3 Month LIBOR |
|
Media: Diversified & Production |
|
|
1,990,000 |
|
|
1,839,629 |
|
|
1,920,350 |
|
|
Fender Musical Instruments Corp., L+450, 1.25% LIBOR Floor, 4/3/2019 |
|
6 Month LIBOR |
|
Consumer Goods: Non-Durable |
|
|
447,500 |
|
|
443,456 |
|
|
455,193 |
|
|
H.D. Vest, Inc., L+450, 1.25% LIBOR Floor, 12/18/2018 |
|
3 Month LIBOR |
|
Banking, Finance, Insurance & Real Estate |
|
|
597,438 |
|
|
593,254 |
|
|
594,450 |
|
|
ILC Industries, LLC, L+650, 1.50% LIBOR Floor, 7/11/2018 |
|
3 Month LIBOR |
|
Consumer Goods: Non-Durable |
|
|
4,456,187 |
|
|
4,471,616 |
|
|
4,467,327 |
|
|
Landslide Holdings, Inc., L+425, 1.00% LIBOR Floor, 8/9/2019 |
|
3 Month LIBOR |
|
Services: Business |
|
|
2,449,690 |
|
|
2,426,101 |
|
|
2,469,594 |
|
|
Merrill Corp., L+625, 1.00% LIBOR Floor, 3/8/2018 |
|
1 Month LIBOR |
|
Services: Business |
|
|
649,021 |
|
|
643,301 |
|
|
661,729 |
|
|
National Surgical Hospitals, Inc., L+450, 1.25% LIBOR Floor, 8/1/2019 |
|
1 Month LIBOR |
|
Healthcare & Pharmaceuticals |
|
|
3,491,250 |
|
|
3,456,338 |
|
|
3,526,163 |
|
|
Packaging Coordinators, Inc., L+425, 1.25% LIBOR Floor, 5/10/2020 |
|
6 Month LIBOR |
|
Containers, Packaging & Glass |
|
|
1,500,000 |
|
|
1,492,500 |
|
|
1,500,000 |
|
|
Plano Molding Co., Inc., L+425, 1.00% LIBOR Floor, 10/11/2018 |
|
3 Month LIBOR |
|
Consumer Goods: Non-Durable |
|
|
2,500,000 |
|
|
2,484,517 |
|
|
2,500,000 |
|
|
Prowler Acquisition Corp., L+475, 1.25% LIBOR Floor, 3/19/2019 |
|
3 Month LIBOR |
|
Energy: Oil & Gas |
|
|
1,925,000 |
|
|
1,905,750 |
|
|
1,915,375 |
|
|
SK Spice S.Á.R.L, L+825, 1.25% LIBOR Floor, 9/30/2018(e) |
|
3 Month LIBOR |
|
Chemicals, Plastics & Rubber |
|
|
1,775,550 |
|
|
1,740,993 |
|
|
1,760,014 |
|
|
Smile Brands Group, Inc., L+625, 1.25% LIBOR Floor, 8/16/2019 |
|
12 Month LIBOR |
|
Healthcare & Pharmaceuticals |
|
|
4,987,500 |
|
|
4,892,609 |
|
|
4,931,391 |
|
|
Sprint Industrial Holdings, LLC, L+575, 1.25% LIBOR Floor, 5/14/2019 |
|
3 Month LIBOR |
|
Energy: Oil & Gas |
|
|
1,194,000 |
|
|
1,182,670 |
|
|
1,208,925 |
|
|
Survey Sampling International, LLC, L+450, 1.00% LIBOR Floor, 12/12/2019 |
|
3 Month LIBOR |
|
Services: Business |
|
|
9,250,000 |
|
|
9,158,059 |
|
|
9,157,500 |
|
|
The TOPPS Company, Inc., L+600, 1.25% LIBOR Floor, 10/2/2018 |
|
3 Month LIBOR |
|
Consumer Goods: Non-Durable |
|
|
2,110,000 |
|
|
2,068,064 |
|
|
2,104,725 |
|
|
Travel Leaders Group, LLC, L+600, 1.00% LIBOR Floor, 12/5/2018 |
|
3 Month LIBOR |
|
Services: Consumer |
|
|
4,900,000 |
|
|
4,607,683 |
|
|
4,814,250 |
|
|
Wastequip, LLC, L+450, 1.00% LIBOR Floor, 8/9/2019 |
|
6 Month LIBOR |
|
Capital Equipment |
|
|
2,985,000 |
|
|
2,970,869 |
|
|
3,014,850 |
|
|
Westway Group, L+400, 1.00% LIBOR Floor, 2/27/2020 |
|
6 Month LIBOR |
|
Services: Business |
|
|
992,500 |
|
|
988,030 |
|
|
999,326 |
|
Total Senior Secured First Lien Term Loans |
|
|
|
|
|
|
|
|
|
61,095,685 |
|
|
61,787,430 |
|
|
Senior Secured Second Lien Term Loans - 15.6% |
|
|
|
|
|
|
|
|
|
|
|
|
|
|
|
|
The Active Network, Inc., L+850, 1.00% LIBOR Floor, 11/15/2021 |
|
3 Month LIBOR |
|
High Tech Industries |
|
|
2,820,000 |
|
|
2,805,900 |
|
|
2,876,400 |
|
|
Camp International Holding Company, L+725, 1.00% LIBOR Floor, 11/30/2019 |
|
1 Month LIBOR |
|
Services: Business |
|
|
2,029,000 |
|
|
2,029,000 |
|
|
2,073,384 |
|
|
Centaur Gaming, L+750, 1.25% LIBOR Floor, 2/20/2020 |
|
6 Month LIBOR |
|
Hotel, Gaming & Leisure |
|
|
500,000 |
|
|
495,297 |
|
|
515,000 |
|
|
Digital Insight Corporation, L+775, 1.00% LIBOR Floor, 10/16/2020 |
|
3 Month LIBOR |
|
Services: Business |
|
|
385,000 |
|
|
381,237 |
|
|
393,181 |
|
|
Drew Marine Group, Inc., L+700, 1.00% LIBOR Floor, 5/19/2021(e) |
|
3 Month LIBOR |
|
Chemicals, Plastics & Rubber |
|
|
5,000,000 |
|
|
5,003,467 |
|
|
5,037,500 |
|
|
GCA Services Group, Inc., L+800, 1.25% LIBOR Floor, 11/1/2020 |
|
6 Month LIBOR |
|
Services: Consumer |
|
|
800,000 |
|
|
796,341 |
|
|
813,876 |
|
|
H.D. Vest, Inc., L+800, 1.25% LIBOR Floor, 6/18/2019 |
|
3 Month LIBOR |
|
Banking, Finance, Insurance & Real Estate |
|
|
854,000 |
|
|
844,079 |
|
|
845,460 |
|
|
Healogics, Inc., L+800, 1.25% LIBOR Floor, 2/5/2020 |
|
6 Month LIBOR |
|
Healthcare & Pharmaceuticals |
|
|
500,000 |
|
|
495,426 |
|
|
511,250 |
|
|
Learfield Communications, Inc., L+775, 1.00% LIBOR Floor, 10/9/2021 |
|
3 Month LIBOR |
|
Media: Broadcasting & Subscription |
|
|
1,417,333 |
|
|
1,403,174 |
|
|
1,452,766 |
|
|
LTS Buyer, LLC, L+675, 1.25% LIBOR Floor, 4/12/2021 |
|
6 Month LIBOR |
|
Telecommunications |
|
|
500,000 |
|
|
495,233 |
|
|
505,835 |
|
|
Securus Technologies Holdings, Inc., L+775, 1.25% LIBOR Floor, 4/30/2021(f) |
|
3 Month LIBOR |
|
Telecommunications |
|
|
3,500,000 |
|
|
3,461,450 |
|
|
3,467,205 |
|
|
SESAC Holdco II, LLC, L+875, 1.25% LIBOR Floor, 8/8/2019 |
|
1 Month LIBOR |
|
Media: Broadcasting & Subscription |
|
|
1,500,000 |
|
|
1,522,110 |
|
|
1,537,500 |
|
|
Sprint Industrial Holdings, LLC, L+1,000, 1.25% LIBOR Floor, 11/14/2019 |
|
3 Month LIBOR |
|
Energy: Oil & Gas |
|
|
500,000 |
|
|
490,421 |
|
|
505,000 |
|
|
Telecommunications Management, LLC, L+800, 1.00% LIBOR Floor, 10/30/2020 |
|
3 Month LIBOR |
|
Media: Broadcasting & Subscription |
|
|
543,290 |
|
|
538,266 |
|
|
554,156 |
|
|
WP CPP Holdings, LLC, L+775, 1.00% LIBOR Floor, 4/30/2021 |
|
3 Month LIBOR |
|
Aerospace & Defense |
|
|
1,435,000 |
|
|
1,427,930 |
|
|
1,463,701 |
|
Total Senior Secured Second Lien Term Loans |
|
|
|
|
|
|
|
|
|
22,189,331 |
|
|
22,552,214 |
|
|
|
|
|
|
|
|
|
|
|
|
|
|
|
|
|
|
See accompanying notes to consolidated financial statements. |
||||||||||||||
7
CĪON Investment Corporation
Consolidated Schedule of Investments
December 31, 2013
|
Portfolio Company(a) |
|
Index Rate(b) |
|
Industry |
|
Principal/Par |
|
Amortized |
|
Fair |
||||
|
Collateralized Securities - 6.1% |
|
|
|
|
|
|
|
|
|
|
|
|
|
|
|
|
Ivy Hill Middle Market Credit Fund VII, Ltd. Class E Notes, L+565, 10/20/2025(e) |
|
3 Month LIBOR |
|
Diversified Financials |
|
|
2,000,000 |
|
|
1,850,000 |
|
|
1,850,000 |
|
|
Ivy Hill Middle Market Credit Fund VII, Ltd. Subordinated Notes, Residual, 10/20/2025(e) |
|
N/A |
|
Diversified Financials |
|
|
2,000,000 |
|
|
1,896,000 |
|
|
1,945,600 |
|
|
JPMorgan Chase Bank, N.A. Credit Link Note, L+1,225, 12/20/2021(e) |
|
3 Month LIBOR |
|
Diversified Financials |
|
|
5,000,000 |
|
|
5,000,000 |
|
|
5,000,000 |
|
Total Collateralized Securities |
|
|
|
|
|
|
|
|
|
8,746,000 |
|
|
8,795,600 |
|
|
Short Term Investments - 7.9%(g) |
|
|
|
|
|
|
|
|
|
|
|
|
|
|
|
|
First American Treasury Obligations Fund, Class Z Shares(h) |
|
|
|
|
|
|
11,383,669 |
|
|
11,383,669 |
|
|
11,383,669 |
|
Total Short Term Investments |
|
|
|
|
|
|
|
|
|
11,383,669 |
|
|
11,383,669 |
|
|
TOTAL INVESTMENTS - 72.3% |
|
|
|
|
|
|
|
|
$ |
103,414,685 |
|
$ |
104,518,913 |
|
|
OTHER ASSETS IN EXCESS OF LIABILITIES - 27.7% |
|
|
|
|
|
|
|
|
|
|
|
$ |
40,051,572 |
|
|
NET ASSETS - 100% |
|
|
|
|
|
|
|
|
|
|
|
$ |
144,570,485 |
|
|
|
|
|
|
|
|
|
|
|
|
|
|
|
|
|
|
TOTAL RETURN SWAP - 1.1% |
|
|
|
|
|
Notional |
|
|
|
|
Unrealized Appreciation |
|||
|
|
Citibank TRS Facility (see Note 6) |
|
|
|
|
|
$ |
148,199,937 |
|
|
|
|
$ |
1,548,617 |
|
|
|
|
|
|
|
|
|
|
|
|
|
|
|
|
|
(a) |
All of the Company's debt investments are issued by eligible U.S. portfolio companies, as defined in the 1940 Act, except for investments specifically identified as non-qualifying per note (d) below. The Company does not control and is not an affiliate of any of the portfolio companies in its investment portfolio. |
|||||||||||||
|
(b) |
The 1, 2, 3, 6 and 12 month LIBOR rates were 0.17%, 0.21%, 0.25%, 0.35% and 0.58%, respectively, as of December 31, 2013. The applicable LIBOR rate as of December 31, 2013 for the loan listed may not be the applicable LIBOR rate, as the loan may have been priced or repriced based on a LIBOR rate prior to December 31, 2013. |
|||||||||||||
|
(c) |
Fair value determined by the Company’s board of directors (see Note 8). |
|||||||||||||
|
(d) |
The Company is committed to fund an additional $2,450,758 as of December 31, 2013 (see Note 6 and Note 10). The Company is committed to fund an additional $1,330,667 as of March 7, 2014. |
|||||||||||||
|
(e) |
The investment is not a qualifying asset under the 1940 Act. A business development company may not acquire any asset other than qualifying assets, unless, at the time the acquisition is made, qualifying assets represent at least 70% of that company’s total assets as defined under Section 55 of the 1940 Act. As of December 31, 2013, 88.2% of the Company’s total assets represented qualifying assets. In addition, as described in Note 7, the Company calculates its compliance with the qualifying asset test on a “look through” basis by treating each loan underlying the total return swap as either a qualifying asset or non-qualifying asset based on whether the obligor is an eligible portfolio company. On this basis, 76.1% of the Company’s total assets represented qualifying assets as of December 31, 2013. |
|||||||||||||
|
(f) |
Position or portion thereof unsettled as of December 31, 2013. |
|||||||||||||
|
(g) |
Short term investments represent an investment in a fund that invests in highly liquid investments with original maturity dates of three months or less. |
|||||||||||||
|
(h) |
Effective yield as of December 31, 2013 is <0.01%. |
|||||||||||||
|
|
|
|
|
|
|
|
|
|
|
|
|
|
|
|
|
See accompanying notes to consolidated financial statements. |
||||||||||||||
8
CĪON Investment Corporation
Notes to Consolidated Financial Statements
March 31, 2014
(unaudited)
Note 1. Organization and Principal Business
CĪON Investment Corporation, or the Company, was incorporated under the general corporation laws of the State of Maryland on August 9, 2011. On December 17, 2012, the Company successfully raised gross proceeds from unaffiliated outside investors of at least $2,500,000, or the minimum offering requirement, and commenced operations. The Company is an externally managed, non-diversified closed-end management investment company that has elected to be regulated as a business development company, or BDC, under the 1940 Act. The Company elected to be treated for federal income tax purposes as a regulated investment company, or RIC, as defined under Subchapter M of the Internal Revenue Code of 1986, as amended, or the Code.
The Company’s investment objective is to generate current income and, to a lesser extent, capital appreciation for investors. The Company’s portfolio is comprised primarily of investments in senior secured loans and, to a lesser extent, second lien loans, collateralized loan obligations and long-term subordinated loans, referred to as mezzanine loans, of private and thinly traded U.S. middle-market companies.
The Company is managed by CĪON Investment Management, LLC, or CIM, a registered investment adviser and an affiliate of the Company. CIM oversees the management of the Company’s activities and is responsible for making investment decisions for the Company’s investment portfolio. The Company and CIM have engaged Apollo Investment Management, L.P., or AIM, a subsidiary of Apollo Global Management, LLC, or, together with its subsidiaries, Apollo, a leading global alternative investment manager, to act as the Company’s investment sub-adviser.
Note 2. Summary of Significant Accounting Policies
Basis of Presentation
The accompanying unaudited consolidated financial statements of the Company have been prepared in accordance with U.S. generally accepted accounting principles, or GAAP, for interim financial information and with the instructions for Form 10-Q and Article 10 of Regulation S-X. Accordingly, they do not include all of the information and footnotes required by GAAP for complete financial statements. In the opinion of management, all adjustments (consisting of normal recurring adjustments) considered necessary for a fair presentation have been included. For a more complete discussion of significant accounting policies and certain other information, the Company’s interim unaudited consolidated financial statements should be read in conjunction with its audited consolidated financial statements as of December 31, 2013 and for the year then ended included in the Company’s Annual Report on Form 10-K. Operating results for the three months ended March 31, 2014 are not necessarily indicative of the results that may be expected for the full year ending December 31, 2014. The December 31, 2013 consolidated balance sheet and the consolidated schedule of investments are derived from the 2013 audited consolidated financial statements.
The Company evaluates subsequent events through the date that the consolidated financial statements are issued.
Certain reclassifications have been made to the accompanying consolidated financial statements in prior periods to conform to the current period presentation.
Cash and Cash Equivalents
Cash and cash equivalents include cash in banks and highly liquid investments with original maturity dates of three months or less. The Company’s cash and cash equivalents are held principally at one financial institution and at times may exceed insured limits. The Company periodically evaluates the creditworthiness of this institution and has not experienced any losses on such deposits.
Short Term Investments
Short term investments include an investment in a U.S. Treasury Obligations Fund, which seeks to provide current income and daily liquidity by purchasing U.S. Treasury securities and repurchase agreements that are collateralized by such securities. The Company had $11,003,717 and $11,383,669 of such investments at March 31, 2014 and December 31, 2013, respectively, which are included in investments, at fair value on the accompanying consolidated balance sheets and on the consolidated schedule of investments.
9
CĪON Investment Corporation
Notes to Consolidated Financial Statements
March 31, 2014
(unaudited)
Organization Costs and Offering Expenses
Organization costs include, among other things, the cost of organizing the Company as a Maryland corporation, including the cost of legal services and other fees pertaining to the organization of the Company. All organization costs have been funded by IIG and its affiliates, and there is no liability for these organization costs to the Company until IIG and its affiliates submit such costs for reimbursement. The Company will expense organization costs when incurred, if and when IIG and its affiliates submit such costs for reimbursement.
Offering expenses include, among other things, legal fees and other costs pertaining to the preparation of the Company’s registration statement in connection with the continuous public offering of the Company’s shares. Certain offering expenses have been funded by IIG and its affiliates, and there is no liability for these offering expenses to the Company until IIG and its affiliates submit such costs for reimbursement. Upon meeting the minimum offering requirement on December 17, 2012, the Company incurred and capitalized offering expenses of $1,000,000 that were submitted for reimbursement by IIG (see Note 4). These expenses were fully amortized over a twelve month period as an adjustment to capital in excess of par value. The Company will expense any additional offering expenses incurred by IIG and its affiliates if and when IIG and its affiliates submit such costs for reimbursement.
The following table summarizes organization costs and offering expenses incurred by IIG and by the Company from January 31, 2012 (Inception) through March 31, 2014:
|
|
|
|
Organization Costs and Offering Expenses Incurred by IIG |
|||||||
|
Period |
|
Organization Costs |
|
Offering Expenses |
|
Total |
||||
|
Year Ended |
|
|
|
|
|
|
|
|
|
|
|
December 31, 2012(1) |
|
$ |
191,717 |
|
$ |
1,820,128 |
|
$ |
2,011,845 |
|
|
December 31, 2013 |
|
|
- |
|
|
- |
|
|
- |
|
|
Three Months Ended |
|
|
|
|
|
|
|
|
|
|
|
March 31, 2014 |
|
|
- |
|
|
- |
|
|
- |
|
|
Total |
|
|
191,717 |
|
|
1,820,128 |
|
|
2,011,845 |
|
|
Expenses submitted for reimbursement by IIG(2) |
|
|
- |
|
|
(1,591,475) |
|
|
(1,591,475) |
|
|
Total Unreimbursed Expenses Incurred by IIG |
|
$ |
191,717 |
|
$ |
228,653 |
|
$ |
420,370 |
|
|
|
|
|
|
|
|
|
|
|
|
|
|
|
|
|
Organization Costs and Offering Expenses Incurred by the Company(3) |
|||||||
|
Period |
|
Organization Costs |
|
Offering Expenses |
|
Total |
||||
|
Year Ended |
|
|
|
|
|
|
|
|
|
|
|
December 31, 2012(1) |
|
$ |
- |
|
$ |
29,652 |
|
$ |
29,652 |
|
|
December 31, 2013 |
|
|
- |
|
|
1,786,978 |
|
|
1,786,978 |
|
|
Three Months Ended |
|
|
|
|
|
|
|
|
|
|
|
March 31, 2014 |
|
|
- |
|
|
539,720 |
|
|
539,720 |
|
|
Total |
|
|
- |
|
|
2,356,350 |
|
|
2,356,350 |
|
|
Expenses reimbursed by the Company(2) |
|
|
- |
|
|
1,591,475 |
|
|
1,591,475 |
|
|
Total Expenses Incurred by the Company |
|
$ |
- |
|
$ |
3,947,825 |
|
$ |
3,947,825 |
|
|
|
|
|
|
|
|
|
|
|
|
|
|
Expenses paid as of March 31, 2014 |
|
$ |
- |
|
$ |
3,061,183 |
|
$ |
3,061,183 |
|
|
Expenses accrued as of March 31, 2014(4) |
|
|
- |
|
|
886,642 |
|
|
886,642 |
|
|
Total Expenses Incurred by the Company |
|
$ |
- |
|
$ |
3,947,825 |
|
$ |
3,947,825 |
|
|
|
|
|
|
|
|
|
|
|
|
|
|
|
|
|
|
|
|
|
|
|
|
|
|
(1) |
Organization costs and offering expenses were incurred from January 31, 2012 (Inception) through December 31, 2012. |
|||||||||
|
(2) |
Of this amount, $1,000,000 of expenses charged directly to equity were submitted for reimbursement by IIG on December 17, 2012, and $591,475 of expenses charged directly to general and administrative expense were submitted for reimbursement by IIG during the three months ended March 31, 2014. |
|||||||||
|
(3) |
Offering expenses incurred directly by the Company are included in general and administrative expense on the consolidated statements of operations. |
|||||||||
|
(4) |
Of this amount, $591,475 of offering expenses accrued by the Company are included in due to IIG - offering expenses on the consolidated balance sheets. The remainder is included in accounts payable and accrued expenses on the consolidated balance sheets. |
|||||||||
No material organization costs or offering expenses have been incurred subsequent to March 31, 2014.
10
CĪON Investment Corporation
Notes to Consolidated Financial Statements
March 31, 2014
(unaudited)
Income Taxes
The Company elected to be treated for federal income tax purposes as a RIC under Subchapter M of the Code. To qualify and maintain qualification as a RIC, the Company must, among other things, meet certain source of income and asset diversification requirements and distribute to shareholders, for each taxable year, at least 90% of the Company’s “investment company taxable income”, which is generally the Company’s net ordinary income plus the excess, if any, of realized net short-term capital gains over realized net long-term capital losses. If the Company continues to qualify as a RIC and continues to satisfy the annual distribution requirement, the Company will not have to pay corporate level federal income taxes on any income that the Company distributes to its shareholders. The Company intends to make distributions in an amount sufficient to maintain RIC status each year and to avoid any federal income taxes on income. The Company will also be subject to nondeductible federal excise taxes if the Company does not distribute at least 98.0% of net ordinary income, 98.2% of any capital gains, if any, and any recognized and undistributed income from prior years for which it paid no federal income taxes.
Book and tax differences relating to permanent differences are reclassified among the Company’s capital accounts, as appropriate. Additionally, the tax character of distributions is determined in accordance with income tax regulations that may differ from GAAP (see Note 5). During the three months ended March 31, 2014 and 2013, the Company declared distributions of $3,314,444 and $208,766, respectively.
Uncertainty in Income Taxes
The Company evaluates its tax positions to determine if the tax positions taken meet the minimum recognition threshold for the purposes of measuring and recognizing tax liabilities in the consolidated financial statements. Recognition of a tax benefit or liability with respect to an uncertain tax position is required only when the position is “more likely than not” to be sustained assuming examination by the taxing authorities. The Company recognizes interest and penalties, if any, related to unrecognized tax benefits as income tax expense in the consolidated statements of operations. As of and during the three months ended March 31, 2014 and 2013, the Company did not have any uncertain tax positions.
The Company is subject to examination by U.S. federal, New York State, New York City and Maryland income tax jurisdictions for 2012.
Use of Estimates
The preparation of the consolidated financial statements in conformity with GAAP requires the Company to make estimates and assumptions that affect the reported amounts of assets and liabilities at the date of the consolidated financial statements and the reported amounts of revenues and expenses during the reporting period. Actual results may materially differ from those estimates.
Valuation of Portfolio Investments
The fair value of the Company’s investments is determined quarterly in good faith by the Company’s board of directors pursuant to its consistently applied valuation procedures and valuation process. Accounting Standards Codification Topic 820, Fair Value Measurements and Disclosure, or ASC Topic 820, defines fair value as the price that would be received from the sale of an asset or paid to transfer a liability in an orderly transaction between market participants at the measurement date. ASC Topic 820 also establishes a three-tier fair value hierarchy, which prioritizes the inputs used in measuring fair value. These tiers include: Level 1, defined as observable inputs such as quoted prices in active markets; Level 2, defined as observable inputs such as quoted prices for similar securities in active markets and quoted prices for identical securities where there is little or no activity in the market; and Level 3, defined as unobservable inputs for which little or no market data exists, therefore requiring an entity to develop its own assumptions.
The Company’s investments as of March 31, 2014, excluding short term investments, consisted primarily of debt securities that are traded on a private over-the-counter market for institutional investments. Except as described below, for each investment, CIM will attempt to obtain the most recent closing public market price. If no sales of such investment occurred on the determination date, such investment will be valued at the midpoint of the “bid” and the “ask” price at the close of business on such day. Portfolio securities that carry certain restrictions on sale will typically be consistently valued at a discount from the public market value of the security.
11
CĪON Investment Corporation
Notes to Consolidated Financial Statements
March 31, 2014
(unaudited)
The Company valued its total return swap, or TRS, in accordance with the agreements between Flatiron and Citibank, N.A., or Citibank, which collectively establish the TRS, or TRS Agreement. Pursuant to the TRS Agreement, the fair value of the TRS is based on the increase or decrease in the value of the loans underlying the TRS. The loans underlying the TRS are valued by Citibank. Citibank bases its valuation primarily on the indicative bid prices provided by an independent third-party pricing service. Bid prices reflect a price that market participants may be willing to pay for an investment. These valuations are sent to the Company for review and testing. The Company reviews and approves the value of the TRS, as well as the value of the loans underlying the TRS, on a quarterly basis as part of the quarterly valuation process. To the extent the Company has any questions or concerns regarding the valuation of the loans underlying the TRS, such valuations will be discussed or challenged pursuant to the terms of the TRS Agreement. As a result of the private nature of this marketplace (meaning actual transactions are not publicly reported), the Company believes that the total fair value of the TRS should be classified as Level 3 within the fair value hierarchy. If the Company owns identical investments in its investment portfolio and through the TRS, the Company utilizes the TRS pricing for consistency. For additional information on the TRS, see Note 7.
Notwithstanding the foregoing, if in the reasonable judgment of CIM, the price for any securities held by the Company and determined in the manner described above does not accurately reflect the fair value of such security, CIM will value such security at a price that reflects such security’s fair value and report such change in the valuation to the board of directors or its designee as soon as practicable.
Any securities or other assets that are not publicly traded or for which a market price is not otherwise readily available will be valued at a price that reflects its fair value. With respect to such investments, the investments will be reviewed and valued using one or more of the following types of analyses:
i. Market comparable statistics and public trading multiples discounted for illiquidity, minority ownership and other factors for companies with similar characteristics.
ii. Valuations implied by third-party investments in the applicable portfolio companies.
iii.
Discounted cash flow analysis,
including a terminal value or exit multiple.
Determination of fair value involves subjective judgments and estimates. Accordingly, these notes to the Company’s consolidated financial statements refer to the uncertainty with respect to the possible effect of such valuations, and any change in such valuations, on the Company’s consolidated financial statements. Below is a description of factors that the Company’s board of directors may consider when valuing the Company’s equity and debt investments where a market price is not readily available:
· the size and scope of a portfolio company and its specific strengths and weaknesses;
· prevailing interest rates for like securities;
· expected volatility in future interest rates;
· leverage;
· call features, put features and other relevant terms of the debt;
· the borrower’s ability to adequately service its debt;
· the fair market value of the portfolio company in relation to the face amount of its outstanding debt;
· the quality of collateral securing the Company’s debt investments;
· multiples of earnings before interest, taxes, depreciation and amortization, or EBITDA, cash flows, net income, revenues or, in some cases, book value or liquidation value; and
· other factors deemed applicable.
All of these factors may be subject to adjustment based upon the particular circumstances of a portfolio company or the Company’s actual investment position. For example, adjustments to EBITDA may take into account compensation to previous owners, or acquisition, recapitalization, and restructuring expenses or other related or non-recurring items. The choice of analyses and the weight assigned to such factors may vary across investments and may change within an investment if events occur that warrant such a change.
Consistent with the Company’s valuation policy, the Company evaluates the source of inputs, including any markets in which the Company’s investments are trading, in determining fair value.
The Company periodically benchmarks the “bid” and “ask” prices it receives from the third-party pricing services against the actual prices at which the Company purchases and sells its investments. Based on the results of the benchmark analysis and the experience of the Company’s management in purchasing and selling these investments, the Company believes that these prices are reliable indicators of fair value. However, because of the private nature of this marketplace (meaning actual transactions are not publicly reported), the Company believes that these valuation inputs are classified as Level 2 or Level 3 within the fair value hierarchy.
12
CĪON Investment Corporation
Notes to Consolidated Financial Statements
March 31, 2014
(unaudited)
Due to the uncertainty inherent in the valuation process, particularly for Level 2 and Level 3 investments, such fair value estimates may differ materially from the values that would have been used had an active market for the securities existed. In addition, changes in the market environment and other events that may occur over the life of the investments may cause the gains or losses that the Company ultimately realizes on these investments to materially differ from the valuations currently assigned.
Revenue Recognition
Securities transactions are accounted for on the trade date. The Company records interest and dividend income on an accrual basis beginning on the trade settlement date or the ex-dividend date, respectively, to the extent that the Company expects to collect such amounts. Loan origination fees, original issue discounts, and market discounts/premiums are recorded and such amounts are amortized as adjustments to interest income over the respective term of the loan using the effective interest method. Upon the prepayment of a loan or debt security, any unamortized loan origination fees are recorded as interest income. The Company records prepayment premiums on loans and debt securities as interest income when it receives such amounts.
The Company may have investments in its investment portfolio that contain a paid-in-kind, or PIK, interest provision. Any PIK interest will be added to the principal balance of such investments and is recorded as income, if the portfolio company valuation indicates that such PIK interest is collectible. In order to maintain RIC status, substantially all of this income must be paid out to shareholders in the form of distributions, even if the Company has not collected any cash.
Loans and debt securities, including those that are individually identified as being impaired under Accounting Standards Codification 310, or ASC 310, Receivables, are generally placed on nonaccrual status immediately if, in the opinion of management, principal or interest is not likely to be paid in accordance with the terms of the debt agreement, or when principal or interest is past due 90 days or more. Interest accrued but not collected at the date a loan or security is placed on nonaccrual status is reversed against interest income. Interest income is recognized on nonaccrual loans or debt securities only to the extent received in cash. However, where there is doubt regarding the ultimate collectibility of principal, cash receipts, whether designated as principal or interest, are thereafter applied to reduce the carrying value of the loan or debt security. Loans or securities are restored to accrual status only when interest and principal payments are brought current and future payments are reasonably assured.
Net Realized Gains or Losses and Net Change in Unrealized Appreciation or Depreciation
Gains or losses on the sale of investments are calculated by using the weighted-average method. The Company measures realized gains or losses by the difference between the net proceeds from the repayment or sale and the weighted-average amortized cost of the investment, without regard to unrealized appreciation or depreciation previously recognized, but considering unamortized upfront fees and prepayment penalties. Net change in unrealized appreciation or depreciation reflects the change in portfolio investment values during the reporting period, including any reversal of previously recorded unrealized appreciation or depreciation when gains or losses are realized.
Derivative Instrument
The Company’s only derivative instrument is the TRS. The Company marks its derivative to market through net change in unrealized appreciation on total return swap in the consolidated statements of operations. For additional information on the TRS, see Note 7.
Capital Gains Incentive Fee
Pursuant to the terms of the investment advisory agreement the Company entered into with CIM, the incentive fee on capital gains earned on liquidated investments of the Company’s investment portfolio during operations is determined and payable in arrears as of the end of each calendar year. Such fee equals 20% of the Company’s incentive fee capital gains (i.e., the Company’s realized capital gains on a cumulative basis from inception, calculated as of the end of each calendar year, computed net of all realized capital losses and unrealized capital depreciation on a cumulative basis), less the aggregate amount of any previously paid capital gains incentive fees. On a cumulative basis and to the extent that all realized capital losses and unrealized capital depreciation exceed realized capital gains as well as the aggregate realized net capital gains for which a fee has previously been paid, the Company would not be required to pay CIM a capital gains incentive fee. On a quarterly basis, the Company accrues for the capital gains incentive fee by calculating such fee as if it were due and payable as of the end of such period.
CIM has not taken any incentive fees with respect to the Company’s TRS to date. For purposes of computing the capital gains incentive fee, CIM will become entitled to a capital gains incentive fee only upon the termination or disposition of the TRS, at which point all net gains and losses of the underlying loans constituting the reference assets of the TRS will be realized. For purposes of computing the subordinated incentive fee on income, CIM is not entitled to a subordinated incentive fee on income with respect to the TRS. Any unrealized gains on the TRS are reflected in total assets on the Company’s consolidated balance sheets and included in the computation of the base management fee.
13
CĪON Investment Corporation
Notes to Consolidated Financial Statements
March 31, 2014
(unaudited)
While the investment advisory agreement with CIM neither includes nor contemplates the inclusion of unrealized gains in the calculation of the capital gains incentive fee, pursuant to an interpretation of the American Institute for Certified Public Accountants, or AICPA, Technical Practice Aid for investment companies, the Company accrues capital gains incentive fees on unrealized gains. This accrual reflects the incentive fees that would be payable to CIM if the Company’s entire investment portfolio was liquidated at its fair value as of the balance sheet date even though CIM is not entitled to an incentive fee with respect to unrealized gains unless and until such gains are actually realized.
Net Increase in Net Assets per Share
Net increase in net assets per share is calculated based upon the daily weighted average number of shares of common stock outstanding during the reporting period.
Distributions
Distributions to shareholders are recorded as of the record date. The amount to be paid as a distribution is determined by the board of directors on a monthly basis. Net realized capital gains, if any, are distributed at least annually.
The following table summarizes transactions with respect to shares of the Company’s common stock during the three months ended March 31, 2014 and 2013:
|
|
|
|
Three Months Ended |
||||||||||
|
|
|
|
March 31, 2014 |
|
March 31, 2013 |
||||||||
|
|
|
|
Shares |
|
Amount |
|
Shares |
|
Amount |
||||
|
Gross proceeds from the offering |
|
|
8,232,851 |
|
$ |
84,923,898 |
|
|
1,208,522 |
|
$ |
12,135,218 |
|
|
Reinvestment of distributions |
|
|
248,836 |
|
|
2,333,953 |
|
|
3,263 |
|
|
31,413 |
|
|
Total gross proceeds |
|
|
8,481,687 |
|
|
87,257,851 |
|
|
1,211,785 |
|
|
12,166,631 |
|
|
Sales commissions and dealer manager fees |
|
|
- |
|
|
(7,750,349) |
|
|
- |
|
|
(1,127,904) |
|
|
|
Net proceeds from share transactions |
|
|
8,481,687 |
|
$ |
79,507,502 |
|
|
1,211,785 |
|
$ |
11,038,727 |
During the three months ended March 31, 2014 and 2013, the Company sold 8,481,687 and 1,211,785 shares, respectively, at an average price per share of $10.29 and $10.04, respectively.
The proceeds from the reinvestment of shareholder distributions are included in the gross proceeds from the Company’s offering for purposes of determining the total amount of organization costs and offering expenses that can be paid by the Company (see Note 4).
As of March 31, 2014, the Company sold 23,991,865 shares for gross proceeds of $244,390,076 at an average price per share of $10.19. The gross proceeds received include reinvested shareholder distributions of $3,876,967, for which the Company issued 411,716 shares of common stock. Since commencing its continuous public offering on July 2, 2012 and through May 8, 2014, the Company sold 28,211,914 shares of common stock for net proceeds of $287,721,756 at an average price per share of $10.20. The net proceeds include gross proceeds received from reinvested shareholder distributions of $4,847,114, for which the Company issued 514,868 shares of common stock and gross proceeds paid for shares of common stock tendered for repurchase of $45,905, for which the Company repurchased 4,881 shares of common stock.
During the period from April 1, 2014 to May 8, 2014, the Company sold 4,220,049 shares of common stock for net proceeds of $43,331,680 at an average price per share of $10.27. The net proceeds include gross proceeds received from reinvested shareholder distributions of $970,147, for which the Company issued 103,152 shares of common stock and gross proceeds paid for shares of common stock tendered for repurchase of $45,905, for which the Company repurchased 4,881 shares of common stock.
On December 28, 2012, January 31, 2013, March 14, 2013, May 15, 2013, August 15, 2013, and February 4, 2014, the Company’s board of directors increased the public offering price per share of common stock under the Company’s offering to $10.04, $10.13, $10.19, $10.24, $10.32 and $10.45 per share, respectively, to ensure that the associated offering price per share, net of sales commissions and dealer manager fees, equaled or exceeded the net asset value per share on each subsequent subscription closing date and distribution reinvestment date.
Share Repurchase Program
Beginning in the first quarter of 2014 the Company began offering, and on a quarterly basis thereafter it intends to continue offering, to repurchase shares on such terms as may be determined by the Company’s board of directors in its complete and absolute discretion unless, in the judgment of the independent directors of the Company’s board of directors, such repurchases would not be in the best interests of the Company’s shareholders or would violate applicable law.
14
CĪON Investment Corporation
Notes to Consolidated Financial Statements
March 31, 2014
(unaudited)
The Company currently limits the number of shares to be repurchased during any calendar year to the number of shares it can repurchase with the proceeds it receives from the issuance of shares pursuant to its second amended and restated distribution reinvestment plan. At the discretion of the Company’s board of directors, it may also use cash on hand, cash available from borrowings and cash from liquidation of investments as of the end of the applicable period to repurchase shares. In addition, the Company limits the number of shares to be repurchased in any calendar year to 15% of the weighted average number of shares outstanding in the prior calendar year, or 3.75% in each quarter, though the actual number of shares that it offers to repurchase may be less in light of the limitations noted above. The Company offers to repurchase such shares at a price equal to 90% of the offering price in effect on each date of repurchase.
On April 2, 2014, the Company completed its first tender offer in connection with its share repurchase program and repurchased 4,880.906 shares (representing 100% of the shares of common stock tendered for repurchase) at $9.405 per share for aggregate consideration totaling $45,905.
Any periodic repurchase offers are subject in part to the Company’s available cash and compliance with the BDC and RIC qualification and diversification rules promulgated under the Code and the 1940 Act. While the Company conducts quarterly tender offers as described above, it is not required to do so and may suspend or terminate the share repurchase program at any time, upon 30 days’ notice.
Note 4. Transactions with Related Parties
The Company has entered into an investment advisory agreement with CIM. Pursuant to the investment advisory agreement, CIM is paid an annual base management fee equal to 2.0% of the average value of the Company’s gross assets, less cash and cash equivalents, and an incentive fee based on the Company’s performance, as described below. The incentive fee consists of two parts. The first part, which is referred to as the subordinated incentive fee on income, is calculated and payable quarterly in arrears based on “pre-incentive fee net investment income” for the immediately preceding quarter and is subject to a hurdle rate, measured quarterly and expressed as a rate of return on adjusted capital, as defined in the investment advisory agreement, equal to 1.875% per quarter, or an annualized rate of 7.5%. The second part of the incentive fee, which is referred to as the incentive fee on capital gains, is described in Note 2. Refer to Note 7 for a discussion of CIM’s entitlement to receive incentive fees and accrual of the incentive fee on capital gains with respect to the TRS.
The Company began accruing fees under the investment advisory agreement on December 17, 2012, upon the commencement of the Company’s operations. For the three months ended March 31, 2014 and 2013, CIM earned $908,807 and $44,742 in management fees, respectively. During these periods, all management fees were reimbursed to the Company by IIG in accordance with the expense support and conditional reimbursement agreement entered into with IIG, or the expense support and conditional reimbursement agreement.
The Company accrues the capital gains incentive fee based on net realized and unrealized gains; however, under the terms of the investment advisory agreement, the fee payable to CIM is based on net realized gains and no such fee is payable with respect to unrealized gains unless and until such gains are actually realized. For the three months ended March 31, 2014 and 2013, the Company recorded capital gains incentive fees of $525,326 and $117,023, respectively, based on the performance of its investment portfolio, of which $386,656 and $74,992, respectively, were based on net unrealized gains and $138,670 and $42,031, respectively, were based on realized gains. During these periods, all incentive fees generated from realized gains were reimbursed to the Company by IIG in accordance with the expense support and conditional reimbursement agreement. In addition, see Note 7 for a discussion of CIM’s entitlement to receive incentive fees and accrual of the incentive fee on capital gains with respect to the TRS.
On January 30, 2013, the Company entered into the expense support and conditional reimbursement agreement with IIG, whereby IIG agreed to reimburse the Company for expenses in an amount that is sufficient to: (1) ensure that no portion of the Company’s distributions to shareholders will be paid from its offering proceeds or borrowings, and/or (2) reduce the Company’s operating expenses until it has achieved economies of scale sufficient to ensure that it bears a reasonable level of expense in relation to its investment income. Pursuant to the expense support and conditional reimbursement agreement, the Company has a conditional obligation to reimburse IIG for any amounts funded by IIG under such agreement if, during any fiscal quarter occurring within three years of the date on which IIG funded such amount, the sum of the Company’s net investment income for tax purposes, net capital gains and the amount of any dividends and other distributions paid to the Company on account of investments in portfolio companies exceeds the distributions paid by the Company to its shareholders. For the three months ended March 31, 2014 and 2013, the total expense reimbursement from IIG was $1,048,858 and $819,373, respectively, relating to certain operating expenses.
On December 13, 2013, the Company and IIG amended and restated the expense support and conditional reimbursement agreement to extend the termination date of such agreement from January 30, 2014 to January 30, 2015.
15
CĪON Investment Corporation
Notes to Consolidated Financial Statements
March 31, 2014
(unaudited)
The Company may fund its cash distributions to shareholders from any sources of funds available to the Company, including offering proceeds, borrowings, net investment income from operations, capital gains proceeds from the sale of assets, non-capital gains proceeds from the sale of assets, dividends or other distributions paid to it on account of preferred and common equity investments in portfolio companies and expense reimbursements from IIG, which are subject to recoupment. The Company has not established limits on the amount of funds it may use from available sources to make distributions. A substantial portion of the Company’s distributions have resulted, and future distributions may result, from expense reimbursements from IIG, which are subject to repayment by the Company within three years. The purpose of this arrangement is to avoid such distributions being characterized as a return of capital for tax purposes. Shareholders should understand that any such distributions are not based on the Company’s investment performance, and can only be sustained if the Company achieves positive investment performance in future periods and/or IIG continues to make such expense reimbursements. Shareholders should also understand that the Company’s future repayments will reduce the distributions that they would otherwise receive. There can be no assurance that the Company will achieve such performance in order to sustain these distributions, or be able to pay distributions at all. IIG has no obligation to provide expense reimbursements to the Company in future periods. For the three months ended March 31, 2014 and 2013, if expense reimbursements from IIG were not supported, some or all of the distributions may have been a return of capital for tax purposes.
The table below presents a summary of all expenses supported by IIG and the associated dates through which such expenses are eligible for reimbursement by the Company for each of the following three month periods.
|
Three Months Ended |
|
|
Expense Support Received from IIG |
|
Expense Support Reimbursed to IIG |
|
Unreimbursed Expense Support |
|
Ratio of Operating Expense to Average Net Assets for the Period(1) |
|
Annualized Distribution Rate for the Period(3) |
|
Eligible for Reimbursement through |
|||
|
December 31, 2012 |
|
$ |
116,706 |
|
$ |
- |
|
$ |
116,706 |
|
0.93% |
|
0.00%(2) |
|
December 31, 2015 |
|
|
March 31, 2013 |
|
|
819,373 |
|
|
- |
|
|
819,373 |
|
2.75% |
|
7.00% |
|
March 31, 2016 |
|
|
June 30, 2013 |
|
|
1,147,536 |
|
|
- |
|
|
1,147,536 |
|
1.43% |
|
7.00% |
|
June 30, 2016 |
|
|
September 30, 2013 |
|
|
1,296,834 |
|
|
- |
|
|
1,296,834 |
|
0.49% |
|
7.00% |
|
September 30, 2016 |
|
|
December 31, 2013 |
|
|
695,160 |
|
|
- |
|
|
695,160 |
|
0.31% |
|
7.00% |
|
December 31, 2016 |
|
|
March 31, 2014 |
|
|
1,048,858 |
|
|
- |
|
|
1,048,858 |
|
0.52% |
|
7.00% |
|
March 31, 2017 |
|
|
Total |
|
$ |
5,124,467 |
|
$ |
- |
|
$ |
5,124,467 |
|
|
|
|
|
|
|
|
|
|
|
|
|
|
|
|
|
|
|
|
|
|
|
|
|
|
(1) |
Operating expenses include all expenses borne by the Company, except for organization costs and offering expenses, base management fees, incentive fees, administrative services expenses and other general and administrative expenses owed to CIM and its affiliates and interest expense. |
|
(2) |
The Company did not declare any distributions during the three months ended December 31, 2012. |
|
(3) |
Annualized Distribution Rate equals the annualized rate of distributions paid to shareholders based on the amount of the regular cash distributions paid immediately prior to the date the expense support payment obligation was incurred by CIM. Annualized Distribution Rate does not include special cash or stock distributions paid to shareholders. |
Pursuant to the expense support and conditional reimbursement agreement, the Company will have a conditional obligation to reimburse IIG for any amounts funded by IIG under such agreement (i) if expense reimbursement amounts funded by IIG exceed operating expenses incurred during any fiscal quarter, (ii) if the sum of the Company’s net investment income for tax purposes, net capital gains and the amount of any dividends and other distributions paid to the Company on account of investments in portfolio companies (to the extent not included in net investment income or net capital gains for tax purposes) exceeds the distributions paid by the Company to shareholders, and (iii) during any fiscal quarter occurring within three years of the date on which IIG funded such amount.
Reimbursement of such costs will be determined as appropriate to meet the objectives of the expense support and conditional reimbursement agreement. As a result, the Company may or may not be requested to reimburse any of these costs by IIG. As of March 31, 2014, the total net payable due to IIG was $970,278, of which $591,475 was related to organization costs and offering expenses submitted for reimbursement and $378,803 was related to fees earned and expense reimbursement support provided by IIG during the three months ended March 31, 2014. As of December 31, 2013, the net reimbursement due from IIG was $545,593.
16
CĪON Investment Corporation
Notes to Consolidated Financial Statements
March 31, 2014
(unaudited)
The Company or IIG may terminate the expense support and conditional reimbursement agreement at any time. IIG has indicated that it expects to continue such reimbursements until it deems that the Company has achieved economies of scale sufficient to ensure that it bears a reasonable level of expenses in relation to its income. If the Company terminates the investment advisory agreement with CIM, the Company may be required to repay IIG all reimbursements funded by IIG within three years of the date of termination. The specific amount of expenses reimbursed by IIG, if any, will be determined at the end of each quarter. There can be no assurance that the expense support and conditional reimbursement agreement will remain in effect or that IIG will reimburse any portion of the Company’s expenses in future quarters.
The Company entered into an administration agreement with CIM’s affiliate, ICON Capital, LLC, formerly known as ICON Capital Corp., or ICON Capital, pursuant to which ICON Capital furnishes the Company with administrative services including accounting, investor relations and other administrative services necessary to conduct its day-to-day operations. ICON Capital is reimbursed for administrative expenses it incurs on the Company’s behalf in performing its obligations, provided that such reimbursement will be for the lower of ICON Capital’s actual costs or the amount that the Company would be required to pay for comparable administrative services in the same geographic location. Such costs will be reasonably allocated to the Company on the basis of assets, revenues, time records or other reasonable methods. The Company will not reimburse ICON Capital for any services for which it receives a separate fee or for rent, depreciation, utilities, capital equipment or other administrative items allocated to a person with a controlling interest in ICON Capital. For the three months ended March 31, 2014 and 2013, the Company incurred administrative services expenses to ICON Capital of $415,395 and $263,555, respectively, the majority of which related to the allocation of costs of administrative personnel for services rendered to the Company and the remainder related to other reimbursable expenses. During these periods, all or a portion of administrative expenses were reimbursed by IIG in accordance with the expense support and conditional reimbursement agreement.
The Company’s payment of organization costs and offering expenses will not exceed 1.5% of the actual gross proceeds raised from the offering (without giving effect to any potential reimbursements from IIG and its affiliates). If the Company sells the maximum number of shares at its latest public offering price of $10.45 per share, the Company estimates that it may incur up to approximately $15,675,000 of expenses. Under the terms of the investment advisory agreement, CIM and certain of its affiliates, which includes IIG, are entitled to receive reimbursement of up to 1.5% of the gross proceeds raised until all organization costs and offering expenses have been reimbursed. Previously, the Company interpreted “raised” to mean all gross proceeds that the Company expected to raise through the completion of the offering of its shares, which could be late as December 31, 2015, rather than actual gross proceeds raised through the date of reimbursement. Consistent with such application and since the Company believed it would raise at least $100 million through the completion of the offering of its shares, upon commencement of operations on December 17, 2012, the Company issued 111,111 shares of the Company’s common stock at $9.00 per share to IIG in lieu of payment of $1,000,000 for organization costs and offering expenses submitted for reimbursement. The transactions satisfied an independent obligation of IIG to invest $1,000,000 in the Company’s shares. Through that date, the Company had raised gross proceeds from unaffiliated outside investors of $2,639,439 and from affiliated investors of $2,000,000, which, applying 1.5% of actual proceeds raised through the date of reimbursement, would have resulted in CIM being entitled to $69,592.
With respect to any future reimbursements for organization costs and offering expenses, the Company will interpret the 1.5% limit based on actual gross proceeds raised at the time of such reimbursement. In addition, the Company will not issue any of its shares or other securities for services or for property other than cash or securities except as a dividend or distribution to its security holders or in connection with a reorganization. Consistent with this interpretation, on May 30, 2013, IIG paid the Company $1,000,000, plus interest accrued at a rate of 7% per year.
From inception through March 31, 2014, IIG and its affiliates incurred organization costs and offering expenses of approximately $2,012,000, of which $1,591,475 has been submitted to the Company for reimbursement, and of which the Company paid $450,000 in October 2013 and $550,000 in March 2014. No additional material organization costs or offering expenses have been incurred by IIG or its affiliates subsequent to March 31, 2014. The decision to fund the Company’s organization costs and offering expenses and the decision to seek reimbursement for such costs is solely at the discretion of IIG and its affiliates. As a result, the Company may or may not be requested to reimburse any remaining costs funded by IIG and its affiliates.
As of March 31, 2014, the Company raised gross proceeds of $244,390,076, of which it can pay up to $3,665,851 in organization costs and offering expenses (which represents 1.5% of the actual gross proceeds raised). Through March 31, 2014, the Company paid $3,061,183 of such costs and expenses, leaving an additional $604,668 that can be paid, of which $591,475 was submitted for reimbursement by IIG during the quarter. As of May 8, 2014, the Company raised gross proceeds of $287,721,756, of which it can pay up to $4,315,826 in organization costs and offering expenses (which represents 1.5% of the actual gross proceeds raised). Through May 8, 2014, the Company paid $3,410,105 of such costs and expenses, leaving an additional $905,721 that can be paid.
The Company has entered into certain agreements with CIM’s affiliate, ICON Securities, LLC, formerly known as ICON Securities Corp., or ICON Securities, whereby the Company pays certain fees and reimbursements. ICON Securities is entitled to receive a 3% dealer manager fee from gross offering proceeds from the sale of the Company’s shares. The selling dealers are entitled to receive a sales commission of up to 7% of gross offering proceeds. Such costs are charged against capital in excess of par value when incurred. For the three months ended March 31, 2014, the Company incurred sales commissions of $5,237,154 to the selling dealers and dealer manager fees of $2,513,195 to ICON Securities. Since commencing its continuous public offering on July 2, 2012 and through May 8, 2014, the Company paid or accrued sales commissions of $16,934,881 to the selling dealers and dealer manager fees of $8,177,216 to ICON Securities.
17
CĪON Investment Corporation
Notes to Consolidated Financial Statements
March 31, 2014
(unaudited)
Fees and other expenses incurred by the Company related to CIM and its affiliates were as follows:
|
|
|
|
|
|
|
Three Months |
|
Three Months |
||
|
|
|
|
|
|
|
Ended |
|
Ended |
||
|
Entity |
|
Capacity |
|
Description |
|
March 31, 2014 |
|
March 31, 2013 |
||
|
ICON Securities |
|
Dealer manager |
|
Dealer manager fees(1) |
|
$ |
2,513,195 |
|
$ |
358,269 |
|
CIM |
|
Investment adviser |
|
Management fees(2)(3) |
|
|
908,807 |
|
|
44,742 |
|
CIM |
|
Investment adviser |
|
Incentive fees(2)(3) |
|
|
525,326 |
|
|
117,023 |
|
ICON Capital |
|
Administrative services provider |
|
Administrative services expense(2)(3) |
|
|
415,395 |
|
|
263,555 |
|
IIG |
|
Sponsor |
|
Organization costs and offering expenses reimbursement(2) |
|
|
591,475 |
|
|
- |
|
|
|
|
|
|
|
$ |
4,954,198 |
|
$ |
783,589 |
|
|
|
|
|
|
|
|
|
|
|
|
|
(1) Amount charged directly to equity. |
|
|
|
|
|
|
||||
|
(2) Amount charged directly to operations. |
|
|
|
|
|
|
||||
|
(3) All or a portion of the expense has been supported in connection with the expense support and conditional reimbursement agreement. |
||||||||||
Because CIM’s senior management team is comprised of substantially the same personnel as the senior management team of the Company’s affiliate, ICON Capital, which is the investment manager to certain equipment finance funds, or equipment funds, such members of senior management provide investment advisory and management services to the equipment funds in addition to the Company. In the event that CIM undertakes to provide investment advisory services to other clients in the future, it will strive to allocate investment opportunities in a fair and equitable manner consistent with the Company’s investment objective and strategies so that the Company will not be disadvantaged in relation to any other client of the investment adviser or its senior management team. However, it is currently possible that some investment opportunities will be provided to the equipment funds or other clients of CIM rather than to the Company.
Indemnifications
The investment advisory agreement, the investment sub-advisory agreement, the administration agreement and the dealer manager agreement each provide certain indemnifications from the Company to the other relevant parties to such agreements. The Company’s maximum exposure under these agreements is unknown. However, the Company has not experienced claims or losses pursuant to these agreements and believes the risk of loss related to such indemnifications to be remote.
Note 5. Distributions
The Company’s board of directors declared distributions for twenty four and nine record dates during the year ended December 31, 2013 and three months ended March 31, 2014, respectively. Declared distributions are paid monthly.
The following table presents cash distributions per share that were declared during the year ended December 31, 2013 and three months ended March 31, 2014:
|
|
|
Distributions |
||||
|
Three Months Ended |
|
Per Share |
|
Amount |
||
|
Fiscal 2013 |
|
|
|
|
|
|
|
March 31, 2013 (six record dates) |
|
$ |
0.1769 |
|
$ |
208,766 |
|
June 30, 2013 (six record dates) |
|
|
0.1788 |
|
|
518,630 |
|
September 30, 2013 (six record dates) |
|
|
0.1799 |
|
|
1,089,797 |
|
December 31, 2013 (six record dates) |
|
|
0.1806 |
|
|
2,157,124 |
|
Fiscal 2014 |
|
|
|
|
|
|
|
March 31, 2014 (nine record dates) |
|
$ |
0.1679 |
|
$ |
3,314,444 |
On February 1, 2014, the Company changed from semi-monthly closings to weekly closings for the sale of the Company’s shares pursuant to its continuous public offering. As result, the Company’s board of directors authorizes and declares on a monthly basis a weekly distribution amount per share of common stock.
18
CĪON Investment Corporation
Notes to Consolidated Financial Statements
March 31, 2014
(unaudited)
On March 14, 2014, the Company’s board of directors declared five weekly cash distributions of $0.014067 per share, which were paid on April 30, 2014 to shareholders of record on April 1, April 8, April 15, April 22 and April 29, 2014. On April 15, 2014, the board of directors declared four weekly cash distributions of $0.014067 per share, payable on May 28, 2014 to shareholders of record on May 6, May 13, May 20 and May 27, 2014.
The Company has adopted an “opt in” distribution reinvestment plan for shareholders. As a result, if the Company makes a distribution, shareholders will receive distributions in cash unless they specifically “opt in” to the second amended and restated distribution reinvestment plan so as to have their cash distributions reinvested in additional shares of the Company’s common stock.
The Company may fund cash distributions to shareholders in the future from any sources of funds available, including offering proceeds, borrowings, net investment income from operations, capital gains proceeds from the sale of assets, non-capital gains proceeds from the sale of assets, dividends or other distributions paid to the Company on account of preferred and common equity investments in portfolio companies and expense reimbursements from IIG. A substantial portion of the Company’s distributions have resulted, and future distributions may result, from expense reimbursements from IIG, which are subject to repayment by the Company. The Company has not established limits on the amount of funds it may use from available sources to make distributions.
The following table reflects the sources of cash distributions that the Company has declared on its shares of common stock during the three months ended March 31, 2014 and 2013:
|
|
|
|
Three Months Ended |
||||||||||||||
|
|
|
|
March 31, 2014 |
|
March 31, 2013 |
||||||||||||
|
Source of Distribution |
|
Per Share |
|
Amount |
|
Percentage |
|
Per Share |
|
Amount |
|
Percentage |
|||||
|
Net realized gain on total return swap |
|
|
|
|
|
|
|
|
|
|
|
|
|
|
|
|
|
|
Net interest and other income from TRS portfolio |
|
$ |
0.1197 |
|
$ |
2,360,371 |
|
71.3% |
|
$ |
0.0683 |
|
$ |
80,614 |
|
38.6% |
|
|
Net gain on TRS loan sales |
|
|
0.0306 |
|
|
603,108 |
|
18.2% |
|
|
0.1047 |
|
|
123,575 |
|
59.2% |
|
|
Net realized gain on investments |
|
|
0.0087 |
|
|
173,714 |
|
5.2% |
|
|
0.0039 |
|
|
4,577 |
|
2.2% |
|
|
From other sources(1) |
|
|
0.0089 |
|
|
177,251 |
|
5.3% |
|
|
- |
|
|
- |
|
- |
|
|
Total distributions |
|
$ |
0.1679 |
|
$ |
3,314,444 |
|
100.0% |
|
$ |
0.1769 |
|
$ |
208,766 |
|
100.0% |
|
|
|
|
|
|
|
|
|
|
|
|
|
|
|
|
|
|
|
|
|
(1) Includes adjustments made to net investment income to arrive at taxable income available for distributions. |
It is the Company's policy to comply with all requirements of the Code applicable to regulated investment companies and to distribute substantially all of its taxable income to its shareholders. In addition, by distributing during each calendar year substantially all of its net investment income, net realized capital gains and certain other amounts, if any, the Company intends not to be subject to a federal excise tax. Accordingly, no federal income tax provision was required.
Income and capital gain distributions are determined in accordance with the Code and federal tax regulations, which may differ from amounts determined in accordance with GAAP. These book/tax differences, which could be material, are primarily due to differing treatments of income and gains on various investments held by the Company. Permanent book/tax differences result in reclassifications to capital in excess of par value, accumulated undistributed net investment income, accumulated undistributed realized gain on investments, and accumulated undistributed realized gain on total return swap. During 2013, the Company did not have any reclassifications as a result of permanent book/tax differences.
The determination of the tax attributes of the Company’s distributions is made annually as of the end of the Company’s fiscal year based upon the Company’s taxable income for the full year and distributions paid for the full year. The tax characteristics of distributions to shareholders are reported to shareholders annually on Form 1099-DIV. All distributions for 2013 are characterized as ordinary income distributions for federal income tax purposes.
The tax components of accumulated earnings for the current year will be determined at year end. As of December 31, 2013, the components of accumulated earnings on a tax basis were as follows:
|
|
|
December 31, 2013 |
|
||
|
|
Undistributed net investment income |
$ |
80,044 |
|
|
|
|
Performance-based incentive fee on unrealized gains |
|
(530,569) |
|
|
|
|
Net unrealized appreciation on investments and total return swap |
|
2,603,245 |
|
|
|
|
|
$ |
2,152,720 |
|
|
|
|
|
|
|
|
|
19
CĪON Investment Corporation
Notes to Consolidated Financial Statements
March 31, 2014
(unaudited)
As of March 31, 2014, the aggregate gross unrealized appreciation for all securities in which there was an excess of value over tax cost was $4,528,973; the aggregate gross unrealized depreciation for all securities in which there was an excess of tax cost over value was $62,844; the net unrealized appreciation was $4,466,129; the aggregate cost of securities for Federal income tax purposes was $151,802,060.
As of December 31, 2013, the aggregate gross unrealized appreciation for all securities in which there was an excess of value over tax cost was $2,726,569; the aggregate gross unrealized depreciation for all securities in which there was an excess of tax cost over value was $123,324; the net unrealized appreciation was $2,603,245; the aggregate cost of securities for Federal income tax purposes was $103,464,285.
Note 6. Investments
The composition of the Company’s investment portfolio as of March 31, 2014 and December 31, 2013 at amortized cost and fair value was as follows:
|
|
|
March 31, 2014 |
|
December 31, 2013 |
||||||||||||
|
|
|
Amortized |
|
Fair |
|
Percentage of |
|
Amortized |
|
Fair |
|
Percentage of |
||||
|
Senior secured term loans - first lien |
|
$ |
83,294,303 |
|
$ |
84,299,368 |
|
54.9% |
|
$ |
61,095,685 |
|
$ |
61,787,430 |
|
59.1% |
|
Senior secured term loans - second lien |
|
|
46,459,068 |
|
|
47,163,590 |
|
30.7% |
|
|
22,189,331 |
|
|
22,552,214 |
|
21.6% |
|
Collateralized securities |
|
|
11,039,438 |
|
|
11,044,972 |
|
7.2% |
|
|
8,746,000 |
|
|
8,795,600 |
|
8.4% |
|
Short term investments(2) |
|
|
11,003,717 |
|
|
11,003,717 |
|
7.2% |
|
|
11,383,669 |
|
|
11,383,669 |
|
10.9% |
|
Total investments |
|
$ |
151,796,526 |
|
$ |
153,511,647 |
|
100.0% |
|
$ |
103,414,685 |
|
$ |
104,518,913 |
|
100.0% |
|
|
|
|
|
|
|
|
|
|
|
|
|
|
|
|
|
|
|
(1) Amortized cost represents the original cost adjusted for the amortization of premiums and/or accretion of discounts, as applicable, on the Company’s investments. |
|
(2) Short term investments represent an investment in a fund that invests in highly liquid investments with original maturity dates of three months or less. |
20
CĪON Investment Corporation
Notes to Consolidated Financial Statements
March 31, 2014
(unaudited)
The following tables show the composition of the Company’s investment portfolio by industry classification and geographic dispersion, and the percentage, by fair value, of the total investment portfolio assets in such industries and geographies as of March 31, 2014 and December 31, 2013:
|
|
|
March 31, 2014 |
|
December 31, 2013 |
||||||
|
Industry Classification |
|
Investments at |
|
Percentage of |
|
Investments at |
|
Percentage of |
||
|
Services: Business |
|
$ |
15,839,696 |
|
10.3% |
|
$ |
15,754,714 |
|
15.1% |
|
High Tech Industries |
|
|
15,594,028 |
|
10.2% |
|
|
2,876,400 |
|
2.8% |
|
Automotive |
|
|
15,470,635 |
|
10.1% |
|
|
7,473,560 |
|
7.2% |
|
Healthcare & Pharmaceuticals |
|
|
13,973,688 |
|
9.1% |
|
|
8,968,804 |
|
8.6% |
|
Diversified Financials |
|
|
11,044,972 |
|
7.2% |
|
|
8,795,600 |
|
8.4% |
|
Beverage, Food & Tobacco |
|
|
10,068,750 |
|
6.6% |
|
|
- |
|
- |
|
Media: Diversified & Production |
|
|
9,513,441 |
|
6.2% |
|
|
1,920,350 |
|
1.8% |
|
Consumer Goods: Non-Durable |
|
|
8,908,925 |
|
5.9% |
|
|
9,527,245 |
|
9.1% |
|
Chemicals, Plastics & Rubber |
|
|
6,821,100 |
|
4.4% |
|
|
6,797,514 |
|
6.5% |
|
Hotel, Gaming & Leisure |
|
|
6,359,950 |
|
4.1% |
|
|
515,000 |
|
0.5% |
|
Retail |
|
|
5,667,188 |
|
3.7% |
|
|
- |
|
- |
|
Services: Consumer |
|
|
5,592,766 |
|
3.6% |
|
|
5,628,126 |
|
5.3% |
|
Media: Broadcasting & Subscription |
|
|
3,666,384 |
|
2.4% |
|
|
3,544,422 |
|
3.4% |
|
Telecommunications |
|
|
3,500,000 |
|
2.3% |
|
|
3,973,040 |
|
3.8% |
|
Construction & Building |
|
|
2,487,453 |
|
1.6% |
|
|
3,415,256 |
|
3.3% |
|
Environmental Industries |
|
|
1,902,784 |
|
1.2% |
|
|
1,909,952 |
|
1.8% |
|
Energy: Oil & Gas |
|
|
1,704,933 |
|
1.1% |
|
|
3,629,300 |
|
3.5% |
|
Containers, Packaging & Glass |
|
|
1,492,500 |
|
1.0% |
|
|
1,500,000 |
|
1.4% |
|
Aerospace & Defense |
|
|
1,458,319 |
|
0.9% |
|
|
1,463,701 |
|
1.4% |
|
Banking, Finance, Insurance & Real Estate |
|
|
1,440,418 |
|
0.9% |
|
|
2,427,410 |
|
2.3% |
|
Capital Equipment |
|
|
- |
|
- |
|
|
3,014,850 |
|
2.9% |
|
U.S. Treasury Securities |
|
|
11,003,717 |
|
7.2% |
|
|
11,383,669 |
|
10.9% |
|
Total |
|
$ |
153,511,647 |
|
100.0% |
|
$ |
104,518,913 |
|
100.0% |
|
|
|
March 31, 2014 |
|
December 31, 2013 |
||||||
|
Geographic Dispersion(1) |
|
Investments at |
|
Percentage of |
|
Investments at |
|
Percentage of |
||
|
United States |
|
$ |
135,686,830 |
|
88.4% |
|
$ |
86,337,730 |
|
82.6% |
|
Netherlands |
|
|
5,050,000 |
|
3.3% |
|
|
5,037,500 |
|
4.8% |
|
Switzerland |
|
|
1,771,100 |
|
1.1% |
|
|
1,760,014 |
|
1.7% |
|
U.S. Treasury Securities |
|
|
11,003,717 |
|
7.2% |
|
|
11,383,669 |
|
10.9% |
|
Total |
|
$ |
153,511,647 |
|
100.0% |
|
$ |
104,518,913 |
|
100.0% |
|
|
|
|
|
|
|
|
|
|
|
|
|
(1) The geographic dispersion is determined by the portfolio company's country of domicile. |
As of March 31, 2014 and December 31, 2013, there were no delinquent or non-accrual debt investments.
The Company does not “control” and is not an “affiliate” of any of the Company’s portfolio companies, each as defined in the 1940 Act. In general, under the 1940 Act, the Company would be presumed to “control” a portfolio company or issuer if the Company owned 25% or more of its voting securities and would be an “affiliate” of a portfolio company or issuer if the Company owned 5% or more of its voting securities.
The Company’s investment portfolio may contain senior secured investments that are in the form of lines of credit, unfunded delayed drawdown loan commitments, or revolving credit facilities, which require the Company to provide funding when requested by portfolio companies in accordance with the terms of the underlying loan agreements. As of March 31, 2014 and December 31, 2013, the Company’s unfunded loan commitments amounted to $3,054,668 and $2,450,758, respectively. For the specific portfolio companies which the Company is committed to fund additional amounts as of March 31, 2014 and December 31, 2013, refer to the consolidated schedule of investments.
21
CĪON Investment Corporation
Notes to Consolidated Financial Statements
March 31, 2014
(unaudited)
Note 7. Total Return Swap
On December 17, 2012, the Company, through its wholly-owned subsidiary, Flatiron, entered into a TRS with Citibank. Effective December 9, 2013, Flatiron and Citibank amended the TRS to, among other things, extend the termination or call date from December 17, 2013 to December 17, 2014, increase the maximum aggregate market value of the portfolio of loans subject to the TRS (determined at the time each such loan becomes subject to the TRS) from $150 million to $225 million, and increase the interest rate payable by Flatiron to Citibank with respect to each loan included in the TRS by increasing the spread over the floating rate index specified for each such loan from 1.25% to 1.35% per year. Flatiron and Citibank further amended the TRS to increase the maximum aggregate market value of the portfolio of loans subject to the TRS to $275 million effective February 18, 2014 and to $325 million effective April 30, 2014.
A TRS is a contract in which one party agrees to make periodic payments to another party based on the change in the market value of the assets underlying the TRS and interest payments in return for periodic payments based on a fixed or variable interest rate. A TRS effectively adds leverage to a portfolio by providing investment exposure to a security or market without owning or taking physical custody of such security or investing directly in such market. Because of the unique structure of a TRS, a TRS typically offers lower financing costs than are offered through more traditional borrowing arrangements.
The TRS with Citibank enables the Company, through its ownership of Flatiron, to obtain the economic benefit of owning the loans subject to the TRS, without actually owning them, in return for an interest-type payment to Citibank. As such, the TRS is analogous to Flatiron borrowing funds to acquire loans and incurring interest expense to a lender.
The obligations of Flatiron under the TRS are non-recourse to the Company and the Company’s exposure under the TRS is limited to the value of the Company’s investment in Flatiron, which generally will equal the value of cash collateral provided by Flatiron under the TRS. Pursuant to the terms of the TRS, Flatiron may select loans with a maximum aggregate market value (determined at the time each such loan becomes subject to the TRS) of $325,000,000. Flatiron is required to initially cash collateralize a specified percentage of each loan (generally 25% of the market value of such loan) included under the TRS in accordance with margin requirements described in the TRS Agreement. Under the terms of the TRS, Flatiron agreed not to draw upon, or post as collateral, such cash collateral in respect of other financings or operating requirements prior to the termination of the TRS. Neither the cash collateral required to be posted with Citibank nor any other assets of Flatiron are available to pay the debts of the Company.
Each individual loan must meet criteria described in the TRS Agreement, including a requirement that substantially all of the loans be rated by Moody’s and S&P, be part of a loan facility of at least $125 million and have at least two bid quotations from a nationally-recognized pricing service. Under the terms of the TRS, Citibank, as calculation agent, determines whether there has been a failure to satisfy the portfolio criteria in the TRS. If such failure continues for 30 days following the delivery of notice thereof, then Citibank has the right, but not the obligation, to terminate the TRS. Flatiron receives from Citibank all interest and fees payable in respect of the loans included in the TRS. Flatiron pays to Citibank interest at a rate equal to, in respect of each loan included in the TRS, the floating rate index specified for such loan plus 1.35% per year. In addition, upon the termination or repayment of any loan subject to the TRS, Flatiron will either receive from Citibank the appreciation in the value of such loan or pay to Citibank any depreciation in the value of such loan.
Under the terms of the TRS, Flatiron may be required to post additional cash collateral, on a dollar-for-dollar basis, in the event of depreciation in the value of the underlying loans after such value decreases below a specified amount. The limit on the additional collateral that Flatiron may be required to post pursuant to the TRS is equal to the difference between the full notional amount of the loans underlying the TRS and the amount of cash collateral already posted by Flatiron. The amount of collateral required to be posted by Flatiron is determined primarily on the basis of the aggregate value of the underlying loans.
The Company has no contractual obligation to post any such additional collateral or to make any interest payments to Citibank on behalf of Flatiron. The Company may, but is not obligated to, increase its investment in Flatiron for the purpose of funding any additional collateral or payment obligations for which Flatiron may become obligated during the term of the TRS. If the Company does not make any such additional investment in Flatiron and Flatiron fails to meet its obligations under the TRS, then Citibank will have the right to terminate the TRS and seize the cash collateral posted by Flatiron under the TRS. In the event of an early termination of the TRS, Flatiron would be required to pay an early termination fee.
22
CĪON Investment Corporation
Notes to Consolidated Financial Statements
March 31, 2014
(unaudited)
Citibank may terminate the TRS on or after December 17, 2014, or the call date. Flatiron may terminate the TRS at any time upon providing no more than 30 days prior notice to Citibank. Any termination prior to the call date will result in payment of an early termination fee to Citibank based on the maximum portfolio amount of the TRS. Under the terms of the TRS, the early termination fee will equal the present value of a stream of monthly payments that would be owed by Flatiron to Citibank for the period from the termination date through and including the call date. Such monthly payments will equal the product of 80% of the maximum portfolio amount, multiplied by 1.35% per year. The Company estimates the early termination fee would have been approximately $2,111,285 at March 31, 2014. Other than during the first nine months and last 180 days of the term of the TRS, Flatiron may be required to pay a minimum usage fee in connection with the TRS. At March 31, 2014, Flatiron was not subject to a minimum usage fee.
The value of the TRS is based on the valuation of the underlying portfolio of loans subject to the TRS. Pursuant to the terms of the TRS, on each business day, Citibank values each underlying loan in good faith on a mark-to-market basis by determining how much Citibank would receive on such date if it sold such loan in the open market. As of March 31, 2014 and December 31, 2013, the fair value of the TRS was $2,756,542 and $1,548,617, respectively. The fair value of the TRS is reflected as unrealized appreciation on total return swap on the Company’s consolidated balance sheets. The change in value of the TRS is reflected in the Company’s consolidated statements of operations as net change in unrealized appreciation on total return swap. As of March 31, 2014 and December 31, 2013, Flatiron had selected 76 and 63 underlying loans with a total notional amount of $230,257,406 and $148,199,937, respectively. For the same periods, Flatiron posted $68,368,923 and $40,703,777 in cash collateral held by Citibank (of which only $66,536,931 and $39,285,408 was required to be posted), which is reflected in due from counterparty on the Company’s consolidated balance sheets.
Realized gains and losses on the TRS are composed of any gains or losses on loans underlying the TRS as well as net interest earned during the period. Receivable due on the TRS is composed of any amounts due from Citibank that consist of earned but not yet collected net interest and net gains on sales and principal repayments of underlying loans of the TRS. As of and for the three months ended March 31, 2014, the net receivable and net realized gain on the TRS consisted of the following:
|
|
|
|
|
March 31, 2014 |
|
||||
|
|
|
|
|
Net Receivable(1) |
|
Net Realized Gain(2) |
|
||
|
|
Interest and other income from TRS portfolio |
|
$ |
2,947,336 |
|
$ |
3,073,966 |
|
|
|
|
Interest and other expense from TRS portfolio |
|
|
(693,294) |
|
|
(713,595) |
|
|
|
|
Net gain on TRS loan sales |
|
|
555,533 |
|
|
603,108 |
|
|
|
|
Total |
|
$ |
2,809,575 |
|
$ |
2,963,479 |
|
|
|
|
|
|
|
|
|
|
|
|
|
|
|
(1) |
Net receivable is reflected in receivable due on total return swap on the Company's consolidated balance sheets. |
|
|
|
(2) |
Net realized gain is reflected in net realized gain on total return swap on the Company's consolidated statements of operations. |
|
23
CĪON Investment Corporation
Notes to Consolidated Financial Statements
March 31, 2014
(unaudited)
In connection with the TRS, Flatiron is required to comply with various covenants and reporting requirements as defined in the TRS Agreement. As of March 31, 2014, Flatiron was in compliance with all covenants and reporting requirements.
CIM has not taken any incentive fees with respect to the Company’s TRS to date. For purposes of computing the capital gains incentive fee, CIM will become entitled to a capital gains incentive fee only upon the termination or disposition of the TRS, at which point all net gains and losses of the underlying loans constituting the reference assets of the TRS will be realized. For purposes of computing the subordinated incentive fee on income, CIM is not entitled to a subordinated incentive fee on income with respect to the TRS. Any unrealized gains on the TRS is reflected in total assets on the Company’s consolidated balance sheets and included in the computation of the base management fee.
While the investment advisory agreement with CIM neither includes nor contemplates the inclusion of unrealized gains in the calculation of the capital gains incentive fee, pursuant to an interpretation of the AICPA Technical Practice Aid for investment companies, the Company accrues capital gains incentive fees on unrealized gains. This accrual reflects the incentive fees that would be payable to CIM if the Company’s entire investment portfolio was liquidated at its fair value as of the balance sheet date even though CIM is not entitled to an incentive fee with respect to unrealized gains unless and until such gains are actually realized.
For purposes of the asset coverage ratio test applicable to the Company as a BDC, the Company treats the outstanding notional amount of the TRS, less the total amount of cash collateral posted by Flatiron under the TRS, as a senior security for the life of that instrument. The Company may, however, accord different treatment to the TRS in the future in accordance with any applicable new rules or interpretations adopted by the staff of the Securities and Exchange Commission, or SEC.
Further, for purposes of Section 55(a) under the 1940 Act, the Company treats each loan underlying the TRS as a qualifying asset if the obligor on such loan is an eligible portfolio company and as a non-qualifying asset if the obligor is not an eligible portfolio company. The Company may, however, accord different treatment to the TRS in the future in accordance with any applicable new rules or interpretations adopted by the staff of the SEC.
24
CĪON Investment Corporation
Notes to Consolidated Financial Statements
March 31, 2014
(unaudited)
The following is a summary of the underlying loans subject to the TRS as of March 31, 2014:
|
Underlying Loans(a) |
|
Index Rate(b) |
|
Industry |
|
Notional |
|
Fair |
|
Unrealized |
|||
|
Senior Secured First Lien Term Loans |
|
|
|
|
|
|
|
|
|
|
|
|
|
|
The Active Network, Inc., L+450, 1.00% LIBOR Floor, 11/13/2020 |
|
3 Month LIBOR |
|
High Tech Industries |
|
$ |
1,942,347 |
|
$ |
1,967,978 |
|
$ |
25,631 |
|
American Tire Distributors, Inc., L+475, 1.00% LIBOR Floor, 6/1/2018(d) |
|
1 Month LIBOR |
|
Automotive |
|
|
3,160,875 |
|
|
3,161,813 |
|
|
938 |
|
Amneal Pharmaceuticals, LLC, L+475, 1.00% LIBOR Floor, 11/1/2019 |
|
1 Month LIBOR |
|
Healthcare & Pharmaceuticals |
|
|
3,339,315 |
|
|
3,385,695 |
|
|
46,380 |
|
Aptean, Inc., L+425, 1.00% LIBOR Floor, 2/26/2020(e) |
|
3 Month LIBOR |
|
High Tech Industries |
|
|
3,767,100 |
|
|
3,787,650 |
|
|
20,550 |
|
Aquilex, LLC, L+400, 1.00% LIBOR Floor, 12/31/2020 |
|
1 Month LIBOR |
|
Chemicals, Plastics & Rubber |
|
|
4,987,500 |
|
|
5,014,600 |
|
|
27,100 |
|
Arc Document Solutions, Inc., L+525, 1.00% LIBOR Floor, 12/20/2018(e) |
|
3 Month LIBOR |
|
Services: Business |
|
|
4,748,835 |
|
|
4,894,208 |
|
|
145,373 |
|
ARG IH Corporation, L+400, 1.00% LIBOR Floor, 11/15/2020 |
|
3 Month LIBOR |
|
Beverage, Food & Tobacco |
|
|
2,388,015 |
|
|
2,406,712 |
|
|
18,697 |
|
Ascensus, Inc., L+400, 1.00% LIBOR Floor, 12/2/2019 |
|
1 Month LIBOR |
|
Banking, Finance, Insurance & Real Estate |
|
|
4,962,563 |
|
|
5,031,141 |
|
|
68,578 |
|
ATI Holdings, Inc., L+400, 1.00% LIBOR Floor, 12/21/2019 |
|
3 Month LIBOR |
|
Healthcare & Pharmaceuticals |
|
|
488,813 |
|
|
499,097 |
|
|
10,284 |
|
Azure Midstream Energy, LLC, L+550, 1.00% LIBOR Floor, 11/15/2018 |
|
1 Month LIBOR |
|
Energy: Oil & Gas |
|
|
4,325,457 |
|
|
4,363,659 |
|
|
38,202 |
|
BBTS Borrower, LP, L+650, 1.25% LIBOR Floor, 6/4/2019 |
|
3 Month LIBOR |
|
Energy: Oil & Gas |
|
|
1,849,498 |
|
|
1,880,156 |
|
|
30,658 |
|
Bluestem Brands, Inc., L+650, 1.00% LIBOR Floor, 12/6/2018 |
|
3 Month LIBOR |
|
Retail |
|
|
4,322,311 |
|
|
4,366,680 |
|
|
44,369 |
|
Camp International Holding Company, L+375, 1.00% LIBOR Floor, 5/31/2019 |
|
3 Month LIBOR |
|
Services: Business |
|
|
1,216,926 |
|
|
1,229,096 |
|
|
12,170 |
|
Caraustar Industries, Inc., L+625, 1.25% LIBOR Floor, 5/1/2019 |
|
3 Month LIBOR |
|
Forest Products & Paper |
|
|
924,028 |
|
|
946,111 |
|
|
22,083 |
|
Charming Charlie, LLC, L+800, 1.00% LIBOR Floor, 12/18/2019 |
|
3 Month LIBOR |
|
Retail |
|
|
7,796,565 |
|
|
7,845,181 |
|
|
48,616 |
|
CHI Overhead Doors, Inc., L+425, 1.25% LIBOR Floor, 3/18/2019 |
|
1 Month LIBOR |
|
Construction & Building |
|
|
5,983,701 |
|
|
5,993,693 |
|
|
9,992 |
|
Consolidated Aerospace Manufacturing, LLC, P+300, 1.00% Base Rate Floor, 2/28/2020(d) |
|
Prime |
|
Aerospace & Defense |
|
|
7,236,635 |
|
|
7,291,183 |
|
|
54,548 |
|
Cyanco Intermediate Corp., L+450, 1.00% LIBOR Floor, 5/1/2020 |
|
1 Month LIBOR |
|
Chemicals, Plastics & Rubber |
|
|
1,251,232 |
|
|
1,268,931 |
|
|
17,699 |
|
Deluxe Entertainment Services Group, Inc., L+550, 1.00% LIBOR Floor, 2/28/2020(e) |
|
6 Month LIBOR |
|
Media: Diversified & Production |
|
|
1,160,170 |
|
|
1,167,947 |
|
|
7,777 |
|
Flexera Software, LLC, L+350, 1.00% LIBOR Floor, 4/2/2020(d) |
|
3 Month LIBOR |
|
High Tech Industries |
|
|
1,731,300 |
|
|
1,740,000 |
|
|
8,700 |
|
Hemisphere Media Holdings, LLC, L+500, 1.25% LIBOR Floor, 7/30/2020(e) |
|
1 Month LIBOR |
|
Media: Broadcasting & Subscription |
|
|
6,321,394 |
|
|
6,333,118 |
|
|
11,724 |
|
Herff Jones, Inc., L+450, 1.00% LIBOR Floor, 6/25/2019 |
|
1 Month LIBOR |
|
Consumer Goods: Non-Durable |
|
|
1,910,355 |
|
|
1,982,574 |
|
|
72,219 |
|
Hyperion Finance S.à r.l., L+475, 1.00% LIBOR Floor, 10/17/2019(e) |
|
3 Month LIBOR |
|
Banking, Finance, Insurance & Real Estate |
|
|
4,421,419 |
|
|
4,503,698 |
|
|
82,279 |
|
Insight Pharmaceuticals, LLC, L+500, 1.25% LIBOR Floor, 8/25/2016 |
|
2 Month LIBOR |
|
Healthcare & Pharmaceuticals |
|
|
5,979,893 |
|
|
5,974,924 |
|
|
(4,969) |
|
inVentiv Health, Inc., L+600, 1.50% LIBOR Floor, 8/4/2016 |
|
3 Month LIBOR |
|
Healthcare & Pharmaceuticals |
|
|
6,258,942 |
|
|
6,288,609 |
|
|
29,667 |
|
Kronos Worldwide, Inc., L+350, 1.00% LIBOR Floor, 10/30/2019(d) |
|
3 Month LIBOR |
|
Services: Business |
|
|
4,646,650 |
|
|
4,701,523 |
|
|
54,873 |
|
Landslide Holdings, Inc., L+400, 1.00% LIBOR Floor, 2/25/2020 |
|
3 Month LIBOR |
|
Services: Business |
|
|
2,882,874 |
|
|
2,885,946 |
|
|
3,072 |
|
Learfield Communications, Inc., L+400, 1.00% LIBOR Floor, 10/9/2020 |
|
3 Month LIBOR |
|
Media: Broadcasting & Subscription |
|
|
744,384 |
|
|
749,995 |
|
|
5,611 |
|
Lineage Logistics, LLC, L+350, 1.00% LIBOR Floor, 4/26/2019 |
|
1 Month LIBOR |
|
Services: Business |
|
|
2,495,304 |
|
|
2,501,602 |
|
|
6,298 |
|
Marine Acquisition Corp., L+425, 1.00% LIBOR Floor, 1/30/2021 |
|
3 Month LIBOR |
|
Capital Equipment |
|
|
7,960,000 |
|
|
8,030,000 |
|
|
70,000 |
|
Merrill Corp., L+475, 1.00% LIBOR Floor, 3/8/2018 |
|
1 Month LIBOR |
|
Services: Business |
|
|
618,624 |
|
|
618,882 |
|
|
258 |
|
Mohegan Tribal Gaming Authority, L+450, 1.00% LIBOR Floor, 11/19/2019 |
|
3 Month LIBOR |
|
Hotel, Gaming & Leisure |
|
|
1,639,292 |
|
|
1,687,940 |
|
|
48,648 |
|
National Financial Partners Corp., L+425, 1.00% LIBOR Floor, 7/1/2020 |
|
3 Month LIBOR |
|
Banking, Finance, Insurance & Real Estate |
|
|
4,219,425 |
|
|
4,239,214 |
|
|
19,789 |
|
Nord Anglia Education Finance, LLC, L+350, 1.00% LIBOR Floor, 3/31/2021(d)(e) |
|
2 Month LIBOR |
|
Services: Business |
|
|
2,139,250 |
|
|
2,147,313 |
|
|
8,063 |
|
OCI Beaumont, LLC, L+500, 1.25% LIBOR Floor, 8/20/2019(e) |
|
3 Month LIBOR |
|
Chemicals, Plastics & Rubber |
|
|
2,280,075 |
|
|
2,327,436 |
|
|
47,361 |
|
Opal Acquisition, Inc., L+400, 1.00% LIBOR Floor, 11/27/2020 |
|
3 Month LIBOR |
|
Healthcare & Pharmaceuticals |
|
|
4,569,426 |
|
|
4,619,971 |
|
|
50,545 |
|
Packaging Coordinators, Inc., L+425, 1.25% LIBOR Floor, 5/10/2020 |
|
3 Month LIBOR |
|
Containers, Packaging & Glass |
|
|
1,980,050 |
|
|
1,980,050 |
|
|
- |
|
Peppermill Casinos, Inc., L+600, 1.25% LIBOR Floor, 11/9/2018 |
|
1 Month LIBOR |
|
Hotel, Gaming & Leisure |
|
|
975,175 |
|
|
1,012,188 |
|
|
37,013 |
|
Photonis Technologies SAS, L+750, 1.00% LIBOR Floor, 9/18/2019(e) |
|
3 Month LIBOR |
|
Aerospace & Defense |
|
|
5,749,949 |
|
|
5,927,709 |
|
|
177,760 |
|
Planet Fitness Holdings, LLC, L+375, 1.00% LIBOR Floor, 3/31/2021(d) |
|
3 Month LIBOR |
|
Hotel, Gaming & Leisure |
|
|
2,208,900 |
|
|
2,220,000 |
|
|
11,100 |
|
Polyconcept Finance B.V., L+475, 1.25% LIBOR Floor, 6/28/2019(e) |
|
1 Month LIBOR |
|
Consumer Goods: Non-Durable |
|
|
2,464,643 |
|
|
2,502,367 |
|
|
37,724 |
|
Safe-Guard Products International, LLC, L+600, 1.25% LIBOR Floor, 12/21/2018 |
|
3 Month LIBOR |
|
Banking, Finance, Insurance & Real Estate |
|
|
2,216,396 |
|
|
2,259,953 |
|
|
43,557 |
|
SESAC Holdco II, LLC, L+400, 1.00% LIBOR Floor, 2/8/2019 |
|
1 Month LIBOR |
|
Media: Broadcasting & Subscription |
|
|
488,813 |
|
|
497,453 |
|
|
8,640 |
|
SK Spice S.Á.R.L, L+825, 1.25% LIBOR Floor, 9/30/2018(e) |
|
3 Month LIBOR |
|
Chemicals, Plastics & Rubber |
|
|
2,965,100 |
|
|
2,985,000 |
|
|
19,900 |
|
SRA International, L+525, 1.25% LIBOR Floor, 7/20/2018 |
|
3 Month LIBOR |
|
High Tech Industries |
|
|
2,351,305 |
|
|
2,399,444 |
|
|
48,139 |
|
Steward Health Care System, LLC, L+550, 1.25% LIBOR Floor, 4/10/2020 |
|
12 Month LIBOR |
|
Healthcare & Pharmaceuticals |
|
|
3,427,866 |
|
|
3,482,434 |
|
|
54,568 |
|
STS Operating, Inc., L+375, 1.00% LIBOR Floor, 2/12/2021 |
|
3 Month LIBOR |
|
Consumer Goods: Durable |
|
|
2,985,000 |
|
|
3,022,500 |
|
|
37,500 |
|
Sutherland Global Services, L+600, 1.25% LIBOR Floor, 3/6/2019(e) |
|
6 Month LIBOR |
|
Services: Business |
|
|
1,889,088 |
|
|
1,906,636 |
|
|
17,548 |
|
Tech Finance & Co. S.C.A., L+600, 1.25% LIBOR Floor, 7/11/2020(e) |
|
6 Month LIBOR |
|
Media: Broadcasting & Subscription |
|
|
1,918,313 |
|
|
1,979,250 |
|
|
60,937 |
|
Tervita, L+500, 1.25% LIBOR Floor, 5/15/2018(e) |
|
3 Month LIBOR |
|
Environmental Industries |
|
|
1,751,978 |
|
|
1,740,483 |
|
|
(11,495) |
|
The TOPPS Company, Inc., L+600, 1.25% LIBOR Floor, 10/2/2018 |
|
3 Month LIBOR |
|
Consumer Goods: Non-Durable |
|
|
2,002,481 |
|
|
1,995,000 |
|
|
(7,481) |
|
Travel Leaders Group, LLC, L+600, 1.00% LIBOR Floor, 12/5/2018 |
|
3 Month LIBOR |
|
Services: Consumer |
|
|
1,950,313 |
|
|
1,950,313 |
|
|
- |
|
Travelport, LLC, L+500, 1.25% LIBOR Floor, 6/26/2019(e) |
|
3 Month LIBOR |
|
Hotel, Gaming & Leisure |
|
|
1,581,400 |
|
|
1,629,884 |
|
|
48,484 |
|
TriNet HR Corp., L+400, 1.00% LIBOR Floor, 8/20/2020 |
|
3 Month LIBOR |
|
Services: Business |
|
|
1,645,034 |
|
|
1,680,344 |
|
|
35,310 |
|
Vince, LLC, L+500, 1.00% LIBOR Floor, 11/27/2019(e) |
|
6 Month LIBOR |
|
Consumer Goods: Non-Durable |
|
|
1,652,169 |
|
|
1,685,546 |
|
|
33,377 |
|
VFH Parent, LLC, L+450, 1.25% LIBOR Floor, 11/8/2016 |
|
3 Month LIBOR |
|
Banking, Finance, Insurance & Real Estate |
|
|
2,591,067 |
|
|
2,628,914 |
|
|
37,847 |
|
W/S Packaging Group, Inc., L+400, 1.00% LIBOR Floor, 8/9/2019 |
|
3 Month LIBOR |
|
Containers, Packaging & Glass |
|
|
2,475,063 |
|
|
2,481,281 |
|
|
6,218 |
|
Washington Inventory Services, L+450, 1.25% LIBOR Floor, 12/20/2018 |
|
3 Month LIBOR |
|
Retail |
|
|
264,702 |
|
|
264,037 |
|
|
(665) |
|
Western Dental Services, Inc., L+500, 1.00% LIBOR Floor, 11/1/2018 |
|
3 Month LIBOR |
|
Healthcare & Pharmaceuticals |
|
|
2,942,823 |
|
|
2,976,265 |
|
|
33,442 |
|
William Morris Endeavor Entertainment, LLC, L+425, 1.00% LIBOR Floor, 5/1/2021(d) |
|
N/A(f) |
|
Hotel, Gaming & Leisure |
|
|
8,325,900 |
|
|
8,352,223 |
|
|
26,323 |
|
Total Senior Secured First Lien Term Loans |
|
|
|
|
|
|
185,474,021 |
|
|
187,393,550 |
|
|
1,919,529 |
25
CĪON Investment Corporation
Notes to Consolidated Financial Statements
March 31, 2014
(unaudited)
|
Underlying Loans(a) |
|
Index Rate(b) |
|
Industry |
|
Notional |
|
Fair |
|
Unrealized |
|||
|
Senior Secured Second Lien Term Loans |
|
|
|
|
|
|
|
|
|
|
|
|
|
|
Acquisition Glacier, Inc., L+675, 1.00% LIBOR Floor, 8/13/2021(e) |
|
1 Month LIBOR |
|
Healthcare & Pharmaceuticals |
|
|
3,316,335 |
|
|
3,378,829 |
|
|
62,494 |
|
Applied Systems, Inc., L+650, 1.00% LIBOR Floor, 1/24/2022 |
|
3 Month LIBOR |
|
Services: Business |
|
|
3,622,625 |
|
|
3,704,750 |
|
|
82,125 |
|
Aptean, Inc., L+750, 1.00% LIBOR Floor, 2/26/2021(e) |
|
3 Month LIBOR |
|
High Tech Industries |
|
|
2,235,950 |
|
|
2,298,375 |
|
|
62,425 |
|
Arysta LifeScience SPC, LLC, L+700, 1.25% LIBOR Floor, 11/30/2020(e) |
|
3 Month LIBOR |
|
Chemicals, Plastics & Rubber |
|
|
1,160,540 |
|
|
1,187,101 |
|
|
26,561 |
|
Asurion, LLC, L+750, 1.00% LIBOR Floor, 3/3/2021 |
|
3 Month LIBOR |
|
Banking, Finance, Insurance & Real Estate |
|
|
5,949,400 |
|
|
6,228,750 |
|
|
279,350 |
|
Carestream Health, Inc., L+850, 1.00% LIBOR Floor, 12/7/2019(e) |
|
3 Month LIBOR |
|
Healthcare & Pharmaceuticals |
|
|
953,190 |
|
|
991,288 |
|
|
38,098 |
|
Del Monte Foods, Inc., L+725, 1.00% LIBOR Floor, 7/26/2021 |
|
6 Month LIBOR |
|
Beverage, Food & Tobacco |
|
|
1,811,700 |
|
|
1,818,563 |
|
|
6,863 |
|
Deltek, Inc., L+875, 1.25% LIBOR Floor, 10/10/2019 |
|
3 Month LIBOR |
|
Services: Business |
|
|
1,619,640 |
|
|
1,664,630 |
|
|
44,990 |
|
Ion Trading Technologies S.Á R.L., L+700, 1.25% LIBOR Floor, 5/22/2021(e) |
|
3 Month LIBOR |
|
Banking, Finance, Insurance & Real Estate |
|
|
993,125 |
|
|
1,010,000 |
|
|
16,875 |
|
Mergermarket USA, Inc., L+650, 1.00% LIBOR Floor, 2/4/2022(e) |
|
3 Month LIBOR |
|
Services: Business |
|
|
6,965,000 |
|
|
6,956,250 |
|
|
(8,750) |
|
Performance Food Group, Inc., L+525, 1.00% LIBOR Floor, 11/14/2019 |
|
3 Month LIBOR |
|
Beverage, Food & Tobacco |
|
|
3,839,915 |
|
|
3,911,297 |
|
|
71,382 |
|
PFS Holding Corporation, L+725, 1.00% LIBOR Floor, 1/31/2022 |
|
3 Month LIBOR |
|
Retail |
|
|
7,104,300 |
|
|
7,148,925 |
|
|
44,625 |
|
Securus Technologies Holdings, Inc., L+775, 1.25% LIBOR Floor, 4/30/2021 |
|
3 Month LIBOR |
|
Telecommunications |
|
|
1,001,875 |
|
|
1,000,000 |
|
|
(1,875) |
|
Sheridan Holdings, Inc., L+725, 1.00% LIBOR Floor, 12/20/2021 |
|
3 Month LIBOR |
|
Healthcare & Pharmaceuticals |
|
|
2,736,250 |
|
|
2,811,875 |
|
|
75,625 |
|
U.S. Renal Care, Inc., L+750, 1.00% LIBOR Floor, 1/3/2020(d) |
|
1 Month LIBOR |
|
Healthcare & Pharmaceuticals |
|
|
814,200 |
|
|
838,350 |
|
|
24,150 |
|
William Morris Endeavor Entertainment, LLC, L+725, 1.00% LIBOR Floor, 5/1/2022(d) |
|
N/A(f) |
|
Hotel, Gaming & Leisure |
|
|
659,340 |
|
|
671,415 |
|
|
12,075 |
|
Total Senior Secured Second Lien Term Loans |
|
|
|
|
|
|
44,783,385 |
|
|
45,620,398 |
|
|
837,013 |
|
Total |
|
|
|
|
|
$ |
230,257,406 |
|
$ |
233,013,948 |
|
$ |
2,756,542 |
|
|
|
|
|
|
|
|
|
|
|
|
|
|
|
|
(a) |
All of the Company's debt investments are issued by eligible U.S. portfolio companies, as defined in the 1940 Act, except for investments specifically identified as non-qualifying per note (e) below. The Company does not control and is not an affiliate of any of the companies that are issuers of the underlying loans subject to the TRS. |
|
(b) |
The 1, 2, 3, 6 and 12 month LIBOR rates were 0.15%, 0.19%, 0.23%, 0.33% and 0.56%, respectively, as of March 31, 2014. The prime rate was 3.25% as of March 31, 2014. The applicable LIBOR rate as of March 31, 2014 for the loan listed may not be the applicable LIBOR rate, as the loan may have been priced or repriced based on a LIBOR rate prior to March 31, 2014. |
|
(c) |
Fair value determined by the Company’s board of directors (see Note 8). |
|
(d) |
Position or portion thereof unsettled as of March 31, 2014. |
|
(e) |
The investment is not a qualifying asset under the 1940 Act. A business development company may not acquire any asset other than qualifying assets, unless, at the time the acquisition is made, qualifying assets represent at least 70% of that company’s total assets as defined under Section 55 of the 1940 Act. As of March 31, 2014, 92.1% of the Company’s total assets represented qualifying assets. In addition, as described in this note, the Company calculates its compliance with the qualifying asset test on a “look through” basis by treating each loan underlying the TRS as either a qualifying asset or non-qualifying asset based on whether the obligor is an eligible portfolio company. On this basis, 79.6% of the Company’s total assets represented qualifying assets as of March 31, 2014. |
|
(f) |
No interest rate option has yet to be elected, as the entire position remains unsettled as of May 8, 2014. |
26
CĪON Investment Corporation
Notes to Consolidated Financial Statements
March 31, 2014
(unaudited)
The following is a summary of the underlying loans subject to the TRS as of December 31, 2013:
|
Underlying Loans(a) |
|
Index Rate(b) |
|
Industry |
|
Notional |
|
Fair |
|
Unrealized |
|||
|
Senior Secured First Lien Term Loans |
|
|
|
|
|
|
|
|
|
|
|
|
|
|
The Active Network, Inc., L+450, 1.00% LIBOR Floor, 11/13/2020 |
|
1 Month LIBOR |
|
High Tech Industries |
|
$ |
1,947,215 |
|
$ |
1,964,339 |
|
$ |
17,124 |
|
Amneal Pharmaceuticals, LLC, L+475, 1.00% LIBOR Floor, 11/1/2019 |
|
1 Month LIBOR |
|
Healthcare & Pharmaceuticals |
|
|
3,347,710 |
|
|
3,398,433 |
|
|
50,723 |
|
Aquilex, LLC, L+400, 1.00% LIBOR Floor, 12/31/2020(d) |
|
1 Month LIBOR |
|
Chemicals, Plastics & Rubber |
|
|
4,987,500 |
|
|
5,012,500 |
|
|
25,000 |
|
ARG IH Corporation, L+400, 1.00% LIBOR Floor, 11/15/2020 |
|
1 Month LIBOR |
|
Beverage, Food & Tobacco |
|
|
2,394,000 |
|
|
2,410,512 |
|
|
16,512 |
|
Arc Document Solutions, Inc., L+525, 1.00% LIBOR Floor, 12/20/2018(d)(e) |
|
1 Month LIBOR |
|
Services: Business |
|
|
4,870,600 |
|
|
4,932,725 |
|
|
62,125 |
|
Ascensus, Inc., L+400, 1.00% LIBOR Floor, 12/2/2019 |
|
3 Month LIBOR |
|
Banking, Finance, Insurance & Real Estate |
|
|
4,975,000 |
|
|
5,018,750 |
|
|
43,750 |
|
ATI Holdings, Inc., L+400, 1.25% LIBOR Floor, 12/21/2019 |
|
3 Month LIBOR |
|
Healthcare & Pharmaceuticals |
|
|
490,050 |
|
|
495,931 |
|
|
5,881 |
|
Avaya, Inc., L+675, 1.25% LIBOR Floor, 3/31/2018 |
|
3 Month LIBOR |
|
Telecommunications |
|
|
1,993,401 |
|
|
2,014,431 |
|
|
21,030 |
|
Azure Midstream Energy, LLC, L+550, 1.00% LIBOR Floor, 11/15/2018 |
|
1 Month LIBOR |
|
Energy: Oil & Gas |
|
|
4,380,210 |
|
|
4,407,930 |
|
|
27,720 |
|
BBTS Borrower, LP, L+650, 1.25% LIBOR Floor, 6/4/2019 |
|
3 Month LIBOR |
|
Energy: Oil & Gas |
|
|
1,854,169 |
|
|
1,878,474 |
|
|
24,305 |
|
Bluestem Brands, Inc., L+650, 1.00% LIBOR Floor, 12/6/2018 |
|
1 Month LIBOR |
|
Retail |
|
|
1,832,600 |
|
|
1,832,600 |
|
|
- |
|
Camp International Holding Company, L+375, 1.00% LIBOR Floor, 5/31/2019 |
|
1 Month LIBOR |
|
Services: Business |
|
|
1,220,000 |
|
|
1,230,163 |
|
|
10,163 |
|
Caraustar Industries, Inc., L+625, 1.25% LIBOR Floor, 5/1/2019 |
|
6 Month LIBOR |
|
Forest Products & Paper |
|
|
713,584 |
|
|
738,748 |
|
|
25,164 |
|
Charming Charlie, LLC, L+800, 1.00% LIBOR Floor, 12/18/2019(d) |
|
3 Month LIBOR |
|
Retail |
|
|
4,289,675 |
|
|
4,333,225 |
|
|
43,550 |
|
Cyanco Intermediate Corp., L+450, 1.00% LIBOR Floor, 5/1/2020 |
|
1 Month LIBOR |
|
Chemicals, Plastics & Rubber |
|
|
1,254,383 |
|
|
1,265,813 |
|
|
11,430 |
|
Digital Insight Corporation, L+375, 1.00% LIBOR Floor, 10/16/2019 |
|
3 Month LIBOR |
|
Services: Business |
|
|
775,105 |
|
|
779,000 |
|
|
3,895 |
|
Global Tel*Link Corporation, L+375, 1.25% LIBOR Floor, 5/23/2020 |
|
3 Month LIBOR |
|
Services: Business |
|
|
2,940,113 |
|
|
2,915,814 |
|
|
(24,299) |
|
Grande Communications Networks, LLC, L+350, 1.00% LIBOR Floor, 5/31/2020 |
|
3 Month LIBOR |
|
Telecommunications |
|
|
2,486,435 |
|
|
2,497,471 |
|
|
11,036 |
|
Hemisphere Media Holdings, LLC, L+500, 1.25% LIBOR Floor, 7/30/2020(e) |
|
1 Month LIBOR |
|
Media: Broadcasting & Subscription |
|
|
4,324,817 |
|
|
4,349,487 |
|
|
24,670 |
|
Herff Jones, Inc., L+450, 1.00% LIBOR Floor, 6/25/2019 |
|
1 Month LIBOR |
|
Consumer Goods: Non-Durable |
|
|
1,973,732 |
|
|
2,054,268 |
|
|
80,536 |
|
Hyperion Finance S.à r.l., L+475, 1.00% LIBOR Floor, 10/17/2019(e) |
|
2 Month LIBOR |
|
Banking, Finance, Insurance & Real Estate |
|
|
4,432,500 |
|
|
4,471,875 |
|
|
39,375 |
|
Information Resources, Inc., L+375, 1.00% LIBOR Floor, 9/30/2020 |
|
3 Month LIBOR |
|
Services: Business |
|
|
892,269 |
|
|
900,492 |
|
|
8,223 |
|
Insight Pharmaceuticals, LLC, L+500, 1.25% LIBOR Floor, 8/25/2016 |
|
6 Month LIBOR |
|
Healthcare & Pharmaceuticals |
|
|
4,002,500 |
|
|
3,980,000 |
|
|
(22,500) |
|
inVentiv Health, Inc., L+600, 1.50% LIBOR Floor, 8/4/2016 |
|
6 Month LIBOR |
|
Healthcare & Pharmaceuticals |
|
|
5,260,192 |
|
|
5,228,718 |
|
|
(31,474) |
|
Learfield Communications, Inc., L+400, 1.00% LIBOR Floor, 10/9/2020 |
|
3 Month LIBOR |
|
Media: Broadcasting & Subscription |
|
|
746,250 |
|
|
757,500 |
|
|
11,250 |
|
Lineage Logistics, LLC, L+350, 1.00% LIBOR Floor, 4/26/2019 |
|
1 Month LIBOR |
|
Services: Business |
|
|
2,501,589 |
|
|
2,504,769 |
|
|
3,180 |
|
Merrill Corp., L+625, 1.00% LIBOR Floor, 3/8/2018(d) |
|
1 Month LIBOR |
|
Services: Business |
|
|
671,827 |
|
|
679,040 |
|
|
7,213 |
|
Mohegan Tribal Gaming Authority, L+450, 1.00% LIBOR Floor, 11/19/2019 |
|
2 Month LIBOR |
|
Hotel, Gaming & Leisure |
|
|
1,643,400 |
|
|
1,683,871 |
|
|
40,471 |
|
OCI Beaumont, LLC, L+500, 1.25% LIBOR Floor, 8/20/2019 (B2 Term Loan)(e) |
|
6 Month LIBOR |
|
Chemicals, Plastics & Rubber |
|
|
2,285,804 |
|
|
2,333,284 |
|
|
47,480 |
|
Opal Acquisition, Inc., L+400, 1.00% LIBOR Floor, 11/27/2020(d) |
|
1 Month LIBOR |
|
Healthcare & Pharmaceuticals |
|
|
4,580,879 |
|
|
4,617,136 |
|
|
36,257 |
|
Packaging Coordinators, Inc., L+425, 1.25% LIBOR Floor, 5/10/2020 |
|
3 Month LIBOR |
|
Containers, Packaging & Glass |
|
|
1,985,025 |
|
|
1,995,000 |
|
|
9,975 |
|
Peppermill Casinos, Inc., L+600, 1.25% LIBOR Floor, 11/9/2018 |
|
1 Month LIBOR |
|
Hotel, Gaming & Leisure |
|
|
977,637 |
|
|
1,012,275 |
|
|
34,638 |
|
Photonis Technologies SAS, L+750, 1.00% LIBOR Floor, 9/18/2019(e) |
|
3 Month LIBOR |
|
Aerospace & Defense |
|
|
5,764,360 |
|
|
5,853,870 |
|
|
89,510 |
|
Polyconcept Finance B.V., L+475, 1.25% LIBOR Floor, 6/28/2019(e) |
|
1 Month LIBOR |
|
Consumer Goods: Non-Durable |
|
|
2,470,979 |
|
|
2,521,407 |
|
|
50,428 |
|
Safe-Guard Products International, LLC, L+600, 1.25% LIBOR Floor, 12/21/2018 |
|
3 Month LIBOR |
|
Banking, Finance, Insurance & Real Estate |
|
|
2,222,426 |
|
|
2,266,102 |
|
|
43,676 |
|
Salix Pharmaceuticals, Ltd., L+325, 1.00% LIBOR Floor, 1/2/2020(d)(e) |
|
1 Month LIBOR |
|
Healthcare & Pharmaceuticals |
|
|
2,815,850 |
|
|
2,857,423 |
|
|
41,573 |
|
SESAC Holdco II, LLC, L+400, 1.00% LIBOR Floor, 2/8/2019 |
|
1 Month LIBOR |
|
Media: Broadcasting & Subscription |
|
|
490,050 |
|
|
496,856 |
|
|
6,806 |
|
SK Spice S.Á.R.L, L+825, 1.25% LIBOR Floor, 9/30/2018(e) |
|
3 Month LIBOR |
|
Chemicals, Plastics & Rubber |
|
|
2,972,550 |
|
|
2,966,316 |
|
|
(6,234) |
|
SRA International, L+525, 1.25% LIBOR Floor, 7/20/2018 |
|
3 Month LIBOR |
|
High Tech Industries |
|
|
2,351,305 |
|
|
2,388,954 |
|
|
37,649 |
|
Steward Health Care System, LLC, L+550, 1.25% LIBOR Floor, 4/10/2020 |
|
12 Month LIBOR |
|
Healthcare & Pharmaceuticals |
|
|
3,436,500 |
|
|
3,478,147 |
|
|
41,647 |
|
Sutherland Global Services, L+600, 1.25% LIBOR Floor, 3/6/2019(e) |
|
6 Month LIBOR |
|
Services: Business |
|
|
1,913,941 |
|
|
1,917,307 |
|
|
3,366 |
|
Tech Finance & Co. S.C.A., L+600, 1.25% LIBOR Floor, 7/11/2020(e) |
|
3 Month LIBOR |
|
Media: Broadcasting & Subscription |
|
|
1,942,906 |
|
|
1,994,750 |
|
|
51,844 |
|
Tervita, L+500, 1.25% LIBOR Floor, 5/15/2018(d)(e) |
|
3 Month LIBOR |
|
Environmental Industries |
|
|
3,533,364 |
|
|
3,554,920 |
|
|
21,556 |
|
The TOPPS Company, Inc., L+600, 1.25% LIBOR Floor, 10/2/2018 |
|
3 Month LIBOR |
|
Consumer Goods: Non-Durable |
|
|
2,007,500 |
|
|
1,995,000 |
|
|
(12,500) |
|
Travel Leaders Group, LLC, P+500, 2.00% Base Rate Floor, 12/5/2018 |
|
Prime |
|
Services: Consumer |
|
|
1,975,000 |
|
|
1,965,000 |
|
|
(10,000) |
|
Travelport, LLC, L+500, 1.25% LIBOR Floor, 6/26/2019(e) |
|
3 Month LIBOR |
|
Hotel, Gaming & Leisure |
|
|
1,585,383 |
|
|
1,640,669 |
|
|
55,286 |
|
TriNet HR Corp., L+400, 1.00% LIBOR Floor, 8/20/2020 |
|
3 Month LIBOR |
|
Services: Business |
|
|
1,649,167 |
|
|
1,678,319 |
|
|
29,152 |
|
Vince, LLC, L+500, 1.00% LIBOR Floor, 11/27/2019(e) |
|
1 Month LIBOR |
|
Consumer Goods: Non-Durable |
|
|
1,752,300 |
|
|
1,783,275 |
|
|
30,975 |
|
VFH Parent, LLC, L+450, 1.25% LIBOR Floor, 11/8/2019 |
|
3 Month LIBOR |
|
Banking, Finance, Insurance & Real Estate |
|
|
2,597,561 |
|
|
2,624,622 |
|
|
27,061 |
|
W/S Packaging Group, Inc., L+400, 1.00% LIBOR Floor, 8/9/2019 |
|
4 Month LIBOR |
|
Containers, Packaging & Glass |
|
|
2,481,284 |
|
|
2,493,750 |
|
|
12,466 |
|
Washington Inventory Services, L+450, 1.25% LIBOR Floor, 12/20/2018 |
|
3 Month LIBOR |
|
Retail |
|
|
492,525 |
|
|
495,931 |
|
|
3,406 |
|
WP CPP Holdings, LLC, L+375, 1.00% LIBOR Floor, 12/28/2019 |
|
3 Month LIBOR |
|
Aerospace & Defense |
|
|
935,288 |
|
|
942,320 |
|
|
7,032 |
|
Total Senior Secured First Lien Term Loans |
|
|
|
|
|
|
128,420,410 |
|
|
129,609,512 |
|
|
1,189,102 |
27
CĪON Investment Corporation
Notes to Consolidated Financial Statements
March 31, 2014
(unaudited)
|
Underlying Loans(a) |
|
Index Rate(b) |
|
Industry |
|
Notional |
|
Fair |
|
Unrealized |
|||
|
Senior Secured Second Lien Term Loans |
|
|
|
|
|
|
|
|
|
|
|
|
|
|
Arysta LifeScience SPC, LLC, L+700, 1.25% LIBOR Floor, 11/30/2020(e) |
|
3 Month LIBOR |
|
Chemicals, Plastics & Rubber |
|
|
1,160,540 |
|
|
1,190,029 |
|
|
29,489 |
|
Carestream Health, Inc., L+850, 1.00% LIBOR Floor, 12/7/2019(e) |
|
3 Month LIBOR |
|
Healthcare & Pharmaceuticals |
|
|
980,000 |
|
|
1,017,500 |
|
|
37,500 |
|
Del Monte Foods, Inc., L+725, 1.00% LIBOR Floor, 7/26/2021(d) |
|
6 Month LIBOR |
|
Beverage, Food & Tobacco |
|
|
2,257,200 |
|
|
2,299,950 |
|
|
42,750 |
|
Deltek, Inc., L+875, 1.25% LIBOR Floor, 10/10/2019 |
|
3 Month LIBOR |
|
Services: Business |
|
|
1,619,640 |
|
|
1,660,540 |
|
|
40,900 |
|
Ion Trading Technologies S.Á R.L., L+700, 1.25% LIBOR Floor, 5/22/2021(e) |
|
3 Month LIBOR |
|
Banking, Finance, Insurance & Real Estate |
|
|
993,125 |
|
|
1,018,130 |
|
|
25,005 |
|
Performance Food Group, Inc., L+525, 1.00% LIBOR Floor, 11/14/2019 |
|
3 Month LIBOR |
|
Beverage, Food & Tobacco |
|
|
3,849,587 |
|
|
3,887,290 |
|
|
37,703 |
|
Securus Technologies Holdings, Inc., L+775, 1.25% LIBOR Floor, 4/30/2021 |
|
3 Month LIBOR |
|
Telecommunications |
|
|
1,002,075 |
|
|
990,830 |
|
|
(11,245) |
|
Sheridan Holdings, Inc., L+725, 1.00% LIBOR Floor, 12/20/2021 |
|
3 Month LIBOR |
|
Healthcare & Pharmaceuticals |
|
|
2,736,250 |
|
|
2,750,000 |
|
|
13,750 |
|
TriNet HR Corp., L+775, 1.00% LIBOR Floor, 2/20/2021 |
|
2 Month LIBOR |
|
Services: Business |
|
|
2,465,510 |
|
|
2,512,500 |
|
|
46,990 |
|
U.S. Renal Care, Inc., L+750, 1.00% LIBOR Floor, 1/3/2020 |
|
3 Month LIBOR |
|
Healthcare & Pharmaceuticals |
|
|
676,200 |
|
|
696,900 |
|
|
20,700 |
|
TWCC Holding Corp., L+600, 1.00% LIBOR Floor, 6/26/2020 |
|
6 Month LIBOR |
|
Media: Broadcasting & Subscription |
|
|
2,039,400 |
|
|
2,115,373 |
|
|
75,973 |
|
Total Senior Secured Second Lien Term Loans |
|
|
|
|
|
|
19,779,527 |
|
|
20,139,042 |
|
|
359,515 |
|
Total |
|
|
|
|
|
$ |
148,199,937 |
|
$ |
149,748,554 |
|
$ |
1,548,617 |
|
|
|
|
|
|
|
|
|
|
|
|
|
|
|
|
(a) |
All of the Company's debt investments are issued by eligible U.S. portfolio companies, as defined in the 1940 Act, except for investments specifically identified as non-qualifying per note (d) below. The Company does not control and is not an affiliate of any of the companies that are issuers of the underlying loans subject to the TRS. |
|
(b) |
The 1, 2, 3, 4, 6 and 12 month LIBOR rates were 0.17%, 0.21%, 0.25%, 0.32%, 0.35% and 0.58%, respectively, as of December 31, 2013. The prime rate was 3.25% as of December 31, 2013. The applicable LIBOR rate as of December 31, 2013 for the loan listed may not be the applicable LIBOR rate, as the loan may have been priced or repriced based on a LIBOR rate prior to December 31, 2013. |
|
(c) |
Fair value determined by the Company’s board of directors (see Note 8). |
|
(d) |
Position or portion thereof unsettled as of December 31, 2013. |
|
(e) |
The investment is not a qualifying asset under the 1940 Act. A business development company may not acquire any asset other than qualifying assets, unless, at the time the acquisition is made, qualifying assets represent at least 70% of that company’s total assets as defined under Section 55 of the 1940 Act. As of December 31, 2013, 88.2% of the Company’s total assets represented qualifying assets. In addition, as described in this note, the Company calculates its compliance with the qualifying asset test on a “look through” basis by treating each loan underlying the TRS as either a qualifying asset or non-qualifying asset based on whether the obligor is an eligible portfolio company. On this basis, 76.1% of the Company’s total assets represented qualifying assets as of December 31, 2013. |
28
CĪON Investment Corporation
Notes to Consolidated Financial Statements
March 31, 2014
(unaudited)
Note 8. Fair Value of Financial Instruments
The Company determines the fair value of all portfolio investments in accordance with ASC Topic 820. ASC Topic 820 requires enhanced disclosures about assets and liabilities that are measured and reported at fair value. As defined in ASC Topic 820, fair value is the price that would be received to sell an asset or paid to transfer a liability in an orderly transaction between market participants at the measurement date.
ASC Topic 820 establishes a hierarchical disclosure framework that prioritizes and ranks the level of market price observability of inputs used in measuring investments at fair value. Market price observability is affected by a number of factors, including the type of investment and the characteristics specific to the investment. Investments with readily available active quoted prices or for which fair value can be measured from actively quoted prices generally will have a higher degree of market price observability and a lesser degree of judgment used in measuring fair value.
Based on the observability of the inputs used in the valuation techniques, the Company is required to provide disclosures on fair value measurements according to the fair value hierarchy. Investments carried at fair value are classified and disclosed in one of the following three categories:
· Level 1—Valuations based on quoted prices in active markets for identical assets or liabilities that the Company has the ability to access. The Company’s short term investments are included in this category.
· Level 2—Valuations based on inputs other than quoted prices in active markets, which are either directly or indirectly observable.
· Level 3—Valuations based on inputs that are unobservable and significant to the overall fair value measurement. The inputs used in the determination of fair value may require significant management judgment or estimation. Such information may be the result of consensus pricing information or broker quotes that include a disclaimer that the broker would not be held to such a price in an actual transaction. The non-binding nature of consensus pricing and/or quotes accompanied by the disclaimer would result in classification as a Level 3 asset, assuming no additional corroborating evidence.
The following table presents fair value measurements of the Company’s portfolio investments and TRS as of March 31, 2014 and December 31, 2013, according to the fair value hierarchy:
|
|
|
March 31, 2014 |
|||||||||||||
|
Valuation Inputs |
|
First Lien Senior |
|
Second Lien Senior |
|
Collateralized Securities |
|
Short Term |
|
Total Return Swap |
|||||
|
Level 1—Price quotations in active markets |
|
$ |
- |
|
$ |
- |
|
$ |
- |
|
$ |
11,003,717 |
|
$ |
- |
|
Level 2—Significant other observable inputs |
|
|
- |
|
|
- |
|
|
- |
|
|
- |
|
|
- |
|
Level 3—Significant unobservable inputs |
|
|
84,299,368 |
|
|
47,163,590 |
|
|
11,044,972 |
|
|
- |
|
|
2,756,542 |
|
|
|
$ |
84,299,368 |
|
$ |
47,163,590 |
|
$ |
11,044,972 |
|
$ |
11,003,717 |
|
$ |
2,756,542 |
|
|
|
December 31, 2013 |
|||||||||||||
|
Valuation Inputs |
|
First Lien Senior |
|
Second Lien Senior |
|
Collateralized Securities |
|
Short Term |
|
Total Return Swap |
|||||
|
Level 1—Price quotations in active markets |
|
$ |
- |
|
$ |
- |
|
$ |
- |
|
$ |
11,383,669 |
|
$ |
- |
|
Level 2—Significant other observable inputs |
|
|
- |
|
|
- |
|
|
- |
|
|
- |
|
|
- |
|
Level 3—Significant unobservable inputs |
|
|
61,787,430 |
|
|
22,552,214 |
|
|
8,795,600 |
|
|
- |
|
|
1,548,617 |
|
|
|
$ |
61,787,430 |
|
$ |
22,552,214 |
|
$ |
8,795,600 |
|
$ |
11,383,669 |
|
$ |
1,548,617 |
29
CĪON Investment Corporation
Notes to Consolidated Financial Statements
March 31, 2014
(unaudited)
The Company’s investments as of March 31, 2014 and December 31, 2013, excluding short term investments, primarily consisted of debt securities that are traded on a private over-the-counter market for institutional investors. Except for investments specifically identified, the Company valued its portfolio investments by using market comparables, discounted cash flow models and independent third-party pricing services, which provided prevailing bid and ask prices that were screened for validity by the pricing service from dealers on the determination date of the relevant period end. Three and four senior secured loans that were purchased near March 31, 2014 and December 31, 2013, respectively, and one collateralized security as of March 31, 2014, were valued using cost at acquisition, as the Company determined that the cost of the investments was the best indication of their current fair value.
The discounted cash flow model deemed appropriate by CIM is prepared for the applicable investments and reviewed by the Company’s valuation committee consisting of senior management. Such models are prepared at least quarterly or on an as needed basis. The model uses the estimated cash flow projections for the underlying investments and an appropriate discount rate is determined based on the latest financial information available for the borrower, prevailing market trends, comparable analysis and other inputs. The model, key assumptions, inputs, and results are reviewed by the Company’s valuation committee with final approval from the board of directors.
The Company periodically benchmarks the bid and ask prices received from the third-party pricing services against the actual prices at which it purchases and sells its investments. Based on the results of the benchmark analysis and the Company’s experience in purchasing and selling these investments, the Company believes that these prices are reliable indicators of fair value. However, because of the private nature of this marketplace (meaning actual transactions are not publicly reported), the Company believes that these valuation inputs are classified as Level 3 within the fair value hierarchy. The Company may also use other methods to determine fair value for securities for which it cannot obtain prevailing bid and ask prices through third-party pricing services or independent dealers, including the use of an independent valuation firm. The Company periodically benchmarks the valuations provided by the independent valuation firm against the actual prices at which it purchases and sells its investments. The Company’s valuation committee and board of directors review and approve the valuation determinations made with respect to these investments in a manner consistent with the Company’s valuation process.
Three of the Company’s collateralized security investments as of March 31, 2014 and December 31, 2013, for which broker quotes were not available, were valued by an independent valuation firm, which determined the fair value of such investments by considering, among other factors, each borrower’s ability to adequately service its debt, prevailing interest rates for like investments, call features and other relevant terms of the debt.
The Company valued its TRS in accordance with the TRS Agreement. Pursuant to the TRS Agreement, the fair value of the TRS is based on the increase or decrease in the value of the loans underlying the TRS. The loans underlying the TRS are valued by Citibank. Citibank bases its valuation primarily on the indicative bid prices provided by an independent third-party pricing service. Bid prices reflect a price that market participants may be willing to pay for an investment. These valuations are sent to the Company for review and testing. The Company reviews and approves the value of the TRS, as well as the value of the loans underlying the TRS, on a quarterly basis as part of the quarterly valuation process. To the extent the Company has any questions or concerns regarding the valuation of the loans underlying the TRS, such valuations will be discussed or challenged pursuant to the terms of the TRS Agreement. As a result of the private nature of this marketplace (meaning actual transactions are not publicly reported), the Company believes that the total fair value of the TRS should be classified as Level 3 within the fair value hierarchy.
The Company did not have any transfers between Level 1, Level 2, and Level 3 of the fair value hierarchy during the three months ended March 31, 2014 and 2013. The Company’s policy is to recognize transfers in and out as of the actual date of the event or change in circumstances that causes the transfer.
30
CĪON Investment Corporation
Notes to Consolidated Financial Statements
March 31, 2014
(unaudited)
The following tables provide a reconciliation of the beginning and ending balances for investments that use Level 3 inputs for the three months ended March 31, 2014 and 2013:
|
|
|
Three Months Ended March 31, 2014 |
|||||||||||||
|
|
First Lien Senior |
|
Second Lien Senior |
|
Collateralized Securities |
|
Total Return |
|
Total |
||||||
|
Beginning balance, December 31, 2013 |
$ |
61,787,430 |
|
$ |
22,552,214 |
|
$ |
8,795,600 |
|
$ |
1,548,617 |
|
$ |
94,683,861 |
|
|
Investments purchased |
39,066,873 |
|
25,637,234 |
|
2,292,722 |
|
- |
|
66,996,829 |
||||||
|
Net realized gain |
144,342 |
|
29,372 |
|
- |
|
- |
|
173,714 |
||||||
|
Net change in unrealized appreciation(1) |
313,320 |
|
341,639 |
|
(44,066) |
|
1,207,925 |
|
1,818,818 |
||||||
|
Accretion of discount |
41,304 |
|
|
4,456 |
|
716 |
|
|
- |
|
|
46,476 |
|||
|
Sales and principal repayments |
(17,053,901) |
|
(1,401,325) |
|
- |
|
- |
|
(18,455,226) |
||||||
|
Ending balance, March 31, 2014 |
$ |
84,299,368 |
|
$ |
47,163,590 |
|
$ |
11,044,972 |
|
$ |
2,756,542 |
|
$ |
145,264,472 |
|
|
Change in unrealized gains or losses for the period included in changes in net assets for assets held at the end of the reporting period |
$ |
454,072 |
|
$ |
383,889 |
|
$ |
(44,066) |
|
$ |
1,354,753 |
|
$ |
2,148,648 |
|
|
|
|
|
|
|
|
|
|
|
|
|
|
|
|
|
|
|
(1) |
Represents the amount of total gains/losses for the period included in the change in unrealized appreciation (depreciation) on investments and change in unrealized appreciation (depreciation) on total return swap still held at the reporting date. |
|
|
|
Three Months Ended March 31, 2013 |
|||||||||||||
|
|
First Lien Senior |
|
Second Lien Senior |
|
Collateralized Securities |
|
Total Return |
|
Total |
||||||
|
Beginning balance, December 31, 2012 |
$ |
1,980,044 |
|
$ |
- |
|
$ |
- |
|
$ |
12,395 |
|
$ |
1,992,439 |
|
|
Investments purchased |
4,176,490 |
|
2,477,500 |
|
- |
|
- |
|
6,653,990 |
||||||
|
Net realized gain |
4,533 |
|
- |
|
- |
|
- |
|
4,533 |
||||||
|
Net change in unrealized appreciation(1) |
59,185 |
|
65,097 |
|
- |
|
250,676 |
|
374,958 |
||||||
|
Accretion of discount |
|
1,623 |
|
|
528 |
|
|
- |
|
|
- |
|
|
2,151 |
|
|
Sales and principal repayments |
(519,375) |
|
- |
|
- |
|
- |
|
(519,375) |
||||||
|
Ending balance, March 31, 2013 |
$ |
5,702,500 |
|
$ |
2,543,125 |
|
$ |
- |
|
$ |
263,071 |
|
$ |
8,508,696 |
|
|
Change in unrealized gains or losses for the period included in changes in net assets for assets held at the end of the reporting period |
$ |
59,185 |
|
$ |
65,097 |
|
$ |
- |
|
$ |
255,831 |
|
$ |
380,113 |
|
|
|
|
|
|
|
|
|
|
|
|
|
|
|
|
|
|
|
(1) |
Represents the amount of total gains/losses for the period included in the change in unrealized appreciation (depreciation) on investments and change in unrealized appreciation (depreciation) on total return swap still held at the reporting date. |
Significant Unobservable Inputs
The valuation techniques and significant unobservable inputs used in recurring Level 3 fair value measurements of investments as of March 31, 2014 and December 31, 2013 were as follows:
|
|
March 31, 2014 |
|||||||
|
|
Fair Value |
|
Valuation Technique |
|
Unobservable |
|
Range |
|
|
Senior secured term loans - first lien |
$ |
84,299,368 |
|
Discounted cash flow |
|
Discount rates |
|
4.8% - 10.0% |
|
Senior secured term loans - second lien |
|
47,163,590 |
|
Discounted cash flow |
|
Discount rates |
|
7.5% - 13.0% |
|
Collateralized securities |
|
11,044,972 |
|
Discounted cash flow |
|
Discount rate |
|
8.7% - 13.0% |
31
CĪON Investment Corporation
Notes to Consolidated Financial Statements
March 31, 2014
(unaudited)
|
|
December 31, 2013 |
|||||||
|
|
Fair Value |
|
Valuation Technique |
|
Unobservable |
|
Range |
|
|
Senior secured term loans - first lien |
$ |
61,787,430 |
|
Discounted cash flow |
|
Discount rates |
|
4.8% - 9.7% |
|
Senior secured term loans - second lien |
$ |
22,552,214 |
|
Discounted cash flow |
|
Discount rates |
|
7.5% - 11.8% |
|
Collateralized securities |
$ |
8,795,600 |
|
Discounted cash flow |
|
Discount rate |
|
10.0% - 13.0% |
The significant unobservable inputs used in the fair value measurement of the Company’s senior secured first lien and second lien term loans, and collateralized securities are discount rates. A significant increase or decrease in discount rates would result in a significantly lower or higher fair value measurement, respectively.
Note 9. General and Administrative Expense
General and administrative expense consisted of the following items for the three months ended March 31, 2014 and 2013:
|
|
|
Three Months |
|
Three Months |
|
||
|
|
|
Ended |
|
Ended |
|
||
|
|
|
March 31, 2014 |
|
March 31, 2013 |
|
||
|
|
Due diligence fees |
$ |
322,987 |
|
$ |
39,018 |
|
|
|
Professional fees expense |
|
287,007 |
|
|
240,569 |
|
|
|
Transfer agent expense |
116,345 |
|
13,602 |
|
||
|
|
Marketing expense |
87,760 |
|
86,640 |
|
||
|
|
Insurance expense |
51,858 |
|
52,901 |
|
||
|
|
Printing and mailing expense |
33,138 |
|
24,888 |
|
||
|
|
Director fees and expenses |
32,289 |
|
7,839 |
|
||
|
|
Dues and subscriptions |
21,410 |
|
10,933 |
|
||
|
|
Filing fees |
5,651 |
|
6,100 |
|
||
|
|
Other expenses |
99,683 |
|
26,373 |
|
||
|
|
Total general and administrative expense |
$ |
1,058,128 |
|
$ |
508,863 |
|
Note 10. Commitments and Contingencies
The Company entered into certain contracts with other parties that contain a variety of indemnifications. The Company’s maximum exposure under these arrangements is unknown. However, the Company has not experienced claims or losses pursuant to these contracts and believes the risk of loss related to such indemnifications to be remote.
As of March 31, 2014 and December 31, 2013, the Company’s unfunded loan commitments amounted to $3,054,668 and $2,450,758, respectively. For the specific portfolio companies which the Company is committed to fund additional amounts as of March 31, 2014 and December 31, 2013, refer to the consolidated schedule of investments.
32
CĪON Investment Corporation
Notes to Consolidated Financial Statements
March 31, 2014
(unaudited)
Note 11. Financial Highlights
The following is a schedule of financial highlights as of and for the three months ended March 31, 2014 and 2013:
|
|
|
As of and for the |
|
As of and for the |
||
|
|
|
Three Months |
|
Three Months |
||
|
|
|
Ended |
|
Ended |
||
|
|
|
March 31, 2014 |
|
March 31, 2013 |
||
|
Per share data:(1) |
|
|
|
|||
|
Net asset value at beginning of period |
$ |
9.32 |
|
$ |
8.97 |
|
|
Results of operations: |
|
|
|
|
|
|
|
|
Net investment loss(2) |
|
(0.01) |
|
|
(0.04) |
|
|
Net realized gain and net change in unrealized appreciation on investments |
|
0.04 |
|
|
0.11 |
|
|
Net realized gain and net change in unrealized appreciation on total return swap |
|
0.21 |
|
|
0.46 |
|
Net increase in net assets resulting from operations |
|
0.24 |
|
|
0.53 |
|
|
Shareholder distributions: |
|
|
|
|
|
|
|
|
Distributions from net realized gains |
|
(0.16) |
|
|
(0.18) |
|
|
Distributions from other sources |
|
(0.01) |
|
|
- |
|
Net decrease in net assets from shareholder distributions |
|
(0.17) |
|
|
(0.18) |
|
|
Capital share transactions: |
|
|
|
|
|
|
|
|
Issuance of common stock above net asset value(3) |
|
0.01 |
|
|
0.05 |
|
|
Amortization of deferred offering expenses |
|
- |
|
|
(0.21) |
|
Net increase (decrease) in net assets resulting from capital share transactions |
|
0.01 |
|
|
(0.16) |
|
|
Net asset value at end of period |
$ |
9.40 |
|
$ |
9.16 |
|
|
Shares of common stock outstanding at end of period |
|
23,991,865 |
|
|
1,712,123 |
|
|
Total investment return-net asset value(4) |
|
2.63% |
|
|
4.04% |
|
|
Net assets at beginning of period |
$ |
144,570,485 |
|
$ |
4,487,115 |
|
|
Net assets at end of period |
$ |
225,470,062 |
|
$ |
15,689,645 |
|
|
Average net assets |
$ |
195,360,862 |
|
$ |
10,088,380 |
|
|
|
|
|
|
|
|
|
|
Ratio/Supplemental data: |
|
|
|
|
|
|
|
Ratio of net investment loss to average net assets(5) |
|
(0.13%) |
|
|
(0.46%) |
|
|
Ratio of net operating expenses to average net assets(5) |
|
1.25% |
|
|
1.14% |
|
|
Ratio of gross operating expenses to average net assets(6) |
|
0.52% |
|
|
2.75% |
|
|
Ratio of total expenses (before expenses reimbursed) to average net assets |
|
1.79% |
|
|
9.26% |
|
|
Ratio of expenses reimbursed from IIG to average net assets |
|
0.54% |
|
|
8.12% |
|
|
Portfolio turnover rate(7) |
|
16.17% |
|
|
10.80% |
|
|
Asset coverage ratio(8) |
|
2.39 |
|
|
2.50 |
|
|
|
|
|
|
|
|
|
33
CĪON Investment Corporation
Notes to Consolidated Financial Statements
March 31, 2014
(unaudited)
|
(1) |
The per share data for the three months ended March 31, 2014 and 2013 was derived by using the weighted average shares of common stock outstanding during each period. |
|
(2) |
Net investment loss per share includes the expense reimbursement from IIG of $0.05 and $0.70 per share for the three months ended March 31, 2014 and 2013, respectively. |
|
(3) |
The continuous issuance of shares of common stock may cause an incremental increase in net asset value per share due to the sale of shares at the then prevailing public offering price and the receipt of net proceeds per share by the Company in excess of net asset value per share on each subscription closing date. |
|
(4) |
Total investment return-net asset value is a measure of the change in total value for shareholders who held the Company’s common stock at the beginning and end of the period, including distributions paid or payable during the period. Total investment return-net asset value is based on (i) the beginning period net asset value per share on the first day of the period, (ii) the net asset value per share on the last day of the period of (A) one share plus (B) any fractional shares issued in connection with the reinvestment of monthly distributions, and (iii) the value of distributions payable, if any, on the last day of the period. The total investment return-net asset value calculation assumes that (i) monthly cash distributions are reinvested in accordance with the Company's distribution reinvestment plan and second amended and restated distribution reinvestment plan and (ii) the fractional shares issued pursuant to the distribution reinvestment plan and second amended and restated distribution reinvestment plan are issued at 95% (from January 1, 2013 through September 30, 2013) and 90% (from October 1, 2013 through March 31, 2014) of the then public offering price on the date of purchase, respectively. The total investment return-net asset value does not consider the effect of the sales load from the sale of the Company’s common stock. The total investment return-net asset value includes the effect of the issuance of shares at a net offering price that is greater than net asset value per share, which causes an increase in net asset value per share. Total returns covering less than a full period are not annualized. |
|
(5) |
Excluding the expense reimbursement from IIG during the period, the ratio of net investment loss to average net assets would have been (0.66%) and (8.58%) for the three months ended March 31, 2014 and 2013, respectively. |
|
(6) |
Operating expenses include all expenses borne by the Company, except for organization costs and offering expenses, base management fees, incentive fees, administrative services expenses and other general and administrative expenses owed to CIM and its affiliates, and interest expense. |
|
(7) |
Portfolio turnover rate is calculated using the lesser of year-to-date sales or purchases over the average of the invested assets at fair value, excluding short term investments, and is not annualized. |
|
(8) |
Asset coverage ratio is equal to (i) the sum of (a) net assets at the end of the period and (b) total senior securities outstanding at the end of the period, divided by (ii) total senior securities outstanding at the end of the period. For purposes of the asset coverage ratio test applicable to the Company as a BDC, the Company treats the outstanding TRS notional amount at the end of the period, less the total amount of cash collateral posted by Flatiron under the TRS, as a senior security for the life of the TRS. |
34
Item 2. Management’s Discussion and Analysis of Financial Condition and Results of Operations
As used in this Quarterly Report on Form 10-Q, “we,” “us,” “our” or similar terms include CĪON Investment Corporation and its consolidated subsidiaries.
The following discussion should be read in conjunction with our unaudited consolidated financial statements and related notes appearing elsewhere in this Quarterly Report on Form 10-Q and the audited consolidated financial statements and related notes included in our Annual Report on Form 10-K for the year ended December 31, 2013. In addition to historical information, the following discussion and other parts of this Quarterly Report on Form 10-Q contain forward-looking information that involves risks and uncertainties.
Forward-Looking Statements
Some of the statements within this Quarterly Report on Form 10-Q may constitute forward-looking statements because they relate to future events or our future performance or financial condition. The forward-looking statements contained in this Quarterly Report on Form 10-Q may include statements as to:
|
• |
our future operating results; |
|
|
• |
our business prospects and the prospects of our portfolio companies; |
|
|
• |
the impact of the investments that we expect to make; |
|
|
• |
the ability of our portfolio companies to achieve their objectives; |
|
|
• |
our current and expected financings and investments; |
|
|
• |
the adequacy of our cash resources, financing sources and working capital; |
|
|
• |
the use of borrowed money to finance a portion of our investments; |
|
|
• |
the timing of cash flows, if any, from the operations of our portfolio companies; |
|
|
• |
our contractual arrangements and relationships with third parties; |
|
|
• |
the actual and potential conflicts of interest with CIM and Apollo and their respective affiliates; |
|
|
• |
the ability of CIM and AIM to locate suitable investments for us and the ability of CIM to monitor and administer our investments; |
|
|
• |
the ability of CIM and AIM and their respective affiliates to attract and retain highly talented professionals; |
|
|
• |
the dependence of our future success on the general economy and its impact on the industries in which we invest; |
|
|
• |
our ability to source favorable private investments; |
|
|
• |
our tax status; |
|
|
• |
the effect of changes to tax legislation and our tax position; |
|
|
• |
the tax status of the companies in which we invest; and |
|
|
• |
the timing and amount of distributions and dividends from the companies in which we invest. |
In addition, words such as “anticipate,” “believe,” “expect” and “intend” indicate a forward-looking statement, although not all forward-looking statements include these words. The forward-looking statements contained in this Quarterly Report on Form 10-Q involve risks and uncertainties. Our actual results could differ materially from those implied or expressed in the forward-looking statements for any reason, including the factors set forth in “Risk Factors” in Item 1A of Part II of this Quarterly Report on Form 10-Q. Other factors that could cause actual results to differ materially include:
|
• |
changes in the economy; |
|
|
• |
risks associated with possible disruption in our operations or the economy generally due to terrorism or natural disasters; and |
|
|
• |
future changes in laws or regulations and conditions in our operating areas. |
35
We have based the forward-looking statements on information available to us on the date of this Quarterly Report on Form 10-Q. Except as required by the federal securities laws, we undertake no obligation to revise or update any forward-looking statements, whether as a result of new information, future events or otherwise. You are advised to review any additional disclosures that we may make directly to you or through reports that we in the future may file with the SEC, including annual reports on Form 10-K, quarterly reports on Form 10-Q and current reports on Form 8-K. The forward-looking statements contained in this Quarterly Report on Form 10-Q are excluded from the safe harbor protection provided by Section 27A of the Securities Act of 1933, as amended, and Section 21E of the Securities Exchange Act of 1934, as amended.
Overview
We were incorporated under the general corporation laws of the State of Maryland on August 9, 2011 and commenced operations on December 17, 2012 upon raising proceeds of $2,500,000 from persons not affiliated with us, CIM or Apollo. We are an externally managed, non-diversified closed-end management investment company that has elected to be regulated as a BDC under the 1940 Act. We elected to be treated for federal income tax purposes as a RIC, as defined under Subchapter M of the Code.
Our investment objective is to generate current income and, to a lesser extent, capital appreciation for investors. We anticipate that our portfolio will be comprised primarily of investments in senior secured loans and, to a lesser extent, second lien loans and long-term subordinated loans, referred to as mezzanine loans, of private and thinly traded U.S. middle-market companies. In connection with our debt investments, we may receive equity interests such as warrants or options as additional consideration. We may also purchase minority interests in the form of common or preferred equity in our target companies, either in conjunction with one of our debt investments or through a co-investment with a financial sponsor. In addition, a portion of our portfolio may be comprised of corporate bonds and other debt securities. However, such investments are not expected to comprise a significant portion of our portfolio.
We are managed by CIM, our affiliate and a registered investment adviser. CIM oversees the management of our activities and is responsible for making investment decisions for our portfolio. We and CIM have engaged AIM to act as our investment sub-adviser.
We seek to meet our investment objective by utilizing the experienced management teams of both CIM and AIM, which includes their access to the relationships and human capital of Apollo, IIG and ICON Capital, in sourcing, evaluating and structuring transactions. We focus primarily on the senior secured debt of private and thinly traded U.S. middle-market companies, which we define as companies that generally possess annual EBITDA of $50 million or less, with experienced management teams, significant free cash flow, strong competitive positions and potential for growth.
Revenue
We primarily generate revenue in the form of interest income on the debt securities that we hold and capital gains on debt or other equity interests that we acquire in portfolio companies. Our senior debt investments bear interest at a floating rate. Interest on debt securities is generally payable quarterly or semiannually. In some cases, some of our investments may provide for deferred interest payments or PIK interest. The principal amount of the debt securities and any accrued, but unpaid, interest generally will become due at the maturity date. In addition, we may generate revenue in the form of commitment, origination, structuring or diligence fees, monitoring fees, fees for providing managerial assistance and possibly consulting fees and performance-based fees. Any such fees generated in connection with our investments will be recognized when earned.
Operating Expenses
Our primary operating expenses are the payment of advisory fees and other expenses under the investment advisory and administration agreements. Our investment advisory fee compensates CIM for its work in identifying, evaluating, negotiating, executing, monitoring and servicing our investments. CIM is responsible for compensating AIM for its services pursuant to the investment sub-advisory agreement. We bear all other expenses of our operations and transactions, including, without limitation:
· corporate expenses relating to borrowings and costs associated with the offering of our common stock, subject to limitations included in the administration agreement;
· the costs of calculating our net asset value, including the cost of any third-party valuation services;
· investment advisory fees;
· fees payable to third parties relating to, or associated with, making, monitoring and disposing of investments and valuing investments and enforcing our contractual rights, including fees and expenses associated with performing due diligence reviews of prospective investments;
· transfer agent and custodial fees;
· fees and expenses associated with our marketing efforts;
· interest payable on debt, if any, incurred to finance our investments;
· federal and state registration fees;
36
· federal, state and local taxes;
· independent directors’ fees and expenses;
· costs of proxy statements, shareholders’ reports and notices;
· fidelity bond, directors and officers/errors and omissions liability insurance and other insurance premiums;
· direct costs such as printing, mailing, long distance telephone and staff;
· fees and expenses associated with independent audits and outside legal costs, including compliance with the Sarbanes-Oxley Act of 2002;
· costs associated with our reporting and compliance obligations under the 1940 Act and applicable federal and state securities laws;
· brokerage commissions for our investments; and
· all other expenses incurred by CIM, AIM or us in connection with administering our business, including expenses incurred by CIM or AIM in performing its obligations, and the reimbursement of the compensation of our chief financial officer and chief compliance officer and their respective staffs paid by CIM, to the extent that they are not a person with a controlling interest in CIM or any of its affiliates, in each case subject to the limitations included in the investment advisory and administration agreements, as applicable.
Portfolio Investment Activity for the Three Months Ended March 31, 2014
The following table summarizes our investment activity, excluding short term investments, for the three months ended March 31, 2014:
|
|
|
Three Months Ended March 31, 2014 |
|||||||
|
Net Investment Activity |
|
Investment Portfolio |
|
Total Return Swap |
|
Total |
|||
|
Purchases and drawdowns |
|
$ |
66,996,829 |
|
$ |
152,955,367 |
|
$ |
219,952,196 |
|
Sales and principal repayments |
|
|
(18,455,226) |
|
|
(67,710,268) |
|
|
(86,165,494) |
|
Net portfolio activity |
|
$ |
48,541,603 |
|
$ |
85,245,099 |
|
$ |
133,786,702 |
|
|
|
Three Months Ended March 31, 2014 |
|||||||||||||
|
|
|
Investment Portfolio |
|
Total Return Swap |
|
Total |
|||||||||
|
New Investment Activity by Asset Class |
|
Purchases |
|
Percentage |
|
Purchases |
|
Percentage |
|
Purchases |
|
Percentage |
|||
|
Senior secured term loans - first lien |
|
$ |
39,066,873 |
|
58.3% |
|
$ |
135,071,119 |
|
88.3% |
|
$ |
174,137,992 |
|
79.2% |
|
Senior secured term loans - second lien |
|
|
25,637,234 |
|
38.3% |
|
|
17,884,248 |
|
11.7% |
|
|
43,521,482 |
|
19.8% |
|
Collateralized securities |
|
|
2,292,722 |
|
3.4% |
|
|
- |
|
- |
|
|
2,292,722 |
|
1.0% |
|
Total purchases |
|
$ |
66,996,829 |
|
100.0% |
|
$ |
152,955,367 |
|
100.0% |
|
$ |
219,952,196 |
|
100.0% |
37
The following table summarizes the composition of our investment portfolio at amortized cost and fair value and our underlying TRS loans portfolio at notional amount and fair value as of March 31, 2014 and December 31, 2013:
|
|
|
March 31, 2014 |
||||||||||||||||||||||
|
|
|
Investment Portfolio |
|
Total Return Swap |
|
Total |
||||||||||||||||||
|
|
|
Investments Amortized |
|
Investments Fair |
|
Percentage of |
|
Notional Amount of Underlying TRS Loans |
|
Fair Value of Underlying TRS Loans |
|
Percentage of Underlying TRS Loans |
|
Amortized Cost/ |
|
Fair Value |
|
Percentage |
||||||
|
Senior secured term loans - first lien |
|
$ |
83,294,303 |
|
$ |
84,299,368 |
|
54.9% |
|
$ |
185,474,021 |
|
$ |
187,393,550 |
|
80.4% |
|
$ |
268,768,324 |
|
$ |
271,692,918 |
|
70.3% |
|
Senior secured term loans - second lien |
|
|
46,459,068 |
|
|
47,163,590 |
|
30.7% |
|
|
44,783,385 |
|
|
45,620,398 |
|
19.6% |
|
|
91,242,453 |
|
|
92,783,988 |
|
24.0% |
|
Collateralized securities |
|
|
11,039,438 |
|
|
11,044,972 |
|
7.2% |
|
|
- |
|
|
- |
|
- |
|
|
11,039,438 |
|
|
11,044,972 |
|
2.9% |
|
Short term investments(2) |
|
|
11,003,717 |
|
|
11,003,717 |
|
7.2% |
|
|
- |
|
|
- |
|
- |
|
|
11,003,717 |
|
|
11,003,717 |
|
2.8% |
|
Total investments |
|
$ |
151,796,526 |
|
$ |
153,511,647 |
|
100.0% |
|
$ |
230,257,406 |
|
$ |
233,013,948 |
|
100.0% |
|
$ |
382,053,932 |
|
$ |
386,525,595 |
|
100.0% |
|
|
|
|
|
|
|
|
|
|
|
|
|
|
|
|
|
|
|
|
|
|
|
|
|
|
|
Number of portfolio companies |
|
|
|
|
39 |
|
|
|
|
|
|
|
74 |
|
|
|
|
|
|
|
102(3) |
|||
|
Average annual EBITDA of portfolio companies |
|
|
$50.7 million |
|
|
|
|
|
$156.3 million |
|
|
|
|
|
$118.5 million |
|||||||||
|
Median annual EBITDA of portfolio companies |
|
|
$47.7 million |
|
|
|
|
|
$75.0 million |
|
|
|
|
|
$65.7 million |
|||||||||
|
Purchased at a weighted average price of par |
|
|
|
|
98.65% |
|
|
|
|
|
|
|
99.26% |
|
|
|
|
|
|
|
99.03% |
|||
|
Gross annual portfolio yield based upon the purchase price(4) |
|
|
|
|
8.11% |
|
|
|
|
|
|
|
6.61% |
|
|
|
|
|
|
|
7.17% |
|||
|
|
|
|
|
|
|
|
|
|
|
|
|
|
|
|
|
|
|
|
|
|
|
|
|
|
|
(1) Amortized cost represents the original cost adjusted for the amortization of premiums and/or accretion of discounts, as applicable, on our investments. |
|
(2) Short term investments represent an investment in a fund that invests in highly liquid investments with original maturity dates of three months or less. |
|
(3) The sum of investment portfolio and TRS portfolio companies does not equal the total number of portfolio companies. This is due to eleven portfolio companies being in both the investment and TRS portfolios. |
|
(4) The portfolio yield does not represent an actual investment return to shareholders. |
|
(5) The portfolio yield for underlying TRS loans is determined without giving consideration to leverage. |
|
|
|
December 31, 2013 |
||||||||||||||||||||||
|
|
|
Investment Portfolio |
|
Total Return Swap |
|
Total |
||||||||||||||||||
|
|
|
Investments Amortized |
|
Investments Fair |
|
Percentage of |
|
Notional Amount of Underlying TRS Loans |
|
Fair Value of Underlying TRS Loans |
|
Percentage of Underlying TRS Loans |
|
Amortized Cost/ |
|
Fair Value |
|
Percentage |
||||||
|
Senior secured term loans - first lien |
|
$ |
61,095,685 |
|
$ |
61,787,430 |
|
59.1% |
|
$ |
128,420,410 |
|
$ |
129,609,512 |
|
86.6% |
|
$ |
189,516,095 |
|
$ |
191,396,942 |
|
75.3% |
|
Senior secured term loans - second lien |
|
|
22,189,331 |
|
|
22,552,214 |
|
21.6% |
|
|
19,779,527 |
|
|
20,139,042 |
|
13.4% |
|
|
41,968,858 |
|
|
42,691,256 |
|
16.8% |
|
Collateralized securities |
|
|
8,746,000 |
|
|
8,795,600 |
|
8.4% |
|
|
- |
|
|
- |
|
- |
|
|
8,746,000 |
|
|
8,795,600 |
|
3.4% |
|
Short term investments(2) |
|
|
11,383,669 |
|
|
11,383,669 |
|
10.9% |
|
|
- |
|
|
- |
|
- |
|
|
11,383,669 |
|
|
11,383,669 |
|
4.5% |
|
Total investments |
|
$ |
103,414,685 |
|
$ |
104,518,913 |
|
100.0% |
|
$ |
148,199,937 |
|
$ |
149,748,554 |
|
100.0% |
|
$ |
251,614,622 |
|
$ |
254,267,467 |
|
100.0% |
|
|
|
|
|
|
|
|
|
|
|
|
|
|
|
|
|
|
|
|
|
|
|
|
|
|
|
Number of portfolio companies |
|
|
|
|
39 |
|
|
|
|
|
|
|
62 |
|
|
|
|
|
|
|
91(3) |
|||
|
Average annual EBITDA of portfolio companies |
|
|
$50.8 million |
|
|
|
|
|
$157.0 million |
|
|
|
|
|
$120.2 million |
|||||||||
|
Median annual EBITDA of portfolio companies |
|
|
$47.7 million |
|
|
|
|
|
$102.7 million |
|
|
|
|
|
$72.9 million |
|||||||||
|
Purchased at a weighted average price of par |
|
|
|
|
98.57% |
|
|
|
|
|
|
|
99.09% |
|
|
|
|
|
|
|
98.89% |
|||
|
Gross annual portfolio yield based upon the purchase price(4) |
|
|
|
|
7.86% |
|
|
|
|
|
|
|
6.71%(5) |
|
|
|
|
|
|
|
7.15% |
|||
|
|
|
|
|
|
|
|
|
|
|
|
|
|
|
|
|
|
|
|
|
|
|
|
|
|
|
(1) Amortized cost represents the original cost adjusted for the amortization of premiums and/or accretion of discounts, as applicable, on our investments. |
|
(2) Short term investments represent an investment in a fund that invests in highly liquid investments with original maturity dates of three months or less. |
|
(3) The sum of investment portfolio and TRS companies does not equal the total number of portfolio companies. This is due to ten portfolio companies being in both the investment and TRS portfolios. |
|
(4) The portfolio yield does not represent an actual investment return to shareholders. |
|
(5) The portfolio yield for underlying TRS loans is determined without giving consideration to leverage. |
38
The following table summarizes the composition of our investment portfolio and our underlying TRS loans portfolio by the type of interest rate as of March 31, 2014 and December 31, 2013, excluding short term investments of $11,003,717 and $11,383,669, respectively:
|
|
|
|
March 31, 2014 |
||||||||||||||||||||||
|
|
|
|
Investment Portfolio |
|
Total Return Swap |
|
Total |
||||||||||||||||||
|
Interest Rate Allocation |
|
|
Investments Amortized |
|
Investments Fair |
|
Percentage of |
|
Notional Amount of Underlying TRS Loans |
|
Fair Value of Underlying TRS Loans |
|
Percentage of Underlying TRS Loans |
|
Amortized Cost/ |
|
Fair Value |
|
Percentage |
||||||
|
Floating interest rate investments |
|
$ |
140,792,809 |
|
$ |
142,507,930 |
|
100.0% |
|
$ |
230,257,406 |
|
$ |
233,013,948 |
|
100.0% |
|
$ |
371,050,215 |
|
$ |
375,521,878 |
|
100.0% |
|
|
Fixed interest rate investments |
|
|
- |
|
|
- |
|
- |
|
|
- |
|
|
- |
|
- |
|
|
- |
|
|
- |
|
- |
|
|
Total investments |
|
$ |
140,792,809 |
|
$ |
142,507,930 |
|
100.0% |
|
$ |
230,257,406 |
|
$ |
233,013,948 |
|
100.0% |
|
$ |
371,050,215 |
|
$ |
375,521,878 |
|
100.0% |
|
|
|
|
|
December 31, 2013 |
||||||||||||||||||||||
|
|
|
|
Investment Portfolio |
|
Total Return Swap |
|
Total |
||||||||||||||||||
|
Interest Rate Allocation |
|
|
Investments Amortized |
|
Investments Fair |
|
Percentage of |
|
Notional Amount of Underlying TRS Loans |
|
Fair Value of Underlying TRS Loans |
|
Percentage of Underlying TRS Loans |
|
Amortized Cost/ |
|
Fair Value |
|
Percentage |
||||||
|
Floating interest rate investments |
|
$ |
92,031,016 |
|
$ |
93,135,244 |
|
100.0% |
|
$ |
148,199,937 |
|
$ |
149,748,554 |
|
100.0% |
|
$ |
240,230,953 |
|
$ |
242,883,798 |
|
100.0% |
|
|
Fixed interest rate investments |
|
|
- |
|
|
- |
|
- |
|
|
- |
|
|
- |
|
- |
|
|
- |
|
|
- |
|
- |
|
|
Total investments |
|
$ |
92,031,016 |
|
$ |
93,135,244 |
|
100.0% |
|
$ |
148,199,937 |
|
$ |
149,748,554 |
|
100.0% |
|
$ |
240,230,953 |
|
$ |
242,883,798 |
|
100.0% |
|
39
The following table shows the composition of our investment portfolio and our underlying TRS loans portfolio by industry classification and the percentage, by fair value, of the total assets in such industries as of March 31, 2014 and December 31, 2013:
|
|
|
March 31, 2014 |
|||||||||||||
|
|
|
Investment Portfolio |
|
Total Return Swap |
|
Total |
|||||||||
|
Industry Classification |
|
Investments Fair Value |
|
Percentage of |
|
Fair Value of |
|
Percentage of |
|
Fair Value |
|
Percentage |
|||
|
Services: Business |
|
$ |
15,839,696 |
|
10.3% |
|
$ |
34,891,180 |
|
15.0% |
|
$ |
50,730,876 |
|
13.1% |
|
Healthcare & Pharmaceuticals |
|
|
13,973,688 |
|
9.1% |
|
|
35,247,337 |
|
15.1% |
|
|
49,221,025 |
|
12.7% |
|
High Tech Industries |
|
|
15,594,028 |
|
10.2% |
|
|
12,193,447 |
|
5.2% |
|
|
27,787,475 |
|
7.2% |
|
Banking, Finance, Insurance & Real Estate |
|
|
1,440,418 |
|
0.9% |
|
|
25,901,670 |
|
11.1% |
|
|
27,342,088 |
|
7.1% |
|
Retail |
|
|
5,667,188 |
|
3.7% |
|
|
19,624,823 |
|
8.4% |
|
|
25,292,011 |
|
6.5% |
|
Hotel, Gaming & Leisure |
|
|
6,359,950 |
|
4.1% |
|
|
15,573,650 |
|
6.7% |
|
|
21,933,600 |
|
5.7% |
|
Chemicals, Plastics & Rubber |
|
|
6,821,100 |
|
4.4% |
|
|
12,783,068 |
|
5.5% |
|
|
19,604,168 |
|
5.1% |
|
Automotive |
|
|
15,470,635 |
|
10.1% |
|
|
3,161,813 |
|
1.4% |
|
|
18,632,448 |
|
4.8% |
|
Beverage, Food & Tobacco |
|
|
10,068,750 |
|
6.6% |
|
|
8,136,572 |
|
3.5% |
|
|
18,205,322 |
|
4.7% |
|
Consumer Goods: Non-Durable |
|
|
8,908,925 |
|
5.9% |
|
|
8,165,487 |
|
3.5% |
|
|
17,074,412 |
|
4.4% |
|
Aerospace & Defense |
|
|
1,458,319 |
|
0.9% |
|
|
13,218,892 |
|
5.7% |
|
|
14,677,211 |
|
3.8% |
|
Media: Broadcasting & Subscription |
|
|
3,666,384 |
|
2.4% |
|
|
9,559,816 |
|
4.1% |
|
|
13,226,200 |
|
3.4% |
|
Diversified Financials |
|
|
11,044,972 |
|
7.2% |
|
|
- |
|
- |
|
|
11,044,972 |
|
2.9% |
|
Media: Diversified & Production |
|
|
9,513,441 |
|
6.2% |
|
|
1,167,947 |
|
0.5% |
|
|
10,681,388 |
|
2.8% |
|
Construction & Building |
|
|
2,487,453 |
|
1.6% |
|
|
5,993,693 |
|
2.6% |
|
|
8,481,146 |
|
2.2% |
|
Capital Equipment |
|
|
- |
|
- |
|
|
8,030,000 |
|
3.4% |
|
|
8,030,000 |
|
2.1% |
|
Energy: Oil & Gas |
|
|
1,704,933 |
|
1.1% |
|
|
6,243,815 |
|
2.7% |
|
|
7,948,748 |
|
2.1% |
|
Services: Consumer |
|
|
5,592,766 |
|
3.6% |
|
|
1,950,313 |
|
0.8% |
|
|
7,543,079 |
|
2.0% |
|
Containers, Packaging & Glass |
|
|
1,492,500 |
|
1.0% |
|
|
4,461,331 |
|
1.9% |
|
|
5,953,831 |
|
1.5% |
|
Telecommunications |
|
|
3,500,000 |
|
2.3% |
|
|
1,000,000 |
|
0.4% |
|
|
4,500,000 |
|
1.2% |
|
Environmental Industries |
|
|
1,902,784 |
|
1.2% |
|
|
1,740,483 |
|
0.8% |
|
|
3,643,267 |
|
0.9% |
|
Consumer Goods: Durable |
|
|
- |
|
- |
|
|
3,022,500 |
|
1.3% |
|
|
3,022,500 |
|
0.8% |
|
Forest Products & Paper |
|
|
- |
|
- |
|
|
946,111 |
|
0.4% |
|
|
946,111 |
|
0.2% |
|
U.S. Treasury Securities |
|
|
11,003,717 |
|
7.2% |
|
|
- |
|
- |
|
|
11,003,717 |
|
2.8% |
|
Total |
|
$ |
153,511,647 |
|
100.0% |
|
$ |
233,013,948 |
|
100.0% |
|
$ |
386,525,595 |
|
100.0% |
40
|
|
|
December 31, 2013 |
|||||||||||||
|
|
|
Investment Portfolio |
|
Total Return Swap |
|
Total |
|||||||||
|
Industry Classification |
|
Investments Fair Value |
|
Percentage of |
|
Fair Value of |
|
Percentage of |
|
Fair Value |
|
Percentage |
|||
|
Healthcare & Pharmaceuticals |
|
$ |
8,968,804 |
|
8.6% |
|
$ |
28,520,188 |
|
19.0% |
|
$ |
37,488,992 |
|
14.7% |
|
Services: Business |
|
|
15,754,714 |
|
15.1% |
|
|
21,710,669 |
|
14.5% |
|
|
37,465,383 |
|
14.7% |
|
Chemicals, Plastics & Rubber |
|
|
6,797,514 |
|
6.5% |
|
|
12,767,942 |
|
8.5% |
|
|
19,565,456 |
|
7.7% |
|
Consumer Goods: Non-Durable |
|
|
9,527,245 |
|
9.1% |
|
|
8,353,950 |
|
5.7% |
|
|
17,881,195 |
|
7.1% |
|
Banking, Finance, Insurance & Real Estate |
|
|
2,427,410 |
|
2.3% |
|
|
15,399,479 |
|
10.3% |
|
|
17,826,889 |
|
7.0% |
|
Media: Broadcasting & Subscription |
|
|
3,544,422 |
|
3.4% |
|
|
9,713,966 |
|
6.5% |
|
|
13,258,388 |
|
5.2% |
|
Energy: Oil & Gas |
|
|
3,629,300 |
|
3.5% |
|
|
6,286,404 |
|
4.2% |
|
|
9,915,704 |
|
3.9% |
|
Telecommunications |
|
|
3,973,040 |
|
3.8% |
|
|
5,502,732 |
|
3.7% |
|
|
9,475,772 |
|
3.7% |
|
Diversified Financials |
|
|
8,795,600 |
|
8.4% |
|
|
- |
|
- |
|
|
8,795,600 |
|
3.5% |
|
Beverage, Food & Tobacco |
|
|
- |
|
- |
|
|
8,597,752 |
|
5.7% |
|
|
8,597,752 |
|
3.4% |
|
Aerospace & Defense |
|
|
1,463,701 |
|
1.4% |
|
|
6,796,190 |
|
4.5% |
|
|
8,259,891 |
|
3.2% |
|
Services: Consumer |
|
|
5,628,126 |
|
5.3% |
|
|
1,965,000 |
|
1.3% |
|
|
7,593,126 |
|
3.1% |
|
Automotive |
|
|
7,473,560 |
|
7.2% |
|
|
- |
|
- |
|
|
7,473,560 |
|
2.9% |
|
High Tech Industries |
|
|
2,876,400 |
|
2.8% |
|
|
4,353,293 |
|
2.9% |
|
|
7,229,693 |
|
2.8% |
|
Retail |
|
|
- |
|
- |
|
|
6,661,756 |
|
4.4% |
|
|
6,661,756 |
|
2.6% |
|
Containers, Packaging & Glass |
|
|
1,500,000 |
|
1.4% |
|
|
4,488,750 |
|
3.0% |
|
|
5,988,750 |
|
2.4% |
|
Environmental Industries |
|
|
1,909,952 |
|
1.8% |
|
|
3,554,920 |
|
2.4% |
|
|
5,464,872 |
|
2.1% |
|
Hotel, Gaming & Leisure |
|
|
515,000 |
|
0.5% |
|
|
4,336,815 |
|
2.9% |
|
|
4,851,815 |
|
1.9% |
|
Construction & Building |
|
|
3,415,256 |
|
3.3% |
|
|
- |
|
- |
|
|
3,415,256 |
|
1.3% |
|
Capital Equipment |
|
|
3,014,850 |
|
2.9% |
|
|
- |
|
- |
|
|
3,014,850 |
|
1.2% |
|
Media: Diversified & Production |
|
|
1,920,350 |
|
1.8% |
|
|
- |
|
- |
|
|
1,920,350 |
|
0.8% |
|
Forest Products & Paper |
|
|
- |
|
- |
|
|
738,748 |
|
0.5% |
|
|
738,748 |
|
0.3% |
|
U.S. Treasury Securities |
|
|
11,383,669 |
|
10.9% |
|
|
- |
|
- |
|
|
11,383,669 |
|
4.5% |
|
Total |
|
$ |
104,518,913 |
|
100.0% |
|
$ |
149,748,554 |
|
100.0% |
|
$ |
254,267,467 |
|
100.0% |
We do not “control” and are not an “affiliate” of any of our portfolio companies or any of the companies of the loans underlying the TRS, each as defined in the 1940 Act. In general, under the 1940 Act, we would be presumed to “control” a portfolio company or issuer if we owned 25% or more of its voting securities and would be an “affiliate” of a portfolio company or issuer if we owned 5% or more of its voting securities.
Our investment portfolio may contain senior secured investments that are in the form of lines of credit, unfunded delayed drawdown loan commitments, or revolving credit facilities, which require us to provide funding when requested by portfolio companies in accordance with the terms of the underlying loan agreements. As of March 31, 2014 and December 31, 2013, our unfunded loan commitments amounted to $3,054,668 and $2,450,758, respectively.
41
Investment Portfolio Asset Quality
CIM uses an investment rating system to characterize and monitor our expected level of returns on each investment in our portfolio. These ratings are just one of several factors that CIM uses to monitor our portfolio, are not in and of themselves determinative of fair value or revenue recognition and are presented for indicative purposes. CIM grades the credit risk of all investments on a scale of 1 to 5 no less frequently than quarterly. This system is intended primarily to reflect the underlying risk of a portfolio investment relative to our initial cost basis in respect of such portfolio investment (i.e., at the time of acquisition), although it may also take into account under certain circumstances the performance of the portfolio company’s business, the collateral coverage of the investment and other relevant factors.
The following is a description of the conditions associated with each investment rating used in this ratings system:
|
Investment Grade |
Description |
|
1 |
Indicates the least amount of risk to our initial cost basis. The trends and risk factors for this investment since origination or acquisition are generally favorable, which may include the performance of the portfolio company or a potential exit. |
|
2 |
Indicates a level of risk to our initial cost basis that is similar to the risk to our initial cost basis at the time of origination or acquisition. This portfolio company is generally performing in accordance with our analysis of its business and the full return of principal and interest or dividend is expected. |
|
3 |
Indicates that the risk to our ability to recoup the cost of such investment has increased since origination or acquisition, but full return of principal and interest or dividend is expected. A portfolio company with an investment grade of 3 requires closer monitoring. |
|
4 |
Indicates that the risk to our ability to recoup the cost of such investment has increased significantly since origination or acquisition, including as a result of factors such as declining performance and noncompliance with debt covenants, and we expect some loss of interest, dividend or capital appreciation, but still expect an overall positive internal rate of return on the investment. |
|
5 |
Indicates that the risk to our ability to recoup the cost of such investment has increased materially since origination or acquisition and the portfolio company likely has materially declining performance. Loss of interest or dividend and some loss of principal investment is expected, which would result in an overall negative internal rate of return on the investment. |
For investments graded 3, 4, or 5, CIM enhances its level of scrutiny over the monitoring of such portfolio company.
42
The following table summarizes the composition of our investment portfolio and our underlying TRS loans portfolio based on the 1 to 5 investment rating scale at fair value as of March 31, 2014 and December 31, 2013, excluding short term investments of $11,003,717 and $11,383,669, respectively:
|
|
|
March 31, 2014 |
|||||||||||||
|
|
|
Investment Portfolio |
|
Total Return Swap |
|
Total |
|||||||||
|
Investment Rating |
|
Investments |
|
Percentage of |
|
Fair Value of Underlying TRS Loans |
|
Percentage of Underlying TRS Loans |
|
Fair Value |
|
Percentage |
|||
|
1 |
|
$ |
- |
|
- |
|
$ |
- |
|
- |
|
$ |
- |
|
- |
|
2 |
|
|
142,507,930 |
|
100.0% |
|
|
231,273,465 |
|
99.3% |
|
|
373,781,395 |
|
99.5% |
|
3 |
|
|
- |
|
- |
|
|
1,740,483 |
|
0.7% |
|
|
1,740,483 |
|
0.5% |
|
4 |
|
|
- |
|
- |
|
|
- |
|
- |
|
|
- |
|
- |
|
5 |
|
|
- |
|
- |
|
|
- |
|
- |
|
|
- |
|
- |
|
|
|
$ |
142,507,930 |
|
100.0% |
|
$ |
233,013,948 |
|
100.0% |
|
$ |
375,521,878 |
|
100.0% |
|
|
|
December 31, 2013 |
|||||||||||||
|
|
|
Investment Portfolio |
|
Total Return Swap |
|
Total |
|||||||||
|
Investment Rating |
|
Investments |
|
Percentage of |
|
Fair Value of Underlying TRS Loans |
|
Percentage of Underlying TRS Loans |
|
Fair Value |
|
Percentage |
|||
|
1 |
|
$ |
- |
|
- |
|
$ |
- |
|
- |
|
$ |
- |
|
- |
|
2 |
|
|
93,135,244 |
|
100.0% |
|
|
149,748,554 |
|
100.0% |
|
|
242,883,798 |
|
100.0% |
|
3 |
|
|
- |
|
- |
|
|
- |
|
- |
|
|
- |
|
- |
|
4 |
|
|
- |
|
- |
|
|
- |
|
- |
|
|
- |
|
- |
|
5 |
|
|
- |
|
- |
|
|
- |
|
- |
|
|
- |
|
- |
|
|
|
$ |
93,135,244 |
|
100.0% |
|
$ |
149,748,554 |
|
100.0% |
|
$ |
242,883,798 |
|
100.0% |
The amount of the portfolio and underlying TRS loans in each grading category may vary substantially from period to period resulting primarily from changes in the composition of the portfolio as a result of new investment, repayment and exit activities. In addition, changes in the grade of investments may be made to reflect our expectation of performance and changes in investment values.
43
Current Investment Portfolio
As of May 8, 2014, our investment portfolio, excluding our short term investments and TRS, consisted of interests in 41 portfolio companies (46% in first lien senior secured term loans, 37% in second lien senior secured term loans and 17% in collateralized securities) with a total fair value of $171,378,547 with an average and median portfolio company annual EBITDA of $52.9 million and $49.0 million, respectively, at initial investment. As of May 8, 2014, investments in our portfolio were purchased at a weighted average price of 98.20% of par value. Our estimated gross annual portfolio yield was 8.41% based upon the purchase price of our investments. The portfolio yield does not represent an actual investment return to shareholders.
As of May 8, 2014, our short term investments included an investment in a U.S. Treasury Obligations Fund of $19,178,770.
Further, as of May 8, 2014, through a TRS (described further in Note 7 of our consolidated financial statements), we obtained the economic benefit of owning investments in first lien senior secured and second lien senior secured floating-rate loans of 70 portfolio companies.
Results of Operations for the Three Months Ended March 31, 2014 and 2013
Our results of operations for the three months ended March 31, 2014 and 2013 were as follows:
|
|
|
Three Months |
|
Three Months |
|
||
|
|
|
Ended |
|
Ended |
|
||
|
|
|
March 31, 2014 |
|
March 31, 2013 |
|
||
|
|
Investment income |
$ |
2,200,781 |
|
$ |
68,126 |
|
|
|
Net operating expenses |
|
2,450,273 |
|
|
114,810 |
|
|
|
Net investment loss |
(249,492) |
|
|
(46,684) |
|
|
|
|
Net realized gain on investments |
173,714 |
|
|
4,533 |
|
|
|
|
Net change in unrealized appreciation on investments |
610,893 |
|
|
124,282 |
|
|
|
|
Net realized gain on total return swap |
2,963,479 |
|
|
286,337 |
|
|
|
|
Net change in unrealized appreciation on total return swap |
1,207,925 |
|
|
250,676 |
|
|
|
|
Net increase in net assets resulting from operations |
$ |
4,706,519 |
|
$ |
619,144 |
|
Investment Income
For the three months ended March 31, 2014 and 2013, we generated investment income of $2,200,781 and $68,126, respectively, consisting primarily of interest income on investments in senior secured loans of 48 and 11 portfolio companies held during each respective period. During the three months ended March 31, 2014 and 2013, our investment portfolio, excluding short term investments and the TRS, increased approximately $49,373,000 and $6,266,000, respectively, as we continued to deploy the net proceeds from our continuous offering. We expect our investment portfolio to continue to grow due to the anticipated increase in equity available to us for investment from our continuous offering. As a result, we believe that reported investment income for the three months ended March 31, 2014 and 2013 is not representative of our stabilized or future performance. Interest income earned by loans underlying the TRS is not included in investment income in the consolidated statements of operations, but rather it is recorded as part of net realized gain on total return swap.
Operating Expenses
The composition of our operating expenses for the three months ended March 31, 2014 and 2013 was as follows:
|
|
|
Three Months |
|
Three Months |
|
||
|
|
|
Ended |
|
Ended |
|
||
|
|
|
March 31, 2014 |
|
March 31, 2013 |
|
||
|
|
Management fees |
$ |
908,807 |
|
$ |
44,742 |
|
|
|
Administrative services expense |
|
415,395 |
|
|
263,555 |
|
|
|
Capital gains incentive fee |
525,326 |
|
|
117,023 |
|
|
|
|
Offering expense - IIG |
|
591,475 |
|
|
- |
|
|
|
General and administrative |
|
1,058,128 |
|
|
508,863 |
|
|
|
Total expenses |
3,499,131 |
|
|
934,183 |
|
|
|
|
Less: expense reimbursement from IIG |
(1,048,858) |
|
|
(819,373) |
|
|
|
|
Net operating expenses |
$ |
2,450,273 |
|
$ |
114,810 |
|
44
The composition of our general and administrative expenses for the three months ended March 31, 2014 and 2013 was as follows:
|
|
|
Three Months |
|
Three Months |
|
||
|
|
|
Ended |
|
Ended |
|
||
|
|
|
March 31, 2014 |
|
March 31, 2013 |
|
||
|
|
Due diligence fees |
$ |
322,987 |
|
$ |
39,018 |
|
|
|
Professional fees expense |
|
287,007 |
|
|
240,569 |
|
|
|
Transfer agent expense |
116,345 |
|
13,602 |
|
||
|
|
Marketing expense |
87,760 |
|
86,640 |
|
||
|
|
Insurance expense |
51,858 |
|
52,901 |
|
||
|
|
Printing and mailing expense |
33,138 |
|
24,888 |
|
||
|
|
Director fees and expenses |
32,289 |
|
7,839 |
|
||
|
|
Dues and subscriptions |
21,410 |
|
10,933 |
|
||
|
|
Filing fees |
5,651 |
|
6,100 |
|
||
|
|
Other expenses |
99,683 |
|
26,373 |
|
||
|
|
Total general and administrative expense |
$ |
1,058,128 |
|
$ |
508,863 |
|
Expense Reimbursement
Our affiliate, IIG, has agreed to reimburse us commencing with the quarter ended December 31, 2012 for certain expenses pursuant to the expense support and conditional reimbursement agreement. Refer to the discussion under “Related Party Transactions” below for further details about the expense support and conditional reimbursement agreement. Also, see Note 4 to our consolidated financial statements for additional disclosure regarding the expense reimbursements from IIG.
For the three months ended March 31, 2014 and 2013, we recorded $1,048,858 and $819,373 of expense reimbursement from IIG in connection with the expense support and conditional reimbursement agreement, respectively. As of March 31, 2014 and 2013, all expense reimbursements made by IIG are eligible to be reimbursed by us through March 31, 2017 and 2016, respectively.
Reimbursement of such costs will be determined as appropriate to meet the objectives of the expense support and conditional reimbursement agreement. As a result, we may or may not be requested to reimburse any further costs by IIG.
The table below presents a summary of all expenses supported by IIG and the associated dates through which such expenses are eligible for reimbursement by us for the following three month periods.
|
Three Months Ended |
|
|
Expense Support Received from IIG |
|
Expense Support Reimbursed to IIG |
|
Unreimbursed Expense Support |
|
Ratio of Operating Expense to Average Net Assets for the Period(1) |
|
Annualized Distribution Rate for the Period(3) |
|
Eligible for Reimbursement through |
|||
|
December 31, 2012 |
|
$ |
116,706 |
|
$ |
- |
|
$ |
116,706 |
|
0.93% |
|
0.00%(2) |
|
December 31, 2015 |
|
|
March 31, 2013 |
|
|
819,373 |
|
|
- |
|
|
819,373 |
|
2.75% |
|
7.00% |
|
March 31, 2016 |
|
|
June 30, 2013 |
|
|
1,147,536 |
|
|
- |
|
|
1,147,536 |
|
1.43% |
|
7.00% |
|
June 30, 2016 |
|
|
September 30, 2013 |
|
|
1,296,834 |
|
|
- |
|
|
1,296,834 |
|
0.49% |
|
7.00% |
|
September 30, 2016 |
|
|
December 31, 2013 |
|
|
695,160 |
|
|
- |
|
|
695,160 |
|
0.31% |
|
7.00% |
|
December 31, 2016 |
|
|
March 31, 2014 |
|
|
1,048,858 |
|
|
- |
|
|
1,048,858 |
|
0.52% |
|
7.00% |
|
March 31, 2017 |
|
|
Total |
|
$ |
5,124,467 |
|
$ |
- |
|
$ |
5,124,467 |
|
|
|
|
|
|
|
|
|
|
|
|
|
|
|
|
|
|
|
|
|
|
|
|
|
|
(1) |
Operating expenses include all expenses borne by us, except for organization costs and offering expenses, base management fees, incentive fees, administrative services expenses and other general and administrative expenses owed to CIM and its affiliates and interest expense. |
|
(2) |
We did not declare any distributions during the three months ended December 31, 2012. |
|
(3) |
Annualized Distribution Rate equals the annualized rate of distributions paid to shareholders based on the amount of the regular cash distributions paid immediately prior to the date the expense support payment obligation was incurred by CIM. Annualized Distribution Rate does not include special cash or stock distributions paid to shareholders. |
45
Pursuant to the expense support and conditional reimbursement agreement, we will have a conditional obligation to reimburse IIG for any amounts funded by IIG under such agreement (i) if expense reimbursement amounts funded by IIG exceed operating expenses incurred during any fiscal quarter, (ii) if the sum of our net investment income for tax purposes, net capital gains and the amount of any dividends and other distributions paid to us on account of investments in portfolio companies (to the extent not included in net investment income or net capital gains for tax purposes) exceeds the distributions paid by us to shareholders, and (iii) during any fiscal quarter occurring within three years of the date on which IIG funded such amount.
Net Investment Loss
Our net investment loss totaled ($249,492) and ($46,684) for the three months ended March 31, 2014 and 2013, respectively. The increase in net investment loss during the first quarter of 2014, compared to the corresponding 2013 period, was primarily due to an increase in higher operating expenses due to our accelerated growth, partially offset by an increase in investment income and expense support from IIG.
Net Realized Gain on Investments
Our net realized gain on investments totaled $173,714 and $4,533 for the three months ended March 31, 2014 and 2013, respectively. During the first quarter of 2014, we received sale proceeds and principal repayments of $13,165,845 and $5,289,381, respectively, for gains of $123,423 and $50,291, respectively. For the corresponding 2013 period, net realized gain on investments was primarily due to the sale of one investment, from which we received sale proceeds of $504,375, for a gain of $4,375.
Net Change in Unrealized Appreciation on Investments
The net change in unrealized appreciation on our investments totaled $610,893 and $124,282 for the three months ended March 31, 2014 and 2013, respectively. This change was predominantly driven by primary investments, sourced with the assistance of AIM, made available to us at advantageous purchase prices, as well as the growth and increase in fair value of the investments in our investment portfolio.
Net Realized Gain on TRS
Our net realized gain on the TRS totaled $2,963,479 and $286,337 for the three months ended March 31, 2014 and 2013, respectively. The realized gain was due to interest income and fees, net of expenses, of $2,360,371 and $80,612, respectively, as well as realized gain on sales and principal repayments of $603,108 and $205,725, respectively, for the same comparative periods. The components of net realized gain on TRS are summarized below for the three months ended March 31, 2014 and 2013:
|
|
|
|
March 31, 2014 |
|
|
March 31, 2013 |
|
||
|
|
Interest and other income from TRS portfolio |
|
$ |
3,073,966 |
|
|
$ |
105,447 |
|
|
|
Interest and other expense from TRS portfolio |
|
|
(713,595) |
|
|
|
(24,835) |
|
|
|
Net gain on TRS loan sales |
|
|
603,108 |
|
|
|
205,725 |
|
|
|
Total |
|
$ |
2,963,479 |
|
|
$ |
286,337 |
|
Net Change in Unrealized Appreciation on TRS
The net change in unrealized appreciation on the TRS totaled $1,207,925 and $250,676 for the three months ended March 31, 2014 and 2013, respectively. This change was primarily due to the growth and increase in fair value of the underlying loans subject to the TRS.
Net Increase in Net Assets Resulting from Operations
For the three months ended March 31, 2014 and 2013, we recorded a net increase in net assets resulting from operations of $4,706,519 and $619,144, respectively.
46
Net Asset Value per Share, Annual Investment Return and Total Return Since Inception
Our net asset value per share was $9.40 and $9.32 on March 31, 2014 and December 31, 2013, respectively. After considering (i) the overall changes in net asset value per share, (ii) paid distributions of approximately $0.1679 per share during the three months ended March 31, 2014, and (iii) the assumed reinvestment of those distributions at 90% of the prevailing offering price per share, the total investment return was 2.63% for shareholders who held our shares over the entire three-month period ending March 31, 2014.
Initial shareholders who subscribed to the offering in December 2012 with an initial investment of $10,000 and an initial purchase price equal to $9.00 per share (public offering price net of sales load) have seen an annualized return of 11.12% and the value of their investment grow by 14.54% (see chart below). Initial shareholders who subscribed to the offering in December 2012 with an initial investment of $10,000 and an initial purchase price equal to $10.00 per share (the initial public offering price) have seen an annualized return of 2.39% and the value of their investment grow by 3.08%. Over the same time period the S&P/LSTA Leverage Loan Index, a primary measure of senior debt covering the U.S. leveraged loan market, which currently consists of approximately 1,000 credit facilities throughout numerous industries, had an annualized return of approximately 5.69% and a total return of approximately 7.39%.
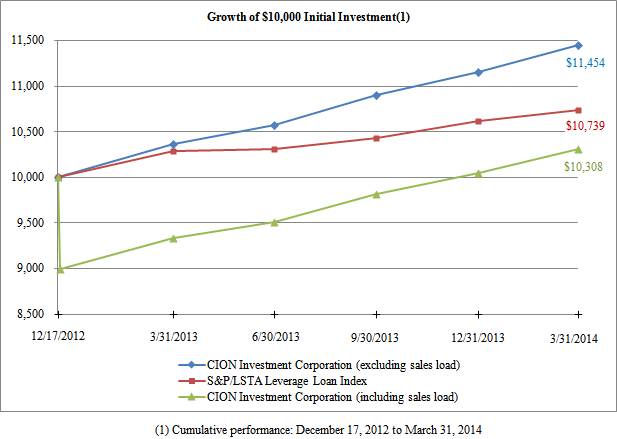
The calculations for the Growth of $10,000 Initial Investment are based upon (i) an initial investment of $10,000 in our common stock at the beginning of the period, at a share price of $10.00 per share (including sales load) and $9.00 per share (excluding sales load), (ii) assumes reinvestment of monthly distributions in accordance with our second amended and restated distribution reinvestment plan, (iii) the sale of the entire investment position at the net asset value per share on the last day of the period, and (iv) the cash payment for distributions payable to shareholders, if any, on the last day of the period.
47
Financial Condition, Liquidity and Capital Resources
We generate cash primarily from the net proceeds of our continuous public offering and from cash flows from fees, interest and dividends earned from our investments as well as principal repayments and proceeds from sales of our investments. We are engaged in a continuous offering of shares of our common stock. We accept subscriptions on a continuous basis and, as of February 1, 2014, issue shares at weekly closings at prices that, after deducting selling commissions and dealer manager fees, are at or above our net asset value per share.
We will sell our shares on a continuous basis at our latest public offering price of $10.45 per share; however, to the extent that our net asset value increases, we will sell at a price necessary to ensure that shares are not sold at a price, after deduction of selling commissions and dealer manager fees, that is below net asset value. In the event of a material decline in our net asset value per share, which we consider to be a 2.5% decrease below our current net offering price, and subject to certain conditions, we will reduce our offering price accordingly. Therefore, persons who tender subscriptions for shares of our common stock in the offering must submit subscriptions for a certain dollar amount, rather than a number of shares of common stock and, as a result, may receive fractional shares of our common stock. In connection with each weekly closing on the sale of shares of our common stock, our board of directors has delegated to management the authority to conduct such closings so long as there is no change to our public offering price. In the event of a change to our public offering price in connection with any weekly closing, our board of directors will approve the change prior to management conducting such closing. In connection with each weekly closing, we will, in each case if necessary, update the information contained in our prospectus by filing a prospectus supplement with the SEC, and we will also post any updated information to our website.
As of March 31, 2014, we sold 23,991,865 shares for gross proceeds of $244,390,076 at an average price per share of $10.19. The gross proceeds received include reinvested shareholder distributions of $3,876,967, for which we issued 411,716 shares of common stock. Since commencing our continuous public offering on July 2, 2012 and through March 31, 2014, sales commissions and dealer manager fees related to the sale of our common stock were $14,522,659 and $6,942,150, respectively.
As of May 8, 2014, we sold 28,211,914 shares of common stock for net proceeds of $287,721,756 at an average price per share of $10.20. The net proceeds include gross proceeds received from reinvested shareholder distributions of $4,847,114, for which we issued 514,868 shares of common stock and gross proceeds paid for shares of common stock tendered for repurchase of $45,905, for which we repurchased 4,881 shares of common stock. Since commencing our continuous public offering on July 2, 2012 and through May 8, 2014, sales commissions and dealer manager fees related to the sale of our common stock were $16,934,881 and $8,177,216, respectively.
On April 2, 2014, we completed our first tender offer in connection with our share repurchase program and repurchased 4,880.906 shares (representing 100% of the shares of common stock tendered for repurchase) at $9.405 per share for aggregate consideration totaling $45,906.
The net proceeds from our continuous offering will be invested primarily in cash, cash equivalents, U.S. government securities, repurchase agreements and high-quality debt instruments maturing in one year or less prior to being invested in debt securities of private U.S. companies.
As of March 31, 2014 and December 31, 2013, we had $11,003,717 and $11,383,669 in short term investments, respectively, invested in a fund that primarily invested in U.S. government securities.
Total Return Swap
For a detailed discussion of our TRS, refer to Note 7 of our consolidated financial statements included in this report.
RIC Status and Distributions
For a detailed discussion of our RIC status and distributions, refer to Note 2 and Note 5, respectively, of our consolidated financial statements included in this report.
Recent Accounting Pronouncements
We do not believe any recently issued, but not yet effective, accounting pronouncements, if currently adopted, would have a material adverse effect on our consolidated financial statements.
Critical Accounting Policies
For a detailed discussion of our critical accounting policies, refer to “Item 7. Management’s Discussion and Analysis of Financial Condition and Results of Operations – Critical Accounting Policies” included in our Annual Report on Form 10-K for the year ended December 31, 2013. We consider these accounting policies critical because they involve management judgments and assumptions, require estimates about matters that are inherently uncertain and because they are important for understanding and evaluating our reported financial results. These judgments will affect the reported amounts of assets and liabilities and our disclosure of contingent assets and liabilities at the dates of the financial statements and the reported amounts of revenue and expenses during the reporting periods. With different estimates or assumptions, materially different amounts could be reported in our financial statements.
48
Related Party Transactions
We have entered into an agreement with CIM to provide us with investment advisory services. Payments for investment advisory services under the investment advisory agreement are equal to (a) an annual base management fee of 2.0% of the average value of our gross assets, excluding cash and cash equivalents, and (b) an incentive fee based on our performance, as described below. ICON Capital is, and to the extent requested to provide such services and such services are so provided, CIM and AIM and their respective affiliates may be, reimbursed for administrative expenses incurred on our behalf.
The incentive fee consists of two parts. The first part, which we refer to as the subordinated incentive fee on income, is calculated and payable quarterly in arrears based upon our “pre-incentive fee net investment income” for the immediately preceding quarter and is subject to a hurdle rate, measured quarterly and expressed as a rate of return on adjusted capital, as defined in our investment advisory agreement, equal to 1.875% per quarter, or an annualized rate of 7.5%. The second part of the incentive fee, which we refer to as the incentive fee on capital gains, is an incentive fee on capital gains earned on liquidated investments from the portfolio and is determined and payable in arrears as of the end of each calendar year (or upon termination of the investment advisory agreement). This fee is equal 20% of our realized capital gains on a cumulative basis from inception, calculated as of the end of each calendar year, computed net of all realized capital losses and unrealized capital depreciation on a cumulative basis, less the aggregate amount of any previously paid capital gains incentive fees. On a cumulative basis and to the extent that all realized capital losses and unrealized capital depreciation exceeds realized capital gains as well as the aggregate realized net capital gains for which a fee has previously been paid, we would not be required to pay CIM a capital gains incentive fee.
We and CIM have engaged AIM to act as our investment sub-adviser, as AIM possesses skills that we believe will aid us in achieving our investment objective. AIM only assists CIM with identifying investment opportunities and making investment recommendations for approval by CIM according to pre-established investment guidelines. On an annualized basis, AIM receives 50% of the fees payable to CIM under the investment advisory agreement with respect to each year, which fees are paid to AIM quarterly in arrears by CIM.
49
ICON Capital provides us with accounting, investor relations and other administrative services. We entered into an administration agreement with ICON Capital pursuant to which ICON Capital furnishes us with administrative services necessary to conduct our day-to-day operations. ICON Capital is reimbursed for administrative expenses it incurs on our behalf in performing its obligations. Such costs will be reasonably allocated to us on the basis of assets, revenues, time records or other reasonable methods. We will not reimburse ICON Capital for any services for which it receives a separate fee or for rent, depreciation, utilities, capital equipment or other administrative items allocated to a person with a controlling interest in ICON Capital. For the three months ended March 31, 2014 and 2013, we incurred administrative services expenses to ICON Capital of $415,395 and $263,555, respectively, the majority of which related to the allocation of costs of administrative personnel for services rendered to us and the remainder related to other reimbursable expenses. During these periods, all or a portion of administrative expenses were reimbursed by IIG in accordance with the expense support and conditional reimbursement agreement.
Our payment of organization costs and offering expenses will not exceed 1.5% of the actual gross proceeds raised from our offering (without giving effect to any potential reimbursements from IIG and its affiliates). If we sell the maximum number of shares at $10.45 per share, we estimate that we may incur up to approximately $15,675,000 of expenses. Under the terms of the investment advisory agreement, CIM and certain of its affiliates, which includes IIG, are entitled to receive reimbursement of up to 1.5% of the gross proceeds raised until all organization costs and offering expenses have been reimbursed. Previously, we interpreted “raised” to mean all gross proceeds that we expected to raise through the completion of the offering of our shares, which could be as late as December 31, 2015, rather than actual gross proceeds raised through the date of reimbursement. Consistent with such application and since we believed we would raise at least $100 million through the completion of the offering of our shares, upon commencement of operations on December 17, 2012, we issued 111,111 shares of our common stock at $9.00 per share to IIG in lieu of payment of $1,000,000 for organization costs and offering expenses submitted for reimbursement. The transactions satisfied an independent obligation of IIG to invest $1,000,000 in our shares. Through that date, we had raised gross proceeds from unaffiliated outside investors of $2,639,439 and from affiliated investors of $2,000,000, which, applying 1.5% of actual proceeds raised through the date of reimbursement, would have resulted in CIM being entitled to $69,592.
As of March 31, 2014, we raised gross proceeds of $244,390,076, of which we can pay up to $3,665,851 in organization costs and offering expenses (which represents 1.5% of the actual gross proceeds raised). Through March 31, 2014, we paid $3,061,183 of such costs and expenses, leaving an additional $604,668 that can be paid, of which $591,475 was submitted for reimbursement by IIG during the quarter. As of May 8, 2014, we raised gross proceeds of $287,721,756, of which we can pay up to $4,315,826 in organization costs and offering expenses (which represents 1.5% of the actual gross proceeds raised). Through May 8, 2014, we paid $3,410,105 of such costs and expenses, leaving an additional $905,721 that can be paid.
With respect to any future reimbursements for organization costs and offering expenses, we will interpret the 1.5% limit based on actual gross proceeds raised at the time of such reimbursement. In addition, we will not issue any of our shares or other securities for services or for property other than cash or securities except as a dividend or distribution to our security holders or in connection with a reorganization. Consistent with this interpretation, on May 30, 2013, IIG paid us $1,000,000, plus interest accrued at a rate of 7% per year.
From inception through March 31, 2014, IIG and its affiliates incurred organization costs and offering expenses of approximately $2,012,000, of which $1,591,475 has been submitted to us for reimbursement, and of which we paid $450,000 in October 2013 and $550,000 in March 2014. No additional material organization costs or offering expenses have been incurred by IIG or its affiliates subsequent to March 31, 2014. The decision to fund our organization costs and offering expenses and the decision to seek reimbursement for such costs is solely at the discretion of IIG and its affiliates. As a result, we may or may not be requested to reimburse any costs funded by IIG and its affiliates.
On January 30, 2013, we entered into the expense support and conditional reimbursement agreement with IIG, whereby IIG agreed to reimburse us for expenses in an amount that is sufficient to: (1) ensure that no portion of our distributions to shareholders will be paid from our offering proceeds or borrowings, and/or (2) reduce our operating expenses until we have achieved economies of scale sufficient to ensure that we bear a reasonable level of expense in relation to our investment income. Pursuant to the expense support and conditional reimbursement agreement, we have a conditional obligation to reimburse IIG for any amounts funded by IIG under such agreement if, during any fiscal quarter occurring within three years of the date on which IIG funded such amount, the sum of our net investment income for tax purposes, net capital gains and the amount of any dividends and other distributions paid to us on account of investments in portfolio companies (to the extent not included in net investment income or net capital gains for tax purposes) exceeds the distributions paid by us to shareholders. For the three months ended March 31, 2014, we recorded $1,048,858 of expense reimbursement from IIG in connection with the expense support and conditional reimbursement agreement.
On December 13, 2013, we and IIG amended and restated the expense support and conditional reimbursement agreement to extend the termination date of such agreement from January 30, 2014 to January 30, 2015.
During the three months ended March 31, 2014, net expense reimbursements of $1,284,068 due from IIG were offset on our consolidated balance sheets against amounts due to affiliates of IIG for management fees, a portion of administrative services expense, a portion of incentive fees, and certain general and administrative expenses paid by IIG on our behalf. As of March 31, 2014, the net payable due to IIG for such fees and expenses was $378,803.
Refer to the table under “Results of Operations for the Three Months Ended March 31, 2014 and 2013—Expense Reimbursements” above for a summary of all expenses supported by IIG and the associated dates through which such expenses are eligible for reimbursement by us.
50
Pursuant to the expense support and conditional reimbursement agreement, we will have a conditional obligation to reimburse IIG for any amounts funded by IIG under such agreement (i) if expense reimbursement amounts funded by IIG exceed operating expenses incurred during any fiscal quarter, (ii) if the sum of our net investment income for tax purposes, net capital gains and the amount of any dividends and other distributions paid to us on account of investments in portfolio companies (to the extent not included in net investment income or net capital gains for tax purposes) exceeds the distributions paid by us to shareholders, and (iii) during any fiscal quarter occurring within three years of the date on which IIG funded such amount.
Reimbursement of such costs will be determined as appropriate to meet the objectives of the expense support and conditional reimbursement agreement. As a result, we may or may not be requested to reimburse any such costs funded by IIG.
We or IIG may terminate the expense support and conditional reimbursement agreement at any time. IIG has indicated that it expects to continue such reimbursements until it deems that we have achieved economies of scale sufficient to ensure that we bear a reasonable level of expenses in relation to our income. If we terminate the investment advisory agreement with CIM, we may be required to repay IIG all reimbursements funded by IIG within three years of the date of termination. The specific amount of expenses reimbursed by IIG, if any, will be determined at the end of each quarter. There can be no assurance that the expense support and conditional reimbursement agreement will remain in effect or that IIG will reimburse any portion of our expenses in future quarters.
The investment advisory agreement, the investment sub-advisory agreement, the administration agreement and the dealer manager agreement each provide certain indemnifications from us to the other relevant parties to such agreements. Our maximum exposure under these agreements is unknown. However, we have not experienced claims or losses pursuant to these agreements and believe the risk of loss related to such indemnifications to be remote.
If any of our contractual obligations discussed above are terminated, our costs may increase under any new agreements that we enter into as replacements. We would also likely incur expenses in locating alternative parties to provide the services that we expect to receive pursuant to our investment advisory agreement, the investment sub-advisory agreement, the administration agreement and the dealer manager agreement. Any new investment advisory agreement would also be subject to approval by our shareholders.
Contractual Obligations
On December 17, 2012, Flatiron entered into a TRS with Citibank. Flatiron and Citibank amended the TRS, effective December 9, 2013, February 18, 2014 and April 30, 2014. See Note 7 to our consolidated financial statements for a more detailed description of the TRS.
Commitments and Contingencies and Off-Balance Sheet Arrangements
Commitments and Contingencies
We have entered into certain contracts with other parties that contain a variety of indemnifications. Our maximum exposure under these arrangements is unknown. However, we have not experienced claims or losses pursuant to these contracts and believe the risk of loss related to such indemnifications to be remote.
Our investment portfolio may contain debt investments that are in the form of lines of credit, unfunded delayed drawdown loan commitments, or revolving credit facilities, which requires us to provide funding when requested by portfolio companies in accordance with the terms of the underlying loan agreements. As of March 31, 2014 and December 31, 2013, unfunded loan commitments amounted to $3,054,668 and $2,450,758, respectively. For the specific portfolio companies which we are committed to fund additional amounts as of March 31, 2014 and December 31, 2013, refer to the consolidated schedule of investments included in this report.
Off-Balance Sheet Arrangements
We currently have no off-balance sheet arrangements.
Item 3. Quantitative and Qualitative Disclosures About Market Risk
We are subject to financial market risks, including changes in interest rates. As of March 31, 2014, 100% of our portfolio investments and underlying loans subject to the TRS paid variable interest rates, except for our short term investments, which are invested in U.S. Treasury securities and repurchase agreements and have fixed rates. A rise in the general level of interest rates can be expected to lead to higher interest rates applicable to our debt investments, especially to the extent that we hold variable rate investments, and to declines in the value of any fixed rate investments we may hold. To the extent that a majority of our investments may be in variable rate investments, an increase in interest rates could make it easier for us to meet or exceed our incentive fee preferred return, as defined in our investment advisory agreement, and may result in a substantial increase in our net investment income, and also to the amount of incentive fees payable to CIM with respect to our pre-incentive fee net investment income.
51
Under the terms of the TRS with Citibank, we pay fees to Citibank at a floating rate based on LIBOR (and some cases prime rate) in exchange for the right to receive the economic benefit of a pool of loans. In addition, in the future we may seek to borrow funds in order to make additional investments. Our net investment income will depend, in part, upon the difference between the rate at which we borrow funds and the rate at which we invest those funds. As a result, we would be subject to risks relating to changes in market interest rates. In periods of rising interest rates when we have debt outstanding, our cost of funds would increase, which could reduce our net investment income, especially to the extent we hold fixed rate investments. We expect that our long-term investments will be financed primarily with equity and long-term debt. Our interest rate risk management techniques may include various interest rate hedging activities to the extent permitted by the 1940 Act. Adverse developments resulting from changes in interest rates could have a materially adverse effect on our business, financial condition and results of operations.
The following table shows the effect over a twelve month period of changes in interest rates on our net interest income, excluding short term investments, assuming no changes in our investment portfolio and TRS Agreement in effect as of March 31, 2014:
|
|
Change in Interest Rates |
|
|
Increase (Decrease) in Net Interest Income(1) |
|
Percentage Change in Net Interest Income |
|
|
|
|
Down 32 basis points |
|
$ |
741,693 |
3.4% |
|
||
|
|
Current base interest rate |
|
|
- |
- |
|
||
|
|
Up 100 basis points |
|
|
(1,358,998) |
(6.1%) |
|
||
|
|
Up 200 basis points |
|
|
(123,462) |
(0.6%) |
|
||
|
|
Up 300 basis points |
|
|
1,142,827 |
5.2% |
|
||
|
|
|
|
|
|
|
|
|
|
|
|
(1) Includes the net effect of the change in interest rates on the unrealized appreciation (depreciation) on the TRS. Pursuant to the TRS, we receive from Citibank all interest payable in respect of the loans subject to the TRS and pay to Citibank interest at a rate equal to the floating rate index specified for each loan (typically LIBOR of varying maturities) plus 1.35% per year on the full notional amount of the loans subject to the TRS. As of March 31, 2014, all of the loans subject to the TRS paid variable interest rates. This table assumes no change in defaults or prepayments by portfolio companies over the next twelve months. |
|
||||||
In addition, we may have risk regarding portfolio valuation as discussed in Note 2 to our consolidated financial statements included in this Quarterly Report on Form 10-Q.
Item 4. Controls and
Procedures
Evaluation of disclosure controls and procedures
In connection with the preparation of this Quarterly Report on Form 10-Q for the three months ended March 31, 2014, we carried out an evaluation, under the supervision and with the participation of our management, including our Co-Chief Executive Officers and our Chief Financial Officer, of the effectiveness of the design and operation of our disclosure controls and procedures as of the end of the period covered by this report pursuant to Rule 13a-15(b) and Rule 15d-15(b) of the Securities Exchange Act of 1934, as amended. Based on the foregoing evaluation, the Co-Chief Executive Officers and the Chief Financial Officer concluded that our disclosure controls and procedures were effective.
In designing and evaluating our disclosure controls and procedures, we recognized that disclosure controls and procedures, no matter how well conceived and operated, can provide only reasonable, not absolute, assurance that the objectives of the disclosure controls and procedures are met. Our disclosure controls and procedures have been designed to meet reasonable assurance standards. Disclosure controls and procedures cannot detect or prevent all error and fraud. Some inherent limitations in disclosure controls and procedures include costs of implementation, faulty decision-making, simple error and mistake. Additionally, controls can be circumvented by the individual acts of some persons, by collusion of two or more people, or by management override of the controls. The design of any system of controls is based, in part, upon certain assumptions about the likelihood of future events, and there can be no assurance that any design will succeed in achieving its stated goals under all anticipated and unanticipated future conditions. Over time, controls may become inadequate because of changes in conditions, or the degree of compliance with established policies or procedures.
Evaluation of internal control over financial reporting
There have been no changes in our internal control over financial reporting during the three months ended March 31, 2014 that have materially affected, or are reasonably likely to materially affect, our internal control over financial reporting.
52
PART II - OTHER INFORMATION
We are not currently subject to any material legal proceedings, nor, to our knowledge, is any material legal proceeding threatened against us. From time to time, we may be party to certain legal proceedings in the ordinary course of business, including proceedings relating to the enforcement of our rights under contracts with our portfolio companies and other third parties. While the outcome of these legal proceedings cannot be predicted with certainty, we do not expect that any such proceedings will have a material effect upon our financial condition or results of operations.
Item 1A. Risk Factors
There have been no material changes from the risk factors disclosed in “Item 1A. Risk Factors” of our Annual Report on Form 10-K for the year ended December 31, 2013.
Item 2. Unregistered Sales of Equity Securities and Use of Proceeds
Our registration statement on Form N-2, as amended, was declared effective by the SEC on July 2, 2012 (SEC File No. 333-178646). Our offering period commenced on July 2, 2012.
We did not engage in any unregistered sales of equity securities during the three months ended March 31, 2014. We did not repurchase any shares of our common stock pursuant to our share repurchase program during the three months ended March 31, 2014.
Item 3. Defaults Upon Senior Securities
Not applicable.
Item 4. Mine Safety Disclosures
Not applicable.
Item 5. Other Information
Not applicable.
53
Item 6. Exhibits
|
Exhibit |
|
Description of Document |
|
3.1 |
|
Articles of Amendment and Restatement of the Articles of Incorporation of CĪON Investment Corporation (Incorporated by reference to Exhibit (A)(2) to Pre-Effective Amendment No. 4 to Registrant’s Registration Statement on Form N-2 filed with the SEC on June 29, 2012 (File No. 333-178646)). |
|
3.2 |
|
Second Articles of Amendment and Restatement of the Articles of Incorporation of CĪON Investment Corporation (Incorporated by reference to Exhibit 3.1 to Registrant’s Current Report on Form 8-K filed with the SEC on August 27, 2012 (File No. 814-00941)). |
|
3.3 |
|
Bylaws of CĪON Investment Corporation (Incorporated by reference to Exhibit (B) to Pre-Effective Amendment No. 4 to Registrant’s Registration Statement on Form N-2 filed with the SEC on June 29, 2012 (File No. 333-178646)). |
|
4.1 |
|
Form of Subscription Agreement (Incorporated by reference to Exhibit (D) to Post-Effective Amendment No. 7 to Registrant’s Registration Statement on Form N-2 filed with the SEC on April 28, 2014 (File No. 333-178646)). |
|
4.2 |
|
Second Amended and Restated Distribution Reinvestment Plan (Incorporated by reference to Exhibit 4.1 to Registrant’s Current Report on Form 8-K filed with the SEC on December 16, 2013 (File No. 814-00941)). |
|
10.1 |
|
Investment Advisory Agreement by and between CĪON Investment Corporation and CĪON Investment Management, LLC (Incorporated by reference to Exhibit (G)(1) to Pre-Effective Amendment No. 4 to Registrant’s Registration Statement on Form N-2 filed with the SEC on June 29, 2012 (File No. 333-178646)). |
|
10.2
|
|
Investment Sub-Advisory Agreement by and among CĪON Investment Management, LLC, CĪON Investment Corporation and Apollo Investment Management, L.P. (Incorporated by reference to Exhibit (G)(2) to Pre-Effective Amendment No. 4 to Registrant’s Registration Statement on Form N-2 filed with the SEC on June 29, 2012 (File No. 333-178646)). |
|
10.3 |
|
Administration Agreement by and between CĪON Investment Corporation and ICON Capital Corp. (Incorporated by reference to Exhibit (K)(2) to Pre-Effective Amendment No. 4 to Registrant’s Registration Statement on Form N-2 filed with the SEC on June 29, 2012 (File No. 333-178646)). |
|
10.4 |
|
Custody Agreement by and between CĪON Investment Corporation and U.S. Bank National Association (Incorporated by reference to Exhibit (J) to Pre-Effective Amendment No. 4 to Registrant’s Registration Statement on Form N-2 filed with the SEC on June 29, 2012 (File No. 333-178646)). |
|
10.5 |
|
Escrow Agreement by and among CĪON Investment Corporation, UMB Bank, N.A., and ICON Securities Corp. (Incorporated by reference to Exhibit (K)(1) to Pre-Effective Amendment No. 4 to Registrant’s Registration Statement on Form N-2 filed with the SEC on June 29, 2012 (File No. 333-178646)). |
|
10.6 |
|
Dealer Manager Agreement by and among CĪON Investment Corporation, CĪON Investment Management, LLC, and ICON Securities Corp. (Incorporated by reference to Exhibit (H)(1) to Pre-Effective Amendment No. 4 to Registrant’s Registration Statement on Form N-2 filed with the SEC on June 29, 2012 (File No. 333-178646)). |
|
10.7 |
|
ISDA 2002 Master Agreement, together with the Schedule thereto and Credit Support Annex to such Schedule, each dated as of December 17, 2012, by and between Flatiron Funding, LLC and Citibank, N.A. (Incorporated by reference to Exhibit 10.1 to the Registrant’s Current Report on Form 8-K filed with the SEC on December 19, 2012). |
|
10.8 |
|
Third Amended and Restated Confirmation Letter Agreement, dated as of April 30, 2014, by and between Flatiron Funding, LLC and Citibank, N.A. (Incorporated by reference to Exhibit 10.1 to the Registrant’s Current Report on Form 8-K filed with the SEC on May 5, 2014). |
|
10.9 |
|
Amended and Restated Expense Support and Conditional Reimbursement Agreement dated as of December 13, 2013, by and between CĪON Investment Corporation and ICON Investment Group, LLC (Incorporated by reference to Exhibit (K)(5) to Post-Effective Amendment No. 5 to Registrant’s Registration Statement on Form N-2 filed with the SEC on December 20, 2013 (File No. 333-178646)). |
54
|
Exhibit |
|
Description of Document |
|
|
|
|
|
31.1 |
|
Rule 13a-14(a)/15d-14(a) Certification of Co-Chief Executive Officer. |
|
31.2 |
|
Rule 13a-14(a)/15d-14(a) Certification of Co-Chief Executive Officer. |
|
31.3 |
|
Rule 13a-14(a)/15d-14(a) Certification of Chief Financial Officer. |
|
32.1 |
|
Certification of Co-Chief Executive Officer pursuant to 18 U.S.C. §1350, as adopted pursuant to Section 906 of the Sarbanes-Oxley Act of 2002. |
|
32.2 |
|
Certification of Co-Chief Executive Officer pursuant to 18 U.S.C. §1350, as adopted pursuant to Section 906 of the Sarbanes-Oxley Act of 2002. |
|
32.3 |
|
Certification of Chief Financial Officer pursuant to 18 U.S.C. §1350, as adopted pursuant to Section 906 of the Sarbanes-Oxley Act of 2002. |
55
SIGNATURES
Pursuant to the requirements of the Securities Exchange Act of 1934, the registrant has duly caused this report to be signed on its behalf by the undersigned, thereunto duly authorized.
Date: May 13, 2014
CĪON
Investment Corporation
(Registrant)
By: /s/ Michael A. Reisner
Michael A. Reisner
Co-Chief Executive Officer and Co-President
(Principal Executive Officer)
By: /s/ Mark Gatto
Mark Gatto
Co-Chief Executive Officer and Co-President
(Principal Executive Officer)
By: /s/ Keith S. Franz
Keith S. Franz
Chief Financial Officer
(Principal Financial and Accounting Officer)
56