Attached files
| file | filename |
|---|---|
| 8-K - 8-K - Arthur J. Gallagher & Co. | d727459d8k.htm |
 2014
Annual Stockholders Meeting Tuesday, May 13, 2014
Exhibit 99 |
 Stockholders’
Meeting May 13, 2014
•
2014 Annual Meeting
•
Chairman’s Remarks
2013 Review
Closing Comments
•
Questions & Answers
2 |
 3
2014 Board of Directors
•
Sherry S. Barrat
•
William L. Bax
•
Frank E. English, Jr.
•
Elbert O. Hand
•
David S. Johnson
•
Kay W. McCurdy
•
Norman L. Rosenthal, Ph.D. |
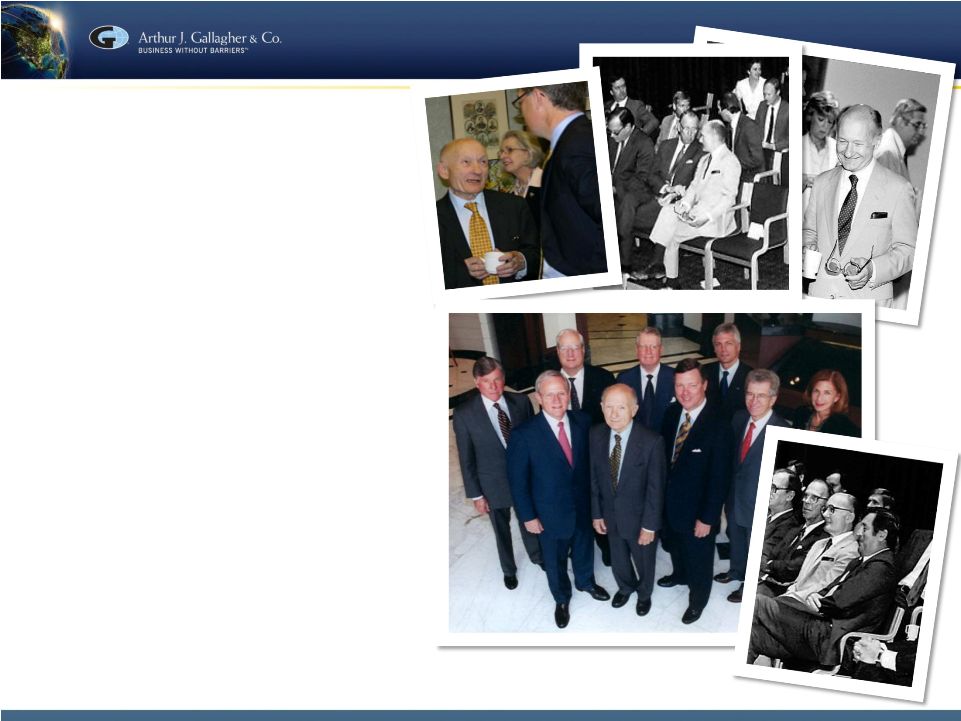 James
R. Wimmer •
As a partner at Lord, Bissell & Brook,
provided legal advice and guidance for
Gallagher’s initial public offering in 1984
•
Joined Gallagher’s Board of Directors in
1985
•
Served as a member of the Board’s Audit
Committee, Compensation, Compliance and
Nominating/Governance Committee
•
Chairman of the Audit Committee for 15
years and Chairman of the Compliance
Committee for 4 years
•
Contributions and influence helped
Gallagher grow from $64 million in revenues
in 1984 to over $3.1 billion in 2013
•
Retired May 2014 but Jim Wimmer will
always be a part of the Gallagher “family”
4 |
 Stockholders’
Meeting May 13, 2014
•
2014 Annual Meeting
5 |
 Stockholders’
Meeting May 13, 2014
•
2014 Annual Meeting
•
Chairman’s Remarks
2013 Review
6 |
 Information Regarding Forward-Looking Statements
This presentation contains “forward-looking statements” within the meaning of
the Private Securities Litigation Reform Act of 1995. When used in this presentation,
the words “anticipates,” “believes,” “contemplates,” “see,” “should,” “could,” “estimates,” “expects,” “intends,” “plans” and
variations thereof and similar expressions, are intended to identify forward-looking
statements. Examples of forward-looking statements in this presentation include,
but are not limited to, statements relating to: (i) our debt levels and plans to borrow; (ii) the state of the economy and our
industry (including combined ratios for insurance companies, insurance rates, P&C pricing,
exposure units and the existence of a hard or firming market); (iii) drivers and
expected levels of organic growth; (iv) our pace of, and expected sources of funding for, acquisition activity (including our
pace of expansion outside the United States); (v) increasing efficiency and productivity; (vi)
locations for possible expansion; (vii) the expected benefits of recent acquisitions,
including cross-sell opportunities; (viii) anticipated uses of the proceeds of your recent secondary offering; (ix) the
financial condition of the company; (x) total shareholder return; (xi) efficiencies and
capabilities generated by system improvements; (xii) the impact of expense reduction
initiatives; and (xiii) the earnings impact of, and developments relating to, our clean energy investments. Important
factors that could cause actual results to differ materially from those in the
forward-looking statements include the following: •
Changes in worldwide and national economic conditions (including an economic downturn and
uncertainty regarding the European debt crisis), changes in premium rates and in
insurance markets generally, changes in the insurance brokerage industry’s competitive landscape, changes in
the regulatory environment, our inability to identify appropriate acquisition targets at the
right price, and the difficulties inherent in combining the cultures and systems of
different companies could impact (i) – (xii) above; and •
Risks and uncertainties related to Gallagher’s clean energy investments – including
uncertainties related to political and regulatory risks, including potential actions by
Congress or challenges by the IRS eliminating or reducing the availability of tax credits under IRC Section 45
retroactively and/or going forward; the ability to maintain and find co-investors; the
potential for divergent business objectives by co-investors and other stakeholders;
plant operational risks, including supply-chain risks; utilities’ future use of, or demand for, coal; the market price of coal;
the costs of moving a clean coal plant; intellectual property risks; and environmental risks
–could impact (xiii) above. Please refer to Gallagher’s filings with
the SEC, including Item 1A, “Risk Factors,” of its Annual Report on Form 10-K for the fiscal year ended
December 31, 2013, and our prospectus supplement dated April 11, 2014, for a more detailed
discussion of these and other factors that could impact its forward-looking
statements. 7 |
 8
Information Regarding Non-GAAP Measures
Earnings Measures
-
Gallagher believes that each of Adjusted EBITDAC and Adjusted EBITDAC margin, as defined
below, provides a meaningful representation of its operating performance and
Reconciliations
–
Please
see
the
examples
set
forth
in
"Reconciliation
of
Non-GAAP
Measures
and
supplemental
quarterly
financial
data
"
on
Gallagher's
Web
site
at
www.ajg.com/IR.
Organic
Growth
is
defined
as
organic
change
in
base
commission
and
fee
revenues,
and
excludes
the
first
twelve
months
of
net
commission
and
fee
revenues
generated
from
acquisitions
accounted
Adjusted
Operating
Expense
Ratio
is
defined
as
operating
expense,
adjusted
to
exclude
acquisition
integration
costs,
South
Australia
and
claim
portfolio
transfer
ramp
up
costs,
workforce
related
Adjusted
Revenues
is
defined
as
revenues,
adjusted
to
exclude
gains
realized
from
sales
of
books
of
business,
revenue
from
New
Zealand
earthquake
claims
administration
and
South
Australia
ramp
up fees.
Revenue
and
Expense
Measures
-
Gallagher
believes
that
Adjusted
Revenues
and
Adjusted
Operating
Expense
Ratio,
each
as
defined
below,
provides
stockholders
and
other
interested
persons
with
Adjusted
EBITDAC
margin
is
defined
as
Adjusted
EBITDAC
divided
by
Adjusted
Revenues
(defined
below).
Adjusted
EBITDAC
is
defined
as
earnings
from
continuing
operations
before
interest,
income
taxes,
depreciation,
amortization
and
the
change
in
estimated
acquisition
earnout
payables
(EBITDAC),
This presentation includes references Adjusted EBITDAC, Adjusted EBITDAC margin, Adjusted
Revenues, Adjusted Operating Expense Ratio and Organic Growth, which are measures not in accordance with, or an
alternative to, the GAAP information provided herein. The most directly comparable GAAP measure for Adjusted Revenues and Organic Growth is
revenues. For the Brokerage Segment, the Risk Management Segment, and the two segments on a combined basis,
revenues were $1,827 million, $572 million and $2,399 million, respectively, in 2012 and
$2,144 million, $611 million and $2,755 million in 2013. For the Brokerage Segment, revenues were $533 million, $679
million, $783 million, $863 million, $946 million, $1,007 million, $1,114 million, $1,188
million, $1,276 million, $1,341 million, $1,556 million, $1,827 million and $2,144 million, in 2001, 2002, 2003, 2004, 2005,
2006, 2007, 2008, 2009, 2010, 2011, 2012 and 2013, respectively. The most directly comparable
GAAP measure for Adjusted Operating Expense Ratio is operating expense, which was $247 million, $313 million
and $370 million in 2008, 2012 and 2013, respectively, for the Brokerage Segment and $126
million, $138 million and $146 million in 2008, 2012 and 2013, respectively, for the Risk Management Segment.
for as purchases and the net commission and fee revenues related to operations disposed of in
each year presented. These commissions and fees are excluded from organic revenues in order to help
interested persons analyze the revenue growth associated with the operations that were a part
of Gallagher in both the current and prior year. In addition, change in organic growth excludes the impact of
supplemental commission and contingent commission revenues, and the period-over-period
impact of foreign currency translation. The amounts excluded with respect to foreign currency translation are
calculated by applying 2013 foreign exchange rates to the same periods in 2012. For the Risk
Management segment, organic change in base domestic and international fee revenues excludes international
performance bonus fees and New Zealand earthquake claims administration to improve the
comparability of our results between periods by eliminating the impact of the items that have a high degree of
variability or due to the limited-time nature of these revenue sources. useful information that will assist such persons in analyzing Gallagher’s operating
results as they develop a future outlook for Gallagher. Gallagher believes that Organic Growth provides a comparable
measurement of revenue growth that is associated with the revenue sources that will be
continuing in 2014 and beyond. Gallagher has historically viewed organic revenue growth as an important indicator
when assessing and evaluating the performance of its Brokerage and Risk Management segments.
Gallagher also believes that using this measure allows financial statement users to measure, analyze and
compare the growth from its Brokerage and Risk Management segments in a meaningful and
consistent manner.
The most directly comparable GAAP measure for these non-GAAP earnings measures is net
earnings. For the Brokerage Segment, the Risk Management Segment, and the two segments on a combined basis, net
earnings was $140 million, $33 million and $173 million, respectively, in 2011, $156 million,
$42 million and $198 million, respectively, in 2012, and $205 million, $46 million and $251 million in 2013.
further adjusted to exclude gains realized from sales of books of business, acquisition
integration costs (i.e., Bollinger, Giles and Heath Lambert), earnout related compensation charges, workforce related
charges, lease termination related charges, New Zealand earthquake claims administration
costs, South Australia and claim portfolio transfer ramp up fees/costs, acquisition related adjustments and the
impact of foreign currency translation, as applicable. improves the comparability of Gallagher’s results between periods by eliminating the
impact of certain items that have a high degree of variability.
charges,
lease
termination
related
charges,
acquisition
related
adjustments
and
the
impact
of
foreign
currency
translation,
as
applicable,
divided
by
Adjusted
Revenues. |
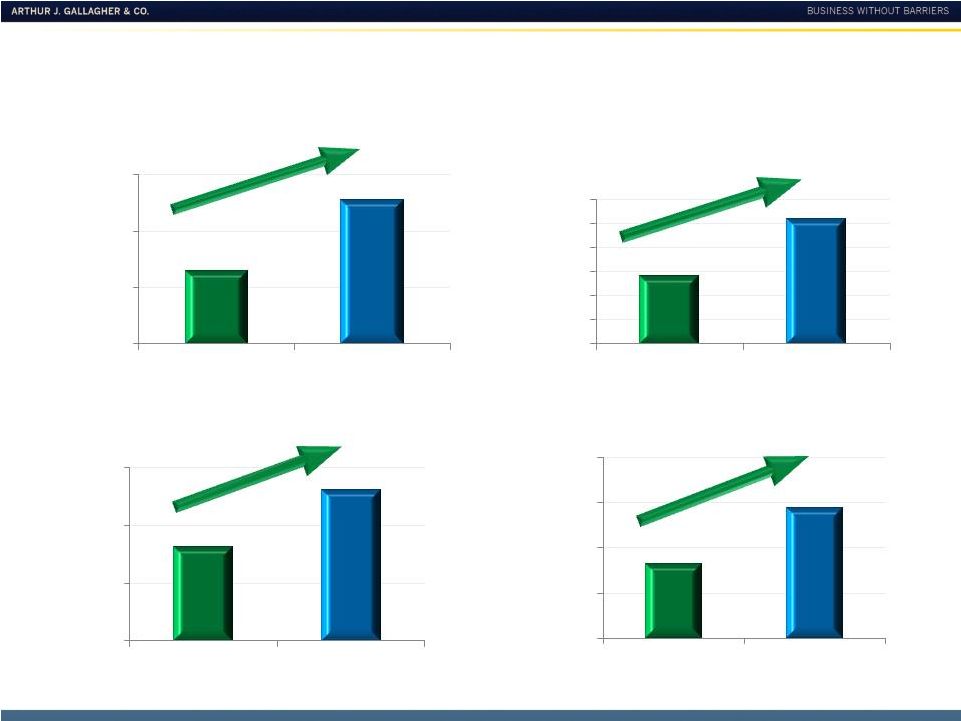 Brokerage Segment –
2013
(in $M)
See important disclosures regarding Non-GAAP measures on Page 8.
$1,824
$2,139
$1,500
$1,750
$2,000
$2,250
2012
2013
Adjusted Revenues
17%
$413
$511
$250
$350
$450
$550
2012
2013
Adjusted EBITDAC
24%
4.4%
5.6%
3.0%
3.5%
4.0%
4.5%
5.0%
5.5%
6.0%
2012
2013
Organic Growth in Base
Commissions & Fees
22.7%
23.9%
21.0%
22.0%
23.0%
24.0%
25.0%
2012
2013
Adjusted EBITDAC Margin
9 |
 10
Risk Management Segment –
2013
(in $M)
See important disclosures regarding Non-GAAP measures on Page 8.
$90
$96
$75
$80
$85
$90
$95
$100
2012
2013
Adjusted EBITDAC
6%
$563
$610
2012
2013
Adjusted Revenues
8%
4.0%
9.3%
0.0%
2.0%
4.0%
6.0%
8.0%
10.0%
2012
2013
Organic Growth in Fees
16.0%
15.8%
0.0%
5.0%
10.0%
15.0%
20.0%
2012
2013
Adjusted EBITDAC Margin
$525
$550
$575
$600
$625
10 |
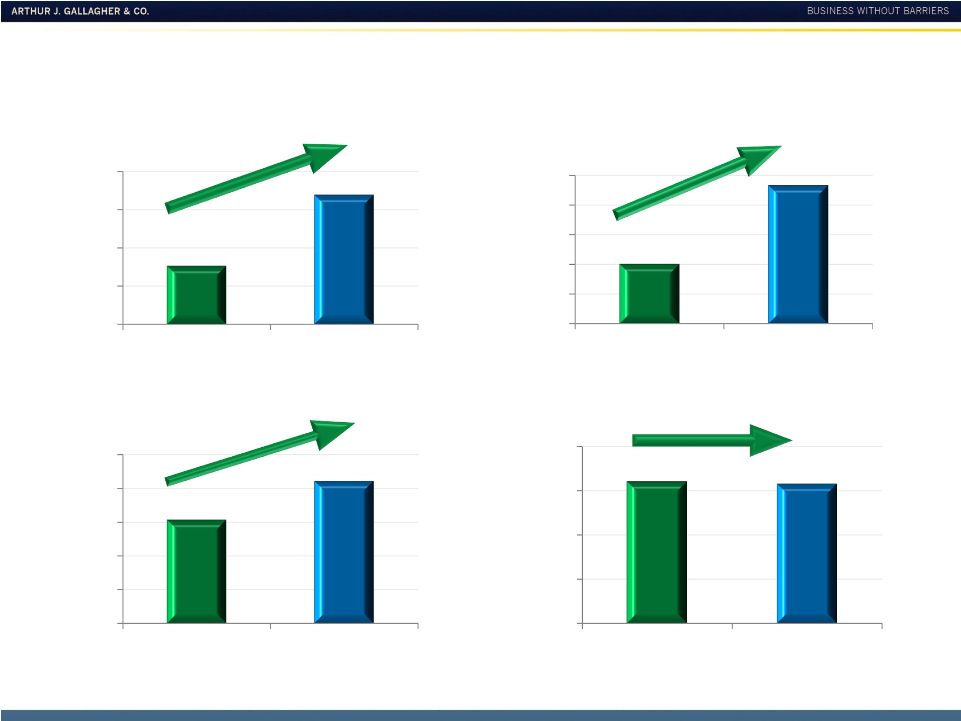
 Brokerage & Risk Mgmt Combined –
2013
(in $M)
See important disclosures regarding Non-GAAP measures on Page 8.
11
$2,200
$2,400
$2,600
$2,800
Adjusted Revenues
15%
4.0%
6.0%
2.0%
3.0%
4.0%
5.0%
6.0%
7.0%
2012
2013
Organic Growth in Base
Commissions & Fees
$503
$607
$400
$500
$600
$700
2012
2013
Adjusted EBITDAC
21%
21.1%
22.1%
19.0%
20.0%
21.0%
22.0%
23.0%
2012
2013
Adjusted EBITDAC Margin
$2,387
$2,749
2012
2013 |
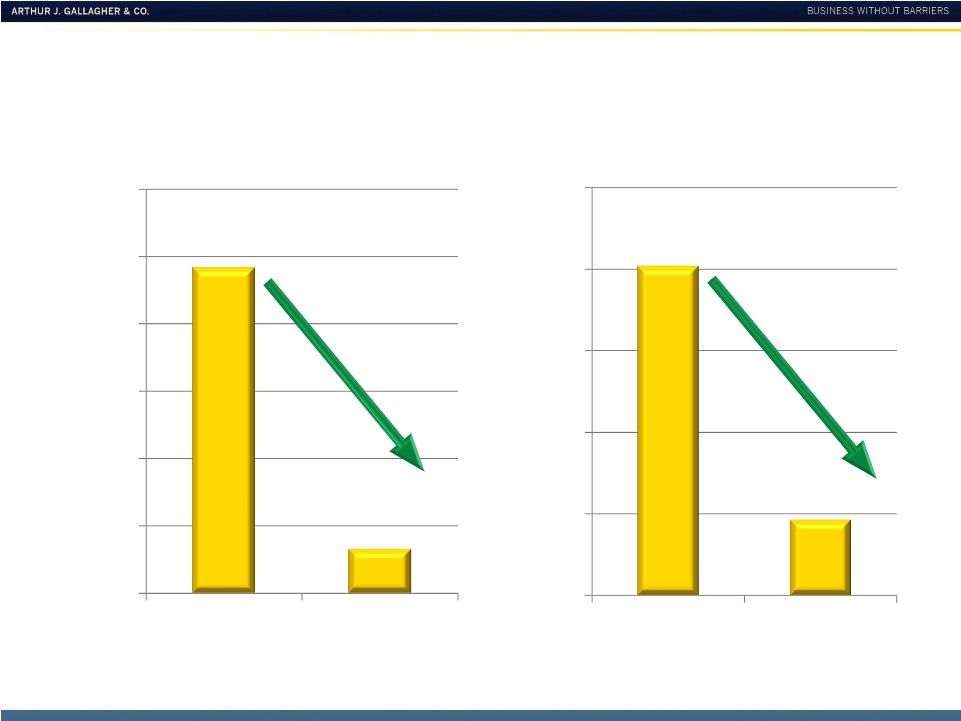
 Net
Earnings from Clean Energy Investments (in $M)
2009
2010
2011
2012
2013
-$10.0
$0.0
$10.0
$20.0
$30.0
$40.0
$50.0
$60.0
$70.0
$80.0
-$4.8
$7.5
$3.9
$32.7
$63.7
12 |
 13
Dividends Declared as % of Cash Flows
from Operating Activities
62%
52%
0%
25%
50%
75%
100%
2009
2013 |
 14
Dividends Per Share
1984
2014
$1.44*
$0.00
$0.20
$0.40
$0.60
$0.80
$1.00
$1.20
$1.40
$1.60
*Indicated – On January 23, 2014, Gallagher’s Board of Directors declared a $.36 per
share first-quarter 2014 dividend.
|
 Recap –
What We Delivered in 2013
See important disclosures regarding Non-GAAP measures on Page 8.
Improve organic growth in Brokerage
& Risk Management
M&A pipeline extremely full and look
for partners that help build out
geographic/niche/program presence
Driving operational efficiencies to
continue productivity gains –
sourcing, real estate, offshore
initiatives
International expansion
Organic growth increased from 4.0% in
2012 to 6.0% in 2013
A record $385m in acquired revenues
includes our 2 largest acquisitions ever
Adjusted Brokerage & Risk
Management EBITDAC margin
improved 100 basis points
Intl expands retail footprint with Giles
& others. 4 deals for $191m revenue.
Now largest retailer in U.K.
What we said
What we did
15 |
 What we
said Recap –
What We Delivered in 2013
What we did
See important disclosures regarding Non-GAAP measures on Page 8.
16
Complete Heath integration
Heath integration completed in 3Q as
planned
GB –
IT investments without margin
contraction
Enhanced client service capabilities
like analytics workbench while
maintaining margins
Nearly double 2013 clean energy
earnings
Total 2013 after tax earnings of
$63.7m
P&C retail brokerage to convert to
single agency system
Project now essentially complete
Using primarily cash for acquisitions
Used about 75% cash and 25% stock in
2013 |
 17
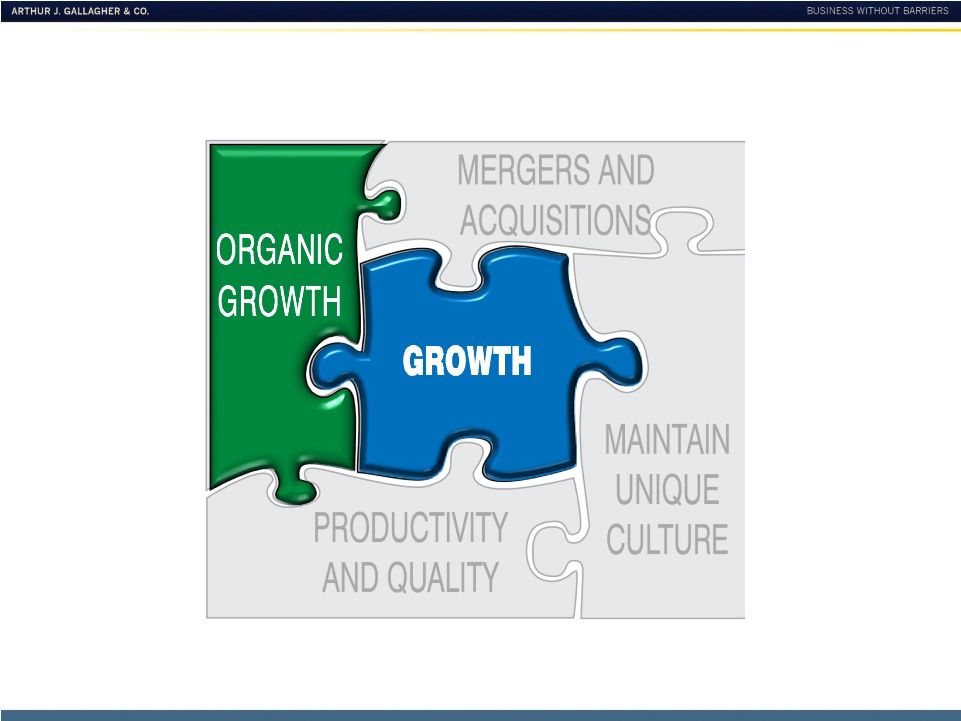
Plan For Growth –
Organic |
 Driving Organic Growth
Organic
Growth
Enhance Carrier Compensation
Global Expansion
Grow Our
Own
Hire
Experienced
Teams
Focus Into
Niches
Provide
Sales
Mgmt.
Tools and
Training
Cross
Selling
18 |
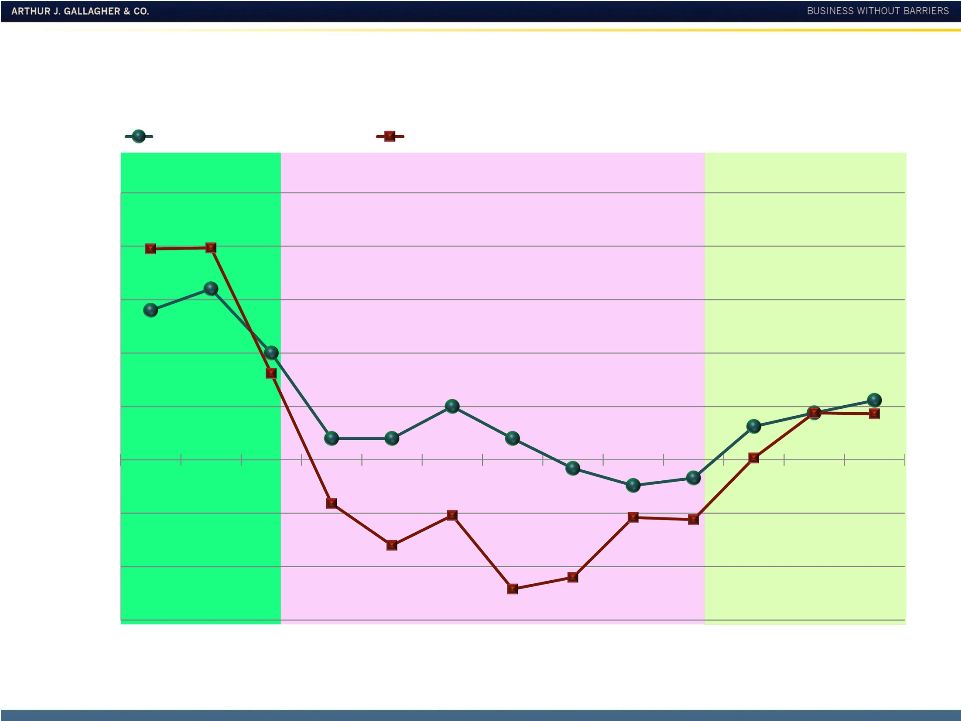 Gallagher’s Sales Culture Performs
Throughout the Entire Cycle
Hard Market
Firm Market
2013 CIAB is YTD as of 3Q. Gallagher’s Brokerage Segment Organic Growth including
Supplemental Commissions. See important disclosures regarding Non-GAAP measures on
Page 8. 14.0%
16.0%
10.0%
2.0%
2.0%
5.0%
2.0%
-0.8%
-2.4%
-1.7%
3.1%
4.4%
Gallagher
Organic
5.6%
19.8%
19.8%
8.1%
-4.1%
-8.0%
-5.2%
-12.1%
-11.0%
-5.4%
-5.6%
0.2%
4.4%
CIAB
4.3%
-15.0%
-10.0%
-5.0%
0.0%
5.0%
10.0%
15.0%
20.0%
25.0%
2001
2002
2003
2004
2005
2006
2007
2008
2009
2010
2011
2012
2013
Gallagher Organic
-
Soft Market
CIAB
Change in Avg. Commercial Rates
19 |
 20
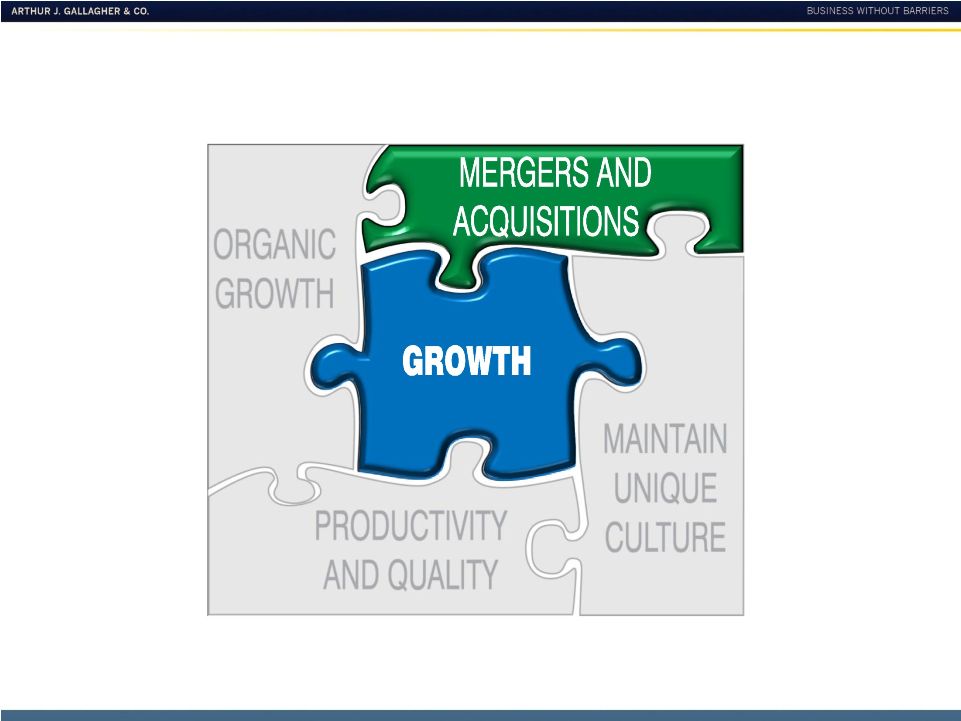
Plan For Growth –
M&A |
 21
M&A Looking Forward –
Opportunities Continue
Limited
Consolidators
Gallagher Acquisition
Units
Gallagher’s
Core
Competency
Vast Pipeline
18,000
agents/brokers
in the U.S.
Baby boomers
looking for exit
strategy
Need Gallagher’s
Expertise
Gallagher
Culture
Proven
History of
Doing the
Deal
Ability to
Integrate
MGA
MGU
Captive
Domestic and
International
Markets Highly
Fragmented
Wholesale
Benefits
Retail P&C
International |
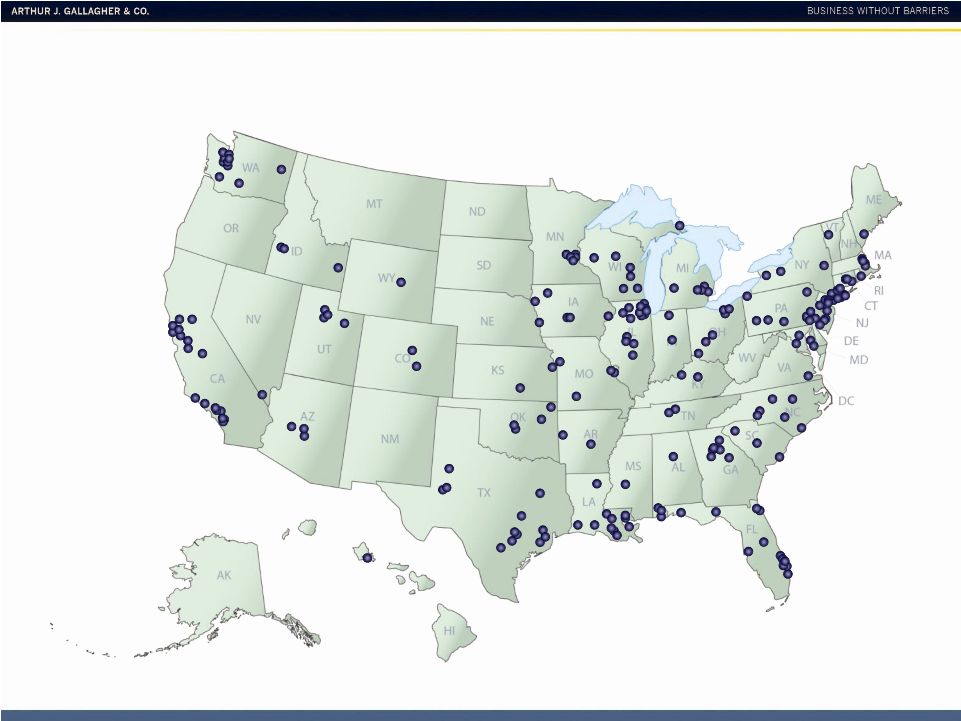 Current Gallagher U.S. Locations
22 |
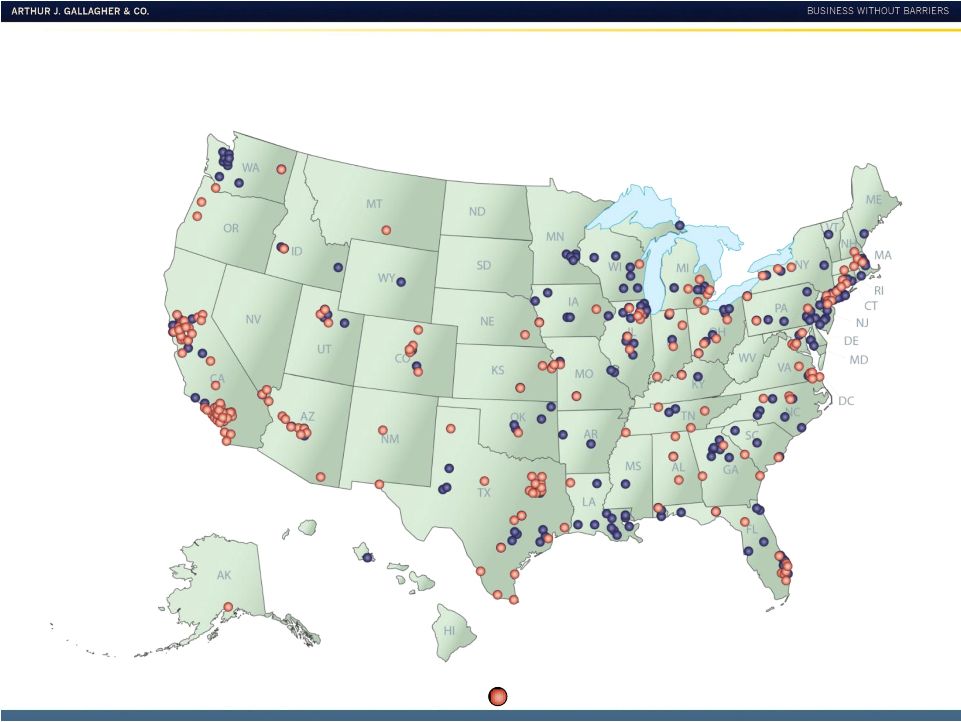 Larger Cities with Expansion Potential
Cities with population of 100,000+ where Gallagher has no presence.
23 |
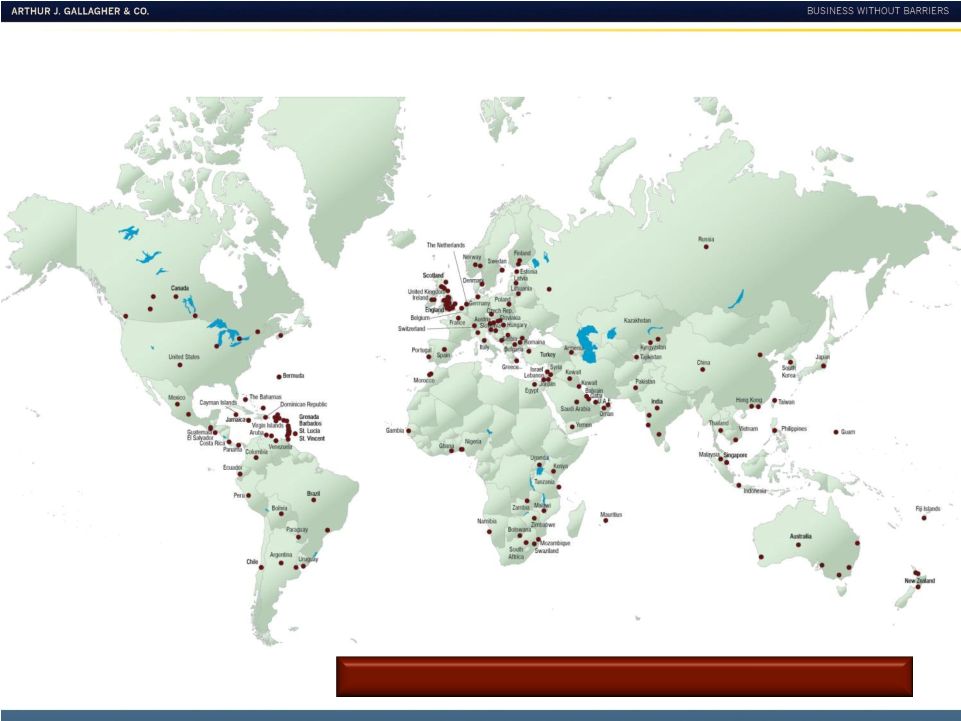 International Correspondent Brokers
Client Capabilities in More Than 140 Countries
24 |
 25
Strong Acquisition Momentum
Annualized revenues acquired (in $Ms).
Domestic Brokerage
2011 Heath Lambert; 2013 Bollinger and Giles
Int’l Brokerage
Risk Management
$0
$50
$100
$150
$200
$250
$300
$350
$400
2001
2002
2003
2004
2005
2006
2007
2008
2009
2010
2011
2012
2013 |
 International Expansion
Results of
Gallagher focus
on International
Expansion
•
Position Gallagher as a top 5 U.K. broker
•
Strengthen Gallagher’s retail distribution
platform and underwriting footprint in the U.K.
•
Expanding scale outside London
•
Complement and strengthen niche practice
groups –
Alesco energy build out
•
Expanding depth of London specialty units
•
Cross-selling opportunities through combined
operations
•
Establish brand recognition outside the U.S.
•
Larger operational platform drives efficiencies
•
Presence in Australia and Latin America for
future development
26 |
 27
Bollinger Strategic Rationale
•
Expanding Gallagher’s Northeastern footprint
particularly in New Jersey and New York
•
Combining two very similar cultures
•
Assimilating Bollinger’s parallel operations
into three core businesses
•
Complementing and expanding specialized
niche practice groups
•
Expanding Bollinger’s program business
through the company’s existing distribution
network
Bollinger, Inc.
August 2013 |
 Giles Strategic Rationale
28
Giles Group of
Companies
November 2013
Significantly expanding Gallagher’s client base
in the U.K. middle market
Adding significant growth in Gallagher’s
underwriting footprint
Similar team-based sales cultures
Driving longer-term operational efficiencies
through a consolidated platform
Cross-selling opportunities across the combined
network
Complementing and expanding specialized
niche practice groups
•
•
•
•
•
• |
 29
Oval Strategic Rationale
•
Builds on the Giles acquisition and establishes
Gallagher as a top three U.K. retail commercial broker
•
Significantly expands Gallagher’s retail client base in
the U.K. middle market
•
Shared culture that focuses on enhancing client service
and improving productivity
•
Establishes scale in the traditional U.K. insurance
markets
•
New locations will strengthen the retail distribution
network and expand Gallagher’s footprint in the U.K.
•
Combining strong production talent that builds on
Gallagher’s successful sales team platform
Oval Group of
Companies
April 2014 |
 30
Wesfarmers Strategic Rationale
30
OAMPS and
Crombie
Lockwood
April 2014
•
Gives Gallagher scale in Australia and New Zealand
with one of the largest insurance brokers in the region
•
Platform for future growth in Australasia –
combined
organization will be attractive to potential partners
•
Strong sales-based culture similar to Gallagher
•
Diversifies our Australasia revenue base and offers
significant cross-sell opportunities into the London
market and our Risk Management operations
•
Wesfarmers U.K. brokerage areas of expertise will
complement and provide new specialized niche
practice capabilities to Gallagher’s existing U.K.
operations in addition to operational efficiencies |
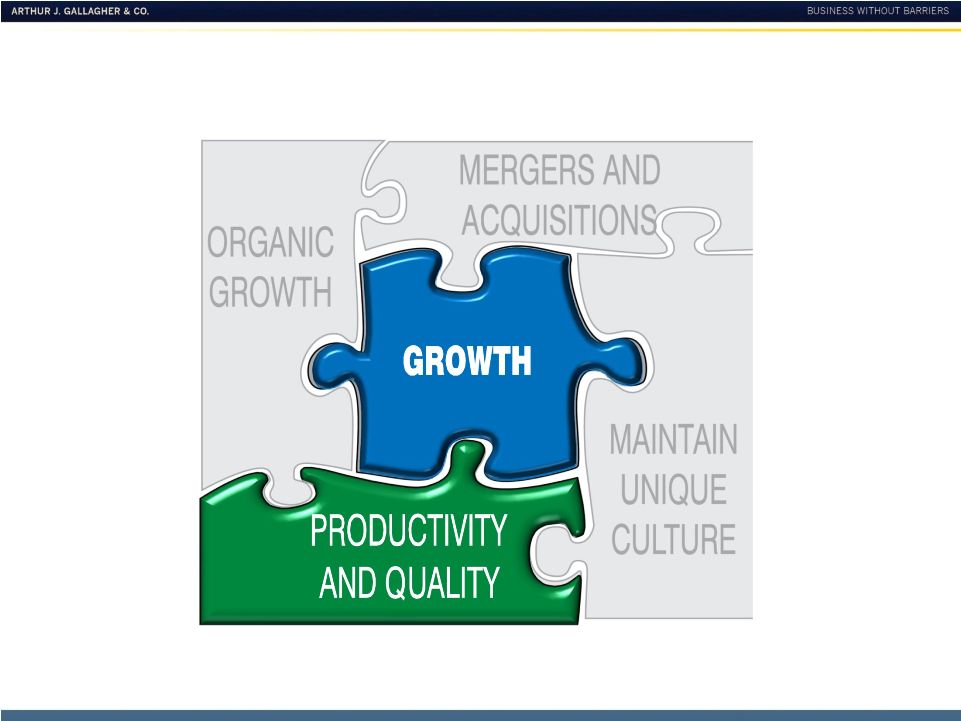 Productivity and Quality
31 |
 Optimizing
Productivity
& Quality
Improving
Productivity and
Quality
Leveraging
Sales Force
Management
Tools
Established
Offshore
Centers of
Excellence
Controlling
Headcount
Utilizing
Sourcing to
Manage
Expenses
Building
Productivity
Tools –
DMS
and Workflow
Standardizing
Processes and
Systems
Optimizing
Real Estate
Footprint
Investing in
Business
Intelligence
32 |
 33
Back Office Infrastructure –
2004 |
 Back
Office – Today
34 |
 Current Front Office Activity
35 |
 36
Reasons for Offshore Centers of Excellence
Foster
Innovation
Increase Speed
to Market
Improve Quality
Reduce Costs
Focus on Core |
 37
Quality Metrics
Reduced policy delivery from 30 to 10 days
Achieved 98% quality rate
Reduced certificate of insurance delivery
expense by 20%
Improved quality rate to 99%
Implemented claims adjusters enhanced quality
audit programs
Realized 20% improvement on adjuster quality
rate
Standardized and automated data capturing for
proposal generation –
reducing production time
by 80+%
Better and more timely information to clients for
renewal
Centralized
billing
to
clients
-
normally
done
in
every branch now done by small team in Itasca
Reduces time and errors while improving cash
flows and increasing cost savings on resources
Consolidated 5 regional accounting centers to 1
divisional accounting in Itasca
Standardizes and automates data processes,
improves report timing, reduces errors savings on
resources
Efficiency Improvements
Drive Quality |
 Reducing Adjusted Operating Expense Ratio
Brokerage
Risk Management
See important disclosures regarding Non-GAAP measures on Page 8.
38
20.8%
16.7%
16.0%
17.0%
18.0%
19.0%
20.0%
21.0%
22.0%
2008
2013
27.0%
23.9%
23.0%
24.0%
25.0%
26.0%
27.0%
28.0%
2008
2013 |
 39
AJG –
2013 Ins Broking
CEO of the Year -
Reactions
Magazine
AJG Risk Mgmt –
2013
Risk Mgmt Provider of
the Year –
Midcontinent Oil &
Gas Awards
AJG U.K. Retail –
2013 Commercial Lines
Broker of the Year
–
Insurance Times
AJG Intl/OIM –
2013
E-Business Award –
Insurance Age
GB US –
2013 Best Commercial TPA
–
Overall TPA Buyers Choice Winner
–
Business Insurance
AJG Intl –
2013 Best Broker M&A Deal
of the Year –
Reactions
Magazine
AJG –
2013 Ranked Top Ten Best Companies
for Leaders –
Chief Executive
Magazine
GB UK –
2013 Investor in People
UK National Standard
AJG Intl/GCM –
2013 Best Latin
American/Caribbean Insurance
Broker –
Global Finance
AJG Intl –
2013 Best Mid-Sized Insurance Brokering
company for U.S. business
-
Reactions
Magazine
AJG –
2012 #1 Overall Client
Satisfaction for Large Corporations
–
Greenwich Associates |
 40
Culture |
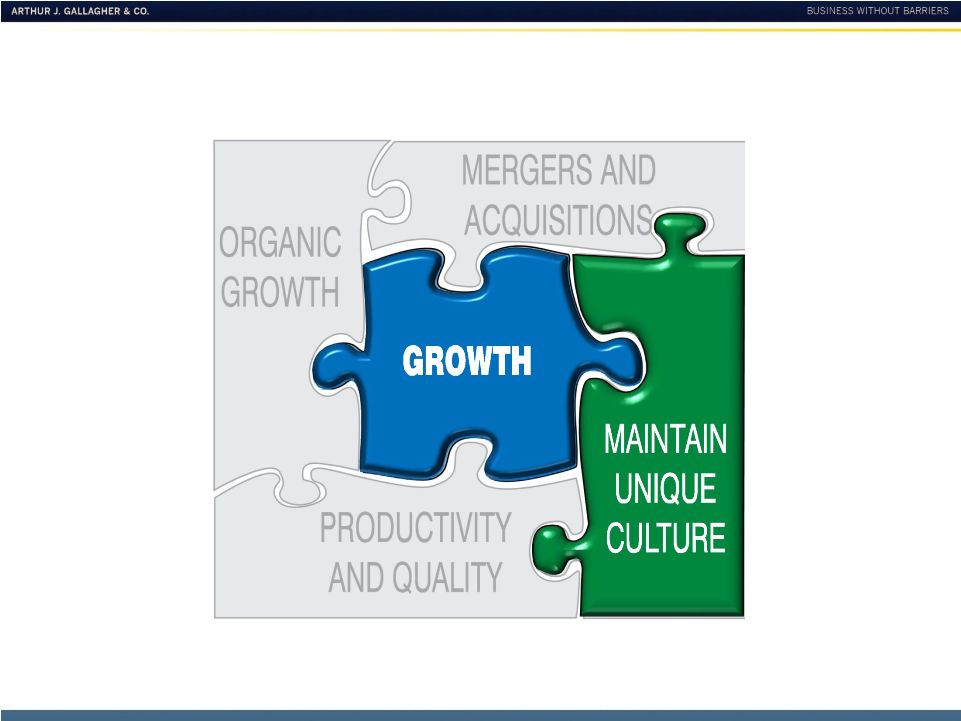
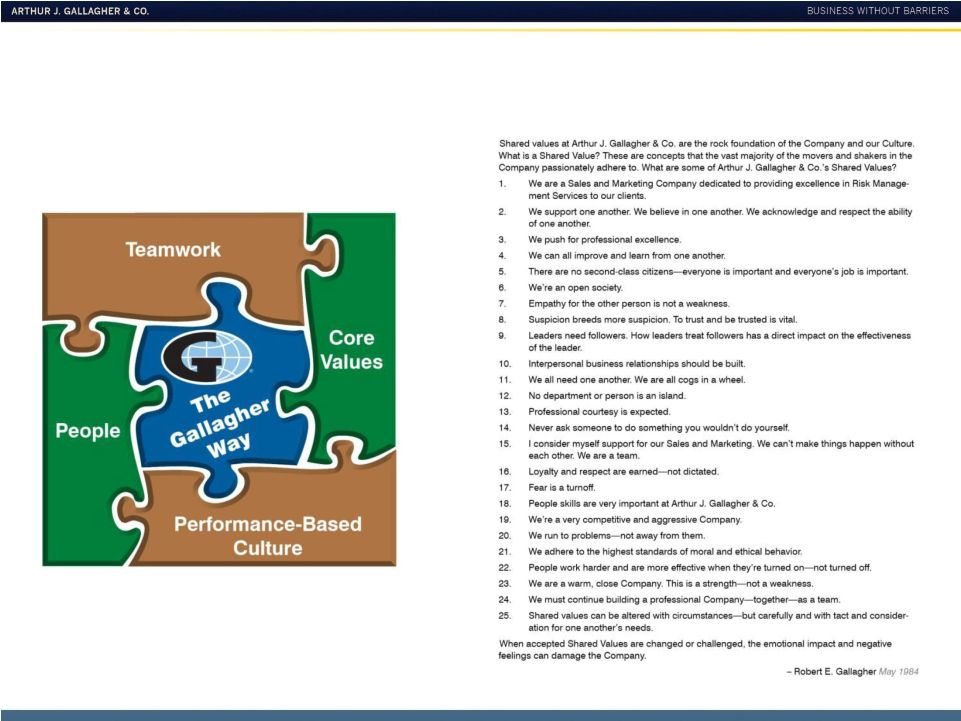 Maintain Unique Culture
41 |
 One
of the World’s Most Ethical Companies as Recognized by Ethisphere
•
Industry-leading commitment to ethics
and dedication to integrity
•
Chosen for:
Promoting ethical business
standards and practices
Exceeding legal compliance
standards
Innovating to benefit the public
Demonstrating that corporate
citizenship is tied to company
success
•
Globally, only 145 organizations named
42 |
 Recognized again by Ethisphere as
One of the World’s Most Ethical Companies
43 |
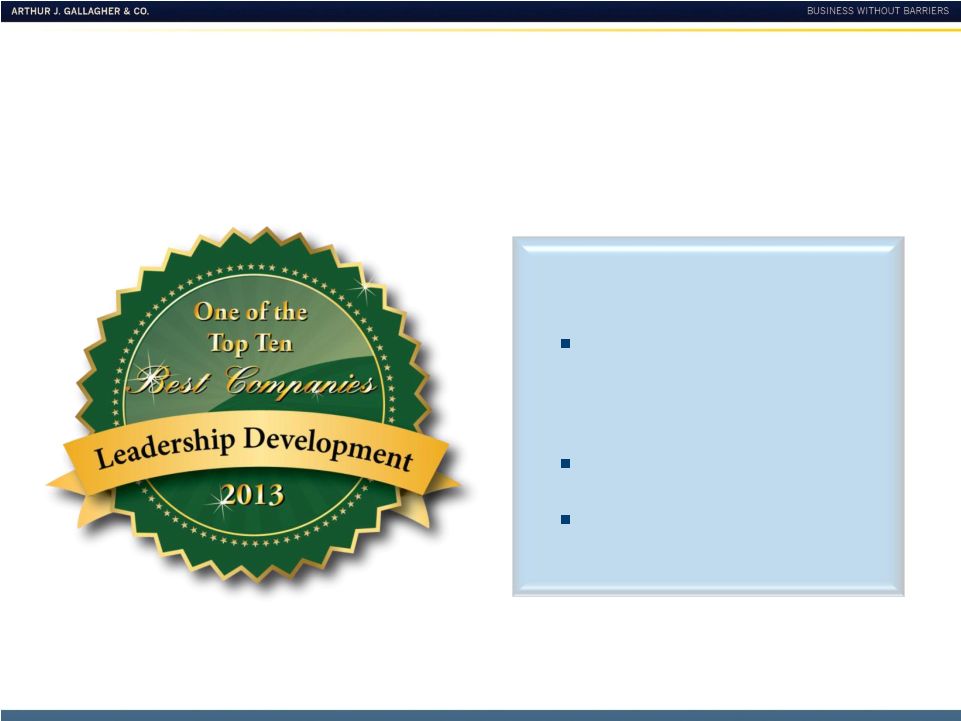 A
Top Ten Best Company for Leadership Development As
Recognized
by
Chief
Executive
Magazine
–
2013
•
Recognized for:
High percentage of senior
and mid-manager positions
filled internally
Formal leadership process
Commitment to leadership
development program
44 |
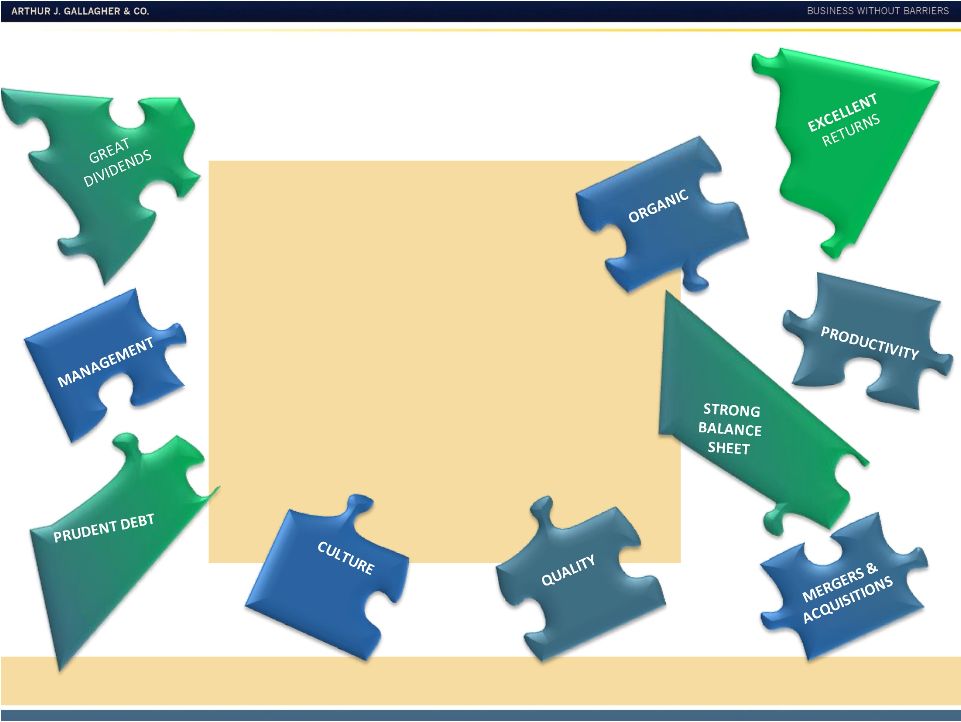 Why
Invest? You Believe Our Company Has:
Right management
Unique culture
Proven growth strategy
Continuing M&A opportunities
Increasing productivity
Higher quality
Prudent debt
Strong balance sheet
Excellent return to shareholders
Gallagher is well positioned for 2014 and beyond |
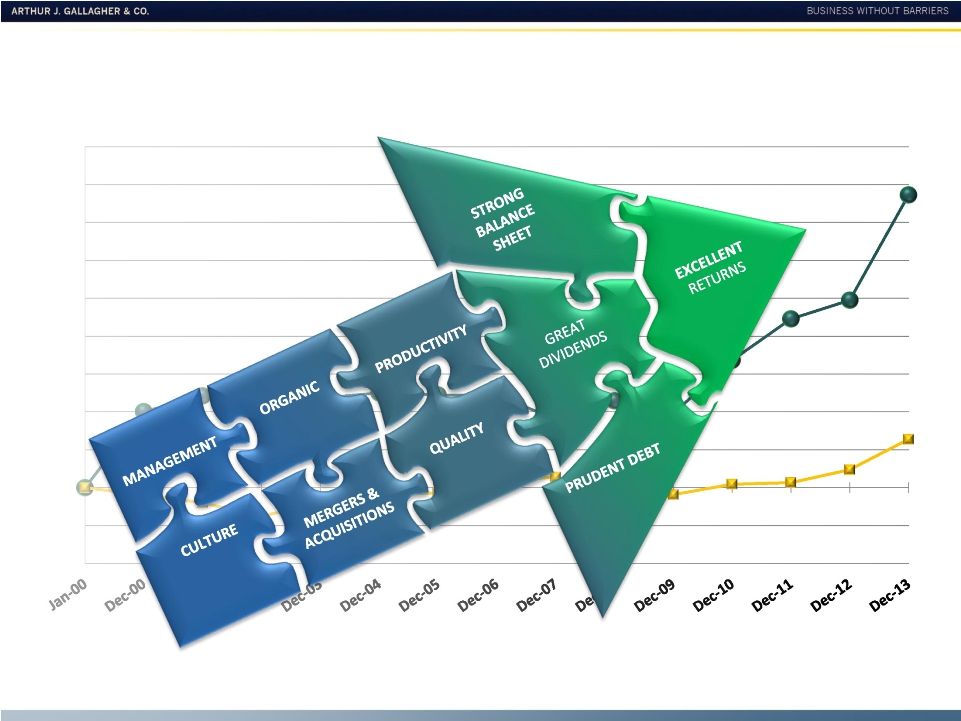 46
Why Invest? We are Just Getting Started
AJG
386%
S&P 500
64%
-100%
-50%
0%
50%
100%
150%
200%
250%
300%
350%
400%
450%
Source for data: Bloomberg. Total returns from 1/1/2000 – 12/31/2013 include reinvestment
of dividends. |
 Stockholders’
Meeting May 13, 2014
•
2014 Annual Meeting
•
Chairman’s Remarks
2013 Review
Closing Comments
47 |
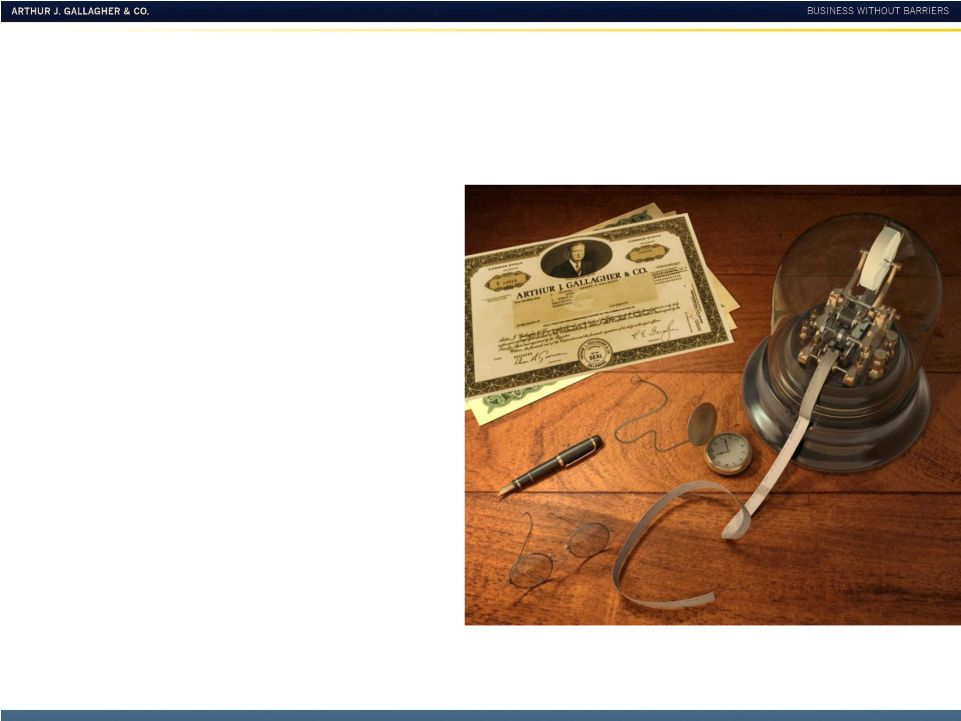 Gallagher’s
30
Anniversary
of
IPO
June 20, 2014
1984
•
IPO stock price: $1.84
•
Number of employees: 1,026
•
Operations in three countries
•
Total revenues of $64.18 million
•
10
largest
insurance
broker*
2013
•
Stock price at 12/31/13: $46.93
•
Number of employees: 16,336
•
Operations in 25 countries
•
Total revenues of $3.18 billion
•
4
largest
insurance
broker*
*According to Business Insurance magazine
48
th
th
th |
 Questions & Answers
For Additional Information:
Marsha Akin
Director –
Investor Relations
Marsha_Akin@ajg.com
Phone: 630-285-3501 |