Attached files
| file | filename |
|---|---|
| 8-K - 8-K COVER PAGE - CIFC Corp. | cifc20148-kcoverx033114.htm |

Exhibit 99.1
CIFC CORP. | Investor Relations |
250 Park Avenue | Investor@CIFC.COM |
New York, NY 10177 | (646) 367-6633 |
NASDAQ: CIFC
CIFC Corp. Announces First Quarter of 2014 Results and a Quarterly Dividend
NEW YORK, May 13, 2014 - CIFC Corp. (NASDAQ: CIFC) (“CIFC” or the “Company”) today announced its results for the first quarter ended March 31, 2014.
Highlights
• | Economic Net Income (“ENI”, a non-GAAP measure) for the quarter was $13.2 million, compared to $5.7 million(1) for the same period of the prior year. |
• | ENI management fees for the quarter were $19.0 million, an increase of 18% compared to $16.0 million(1) for the same period in the prior year. |
• | GAAP net income (loss) for the quarter was $0.2 million as compared to $2.8 million for the same period in the prior year. |
• | Fee Earning Assets Under Management ("Fee Earning AUM" or "AUM") from loan-based products totaled $12.3 billion as of March 31, 2014 as compared to $12.0 billion as of December 31, 2013 and $12.4 billion as of March 31, 2013. |
◦ | During the quarter, the Company sponsored the issuance of one new CLO and increased subscriptions to other loan-based products that represented approximately $648 million of new AUM. |
◦ | Subsequent to quarter end, the Company sponsored the issuance of a new CLO that represents approximately $800 million of new loan-based AUM. |
• | CIFC declares a cash dividend of $0.10 per share. The dividend will be paid on June 15, 2014 to shareholders of record as of the close of business on May 25, 2014. |
Executive Overview
We had a successful first quarter in terms of both investment performance and asset growth. Our CLOs and total return funds continued to perform well. We continued to expand our credit platform to offer multiple investment products. During the quarter, we started building out a private debt platform and hired two highly experienced senior investment professionals.
The markets for CLOs began the year strongly and CLO issuance in 2014 has outpaced the record levels of 2013. Despite the expected AUM run-off in our legacy CLOs, our loan-based AUM increased by $300 million during the quarter. Our ability to establish warehouses and accumulate assets before pricing the CLOs has been a key competitive advantage we continue to leverage. Our CLO pipeline is robust and supported by two open non mark-to-market warehouses.
Explanatory Note:
(1) Prior year ENI has been adjusted to make it consistent with current year ENI by excluding management fees attributable to non-core investment products (i.e. Legacy ABS and Corporate Bond collateralized debt obligations ("non-core")).
1
Selected Financial Metrics
(In thousands, except per share data) (unaudited)
NON-GAAP FINANCIAL MEASURES (1) | 1Q'14 | 1Q'13 | % Change vs. 1Q'13 | ||||
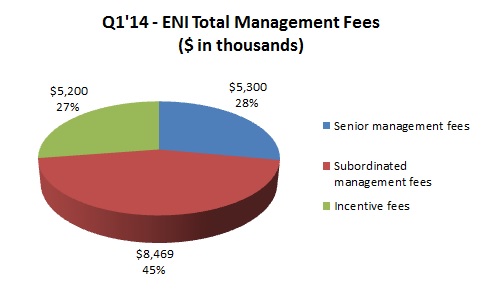
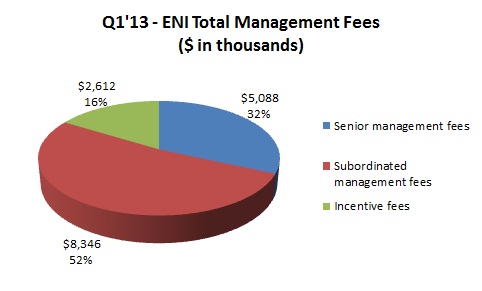
Management Fees - Senior | $ | 5,300 | $ | 5,088 | 4% | ||
Management Fees - Subordinated | 8,469 | 8,346 | 1% | ||||
Incentive Fees | 5,200 | 2,612 | 99% | ||||
Total Management Fees | 18,969 | 16,046 | 18% | ||||
Net Investment Income | 5,996 | 1,089 | 451% | ||||
Total ENI Revenues | 24,965 | 17,135 | 46% | ||||
Compensation and benefits | 6,828 | 6,426 | 6% | ||||
Other operating expenses | 3,495 | 3,573 | (2)% | ||||
Corporate interest expense | 1,467 | 1,482 | (1)% | ||||
Total ENI Expenses | 11,790 | 11,481 | 3% | ||||
ENI (1) | $ | 13,175 | $ | 5,654 | 133% | ||
ENI per share - basic | $ | 0.63 | $ | 0.27 | 133% | ||
ENI per share - diluted (2) (3) | $ | 0.54 | $ | 0.25 | 116% | ||
NON-GAAP FINANCIAL MEASURES (1) | 1Q'14 | 1Q'13 | % Change vs. 1Q'13 | ||||
ENI EBIT (4) | $ | 14,642 | $ | 7,136 | 105% | ||
ENI EBITDA (5) | $ | 14,878 | $ | 7,305 | 104% | ||
ENI EBITDA Margin (6) | 60 | % | 43 | % | 17% | ||
Fee Related ENI EBITDA Margin (6) | 47 | % | 39 | % | 8% | ||
ENI Margin (6) | 53 | % | 33 | % | 20% | ||
NON-GAAP FINANCIAL MEASURES - AUM | 3/31/2014 | 12/31/2013 | % Change vs. 12/31/2013 | 3/31/2013 | % Change vs. 3/31/13 | ||||
Fee Earning AUM from loan-based products (7) | $12,345,453 | $12,045,859 | 2% | $12,369,633 | —% | ||||
SELECTED GAAP RESULTS | 1Q'14 | 1Q'13 | % Change vs. 1Q'13 | ||||
Total net revenues | $ | 1,709 | $ | 2,633 | (35)% | ||
Total expenses | $ | 13,744 | $ | 15,148 | (9)% | ||
Net income (loss) attributable to CIFC Corp. | $ | 235 | $ | 2,787 | (92)% | ||
Earnings (loss) per share - basic | $ | 0.01 | $ | 0.13 | (92)% | ||
Earnings (loss) per share - diluted (2) | $ | 0.03 | $ | 0.13 | (77)% | ||
Weighted average shares outstanding - basic | 20,839 | 20,797 | —% | ||||
Weighted average shares outstanding - diluted | 26,070 | 25,794 | 1% | ||||
2
Explanatory Notes:
(1) | See Appendix for a detailed description of these non-GAAP measures and reconciliations from net income (loss) attributable to CIFC Corp. to non-GAAP measures. Prior year ENI has been adjusted to make it consistent with current year ENI by excluding management fees attributable to non-core investment products (i.e.: Legacy ABS and Corporate Bond collateralized debt obligations ("non-core")). |
(2) | The numerator in the dilution calculation has been adjusted to add-back the effect of convertible note interest charges (before taxes for ENI and after taxes for GAAP). |
(3) | GAAP weighted average shares outstanding was used as ENI weighted average shares outstanding for the current year. |
(4) | ENI EBIT is ENI before corporate interest expense. See Appendix. |
(5) | ENI EBITDA is ENI EBIT before depreciation of fixed assets. See Appendix. |
(6) | ENI EBITDA Margin is ENI EBITDA divided by Total ENI Revenue. Fee Related ENI EBITDA Margin is ENI EBITDA less Net Investment Income divided by Total Management Fees. ENI Margin is ENI divided by Total ENI Revenue. |
(7) | Amount excludes Fee Earning AUM attributable to non-core products of $0.8 billion, $0.8 billion and $2.1 billion as of March 31, 2014, December 31, 2013 and March 31, 2013, respectively. Fee Earning AUM attributable to non-core products are expected to continue to decline as these funds run-off per their contractual terms. |
First Quarter Overview
CIFC reported ENI of $13.2 million for the first quarter of 2014, as compared to $5.7 million for the same period in the prior year. ENI increased period to period by $7.5 million or 133.0% primarily related to higher net investment income and incentive management fees. Net investment income increased primarily driven by an increase in net gains from our warehouse and CLO investments during the current quarter. Incentive management fees increased primarily driven by (i) the Company earning 50% of incentive fees realized on legacy CIFC CLOs (previously, all incentive fees were paid to CIFC Parent Holdings LLC ("CIFC Parent") in connection with the 2011 merger) and (ii) more CLOs reaching their incentive hurdles compared to the same period in the prior year.
CIFC reported GAAP net income attributable to CIFC Corp. of $0.2 million for the first quarter of 2014, as compared to $2.8 million in the same period of the prior year. The current quarter included a tax expense of approximately $6.4 million related to the write-down of deferred tax assets impacted by tax laws enacted by New York State on March 31, 2014, that are effective for tax years beginning on or after January 1, 2015. Excluding the income tax expense related to the change in New York State tax laws, GAAP operating results increased by $3.8 million from the prior year period primarily due to the increases in net investment income and incentive fees as noted above. The increases were offset by (i) increases in income tax expenses of $2.9 million due to higher pre-tax net income attributable to CIFC Corp. in the current quarter compared to the same quarter in the prior year and (ii) a decrease of $0.9 million primarily due to a reduction in revenues from fee sharing (GAAP presents fees gross of fee sharing) and non-core revenues.
Fee Earning AUM
Management fees earned from investment products the Company manages on behalf of third party investors are the Company's primary source of revenue. These fees typically consist of senior and subordinated management fees based on a percentage of the investment product's assets and, in some cases, incentive fees based on the returns the Company generates for investors in the products. Incentive fees are generally paid to the Company as funds mature when the relevant incentive return hurdles and certain other restrictions have been met.
The Company's total loan-based Fee Earning AUM was $12.3 billion as of March 31, 2014. During the first quarter, the Company sponsored the issuance of one new CLO and increased subscriptions to other loan-based products increasing Fee Earning AUM by approximately $647.7 million. New AUM was offset by declines in Fee Earning AUM for certain CLOs which have reached the end of their contractual reinvestment periods (after which capital is returned to investors as the loan assets underlying the CLOs repay principal).
3
The following table summarizes Fee Earning AUM for the Company's significant loan-based products (1):
March 31, 2014 | December 31, 2013 | March 31, 2013 | |||||||||||||||||||
(in thousands, except # of Products) | # of Products | Fee Earning AUM(2) | # of Products | Fee Earning AUM(2) | # of Products | Fee Earning AUM(2) | |||||||||||||||
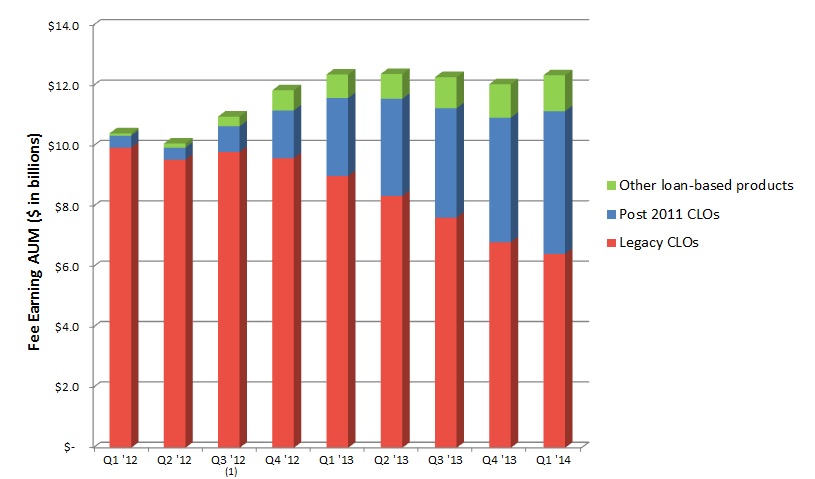
Post 2011 CLOs | 9 | $ | 4,732,728 | 8 | $ | 4,127,951 | 5 | $ | 2,585,214 | ||||||||||||
Legacy CLOs (3) | 19 | 6,423,605 | 20 | 6,811,382 | 27 | 9,004,131 | |||||||||||||||
Total CLOs | 28 | 11,156,333 | 28 | 10,939,333 | 32 | 11,589,345 | |||||||||||||||
Other loan-based products (4) | 6 | 1,189,120 | 6 | 1,106,526 | 2 | 780,288 | |||||||||||||||
AUM from loan-based products | 34 | $ | 12,345,453 | 34 | $ | 12,045,859 | 34 | $ | 12,369,633 | ||||||||||||
Explanatory Notes:
(1) | Table excludes Fee Earning AUM attributable to non-core products of $0.8 billion, $0.8 billion and $2.1 billion as of March 31, 2014, December 31, 2013 and March 31, 2013, respectively. Fee Earning AUM attributable to non-core products are expected to continue to decline as these funds run-off per their contractual terms. |
(2) | Fee Earning AUM generally reflects the aggregate principal or notional balance of the collateral and, in some cases, the cash balance held by the CLO as of the date of the last trustee report received for each CLO prior to the respective AUM date. |
(3) | Legacy CLOs represent all managed CLOs issued prior to 2011, including CLOs acquired since 2011 but issued prior to 2011. |
(4) | Other loan-based products management fee structures vary by fund and may not be similar to a CLO. |
Explanatory Note:
(1) | Increase in AUM on the Legacy CLOs is the result of the acquisition of the rights to manage four "Navigator" CLOs during September 2012. |
Total loan-based Fee Earning AUM activity for the three months ended March 31, 2014, December 31, 2013 and March 31, 2013 are as follows ($ in thousands):
1Q'14 | 4Q'13 | 1Q'13 | ||||||||
Opening AUM Balance | $ | 12,045,859 | $ | 12,280,555 | $ | 11,844,898 | ||||
CLO New Issuances | 600,462 | 501,689 | 1,001,334 | |||||||
CLO Principal Paydown | (381,516 | ) | (411,828 | ) | (412,412 | ) | ||||
CLO Calls, Redemptions and Sales | — | (385,911 | ) | (165,141 | ) | |||||
Fund Subscriptions | 47,188 | 105,950 | 122,597 | |||||||
Fund Redemptions | — | — | (10,354 | ) | ||||||
Other (1) | 33,460 | (44,596 | ) | (11,289 | ) | |||||
Ending AUM Balance | $ | 12,345,453 | $ | 12,045,859 | $ | 12,369,633 | ||||
Explanatory Note:
(1) | Other includes changes in collateral balances of CLOs between periods and market value changes in certain other loan-based products. |
4
Liquidity and Capital Resources
As of March 31, 2014, total deconsolidated non-GAAP cash and cash equivalents increased by $12.6 million to $34.0 million from $21.4 million as of December 31, 2013. For the three months ended March 31, 2014, cash flows from operations provided net cash proceeds of $17.5 million. Our net investment activity in CIFC managed CLO equity, warehouses and funds during the quarter was $3.0 million and we paid down $2.2 million of contingent liabilities (related to fee sharing arrangements).
Investments
Deconsolidated Non-GAAP (1) | March 31, 2014 | December 31, 2013 | ||||||
CIFC Managed CLO Equity (Residual Interests) | $ | 31,637 | $ | 44,292 | ||||
Warehouses (2) | 46,949 | 32,529 | ||||||
Other loan-based products (3) | 40,422 | 36,310 | ||||||
Total | $ | 119,008 | $ | 113,131 | ||||
Explanatory Notes:
(1) | Pursuant to GAAP, investments in consolidated CLOs, warehouses and certain other loan-based products are eliminated from "Investments at fair value" on our Consolidated Balance Sheets. See Appendix for a Reconciliation from GAAP to Non-GAAP - Consolidated Balance Sheets for further details. |
(2) | From time to time, the Company establishes “warehouses”, entities designed to accumulate investments in advance of sponsoring new CLOs or other funds managed by the Company. To establish a warehouse, the Company contributes equity capital to a newly formed entity which is typically levered (three to five times) and begins accumulating investments. When the related CLO or fund is sponsored, typically three to nine months later, the warehouse is “terminated”, with it concurrently repaying the related financing and returning to the Company its equity contribution, net of gains and losses, if any. |
(3) | As of March 31, 2014 and December 31, 2013, $24.4 million and $16.9 million, respectively, of our investments in funds was not consolidated and included on our Consolidated Balance Sheets. |
Excluding non-recourse variable interest entity ("VIE") debt, CIFC had $120.0 million of Junior Subordinated Notes which mature in 2035 and have a weighted average interest rate of LIBOR + 2.77% over the term of the loans. In addition, the Company's Convertible Notes have a face value of $25.0 million that are convertible into 4.1 million shares of common stock at $6.05 per share, maturing in 2017 and bearing a 10% coupon payable quarterly (with an effective interest rate of 18.14%) that will increase to 11% effective June 9, 2014. The Convertible Notes are redeemable at the Company's option on or after June 9, 2014 without prepayment penalty.
Non-GAAP Financial Measures
The Company discloses financial measures that are calculated and presented on a basis of methodology other than in accordance with generally accepted accounting principles of the United States of America (“Non-GAAP”) as follows:
ENI is a non-GAAP financial measure of profitability which management uses in addition to GAAP Net income attributable to CIFC Corp. to measure the performance of its core business (excluding non-core products). The Company believes ENI reflects the nature and substance of the business, the economic results driven by management fee revenues from the management of client funds and earnings on the Company's investments. ENI presents management fee revenues net of (i) any fee-sharing arrangements primarily resulting from mergers or acquisitions and (ii) revenues attributable to non-core investment products. In addition, ENI represents net income (loss) attributable to CIFC Corp. before taxes, gains (losses) on disposition(s) attributable to non-core assets, a portion of non-cash compensation related to profits interests granted by CIFC Parent in June 2011, amortization and impairments of intangible assets, gains/(losses) on derivatives and contingent liabilities and certain non-recurring operating expenses and strategic transaction expenses (such as those associated with mergers and acquisitions).
EBIT and ENI EBITDA are also non-GAAP financial measures that management considers, in addition to net income (loss) attributable to CIFC Corp., to evaluate the Company's core performance. ENI EBIT represents ENI before corporate interest expense and ENI EBITDA represents ENI EBIT before depreciation of fixed assets, a non-cash item.
5
ENI, ENI EBIT and ENI EBITDA may not be comparable to similar measures presented by other companies, as they are non-GAAP financial measures that are not based on a comprehensive set of accounting rules or principles and therefore may be defined differently by other companies. In addition, ENI, ENI EBIT and ENI EBITDA should be considered an addition to, not as a substitute for, or superior to, financial measures determined in accordance with GAAP.
A detailed calculation of ENI, ENI EBIT and ENI EBITDA and a reconciliation to the most comparable GAAP financial measure is included in the Appendix.
[Financial Tables to Follow in Appendix]
About CIFC
CIFC is a fundamentals-based, relative value credit manager. Headquartered in New York, CIFC is an SEC registered investment adviser and a publicly traded company (NASDAQ: CIFC). We currently serve over 200 institutional investors globally. For more information, please visit CIFC’s website at www.cifc.com.
Forward-Looking Statements
This release may contain forward-looking statements within the meaning of Section 27A of the Securities Act of 1933 and Section 21E of the Securities Exchange Act of 1934 which reflect CIFC's current views with respect to, among other things, CIFC's operations and financial performance. You can identify these forward-looking statements by the use of words such as “outlook,” “believes,” “expects,” “potential,” “continues,” “may,” “will,” “should,” “seeks,” “approximately,” “predicts,” “intends,” “plans,” “estimates,” “anticipates” or the negative version of these words or other comparable words. Such forward-looking statements are subject to various risks and uncertainties. Accordingly, there are or will be important factors that could cause actual outcomes or results to differ materially from those indicated in these statements. CIFC believes these factors include but are not limited to those described under the section entitled “Risk Factors” in its Annual Report on Form 10-K for the fiscal year ended December 31, 2013, as such factors may be updated from time to time in its periodic filings with the Securities and Exchange Commission, which are accessible on the SEC's website at www.sec.gov. These factors should not be construed as exhaustive and should be read in conjunction with the other cautionary statements that are included in this release and in the filings. CIFC undertakes no obligation to publicly update or review any forward-looking statement, whether as a result of new information, future developments or otherwise.
6
Appendix - Table of Contents
Ÿ | Summary reconciliation of GAAP net income (loss) attributable to CIFC Corp. to Non-GAAP measures (ENI, ENI EBIT and ENI EBITDA) for the Three Months Ended March 31, 2014 and 2013 (unaudited) |
Ÿ | Reconciliation of GAAP to Non-GAAP measures (GAAP basis Statements of Operations are adjusted to exclude the consolidation of VIEs) for the Three Months Ended March 31, 2014 and 2013 (unaudited) |
Ÿ | Reconciliation of GAAP to Non-GAAP measures (GAAP basis Balance Sheets are adjusted to exclude the consolidation of VIEs) as of March 31, 2014 and December 31, 2013 (unaudited) |
7
Appendix
Summary Reconciliation of GAAP Net income (loss) attributable to CIFC Corp. to Non-GAAP Measures (unaudited)
(In thousands) (unaudited) | 1Q'14 | 1Q'13 | ||||
GAAP Net income (loss) attributable to CIFC Corp. | $ | 235 | $ | 2,787 | ||
Management fee sharing arrangements (1) | (2,645 | ) | (4,210 | ) | ||
Management fees attributable to non-core funds (2) | (241 | ) | (542 | ) | ||
Compensation costs (3) | 512 | 1,098 | ||||
Amortization and impairment of intangibles | 2,909 | 4,049 | ||||
Net (gain)/loss on contingent liabilities and other (4) | 229 | 114 | ||||
Gain on sales of contracts (5) | (228 | ) | (752 | ) | ||
Income tax expense (benefit) | 12,404 | 3,110 | ||||
Total reconciling and non-recurring items | 12,940 | 2,867 | ||||
ENI | $ | 13,175 | $ | 5,654 | ||
Add: Corporate interest expense | 1,467 | 1,482 | ||||
ENI EBIT | $ | 14,642 | $ | 7,136 | ||
Add: Depreciation of fixed assets | 236 | 169 | ||||
ENI EBITDA | $ | 14,878 | $ | 7,305 | ||
Explanatory Notes:
(1) | The Company shares management fees on certain of the CLOs it manages (for example, management fees on certain acquired funds are shared with the party that sold the funds to CIFC). Management fees are presented on a gross basis for GAAP and on a net basis for Non-GAAP ENI. |
(2) | Current year ENI calculation includes the reduction attributable to non-core management fees. Prior year ENI calculation has been adjusted to conform with the current year's calculation. |
(3) | Compensation has been adjusted for non-cash compensation related to profits interests granted to CIFC employees by CIFC Parent and sharing of incentive fees with certain former employees established in connection with the Company's acquisition of certain CLOs from Columbus Nova Credit Investments Management, LLC ("CNCIM"). |
(4) | Adjustment primarily includes the elimination of gains (losses) on contingent liabilities during the respective periods. |
(5) | In January 2012, the Company completed the sale of its right to manage Gillespie CLO PLC. The Company recognized additional gains from contingent payments collected during 2014 and 2013. |
8
Reconciliation from GAAP to Non-GAAP Measures - Consolidated Statements of Operations (unaudited) (1)
1Q'14 | 1Q'13 | |||||||||||||||||||||||
(In thousands) (unaudited) | Consolidated GAAP | Consolidation Adjustments | Deconsolidated Non-GAAP | Consolidated GAAP | Consolidation Adjustments | Deconsolidated Non-GAAP | ||||||||||||||||||
Revenues | ||||||||||||||||||||||||
Management fees | $ | 1,612 | $ | 20,243 | $ | 21,855 | $ | 2,642 | $ | 18,155 | $ | 20,797 | ||||||||||||
Net investment income | 97 | 5,899 | 5,996 | (9 | ) | 1,098 | 1,089 | |||||||||||||||||
Total net revenues | 1,709 | 26,142 | 27,851 | 2,633 | 19,253 | 21,886 | ||||||||||||||||||
Expenses | ||||||||||||||||||||||||
Compensation and benefits | 7,340 | — | 7,340 | 7,524 | — | 7,524 | ||||||||||||||||||
Professional services | 1,046 | — | 1,046 | 1,923 | — | 1,923 | ||||||||||||||||||
General and administrative expenses | 2,213 | — | 2,213 | 1,483 | — | 1,483 | ||||||||||||||||||
Depreciation and amortization | 3,145 | — | 3,145 | 4,218 | — | 4,218 | ||||||||||||||||||
Total expenses | 13,744 | — | 13,744 | 15,148 | — | 15,148 | ||||||||||||||||||
Other Income (Expense) and Gain (Loss) | ||||||||||||||||||||||||
Net gain (loss) on investments at fair value | 1,406 | (1,406 | ) | — | 349 | (349 | ) | — | ||||||||||||||||
Net gain (loss) on contingent liabilities at fair value | (229 | ) | — | (229 | ) | (114 | ) | — | (114 | ) | ||||||||||||||
Corporate interest expense | (1,467 | ) | — | (1,467 | ) | (1,482 | ) | — | (1,482 | ) | ||||||||||||||
Net gain on the sale of management contracts | 228 | — | 228 | 752 | — | 752 | ||||||||||||||||||
Other, net | — | — | — | 3 | — | 3 | ||||||||||||||||||
Net other income (expense) and gain (loss) | (62 | ) | (1,406 | ) | (1,468 | ) | (492 | ) | (349 | ) | (841 | ) | ||||||||||||
Operating income (loss) | (12,097 | ) | 24,736 | 12,639 | (13,007 | ) | 18,904 | 5,897 | ||||||||||||||||
Net results of Consolidated Entities | 49,082 | (49,082 | ) | — | 47,058 | (47,058 | ) | — | ||||||||||||||||
Income (loss) before income taxes | 36,985 | (24,346 | ) | 12,639 | 34,051 | (28,154 | ) | 5,897 | ||||||||||||||||
Income tax (expense) benefit | (12,404 | ) | — | (12,404 | ) | (3,110 | ) | — | (3,110 | ) | ||||||||||||||
Net income (loss) | 24,581 | (24,346 | ) | 235 | 30,941 | (28,154 | ) | 2,787 | ||||||||||||||||
Net (income) loss attributable to noncontrolling interest in Consolidated Entities | (24,346 | ) | 24,346 | — | (28,154 | ) | 28,154 | — | ||||||||||||||||
Net income (loss) attributable to CIFC Corp. | $ | 235 | $ | — | $ | 235 | $ | 2,787 | $ | — | $ | 2,787 | ||||||||||||
Explanatory Note:
(1) | The Consolidated Statements of Operations have been adjusted to present on a deconsolidated non-GAAP basis, which eliminates the impact of Consolidated Funds (including VIEs). Management uses these statements in addition to GAAP to measure the performance of its core business. |
9
Reconciliation from GAAP to Non-GAAP - Consolidated Balance Sheets (unaudited) (1)
March 31, 2014 | December 31, 2013 | |||||||||||||||||||||||
(In thousands) (unaudited) | GAAP | Consolidation Adjustments | Deconsolidated Non-GAAP | GAAP | Consolidation Adjustments | Deconsolidated Non-GAAP | ||||||||||||||||||
Assets | ||||||||||||||||||||||||
Cash and cash equivalents | $ | 33,995 | $ | — | $ | 33,995 | $ | 25,497 | $ | (4,132 | ) | $ | 21,365 | |||||||||||
Restricted cash and cash equivalents | 1,692 | — | 1,692 | 1,700 | — | 1,700 | ||||||||||||||||||
Due from brokers | 431 | 5,980 | 6,411 | 18,813 | (4,985 | ) | 13,828 | |||||||||||||||||
Investments at fair value | 24,371 | 94,637 | 119,008 | 16,883 | 96,248 | 113,131 | ||||||||||||||||||
Receivables | 1,726 | 3,695 | 5,421 | 2,120 | 3,814 | 5,934 | ||||||||||||||||||
Prepaid and other assets | 4,360 | — | 4,360 | 5,104 | (222 | ) | 4,882 | |||||||||||||||||
Deferred tax asset, net | 50,839 | — | 50,839 | 57,675 | — | 57,675 | ||||||||||||||||||
Equipment and improvements, net | 4,397 | — | 4,397 | 4,261 | — | 4,261 | ||||||||||||||||||
Intangible assets, net | 22,315 | — | 22,315 | 25,223 | — | 25,223 | ||||||||||||||||||
Goodwill | 76,000 | — | 76,000 | 76,000 | — | 76,000 | ||||||||||||||||||
Subtotal | 220,126 | 104,312 | 324,438 | 233,276 | 90,723 | 323,999 | ||||||||||||||||||
Total assets of Consolidated Entities | 11,988,090 | (11,988,090 | ) | — | 11,366,912 | (11,366,912 | ) | — | ||||||||||||||||
Total Assets | $ | 12,208,216 | $ | (11,883,778 | ) | $ | 324,438 | $ | 11,600,188 | $ | (11,276,189 | ) | $ | 323,999 | ||||||||||
Liabilities | ||||||||||||||||||||||||
Due to brokers | $ | 4,154 | $ | — | $ | 4,154 | $ | 5,499 | $ | (4,991 | ) | $ | 508 | |||||||||||
Dividend payable | 2,089 | — | 2,089 | — | — | — | ||||||||||||||||||
Accrued and other liabilities | 12,431 | — | 12,431 | 15,197 | (270 | ) | 14,927 | |||||||||||||||||
Deferred purchase payments | 1,263 | — | 1,263 | 1,179 | — | 1,179 | ||||||||||||||||||
Contingent liabilities at fair value | 14,974 | — | 14,974 | 16,961 | — | 16,961 | ||||||||||||||||||
Long-term debt | 139,425 | — | 139,425 | 139,164 | — | 139,164 | ||||||||||||||||||
Subtotal | 174,336 | — | 174,336 | 178,000 | (5,261 | ) | 172,739 | |||||||||||||||||
Total non-recourse liabilities of Consolidated Entities | 11,567,742 | (11,567,742 | ) | — | 11,114,435 | (11,114,435 | ) | — | ||||||||||||||||
Total Liabilities | 11,742,078 | (11,567,742 | ) | 174,336 | 11,292,435 | (11,119,696 | ) | 172,739 | ||||||||||||||||
Equity | ||||||||||||||||||||||||
Common stock | 21 | — | 21 | 21 | — | 21 | ||||||||||||||||||
Treasury stock | (914 | ) | — | (914 | ) | (914 | ) | — | (914 | ) | ||||||||||||||
Additional paid-in capital | 963,707 | — | 963,707 | 963,011 | — | 963,011 | ||||||||||||||||||
Retained earnings (deficit) | (812,712 | ) | — | (812,712 | ) | (810,858 | ) | — | (810,858 | ) | ||||||||||||||
Total CIFC Corp. Stockholder's Equity | 150,102 | — | 150,102 | 151,260 | — | 151,260 | ||||||||||||||||||
Non-controlling interest in Consolidated Funds | 140,500 | (140,500 | ) | — | 5,107 | (5,107 | ) | — | ||||||||||||||||
Appropriated retained earnings (deficit) of Consolidated Entities | 175,536 | (175,536 | ) | — | 151,386 | (151,386 | ) | — | ||||||||||||||||
Total Equity | 466,138 | (316,036 | ) | 150,102 | 307,753 | (156,493 | ) | 151,260 | ||||||||||||||||
Total Liabilities and Stockholders' Equity | $ | 12,208,216 | $ | (11,883,778 | ) | $ | 324,438 | $ | 11,600,188 | $ | (11,276,189 | ) | $ | 323,999 | ||||||||||
Explanatory Note:
(1) | The Consolidated Balance Sheets have been adjusted to present a deconsolidated non-GAAP statements, which eliminates the impact of Consolidated Funds (including VIEs). Management uses these statements in addition to GAAP to measure the performance of its core business. |
10