Attached files
| file | filename |
|---|---|
| 8-K - 8-K - BNC BANCORP | form8-kforgulfsouth.htm |
GULF SOUTH BANK CONFERENCE MAY 2014
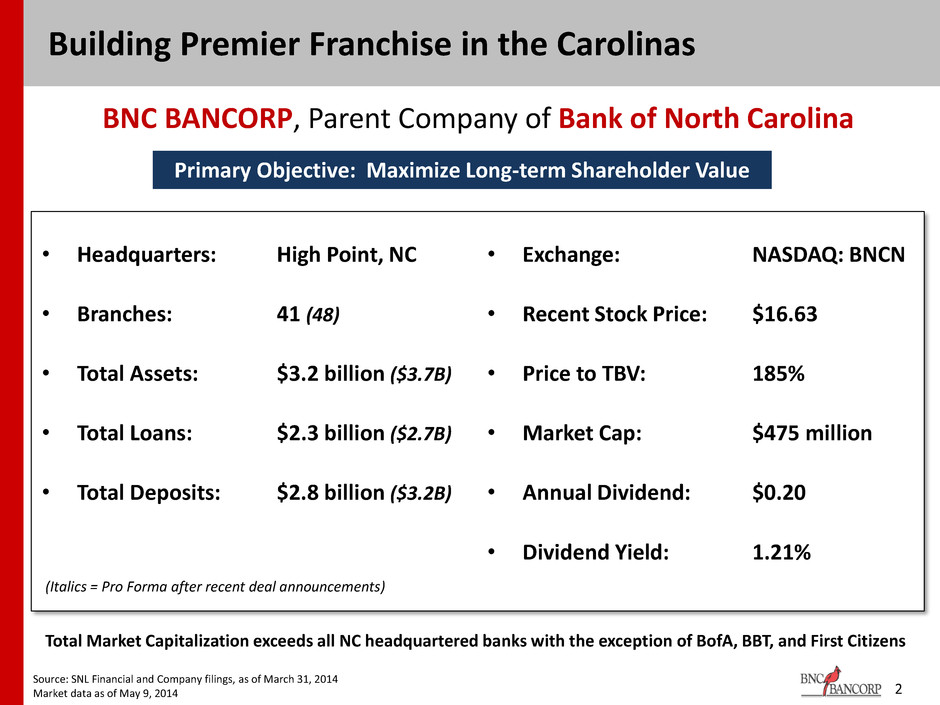
• Headquarters: • Branches: • Total Assets: • Total Loans: • Total Deposits: High Point, NC 41 (48) $3.2 billion ($3.7B) $2.3 billion ($2.7B) $2.8 billion ($3.2B) Building Premier Franchise in the Carolinas • Exchange: • Recent Stock Price: • Price to TBV: • Market Cap: • Annual Dividend: • Dividend Yield: NASDAQ: BNCN $16.63 185% $475 million $0.20 1.21% BNC BANCORP, Parent Company of Bank of North Carolina 2 Total Market Capitalization exceeds all NC headquartered banks with the exception of BofA, BBT, and First Citizens Primary Objective: Maximize Long-term Shareholder Value Source: SNL Financial and Company filings, as of March 31, 2014 Market data as of May 9, 2014 (Italics = Pro Forma after recent deal announcements)

• Attractive franchise concentrated in growth markets in the Carolinas – Pro forma, 4th largest bank headquartered in North Carolina • June 2013 addition to Russell Index ― Daily average trading volume: 55,000 shares, over $1 million daily float ― Pro forma, $500 million market cap • Proven acquirer – Ten completed acquisitions, both whole bank and FDIC-assisted – Two recently announced acquisitions, one closed in first quarter and one pending • Sophisticated and disciplined leadership – Executive team in place since inception • Strong momentum with substantial earnings upside – Balance sheet growth and core earnings power; 3-, 5-, and 10-year CAGR of 20%+ – Significant drivers of future earnings phasing in during 2014 and 2015 – Profitable every year since 1994 • Regulatory endorsement 3 Investment Thesis

Well Managed Banking Franchise in High-Growth Markets Throughout the Carolinas Five Year Plan – Strategic and Opportunistic Execution 4 Reward Shareholders Grow Earnings Capitalize on the crisis with FDIC and non-FDIC bank deals Recruit additional and retain existing talent Fortify Balance Sheet Management has built and executed a successful strategy to ultimately reward shareholders

The Results
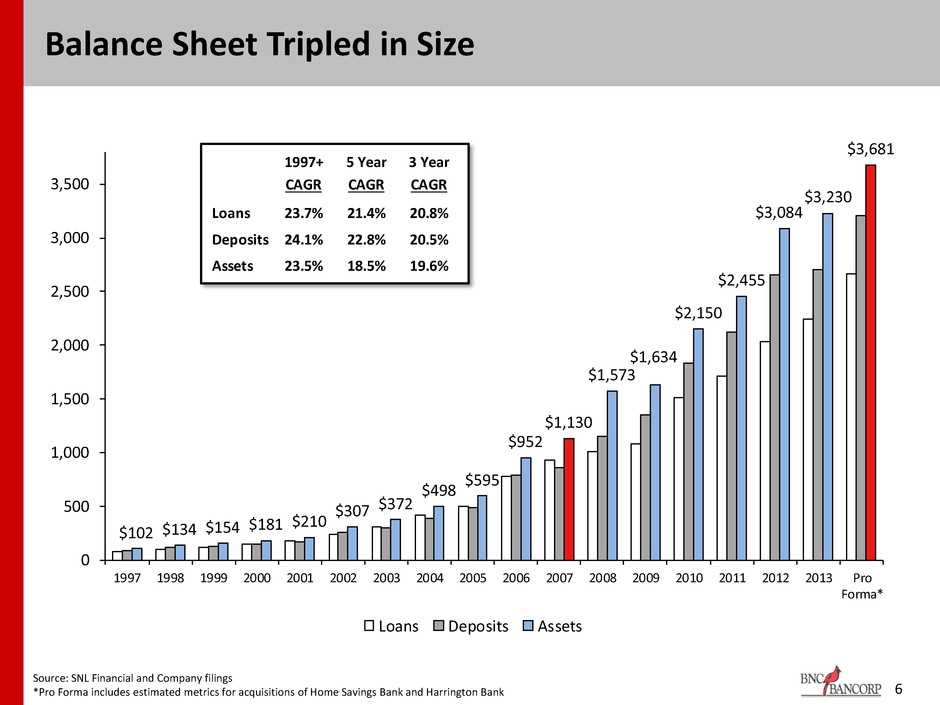
$102 $134 $154 $181 $210 $307 $372 $498 $595 $952 $1,130 $1,573 $1,634 $2,150 $2,455 $3,084 $3,230 $3,681 0 500 1,000 1,500 2,000 2,500 3,000 3,500 1997 1998 1999 2000 2001 2002 2003 2004 2005 2006 2007 2008 2009 2010 2011 2012 2013 Pro Forma* Loans Deposits Assets Source: SNL Financial and Company filings *Pro Forma includes estimated metrics for acquisitions of Home Savings Bank and Harrington Bank 6 Balance Sheet Tripled in Size 1997+ 5 Year 3 Year CAGR CAGR CAGR Loans 23.7% 21.4% 20.8% Deposits 24.1% 22.8% 20.5% Assets 23.5% 18.5% 19.6%

7 Rapid Acceleration in Operating Earnings Pre-Tax, Pre-Credit Earnings 0 10,000 20,000 30,000 40,000 50,000 60,000 2008 2009 2010 2011 2012 2013 2014Q1* Source: SNL Financial and Company filings Pre-tax, pre-credit FTE earnings is calculated as net income before taxes, before provision for loan losses, net of merger-related expenses, bargain purchase gains, and gains/losses on sales of investments *Shown on an annualized basis
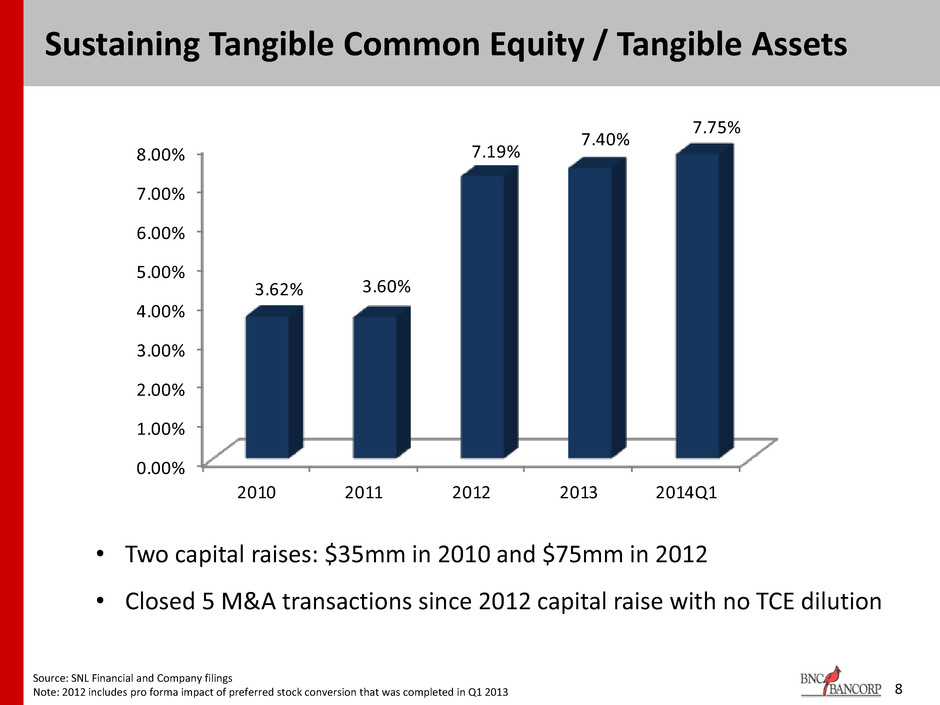
8 Sustaining Tangible Common Equity / Tangible Assets • Two capital raises: $35mm in 2010 and $75mm in 2012 • Closed 5 M&A transactions since 2012 capital raise with no TCE dilution Source: SNL Financial and Company filings Note: 2012 includes pro forma impact of preferred stock conversion that was completed in Q1 2013 0.00% 1.00% 2.00% 3.00% 4.00% 5.00% 6.00% 7.00% 8.00% 2010 2011 2012 2013 2014Q1 3.62% 3.60% 7.19% 7.40% 7.75%
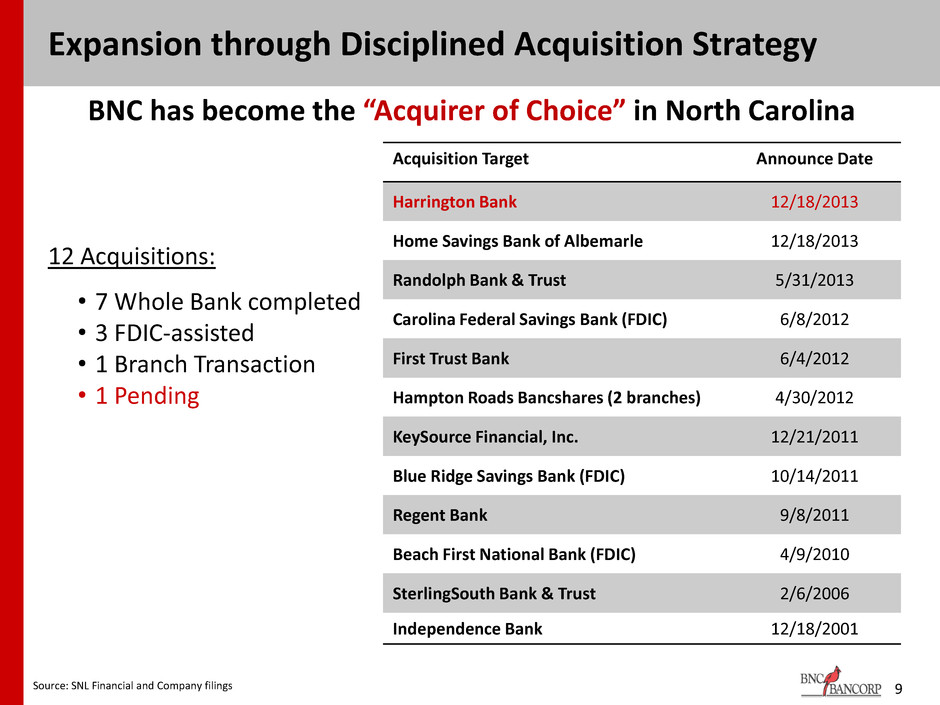
Expansion through Disciplined Acquisition Strategy Source: SNL Financial and Company filings 12 Acquisitions: • 7 Whole Bank completed • 3 FDIC-assisted • 1 Branch Transaction • 1 Pending Acquisition Target Announce Date Harrington Bank 12/18/2013 Home Savings Bank of Albemarle 12/18/2013 Randolph Bank & Trust 5/31/2013 Carolina Federal Savings Bank (FDIC) 6/8/2012 First Trust Bank 6/4/2012 Hampton Roads Bancshares (2 branches) 4/30/2012 KeySource Financial, Inc. 12/21/2011 Blue Ridge Savings Bank (FDIC) 10/14/2011 Regent Bank 9/8/2011 Beach First National Bank (FDIC) 4/9/2010 SterlingSouth Bank & Trust 2/6/2006 Independence Bank 12/18/2001 BNC has become the “Acquirer of Choice” in North Carolina 9
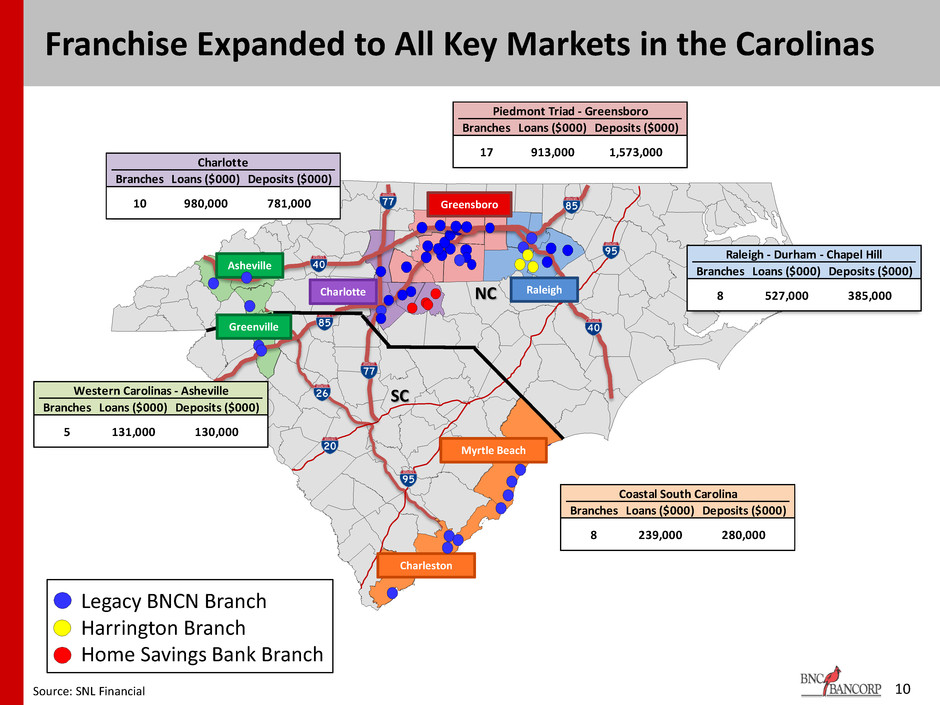
10 Franchise Expanded to All Key Markets in the Carolinas NC SC Charlotte Greensboro Raleigh Myrtle Beach Charleston Greenville Asheville Legacy BNCN Branch Harrington Branch Home Savings Bank Branch Source: SNL Financial Charlotte Branches Loans ($000) Deposits ($000) 10 980,000 781,000 Piedmont Triad - Greensboro Branches Loans ($000) Deposits ($000) 17 913,000 1,573,000 Raleigh - Durham - Chapel Hill Branches Loans ($000) Deposits ($000) 8 527,000 385,000 Coastal South Carolina Branches Loans ($000) Deposits ($000) 8 239,000 280,000 Western Carolinas - Asheville Branches Loans ($000) Deposits ($000) 5 131,000 130,000

11 Attractive Markets • 3+ million people to be added in NC by 2030; over 1 million in SC • NC is the #1 state for corporate relocations and has been for the past 8 of 9 years • Current footprint reaches key locations in both NC and SC • In 11 of the top 15 cities in North Carolina • In 5 of the top 10 cities in South Carolina • NC’s two largest metro areas, Charlotte and the Triangle, account for nearly 70% of new jobs statewide Sources: US Census Bureau and Charlotte Business Journal, April 2014 0% 10% 20% 30% 40% 50% 60% 70% 1990s Mid-2000s 2010+ Durham Raleigh Charlotte Share of Employment Gains in NC (%)
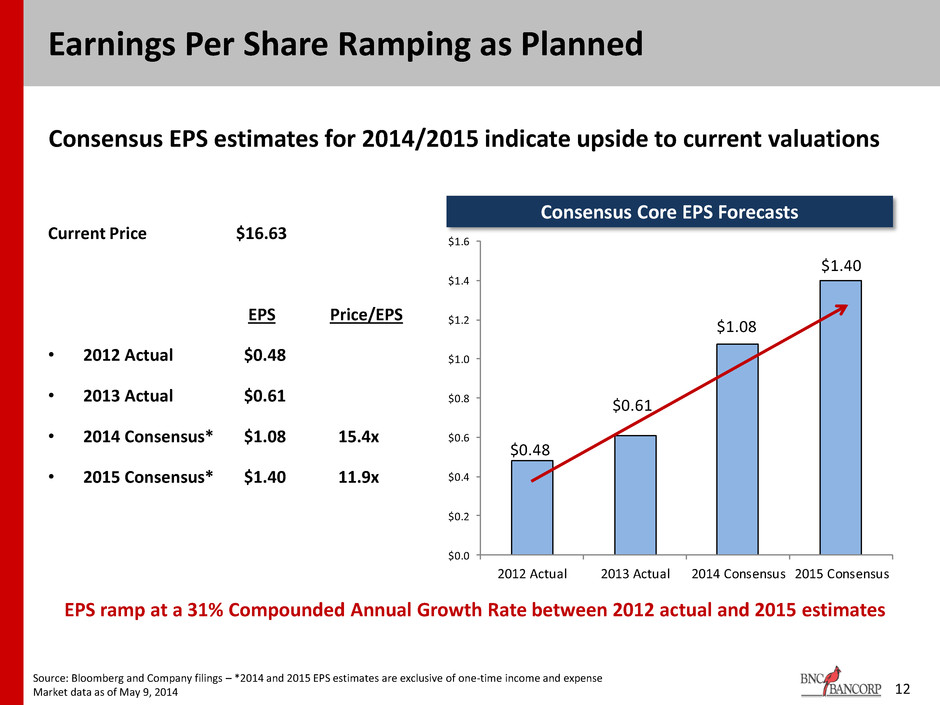
Earnings Per Share Ramping as Planned Current Price $16.63 EPS Price/EPS • 2012 Actual $0.48 • 2013 Actual $0.61 • 2014 Consensus* $1.08 15.4x • 2015 Consensus* $1.40 11.9x Consensus EPS estimates for 2014/2015 indicate upside to current valuations Source: Bloomberg and Company filings – *2014 and 2015 EPS estimates are exclusive of one-time income and expense Market data as of May 9, 2014 12 EPS ramp at a 31% Compounded Annual Growth Rate between 2012 actual and 2015 estimates Consensus Core EPS Forecasts $0.48 $0.61 $1.08 $1.40 $0.0 $0.2 $0.4 $0.6 $0.8 $1.0 $1.2 $1.4 $1.6 2012 Actual 2013 Actual 2014 Consensus 2015 Consensus

13 Investment in Talent to Support Growth • Chief Information and Operations Officer • Chief Enterprise Risk Officer • Director of Human Resources • Director of Marketing • Chief Accounting Officer • Director of Mortgage Banking • Four Regional Presidents • Director of Wealth, Private Banking, and Business Services • Director of Retail Banking Conversion and Integration • Director of Internal Audit • Seasoned Director of Special Assets • CRE, Single Family, and C&I Credit Specialists • Controller of Mortgage Division • Accounting Policy and SEC Reporting Manager • ALCO Monitoring and Balance Sheet Strategist Risk and Reporting • Conversion and Merger Integration Project Coordinator • Internal Performance Manager • Loss Share/ Fair Value Loan Reporting Specialist •Merger, Conversion and Integration Team Leadership and Management

Recent Acquisitions

15 Recently Announced Transaction Benefits Three branches in Dynamic Chapel Hill Market (Raleigh-Durham-Chapel Hill CSA) Four branches in Metro Charlotte Market (Charlotte-Concord CSA) Low-cost core deposit base (approx. 39 bps) 100+ year old franchise with 100% core deposits Over 32% in non-interest bearing DDA Loan portfolio – over 70% retail Additional $200 million of deposits in Raleigh- Durham-Chapel Hill area, bringing total region to $385 million Additional $235 million of deposits in Metro- Charlotte, bringing total region to $725 million Combined transactions 12%+ accretive to 2015 EPS* Tangible Book Value earnback inside 1.5 years* Parent: Community First Financial Group, Inc. Parent: South Street Financial Corp. – OTCQB: SSFC *Does not include fair value accretion or revenue synergies
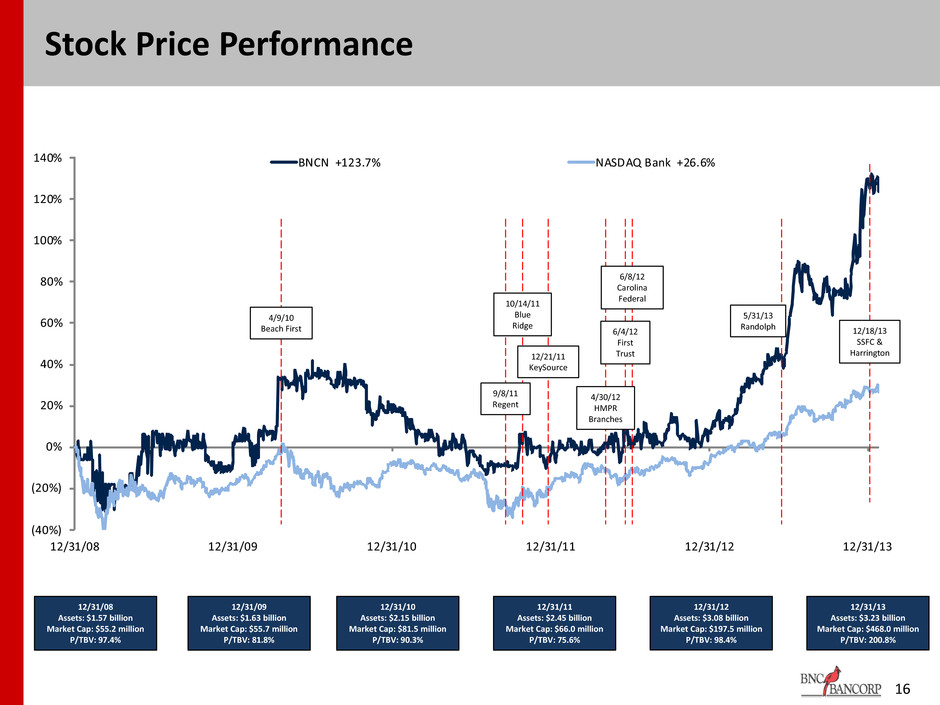
16 Stock Price Performance 12/31/08 Assets: $1.57 billion Market Cap: $55.2 million P/TBV: 97.4% 12/31/09 Assets: $1.63 billion Market Cap: $55.7 million P/TBV: 81.8% 12/31/10 Assets: $2.15 billion Market Cap: $81.5 million P/TBV: 90.3% 12/31/11 Assets: $2.45 billion Market Cap: $66.0 million P/TBV: 75.6% 12/31/12 Assets: $3.08 billion Market Cap: $197.5 million P/TBV: 98.4% 12/31/13 Assets: $3.23 billion Market Cap: $468.0 million P/TBV: 200.8% (40%) (20%) 0% 20% 40% 60% 80% 100% 120% 140% 12/31/08 12/31/09 12/31/10 12/31/11 12/31/12 12/31/13 BNCN +123.7% NASDAQ Bank +26.6% 9/8/11 Regent 12/21/11 KeySource 6/4/12 First Trust 5/31/13 Randolph 12/18/13 SSFC & Harrington 4/30/12 HMPR Branches 6/8/12 Carolina Federal 10/14/11 Blue Ridge 4/9/10 Beach First

$6.74 $7.43 $16.34 $6.86 $7.56 $16.63 0.00 2.00 4.00 6.00 8.00 10.00 12.00 14.00 16.00 18.00 Announce Date Completion Date Today $7.53 $8.62 $16.92 $7.40 $8.47 $16.63 0.00 2.00 4.00 6.00 8.00 10.00 12.00 14.00 16.00 18.00 Announce Date Completion Date Today + 125% $10.00 $12.33 $15.38 $10.81 $13.33 $16.63 0.00 2.00 4.00 6.00 8.00 10.00 12.00 14.00 16.00 18.00 Announce Date Completion Date Today + 54% + 142% 12/21/11 9/14/12 6/4/12 11/30/12 5/31/13 10/1/13 BNC Bancorp’s Acquisition of Randolph Bank & Trust 17 Recent Acquisitions: Deal Value Per Share BNC Bancorp’s Acquisition of KeySource BNC Bancorp’s Acquisition of First Trust Source: SNL Financial, data as of May 9, 2014 Deal Value per Share Closing Stock Price

18 Recent Acquisitions: Deal Value Per Share BNC Bancorp’s Acquisition of SouthStreet Financial BNC Bancorp’s Acquisition of Community First Financial Source: SNL Financial, data as of May 9, 2014 Deal Value per Share Closing Stock Price $8.85 $9.98 $15.51 $16.63 0.00 2.00 4.00 6.00 8.00 10.00 12.00 14.00 16.00 18.00 20.00 Announce Date Today $5.90 $6.72 $15.51 $16.63 0.00 2.00 4.00 6.00 8.00 10.00 12.00 14.00 16.00 18.00 20.00 Announce Date Today + 14% + 13% 12/18/13 12/18/13

0 200,000 400,000 600,000 800,000 1,000,000 1,200,000 1,400,000 1,600,000 1,800,000 2009 2010 2011 2012 2013 To tal Lo an s ( $m m) 19 Strong Organic Loan Growth Source: Company filings Note: Originated Loans is calculated as total net loans reported at year end less the fair value of loans acquired as reported by BNC at year end. + 56% Originated Loans 2009 - 2013

Financial Appendix

Note: Excludes bargain purchase gains 21 Source: SNL Financial and Company filings, as of March 31, 2014 Regional peers include banks in NC, SC, and VA with total assets between $1.0bn and $5.0bn Performance Metrics Net Interest Margin Efficiency Ratio Non Interest Income / Total Assets 3.93% 3.85% 4.29% 4.61% 3.20% 3.40% 3.60% 3.80% 4.00% 4.20% 4.40% 4.60% 4.80% 2011Y 2012Y 2013Y 2014Q1 BNCN Regional Peers 76.2% 77.1% 70.7% 65.5% 50.00% 55.00% 60.00% 65.00% 70.00% 75.00% 80.00% 2011Y 2012Y 2013Y 2014Q1 BNCN Regional Peers 0.53% 0.66% 0.71% 0.65% 0.00% 0.20% 0.40% 0.60% 0.80% 1.00% 1.20% 1.40% 1.60% 2011Y 2012Y 2013Y 2014Q1 BNCN Regional Peers
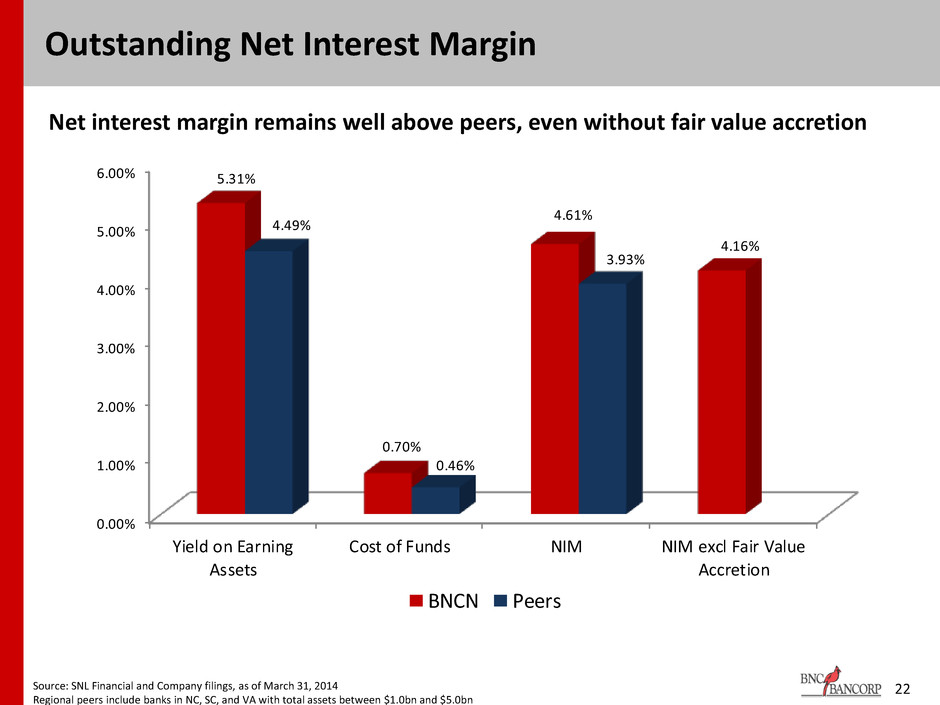
22 Outstanding Net Interest Margin 0.00% 1.00% 2.00% 3.00% 4.00% 5.00% 6.00% Yield on Earning Assets Cost of Funds NIM NIM excl Fair Value Accretion 5.31% 0.70% 4.61% 4.16% 4.49% 0.46% 3.93% BNCN Peers Net interest margin remains well above peers, even without fair value accretion Source: SNL Financial and Company filings, as of March 31, 2014 Regional peers include banks in NC, SC, and VA with total assets between $1.0bn and $5.0bn

23 Improving Funding Mix Funding Mix: 2008 – 2014 Funding Mix: Change from 2011 • Improving overall funding mix ― Increases in NIB and IB demand deposits ― Reduction in wholesale borrowings, decreasing both brokered time deposits and FHLB advances • As balance sheet grows, wholesale borrowings as a percent of total assets continues to decline • Demand deposits as a percent of total assets has grown from 43% to 53% since 2011 Source: SNL Financial and Company filings, as of March 31, 2014 for bank level only *Pro forma includes acquisitions of Home Savings Bank and Harrington Bank Noninterest Bearing Demand Interest Bearing Demand Brokered Time Deposits Retail Time Deposits FHLB Advances 0 500,000 1,000,000 1,500,000 2,000,000 2,500,000 3,000,000 2008 2009 2010 2011 2012 2013 2014Q1 Pro Forma FHLB Brokered Time Retail Time IB Demand NIB Demand Pro Forma* December 31, 2011 Balance % of Balance % of ($000) Total Assets ($000) Total Assets Change NIB Demand 429,911 11.6% 146,988 6.0% +5.6% IB Demand 1,526,109 41.2% 908,989 37.0% +4.3% Retail Time 365,920 9.9% 163,050 6.6% +3.3% Brokered Time 858,477 23.2% 899,972 36.7% -13.5% FHLB Advances 65,991 1.8% 117,000 4.8% -3.1% Total Assets 3,704,243 2,453,584

Constr & Land Dev 11.2% 1-4 Family 14.9% HE Lines 6.8% Multifamily 2.9% Comm RE & Farm 55.7% C&I 7.0% Consumer 0.6% Other Non-RE 0.9% Constr & Land Dev 11.1% 1-4 Family 19.4% HE Lines 7.7% Multifamily 2.8% Comm RE & Farm 50.8% C&I 6.8% Consumer 0.6% Other Non-RE 0.8% Loan Mix BNCN (As of March 31, 2014) Pro Forma with Recent Acquisitions (Estimated) 24 Source: Internal company documents Concentration of CRE loans is expected to decrease to 50.8% from 55.7% Almost 20% of the portfolio is projected to be 1-4 family loans, up from 15.9%
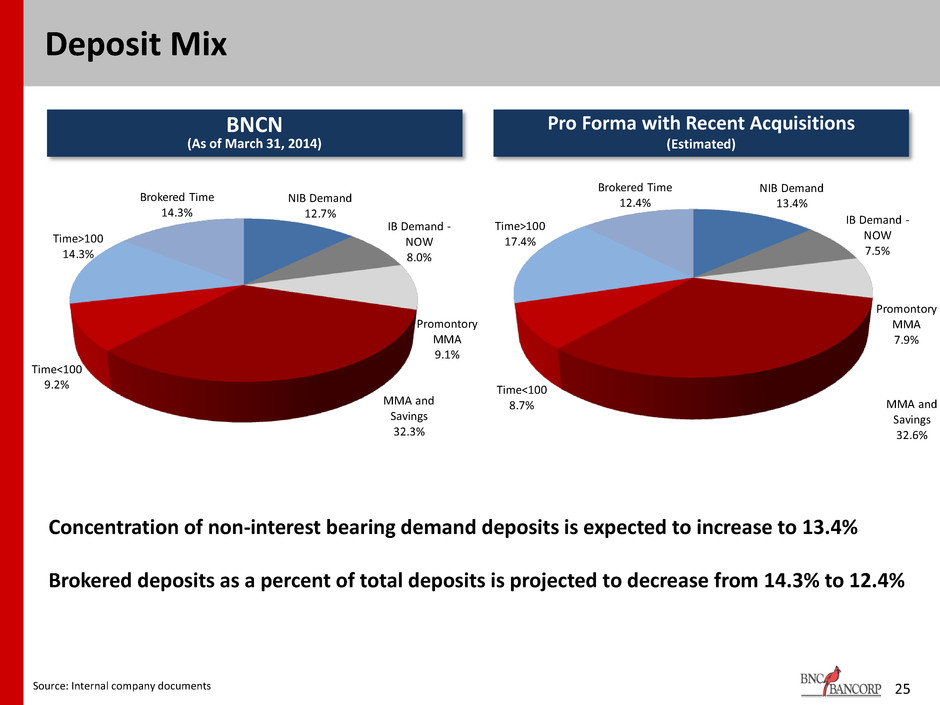
Deposit Mix BNCN (As of March 31, 2014) Pro Forma with Recent Acquisitions (Estimated) 25 Source: Internal company documents Concentration of non-interest bearing demand deposits is expected to increase to 13.4% Brokered deposits as a percent of total deposits is projected to decrease from 14.3% to 12.4% NIB Demand 13.4% IB Demand - NOW 7.5% Promontory MMA 7.9% MMA and Savings 32.6% Time<100 8.7% Time>100 17.4% Brokered Time 12.4%NIB Demand 12.7% IB Demand - NOW 8.0% Promontory MMA 9.1% MMA and Savings 32.3% Time<100 9.2% Time>100 14.3% Brokered Time 14.3%

26 Forward Looking Statements This presentation contains certain forward-looking information about BNC Bancorp and subsidiaries (collectively, “BNCN”) that is intended to be covered by the safe harbor for “forward-looking statements” provided by the Private Securities Litigation Reform Act of 1995. All statements other than statements of historical fact, are forward-looking statements. In some cases, you can identify forward-looking statements by words such as “may,” “hope,” “will,” “should,” “expect,” “plan,” “anticipate,” “intend,” “believe,” “estimate,” “predict,” “potential,” “continue,” “could,” “future” or the negative of those terms or other words of similar meaning. You should carefully read forward-looking statements, including statements that contain these words, because they discuss the future expectations or state other “forward-looking” information about BNCN. Such statements involve inherent risks and uncertainties, many of which are difficult to predict and are generally beyond the control of BNCN. Forward-looking statements speak only as of the date they are made and BNCN assumes no duty to update such statements. In addition to factors previously disclosed in reports filed by BNCN with the Securities and Exchange Commission (“SEC”), additional risks and uncertainties may include, but are not limited to: the possibility that any of the anticipated benefits of the proposed mergers will not be realized or will not be realized within the expected time period; the risk that integration of operations with those of BNCN will be materially delayed or will be more costly or difficult than expected; the inability to complete the mergers due to the failure of shareholder approval to adopt the respective merger agreements; the failure to satisfy other conditions to completion of the mergers, including receipt of required regulatory and other approvals; the failure of the proposed mergers to close for any other reason; the effect of the announcement of the mergers on customer relationships and operating results; the possibility that the mergers may be more expensive to complete than anticipated, including as a result of unexpected factors or events; and general competitive, economic, political and market conditions and fluctuations. As stated previously, additional factors affecting BNCN are discussed in BNCN’s Annual Report on Form 10-K, its Quarterly Reports on Form 10-Q and its Current Reports on Form 8-K, filed with the SEC. Please refer to the SEC’s website at www.sec.gov where you can review those documents.

