Attached files
| file | filename |
|---|---|
| 8-K - 8-K - Braemar Hotels & Resorts Inc. | ahp2014annualmeetingpresen.htm |

1 Annual Shareholder Meeting – May 2014

Safe Harbor 2 In keeping with the SEC's "Safe Harbor" guidelines, certain statements made during this presentation could be considered forward-looking and subject to certain risks and uncertainties that could cause results to differ materially from those projected. When we use the words "will likely result," "may," "anticipate," "estimate," "should," "expect," "believe," "intend," or similar expressions, we intend to identify forward-looking statements. Such forward-looking statements include, but are not limited to, our business and investment strategy, our understanding of our competition, current market trends and opportunities, projected operating results, and projected capital expenditures. These forward-looking statements are subject to known and unknown risks and uncertainties, which could cause actual results to differ materially from those anticipated including, without limitation: general volatility of the capital markets and the market price of our common stock; changes in our business or investment strategy; availability, terms and deployment of capital; availability of qualified personnel; changes in our industry and the market in which we operate, interest rates or the general economy, and the degree and nature of our competition. These and other risk factors are more fully discussed in the Company's filings with the Securities and Exchange Commission. Historical results are not indicative of future performance. EBITDA is defined as net income before interest, taxes, depreciation and amortization. EBITDA yield is defined as trailing twelve month EBITDA divided by the purchase price. A capitalization rate is determined by dividing the property's net operating income by the purchase price. Net operating income is the property's funds from operations minus a capital expense reserve of either 4% or 5% of gross revenues. Hotel EBITDA flow-through is the change in Hotel EBITDA divided by the change in total revenues. EBITDA, FFO, AFFO, CAD and other terms are non- GAAP measures, reconciliations of which have been provided in prior earnings releases and filings with the SEC. This overview is for informational purposes only and is not an offer to sell, or a solicitation of an offer to buy or sell, any securities of Ashford Hospitality Prime, Inc., or any of their respective affiliates, and may not be relied upon in connection with the purchase or sale of any such security.

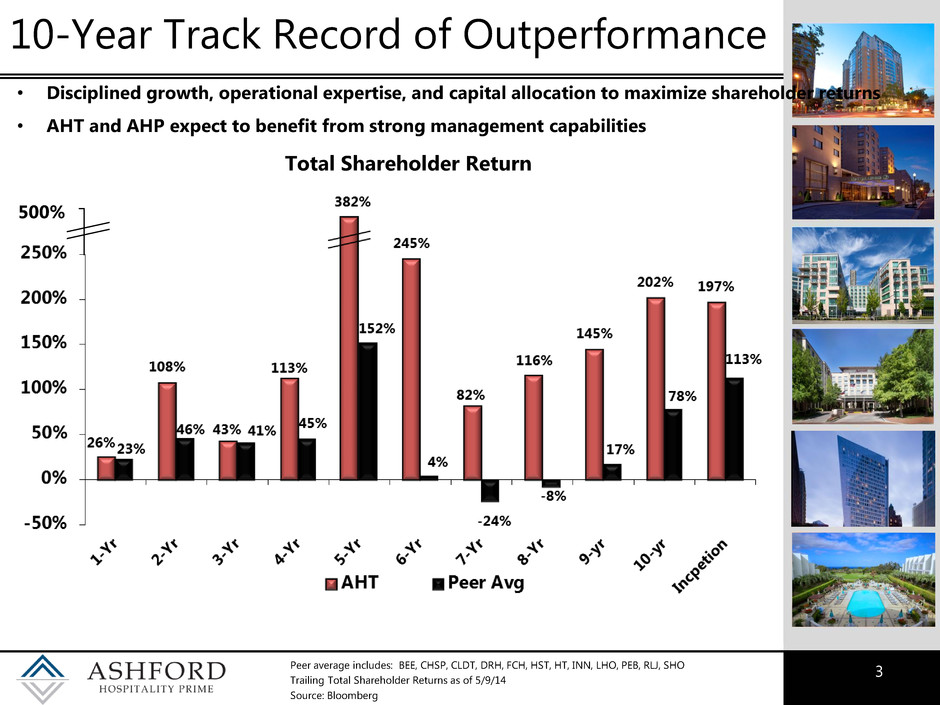
3 Peer average includes: BEE, CHSP, CLDT, DRH, FCH, HST, HT, INN, LHO, PEB, RLJ, SHO Trailing Total Shareholder Returns as of 5/9/14 Source: Bloomberg 10-Year Track Record of Outperformance • Disciplined growth, operational expertise, and capital allocation to maximize shareholder returns • AHT and AHP expect to benefit from strong management capabilities 500% Total Shareholder Return

4 Peer average includes: BEE, CHSP, CLDT, DRH, FCH, HST, HT, INN, LHO, PEB, RLJ, SHO Trailing Volatility as of 5/9/2014 Source: Bloomberg • Ashford's volatility has been lower than peer average Total Shareholder Return - Volatility 0% 10% 20% 30% 40% 50% 60% 70% 80% 90% 100% AHT Peer Avg

5 Highest Insider Ownership 18%* 14%* 4% 3% 3% 3% 3% 2% 2% 2% 1% 1% 1% 1% 1% 0.0% 2.0% 4.0% 6.0% 8.0% 10.0% 12.0% 14.0% 16.0% 18.0% 20.0% Public Lodging REITs include: BEE, CHSP, CLDT, DRH, FCH, HST, HT, INN, LHO, PEB, RLJ, SHO Source: Company filings. * Insider ownership for Ashford entities includes direct & indirect interests & interests of related parties

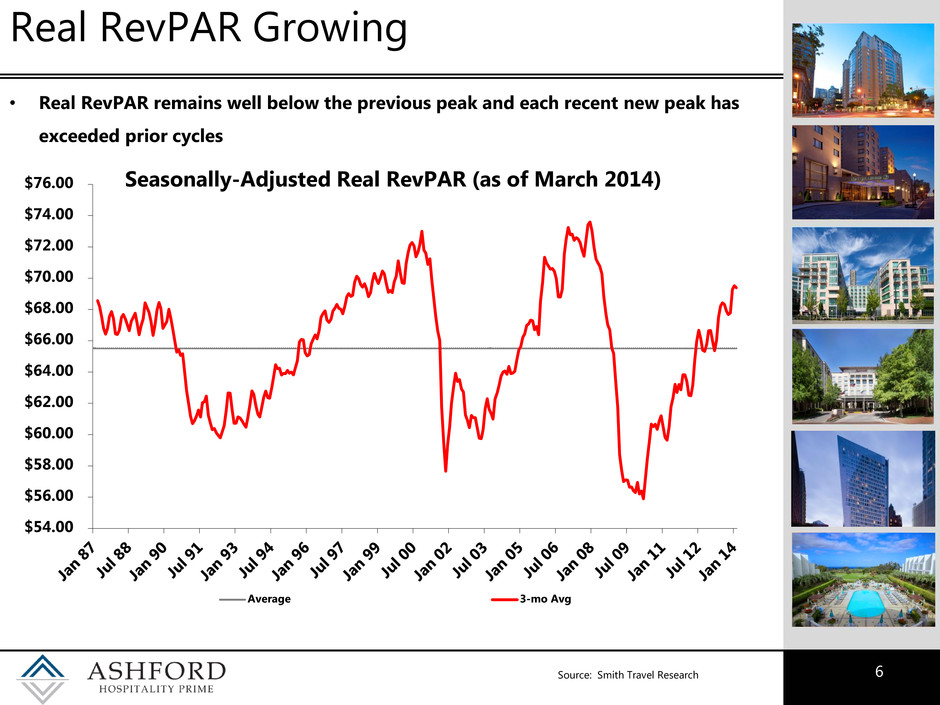
6 Real RevPAR Growing • Real RevPAR remains well below the previous peak and each recent new peak has exceeded prior cycles $54.00 $56.00 $58.00 $60.00 $62.00 $64.00 $66.00 $68.00 $70.00 $72.00 $74.00 $76.00 Seasonally-Adjusted Real RevPAR (as of March 2014) Average 3-mo Avg Source: Smith Travel Research

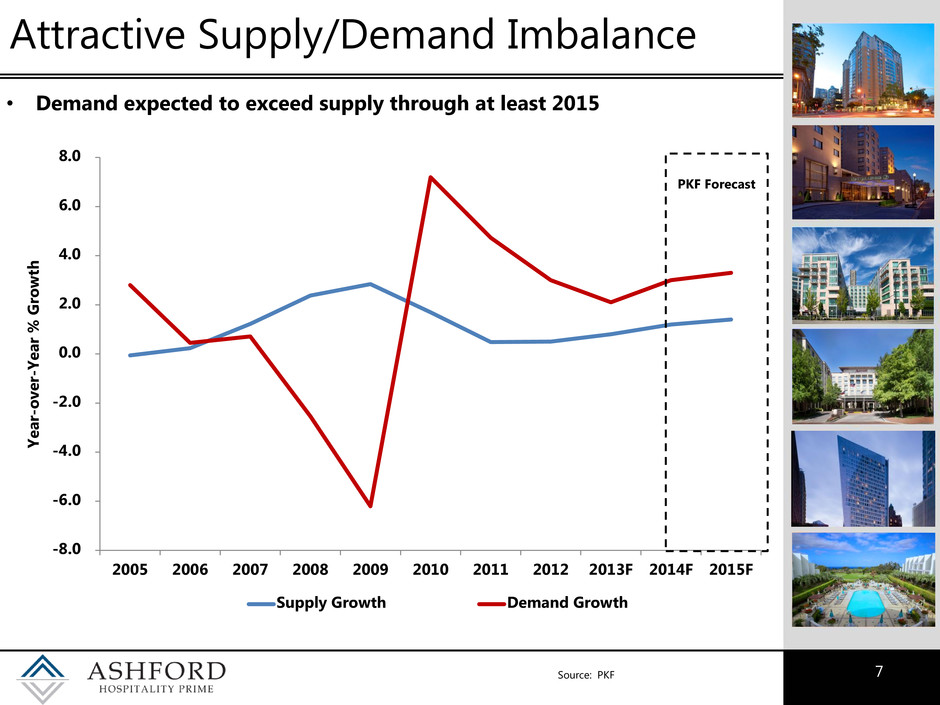
7 Source: PKF Attractive Supply/Demand Imbalance • Demand expected to exceed supply through at least 2015 -8.0 -6.0 -4.0 -2.0 0.0 2.0 4.0 6.0 8.0 2005 2006 2007 2008 2009 2010 2011 2012 2013F 2014F 2015F Y ea r- o v e r- Y ea r % Gro w th Supply Growth Demand Growth PKF Forecast

8 • Ashford consistently beats peers in hotel EBITDA flow throughs Historical Flow-Through vs. Peers Ashford Portfolio includes Ashford Trust & Ashford Prime Peers include: BEE, CHSP, DRH, FCH, HST, HT, LHO, PEB, SHO Source: Company Filings

9 Asset Performance – Ashford Prime Annual Hotel EBITDA Flow-Through 2012 2013 Q1 2013 Q1 2014 Var RevPAR $140.20 $148.64 $140.03 $147.69 5.5% Hotel Revenue $221,188 $233,475 $66,830 $69,179 3.5% Hotel EBITDA $66,993 $71,757 $18,166 $18,823 3.6% EBITDA Flow- Through 38.8% 28.0% The above table assumes for quarterly periods the 10 properties owned and included in continuing operations at March 31, 2014 were owned as of the beginning of each of the periods shown The above table assumes for annual periods the 8 properties owned and included in continuing operations at December 31, 2013 were owned as of the beginning of each of the periods shown Revenue and EBITDA figures displayed in $000's

10 Chicago Sofitel Transaction Property Information: • Location: Downtown Chicago (Gold Coast submarket) • Rooms: 415 (including 32 suites) • Year Built: 2002 • 10,000 sf of meeting space • Fee simple; 32 story tower • Segmentation: 70% transient; 30% group Acquisition Overview: • Purchase Price: $153 million • Purchase Price/Key: $369,000 • RevPAR of $178* vs. AHP Portfolio RevPAR of $159* Strengths/Opportunities: • Excellent Gold Coast location in a key U.S. gateway market • High quality asset with attractive contemporary design and minimal capex needs • Discount to replacement cost • Diversifies portfolio by market, brand, and manager • Potential to re-concept restaurants and implement tiered pricing to drive additional revenue • Improved cash flow through Ashford asset management and best practices • Strong appeal to international travelers with longer stay patterns *TTM through 3/31/14

11 Property Information: • Location: Key West, FL • Rooms: 142 (including 21 suites) • Year Built: 1968 • 2,600 sf of meeting space • Fee simple • Segmentation: 93% transient; 7% group Acquisition Overview: • Purchase Price: $92.7 million • Purchase Price/Key: $653,000 • RevPAR of $316* vs. AHP Portfolio RevPAR of $159* Strengths/Opportunities: • Excellent location at north end of Duval Street in one of strongest hotel markets in U.S. • Extremely high barriers to entry with Rate of Growth Ordinance • High quality asset with minimal capex needs • Management has deep experience in Key West market and continues to drive revenue initiatives and cost efficiencies • Improved cash flow through Ashford asset management and best practices Pier House Resort Transaction *TTM through 3/31/14

12 Marriott Gateway & ROFO Hotels Hotel Market Rooms Ritz-Carlton Atlanta, GA 444 Rooms Hilton Back Bay Boston, MA 390 Rooms Courtyard Downtown Boston, MA 315 Rooms Embassy Suites Portland, OR 276 Rooms Embassy Suites Crystal City Washington, D.C. 267 Rooms Crowne Plaza Beverly Hills Los Angeles, CA 258 Rooms Hyatt Regency Coral Gables Miami, FL 250 Rooms Melrose Washington, D.C. 240 Rooms One Ocean Jacksonville, FL 193 Rooms Churchill Washington, D.C. 173 Rooms Crowne Plaza Key West Key West, FL 160 Rooms Embassy Suites Houston, TX 150 Rooms Right of First Offer Assets Right of First Offer Assets Option Asset Hotel Market Rooms Marriott Crystal Gateway Washington, D.C. 697 Rooms Option Asset

13 Annual Shareholder Meeting – May 2014
