Attached files
| file | filename |
|---|---|
| 8-K - 8-K - MYR GROUP INC. | a14-12036_28k.htm |
Exhibit 99.1
|
|
Investor Presentation 2014 First Quarter Nasdaq: MYRG ¦ www.myrgroup.com Investor Presentation ¦ May ¦ ©2014MYRGROUPINC. |
|
|
SAFE HARBOR STATEMENT Various statements in this presentation, and any oral statements regarding the subject matter of this presentation, are “forward-looking statements” within the meaning of the Private Securities Litigation Reform Act of 1995, Section 27A of the Securities Act of 1933, and Section 21E of the Securities Exchange Act of 1934. Forward-looking statements include those that express a belief, expectation or intention, as well as those that are not statements of historical fact, and may include projections and estimates concerning the timing and success of specific projects and our future revenue, income, backlog, liquidity, capital spending and investments. The forward-looking statements in this presentation are generally accompanied by words such as “estimate,” “project,” “predict,” “believe,” “expect,” “intend,” “anticipate,” “potential,” “possible,” “plan,” “goal,” “objective,” “outlook,” “see,” “may,” “should,” “could,” “appears” or other words that convey the uncertainty of future events or outcomes. The forward-looking statements speak only as of their date and are based on our current expectations and assumptions about future events, including with respect to expected growth, results of operations, performance, business prospects and opportunities and effective tax rates. These statements do not guarantee future performance and actual results may differ materially from these statements. We disclaim any obligation to update these statements, unless required by securities laws, and we caution you not to rely on them unduly. While our management considers these expectations and assumptions to be reasonable, they are inherently subject to significant business, economic, competitive, regulatory and other risks, contingencies and uncertainties, most of which are difficult to predict and many of which are beyond our control. These and other important factors, including those discussed under the caption “Forward- Looking Statements” and in Item 1A “Risk Factors” in our Annual Report on Form 10-K for the fiscal year ended December 31, 2013, and in any risk factors or cautionary statements contained in our other filings with the Securities and Exchange Commission, may cause our actual results, performance or achievements to differ materially from any future results, performance or achievements expressed or implied by these forward- looking statements. Company Overview ¦ Market Overview ¦ Strategy ¦ Financial Performance ¦ Investment Outlook ¦ Appendix ¦ Page 2 Investor Presentation ¦ May ¦ ©2014MYRGROUPINC. |
|
|
TABLE OF CONTENTS Company Overview Market Overview Strategy Financial Performance Investment Outlook Appendix Company Overview ¦ Market Overview ¦ Strategy ¦ Financial Performance ¦ Investment Outlook ¦ Appendix ¦ Page 3 Investor Presentation ¦ May ¦ ©2014MYRGROUPINC. |
|
|
ABOUT MYR GROUP G:\Shared\Accounting\Pictures\Photos\First 765kV line photo - LE Myers.jpgG:\Shared\Accounting\Pictures\Photos\Sturgeon Work Crew 2.jpgG:\Shared\Accounting\Pictures\Photos\Oldciviccenter hi res-Sturgeon.jpg• MYR Group is a holding company of six specialty electrical contractors – Subsidiaries date back to 1891 – Nationwide presence with offices in 21 states • Transmission and Distribution (T&D) customers include: – Investor Owned Utilities – Cooperatives – Municipalities – Independent Transmission Companies •Commercial and Industrial (C&I) services are provided to property owners and general contractors in the western United States •Services include turnkey construction and maintenance of the U.S. electrical infrastructure •Nationwide network of over 3,000 employees •Safety performance consistently exceeds industry standards •Large modern fleet including extensive specialized equipment Company Overview ¦ Market Overview ¦ Strategy ¦ Financial Performance ¦ Investment Outlook ¦ Appendix ¦ Page 4 Investor Presentation ¦ May ¦ ©2014MYRGROUPINC. |

|
|
INVESTMENT HIGHLIGHTS • Strong market position – Transmission and Distribution (T&D) - national presence – Commercial and Industrial (C&I) - regional presence • Highly skilled national workforce • Regulatory environment supports growth • Favorable industry dynamics providing opportunities for stable and profitable long-term growth • Significant, major transmission project opportunities • Multiple large-scale MYR transmission projects in progress • Strong financial performance, healthy balance sheet, and sustainable growth opportunities Company Overview ¦ Market Overview ¦ Strategy ¦ Financial Performance ¦ Investment Outlook ¦ Appendix ¦ Page 5 Investor Presentation ¦ May ¦ ©2014MYRGROUPINC. |
|
|
NATIONWIDE T&D SERVICES • Transmission • Overhead Distribution • Underground Distribution • Foundations & Caissons • Directional Boring • Substation • EPC Services • PCS/Cellular Towers • Emergency Storm Response • Fiber Optics T&D CAPABILITIES MYR Group provides transmission, distribution and substation services across the U.S. through a network of district and project-specific offices. Company Overview ¦ Market Overview ¦ Strategy ¦ Financial Performance ¦ Investment Outlook ¦ Appendix ¦ Page 6 Investor Presentation ¦ May ¦ ©2014MYRGROUPINC. |

|
|
REGIONAL C&I SERVICES • Educational/Medical Centers • Industrial Facilities • Water & Wastewater Treatment Plants • Renovations and Major Additions • Data Centers • Technical Services • Voice / Data / Video • Transportation • Traffic Signalization • Bridge, Roadway, Tunnel Lighting • Government & Office Buildings • Telecommunications C&I CAPABILITIES Regional focus in the Mountain West ¦ A leading contractor in AZ & CO Company Overview ¦ Market Overview ¦ Strategy ¦ Financial Performance ¦ Investment Outlook ¦ Appendix ¦ Page 7 Investor Presentation ¦ May ¦ ©2014MYRGROUPINC. |

|
|
CENTRALIZED FLEET OPERATIONS Company Overview ¦ Market Overview ¦ Strategy ¦ Financial Performance ¦ Investment Outlook ¦ Appendix Screen Clipping200 Ton All-Terrain Crane 5-Drum Side-Winder Puller 80’ Track Material Handler Centralized Fleet Management Regional Support Facilities MYR Group’s centralized fleet management maximizes fleet utilization and creates efficient distribution of fleet resources to projects all across the nation. Storm Response Equipment ¦ Page 8 Investor Presentation ¦ May ¦ ©2014MYRGROUPINC. |

|
|
STRATEGIC INVESTMENT IN CAPEX SUPPORTED ORGANIC GROWTH Successful execution of strategy: Invested in specialty equipment in 2011 - 2013 in anticipation of T&D build-out Grow top-line revenue organically through expansion of T&D capacity Source: S&P Capital IQ ¦ Page 9 Company Overview ¦ Market Overview ¦ Strategy ¦ Financial Performance ¦ Investment Outlook ¦ Appendix $616$631$597$780$999$903$0$200$400$600$800$1,000$1,200200820092010201120122013MillionsRevenueRevenue7.9% CAGR 4.5%4.4% 4.0% 2.3% 0.9% 0.5% 0.0% 1.0% 2.0% 3.0% 4.0% 5.0% PIKE'09-'13MYRG'09-'13PWR'09-'13MTZ'09-'13WG'09-'13EME'09-'135-Year CAPEX Investment % of Revenue $28.0$29.7$21.9$42.3$37.2$42.70.0% 1.0% 2.0% 3.0% 4.0% 5.0% 6.0% $0$10$20$30$40$50200820092010201120122013MillionsCAPEX InvestmentCAPEX SpendCAPEX % of Rev Investor Presentation ¦ May ¦ ©2014MYRGROUPINC. |
|
|
REGULATORY ENVIRONMENT SUPPORTS GROWTH August 2005 - Energy Policy Act / Revised in 2009 by the American Recovery and Reinvestment Act •Established minimum reliability standards •Provided federal permitting and siting authority for transmission lines •Encouraged investment in infrastructure July 2011 - FERC Order 1000 “Transmission Planning and Cost Allocation” •Intended to facilitate transmission development and lower costs of transmission services •Could require transmission providers to develop regional transmission plans and cost-allocation methods and to coordinate with neighboring transmission-planning regions •Could reduce siting and permitting delays, remove the Federal Rights of First Refusal (ROFR) and consider Public Policy Benefits (i.e. Clean Air) October 2011 - Federal Government announced creation of an inter-agency Rapid Response Team for Electric Transmission Projects (RRTT) •Intended to streamline the permitting and review process of electric transmission projects •Intended to speed project development by coordinating statutory permitting, review and consultation schedules and processes among Federal and State agencies •7 major projects have been selected as pilot projects with combined estimated total project costs in excess of $9 billion December 2011 - EPA finalized national standards to reduce mercury and other toxic air pollution from coal and oil- fired power plants •Planning authorities are being impacted by the Mercury and Air Toxics Standards (MATS) •Will likely result in substantial power plant retirements around the country by the end of 2015 2005 - 2013 - Renewable Portfolio Standards (RPS) •30 states with renewable portfolio standards (mandatory); 7 states with renewable energy goals (voluntary) - (Source DSIRE Database) Company Overview ¦ Market Overview ¦ Strategy ¦ Financial Performance ¦ Investment Outlook ¦ Appendix ¦ Page 10 Investor Presentation ¦ May ¦ ©2014MYRGROUPINC. |
|
|
TRANSMISSION SPENDING Screen ClippingTransmission spending by electrical utilities driven by: System Reliability Aging Electric Grid Connecting Renewables Plant Retirements “Edison Electric Institute’s 2013 Transmission Projects: At a Glance report highlights more than 150 planned transmission projects totaling about $51.1 billion planned through 2023, not including investments in transmission upgrades or replacements to existing facilities, which run several billion dollars annually; although the proposed investment is significant, the Brattle Group estimates that $240 billion to $320 billion will be needed through 2030.” – Stifel 10/4/13 Company Overview ¦ Market Overview ¦ Strategy ¦ Financial Performance ¦ Investment Outlook ¦ Appendix Source: NERC 2013 Long-Term Reliability Assessment ¦ Page 11 Screen ClippingScreen ClippingInvestor Presentation ¦ May ¦ ©2014MYRGROUPINC. |
|
|
REGIONAL C&I GROWTH TRENDS Company Overview ¦ Market Overview ¦ Strategy ¦ Financial Performance ¦ Investment Outlook ¦ Appendix Dodge Momentum Index – by McGraw-Hill Construction - 12 month leading indicator of construction spending for nonresidential building - 91% correlation between construction planning reports and the US Commerce Department’s Put in Place spending over the past 10 years - Used to provide construction starts data to the US Census Bureau for GDP calculation “Dodge Momentum Index Climbs Further in January - January’s relatively strong gain brought the Momentum Index to 121.1 (2000=100), compared to a revised 117.6 in December 2013. Save for two minor dips in June and October of 2013, the Momentum Index has been on a steady climb for over a year. ” Source: McGraw Hill Construction Press Release February 7, 2014 C&I’s Strong $137.1MM Backlog is Driven by: Hospitals Data Centers Airport Projects Transportation Work Water/Waste Water Upgrades “The strong relationship established between the Dodge Momentum Index and construction spending, with its full year of lead time, means that the index is likely to prove extremely valuable to construction industry professionals, as well as economists and Wall Street analysts.” - McGraw-Hill Construction ¦ Page 12 Investor Presentation ¦ May ¦ ©2014MYRGROUPINC. |

|
|
FUTURE GROWTH OPPORTUNITIES •Invest in additional fleet and labor resources to expand capacity •Leverage extensive bid knowledge and long-term customer relationships to secure future contracts with existing and new customers Organic Growth •Assess segments of the T&D and C&I markets to bring in-house (e.g., foundation drilling, site clearing, specialty equipment fabrication, environmental controls) Vertical Integration •Evaluate other areas of the energy infrastructure market for possible expansion Horizontal Expansion •Consider the strategic expansion of MYR Group’s geographic footprint into favorable markets Geographic Expansion Company Overview ¦ Market Overview ¦ Strategy ¦ Financial Performance ¦ Investment Outlook ¦ Appendix ¦ Page 13 Investor Presentation ¦ May ¦ ©2014MYRGROUPINC. STRONG FINANCIAL PERFORMANCE $0$50$100$150$200$250$30012341234123412341234123412008200920102011201220132014MillionsQuarterly Revenue by Work TypeTrans.Dist.C&I7.9% CAGR 46%56%51%59%68%68% 27% 18%24% 21% 15%12% 27%26%25%20%17%20% 0% 20% 40% 60% 80% 100% 200820092010201120122013% of Total Revenue by SegmentTransmission %Distribution %C&I % $0$10$20$30$4012341234123412341234123412008200920102011201220132014MillionsQuarterly Gross ProfitGross Profit5.0% CAGR $0$20$40$60$80$100$120$14012341234123412341234123412008200920102011201220132014MillionsLTM Gross Profit TrendLTM GP8.5% CAGR Company Overview ¦ Market Overview ¦ Strategy ¦ Financial Performance ¦ Investment Outlook ¦ Appendix ¦ Page 14 Investor Presentation ¦ May ¦ ©2014MYRGROUPINC. |

|
|
STRONG FINANCIAL PERFORMANCE $0.00$0.10$0.20$0.30$0.40$0.5012341234123412341234123412008200920102011201220132014Quarterly Diluted EPSDiluted EPS3.9% CAGR $0$100$200$300$400$500$600$700$80012341234123412341234123412008200920102011201220132014MillionsBacklogBacklog - C&IBacklog - T&D8.9% CAGR All revenue and backlog growth has been organic Backlog includes only 90 days of alliance agreements and signed contracts Not a static business; MYR is constantly marketing to new customers and bidding on new projects Committed to investing in fleet equipment Company Overview ¦ Market Overview ¦ Strategy ¦ Financial Performance ¦ Investment Outlook ¦ Appendix $0.00$0.20$0.40$0.60$0.80$1.00$1.2012341234123412341234123412008200920102011201220132014Quarterly EBITDA / Diluted ShareEBITDA / Diluted Share8.1% CAGR ¦ Page 15 Investor Presentation ¦ May ¦ ©2014MYRGROUPINC. |

|
|
FINANCIAL PERFORMANCE COMPARISON Source: S&P Capital IQ - NM (Not Meaningful) reflects negative returns/growth and is ignored for comparison purposes Company Overview ¦ Market Overview ¦ Strategy ¦ Financial Performance ¦ Investment Outlook ¦ Appendix ¦ Page 16 2.31x 2.14x 2.05x 1.72x 1.30x 1.28x 0.000.501.001.502.002.50WGEMEMYRGMTZPWRPIKEAsset Turnover 7.8%7.6% 5.5% 4.6% 1.6% NMNM1.0% 2.0% 3.0% 4.0% 5.0% 6.0% 7.0% 8.0% 9.0% PWRMYRGMTZEMEPIKEWGROA 15.7% 12.9% 10.5%10.0% 3.6% NMNM2.0% 4.0% 6.0% 8.0% 10.0% 12.0% 14.0% 16.0% 18.0% MTZMYRGPWREMEPIKEWGROE 14.1% 11.6%11.6% 9.2% 2.2% NM0.0% 2.0% 4.0% 6.0% 8.0% 10.0% 12.0% 14.0% 16.0% MYRGPWREMEMTZPIKEWGROIC Investor Presentation ¦ May ¦ ©2014MYRGROUPINC. |
|
|
FUNDAMENTAL FINANCIAL PERFORMANCE Company Overview ¦ Market Overview ¦ Strategy ¦ Financial Performance ¦ Investment Outlook ¦ Appendix ¦ Page 17 $1.99 $1.78 $1.62 $1.57 $0.30 NM$0.00$0.50$1.00$1.50$2.00$2.50EMEPWRMTZMYRGPIKEWGLTM EPS (Diluted) Source: S&P Capital IQ - NM (Not Meaningful) reflects negative returns/growth and is ignored for comparison purposes $22.43$19.95$14.06$12.12$7.77$3.70$0.00$5.00$10.00$15.00$20.00$25.00EMEPWRMYRGMTZPIKEWGBook Value per Diluted Share $11.42 $10.47 $2.36 $0.94 $0.84 NM$0.00$2.00$4.00$6.00$8.00$10.00$12.00MYRGPWREMEPIKEWGMTZTangible BV / Diluted Share 3.49x3.24x2.05x1.86x1.78x1.35x0.000.501.001.502.002.503.003.504.00WGMTZEMEPWRMYRGPIKEMarket to Book Value Investor Presentation ¦ May ¦ ©2014MYRGROUPINC. |

|
|
BALANCE SHEET STRENGTH Company Overview ¦ Market Overview ¦ Strategy ¦ Financial Performance ¦ Investment Outlook ¦ Appendix ($50) $0$50$100$150$200$250$30012341234123412341234123412008200920102011201220132014MillionsTotal LiquidityCredit FacilityCashLOCBank DebtTotal Liquidity • No funded debt • Limited goodwill • Steady growth in tangible net worth • Large modern fleet including extensive specialty equipment • Strong liquidity position • Substantial bonding capacity -$100-$50$0$50$100$150$200$250$300$35012341234123412341234123412008200920102011201220132014MillionsTangible Net WorthGoodwill & IntangiblesShareholders EquityTNW ¦ Page 18 39 24 45 30 30 95 (17)(16)(6)(23)(12)(14) (11)(13)(16) (19)(25)(29) $(50) $- $50 $100 $150200820092010201120122013MillionsComponents of Free Cash FlowOp. Cash FlowGrowth CapexMaint. CapexFree Cash Flow Investor Presentation ¦ May ¦ ©2014MYRGROUPINC. |
|
|
INVESTMENT OUTLOOK •Solid execution of corporate strategy has solidified MYR Group’s position as a market leader in large transmission line construction Proven Strategy Execution •Executive Management average 30+ years of industry experience Experienced Management •Regulatory environment supports growth and numerous market analysts expect escalated spending through year 2020. Positive Industry Outlook •Opportunities for organic, vertical, horizontal, and geographic growth Favorable Growth Prospects •MYR Group owns a large modern fleet of equipment and has substantial tangible net worth and bonding capacity, coupled with a strong liquidity position Strong Financial Position •Centralization allows for greater efficiency and leverage of company resources Centralized Fleet and Corporate Operations Company Overview ¦ Market Overview ¦ Strategy ¦ Financial Performance ¦ Investment Outlook ¦ Appendix ¦ Page 19 Investor Presentation ¦ May ¦ ©2014MYRGROUPINC. |

|
|
Appendix Company Overview ¦ Market Overview ¦ Strategy ¦ Financial Performance ¦ Investment Outlook ¦ Appendix ¦ Page 20 Investor Presentation ¦ May ¦ ©2014MYRGROUPINC. |

|
|
EXPERIENCED MANAGEMENT TEAM Experienced management team that averages more than 20 years with MYR Group and roughly 31 years in our industry Operations management averages 38 years of industry experience Strong corporate culture focused on customer service and safety Invested in management team for the successful execution of large, multi-year, transmission projects G:\Shared\Accounting\Pictures\Photos\IMG.jpgC:\Users\abecker\Desktop\Pictures For PPT\CMP111.jpgCompany Overview ¦ Market Overview ¦ Strategy ¦ Financial Performance ¦ Investment Outlook ¦ Appendix ¦ Page 21 Investor Presentation ¦ May ¦ ©2014MYRGROUPINC. NameJob TitleYears With MYRYears Industry ExperienceWilliam A. KoertnerPresident and Chief Executive Officer1535Richard S. SwartzSenior VP and Chief Operating Officer 3131Gerald B. Engen, Jr.Senior VP, Chief Legal Officer and Secretary1330William H. GreenSenior VP2648Tod CooperSenior Vice President, East2325Paul J. EvansVP, Chief Financial Officer and Treasurer217John A. FlussGroup VP, Large Projects4040Gregory T. WolfVP, Chief Accounting Officer1321 |

|
|
MYR GROUP SERVICES Transmission Collector Systems Distribution Traffic Signalization Telecommunications Substation Solar Installations Industrial Storm Restoration EPC Commercial Smart Grid.jpgSmart Grid Company Overview ¦ Market Overview ¦ Strategy ¦ Financial Performance ¦ Investment Outlook ¦ Appendix _c.jpg¦ Page 22 Investor Presentation ¦ May ¦ ©2014MYRGROUPINC. |

|
|
MYR GROUP CUSTOMER SAMPLE \\myr-san1b\users\abecker\My Pictures\Logo's\logo_ameren.jpg\\myr-san1b\users\abecker\My Pictures\Logo's\Centerpoint.jpg\\myr-san1b\users\abecker\My Pictures\Logo's\fab9cb60-d48d-412d-ac7b-85df7648c066.jpg\\myr-san1b\users\abecker\My Pictures\Logo's\Central_Maine_Power_2011.png\\myr-san1b\users\abecker\My Pictures\Logo's\DTE.jpg\\myr-san1b\users\abecker\My Pictures\Logo's\fpl_1__xsys.jpg\\myr-san1b\users\abecker\My Pictures\Logo's\national-grid-logo.gifadc_1px_transadc_1px_transadc_1px_transadc_1px_transMidAmerican Energy Holdings Company\\myr-san1b\users\abecker\My Pictures\Logo's\nv_energy_logo.jpg\\myr-san1b\users\abecker\My Pictures\Logo's\Bonneville-Power-Administration-Logo.jpg\\myr-san1b\users\abecker\My Pictures\Logo's\LSP-Logo.bmp\\myr-san1b\users\abecker\My Pictures\Logo's\OGE.jpg\\myr-san1b\users\abecker\My Pictures\Logo's\600px-US-TennesseeValleyAuthority-Logo_svg.png\\myr-san1b\users\abecker\My Pictures\Logo's\ITC-Transmission-Logo.jpg\\myr-san1b\users\abecker\My Pictures\Logo's\WAPAlogoH.jpg\\myr-san1b\users\abecker\My Pictures\Logo's\NW%20Energy%20Color.jpg\\myr-san1b\users\abecker\My Pictures\Logo's\Entergy.jpg\\myr-san1b\users\abecker\My Pictures\Logo's\XcelEnergyLogo.jpg\\myr-san1b\users\abecker\My Pictures\Logo's\first energy.png\\myr-san1b\users\abecker\My Pictures\Logo's\lockheed.png\\myr-san1b\users\abecker\My Pictures\Logo's\PPL%20Logo.jpg\\myr-san1b\users\abecker\My Pictures\Logo's\GreatRiverEnergy-Logo-Touchstone_COLOR.jpg\\myr-san1b\users\abecker\My Pictures\Logo's\Burns.jpg\\myr-san1b\users\abecker\My Pictures\Logo's\dukeenergy.jpg\\myr-san1b\users\abecker\My Pictures\Logo's\Freeport.jpg\\myr-san1b\users\abecker\My Pictures\Logo's\Exxon_Mobil.pngCompany Overview ¦ Market Overview ¦ Strategy ¦ Financial Performance ¦ Investment Outlook ¦ Appendix ¦ Page 23 Investor Presentation ¦ May ¦ ©2014MYRGROUPINC. |

|
|
EMERGENCY RESPONSE REVENUE G:\Shared\Accounting\Pictures\Photos\hurricane Rita Harlan.jpg$31 $24 $10 $43 $16 $14 $31 $41 $15 $0$10$20$30$40$50200520062007200820092010201120122013MillionsStorm RevenueStorm RevenueAverage $25.0MM 2005 – Katrina 2008 – Gustav 2008 – Ike 2011 – Irene 2011 – NE Snowstorm 2012 - Sandy C:\Users\abecker\Desktop\Pictures For PPT\Ice Storm.jpgCompany Overview ¦ Market Overview ¦ Strategy ¦ Financial Performance ¦ Investment Outlook ¦ Appendix ¦ Page 24 Investor Presentation ¦ May ¦ ©2014MYRGROUPINC. |
|
|
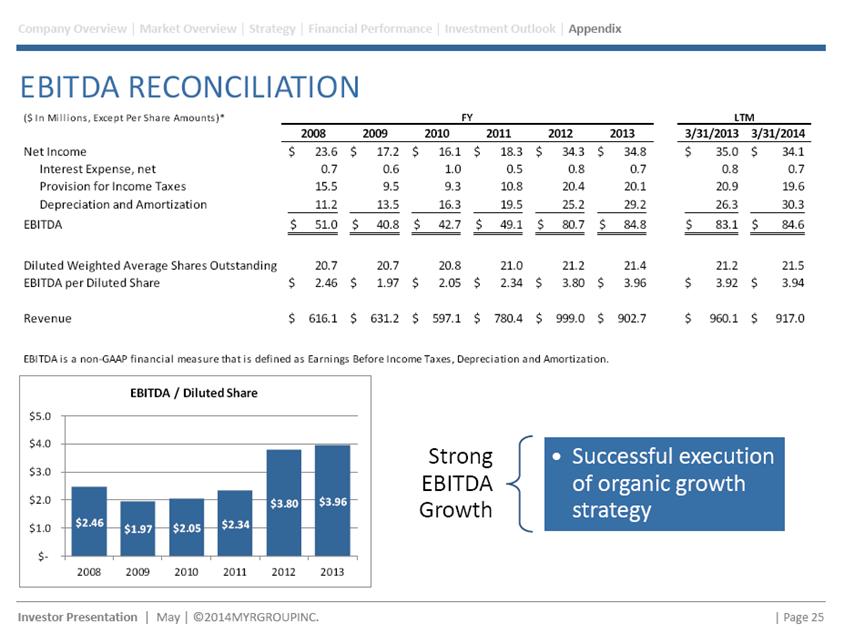
EBITDA RECONCILIATION $2.46 $1.97 $2.05 $2.34 $3.80 $3.96 $- $1.0 $2.0 $3.0 $4.0 $5.0200820092010201120122013EBITDA / Diluted Share Strong EBITDA Growth •Successful execution of organic growth strategy Company Overview ¦ Market Overview ¦ Strategy ¦ Financial Performance ¦ Investment Outlook ¦ Appendix ¦ Page 25 Investor Presentation ¦ May ¦ ©2014MYRGROUPINC. ($ In Millions, Except Per Share Amounts)*FYLTM2008200920102011201220133/31/20133/31/2014Net Income23.6$ 17.2$ 16.1$ 18.3$ 34.3$ 34.8$ 35.0$ 34.1$ Interest Expense, net0.7 0.6 1.0 0.5 0.8 0.7 0.8 0.7 Provision for Income Taxes15.5 9.5 9.3 10.8 20.4 20.1 20.9 19.6 Depreciation and Amortization11.2 13.5 16.3 19.5 25.2 29.2 26.3 30.3 EBITDA51.0$ 40.8$ 42.7$ 49.1$ 80.7$ 84.8$ 83.1$ 84.6$ Diluted Weighted Average Shares Outstanding20.7 20.7 20.8 21.0 21.2 21.4 21.2 21.5 EBITDA per Diluted Share2.46$ 1.97$ 2.05$ 2.34$ 3.80$ 3.96$ 3.92$ 3.94$ Revenue616.1$ 631.2$ 597.1$ 780.4$ 999.0$ 902.7$ 960.1$ 917.0$ EBITDA is a non-GAAP financial measure that is defined as Earnings Before Income Taxes, Depreciation and Amortization. |
|
|
FINANCIAL RATIO DEFINITIONS Company Overview ¦ Market Overview ¦ Strategy ¦ Financial Performance ¦ Investment Outlook ¦ Appendix ¦ Page 26 S&P Capital IQ Disclaimer of Liability Notice. This may contain information obtained from third parties, including ratings from credit ratings agencies such as Standard & Poor’s. Reproduction and distribution of third party content in any form is prohibited except with the prior written permission of the related third party. Third party content providers do not guarantee the accuracy, completeness, timeliness or availability of any information, including ratings, and are not responsible for any errors or omissions (negligent or otherwise), regardless of the cause, or for the results obtained from the use of such content. THIRD PARTY CONTENT PROVIDERS GIVE NO EXPRESS OR IMPLIED WARRANTIES, INCLUDING, BUT NOT LIMITED TO, ANY WARRANTIES OF MERCHANTABILITY OR FITNESS FOR A PARTICULAR PURPOSE OR USE. THIRD PARTY CONTENT PROVIDERS SHALL NOT BE LIABLE FOR ANY DIRECT, INDIRECT, INCIDENTAL, EXEMPLARY, COMPENSATORY, PUNITIVE, SPECIAL OR CONSEQUENTIAL DAMAGES, COSTS, EXPENSES, LEGAL FEES, OR LOSSES (INCLUDING LOST INCOME OR PROFITS AND OPPORTUNITY COSTS OR LOSSES CAUSED BY NEGLIGENCE) IN CONNECTION WITH ANY USE OF THEIR CONTENT, INCLUDING RATINGS. Credit ratings are statements of opinions and are not statements of fact or recommendations to purchase, hold or sell securities. They do not address the suitability of securities or the suitability of securities for investment purposes, and should not be relied on as investment advice. LTM Diluted EPS+LTM Interest expense (income), net, per diluted share+LTM Provision for income taxes per diluted share+LTM Depreciation and amortization per diluted share =LTM EBITDA per Diluted ShareBook Value (total stockholders' equity) per diluted share-Goodwill and intangible assets per diluted share =Tangible Book Value per Diluted ShareMarket Capitalization (S&P Capital IQ as of 03/31) ÷Book Value (total stockholders' equity) =Market to Book ValueMarket Capitalization (S&P Capital IQ as of 03/31) ÷Tangible Book Value (S&P Capital IQ) =Market to Tangible Book Value LTM Revenue ÷Total Assets @ beginning of LTM =Asset TurnoverLTM Net Income (including discontinued operations & minority interests) ÷Total Assets @ beginning of LTM =Return on AssetsLTM Net Income (including discontinued operations & minority interests) ÷Total Stockholders Equity @ beginning of LTM =Return on EquityCash used in purchasing property and equipment (5 years) ÷Revenue (5 years) =5-Year CAPEX Investment % of RevenueNet cash flow from operating activities-Cash used in purchasing property and equipment =Free Cash FlowBook Value (total stockholders' equity) ÷Weighted Average Diluted Shares =Book Value per Diluted Share(LTM ATNI) - (Dividends + Special Dividends) ÷Total Capital @ Beginning of LTM (stockholders' equity + net debt) =Return on Invested Capital Investor Presentation ¦ May ¦ ©2014MYRGROUPINC. |