Attached files
| file | filename |
|---|---|
| 8-K - 8-K - FIFTH THIRD BANCORP | d724582d8k.htm |
 ©
Fifth Third Bank | All Rights Reserved
Investor Update
Barclays Capital 2014 Americas Select Franchise Conference
Tayfun Tuzun
Executive Vice President & Chief Financial Officer
May 2014
Please refer to earnings release dated April 17, 2014 and
10-Q dated May 8, 2014 for further information
Exhibit 99.1 |
 2
©
Fifth Third Bank | All Rights Reserved
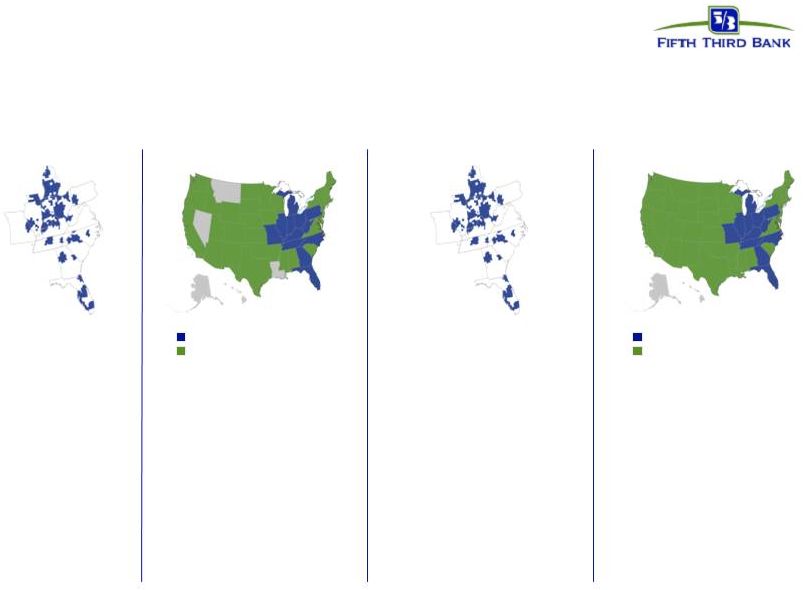
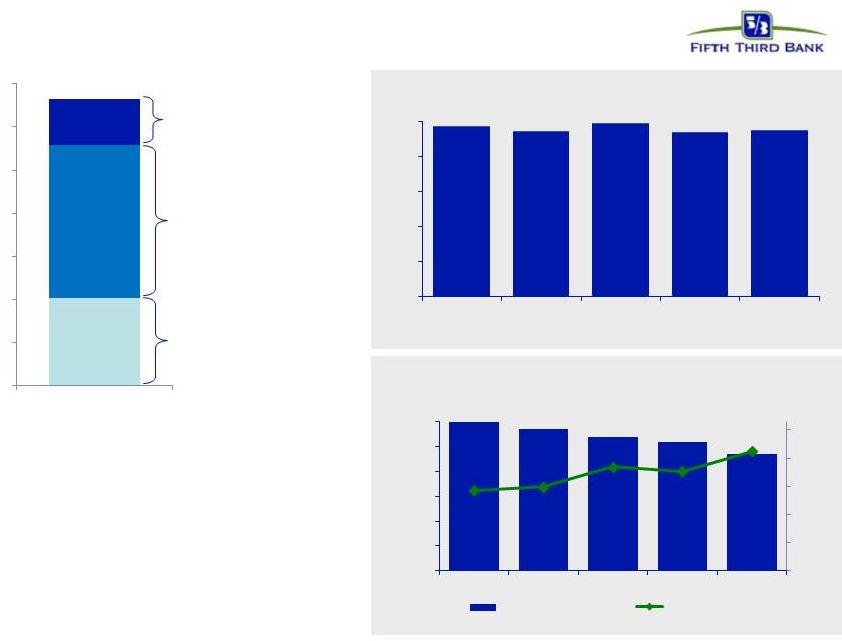
Broad scope of products and services
addressing the needs of wide array of customers
Consumer Lending
Branch Banking
Wealth Management
Wholesale Banking
Retail Bank
Cards
Mortgage
Auto
2013 total revenue of $560MM
2013 average loans of $2.0B
2013 average core deposits of $8.8B
$26B assets under management
$302B assets under care
2013 total revenue of $2.6B
2013 average loans of $47.3B
2013 average core deposits of $30.2B
2013 total revenue of $2.0B
2013 average loans of $17.5B
1,311 banking centers
2,614 ATMs
12 states
Private Bank
Retail Brokerage
Institutional Services
Commercial Bank
Footprint
Business
Lines
Highlights
In footprint markets
National consumer lending
In footprint markets
National commercial banking
Diversified financial services company operating in 12 states
1
Source: Inside Mortgage Finance
2
Source:
Experian
Auto
Count.
Loans
(excluding
leases)
originated
by
franchised
dealers.
Prime
banks
only
-
excludes
captives
and
non
primes.
Capital
One
is
excluded
because
they
are
primarily non-prime. Ally is excluded because they were primarily a
captive. 2013 total revenue of $1.1B
2013 average loans of $22.2B
#12 mortgage originator¹
(42 states)
#5 bank indirect auto originator²
(45 states) |
 3
©
Fifth Third Bank | All Rights Reserved
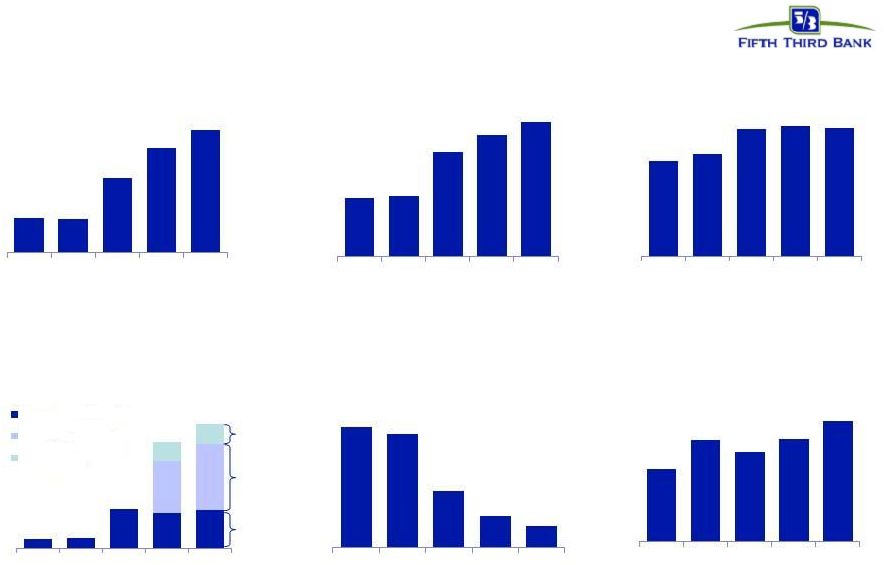
2013: A record year
Return on avg. assets
Net income to common ($MM)
Generated highest level of net
income in Company’s history
Improving profitability approaching
target for normalized environment
Net charge-off ratio
Problem assets at lowest
levels in five years
ALLL / NPLs
Coverage levels among
strongest in the industry
Capital ratios above regulatory
well-capitalized levels
1
Non-GAAP measure; see Reg. G reconciliation in appendix; presented under
current U.S. capital regulations 2
2013 is net of the issuance of shares valued at $398MM related to the Series G
preferred stock conversion on July 1, 2013. 3
Repurchases
of
shares
in
the
amount
of
after-tax
gains
on
the
sale
of
Vantiv
shares.
Total payout ratio
Net payouts to shareholders
of $1.3B
2
in 2013
100% of
gains
45% of
earnings
ex-Vantiv
gains
26% of
earnings
ex-Vantiv
gains
Tier
1
common
ratio
$511
$503
$1,094
$1,541
$1,799
2009
2010
2011
2012
2013
2009
2010
2011
2012
2013
2009
2010
2011
2012
2013
2009
2010
2011
2012
2013
2009
2010
2011
2012
2013
2009
2010
2011
2012
2013
7.0%
7.5%
9.4%
9.5%
9.4%
0.64%
0.67%
1.15%
1.34%
1.48%
6%
6%
23%
21%
23%
31%
39%
11%
12%
3.20%
3.02%
1.49%
0.85%
0.58%
127%
179%
157%
180%
211%
1
Common Dividends
Declared
Share Repurchases
Share Repurchases
-
ex-Vantiv²
-
Vantiv³
|
 4
©
Fifth Third Bank | All Rights Reserved
•
Earnings per diluted share of $0.36
•
Operating results in line with our expectations, driven by healthy balance sheet
with strong growth potential and well-controlled expenses
•
Despite several large credits that elevated net charge-offs, portfolio asset
quality continues to improve; total delinquencies and nonperforming assets
remain at low levels First quarter 2014 earnings highlights
1
Non-GAAP measure; see Reg. G reconciliation in appendix. Capital ratios
presented under current U.S. capital regulations. The pro forma Basel III Tier 1 common equity ratio is
management’s estimate based upon its current interpretation of recent
prospective regulatory capital requirements approved in July 2013.
•
Traditional commercial banking franchise utilizing an affiliate-based model
supported with strong national businesses
—
Segment and industry specialization in mid-corporate, energy, and
healthcare •
Top 3 deposit market share in key markets with focus on further improving share of
wallet •
Redesigning retail distribution strategy and prioritizing key segments in consumer
bank •
Growing regional wealth management and brokerage services
•
Tier
1
common
ratio
of
9.5%
(Basel
III
pro
forma
estimate
of
~9.1%)
¹
•
Repurchased 8MM common shares in 1Q14; 4Q13 and 1Q14 transactions reduced
average diluted share count by 23MM
•
2014 CCAR plan not objected to by Federal Reserve Board, includes the potential
increase in the quarterly common stock dividend and potential repurchase of
common shares
—
$150MM share repurchase agreement announced in 2Q14
Strong
Operating
Results
Executing on
Strategic
Plans
Prudent
Capital
Management
|
 5
©
Fifth Third Bank | All Rights Reserved
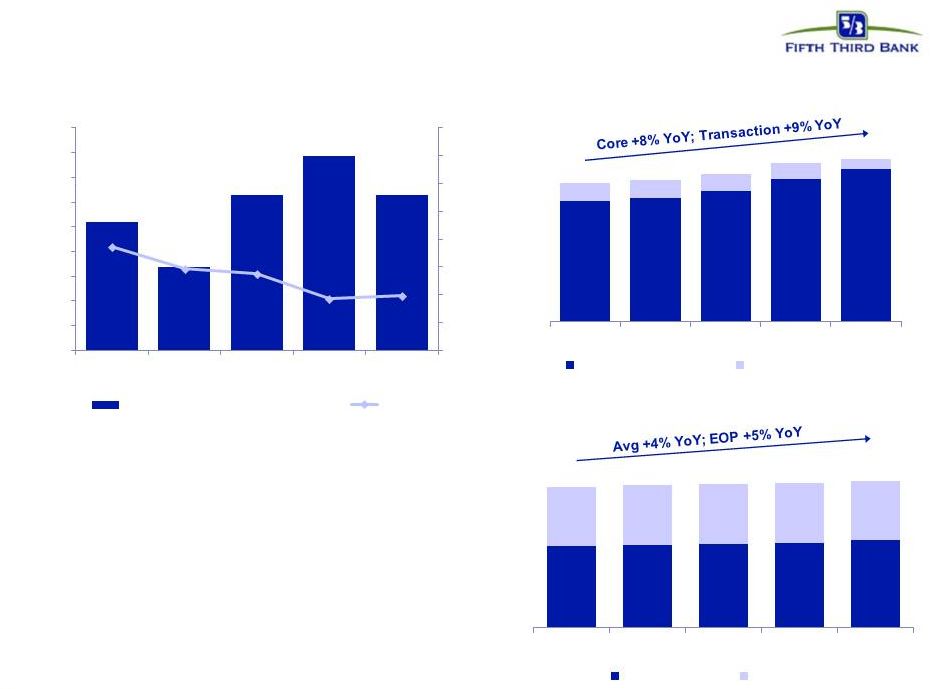
Net interest income, margin & balance sheet
Average core deposit balances ($B)
$91.5
$84.9
Loan balances ($B)
NII and NIM (FTE)
$885
$893
$885
$898
$905
•
Growth in NII despite NIM contraction (adjusted for day
count)
•
Changed composition and size of investment portfolio
beginning in 3Q13; expect benefit to NII in future
quarters
•
New origination spreads remain tight (reflects
increased level of competition, impact of better credit,
and relationship profitability approach)
•
Increase in short-term LIBOR rates key driver for long-
term upside on NIM
$898
$898
$85.9
$86.7
$87.3
$87.9
$89.5
$80.9
$81.7
$83.2
$85.7
$87.9
1Q13
2Q13
3Q13
4Q13
1Q14
Transaction deposits
Other time deposits
3.42%
3.33%
3.31%
3.21%
3.22%
$870
$875
$880
$885
$890
$895
$900
$905
$910
3.0%
3.1%
3.2%
3.3%
3.4%
3.5%
3.6%
3.7%
3.8%
3.9%
1Q13
2Q13
3Q13
4Q13
1Q14
Net Interest Income ($MM)
NIM
0.0
20.0
40.0
60.0
80.0
1Q13
2Q13
3Q13
4Q13
1Q14
Avg Coml HFI
Avg Cons HFI |
 6
©
Fifth Third Bank | All Rights Reserved
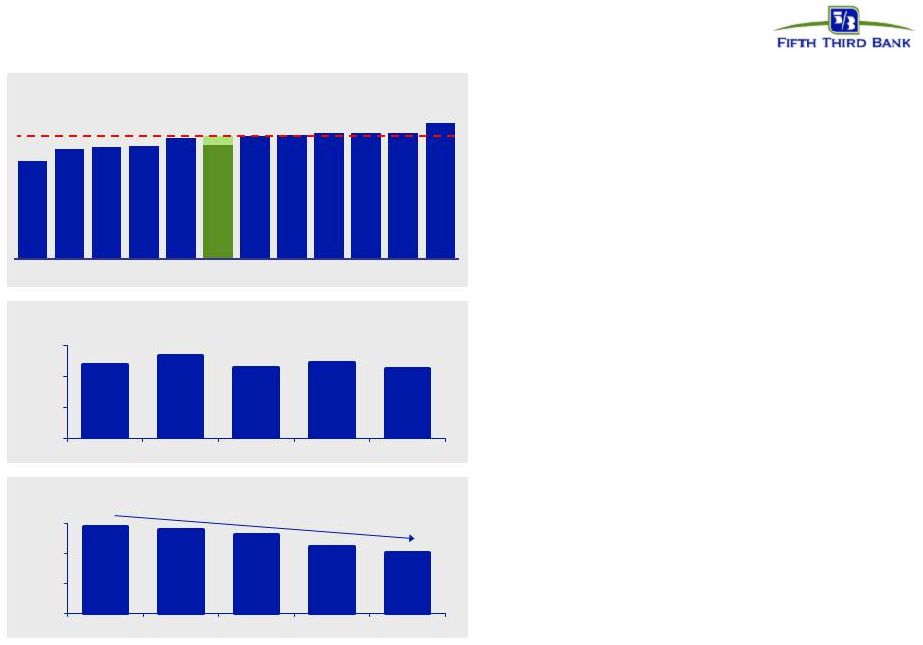
Expense discipline
Efficiency ratio
Peer median: 65%
Total FTE
•
Operating leverage is a strategic priority in all
environments
•
Expect continued improvement in 2014
•
Mid-50% efficiency ratio target
–
Normalized interest rate environment
Noninterest expense ($MM)
Source: SNL Financial and company reports. Data as of 1Q14. Efficiency ratio
calculated as reported noninterest expense / (net interest income (fully taxable equivalent)+ noninterest income)
1
FITB
adjusted
efficiency
ratio
excludes
$51MM
litigation
charges,
$36MM
negative
warrant
valuation,
$7MM
securities
gains,
$4MM
in
severance
expense
and
$1MM
positive
valuation
of
the
Visa
total
return
swap
(8%)
1
•
Reduction in FTE includes the impact of branch
staffing model changes and the reduction of
employee costs in mortgage business
•
Carefully managing expenses in response to
revenue environment (total noninterest
expense down 4% sequentially)
•
Will continue R&D investments with increased
technology, communications, and equipment
expense in 2014
52%
58%
59%
60%
64%
60%
65%
66%
66%
67%
67%
72%
65%
USB
WFC
BBT
PNC
MTB
FITB
KEY
CMA
HBAN
STI
RF
ZION
20,744
20,569
20,256
19,446
19,080
15,000
17,000
19,000
21,000
1Q13
2Q13
3Q13
4Q13
1Q14
$978
$1,035
$959
$989
$950
$500
$700
$900
$1,100
1Q13
2Q13
3Q13
4Q13
1Q14 |
 7
©
Fifth Third Bank | All Rights Reserved
Credit quality overview
$112
Net charge-offs ($MM)
$109
$168
4Q13 and 1Q14 net charge-offs elevated;
broader portfolio still at low levels
$133
NCO ratio
0.63%
0.51%
0.49%
0.67%
0.76%
$148
HFI Nonperforming assets ($MM)
$1,210
$1,150
$1,014
$946
$980
NPAs down 22% from 1Q13;
lowest level since 2007
Reserve Coverage
Accruing Past Due ($MM)
$470
$410
$414
$337
$379
Includes 1Q14 provision expense of $69MM;
reserve coverage levels remain strong.
Total delinquencies declined 28% from 1Q13;
remain at very low levels
NPA ratio
1.41% 1.32% 1.16%
1.10% 1.05%
828
794
680
607
595
382
356
334
373
351
$0
$250
$500
$750
$1,000
$1,250
1Q13
2Q13
3Q13
4Q13
1Q14
Commercial
Consumer
306
258
258
276
243
164
152
156
103
94
$0
$50
$100
$150
$200
$250
$300
$350
$400
$450
$500
1Q13
2Q13
3Q13
4Q13
1Q14
30-89 Days Past Due
90+ Days Past Due
54
45
44
78
105
79
67
65
70
63
$0
$25
$50
$75
$100
$125
$150
$175
1Q13
2Q13
3Q13
4Q13
1Q14
Commercial
Consumer
$1,783
$1,735
$1,677
$1,582
$1,483
2.08%
1.99%
1.92%
1.79%
1.65%
$0
$500
$1,000
$1,500
$2,000
0.00%
0.50%
1.00%
1.50%
2.00%
2.50%
3.00%
3.50%
1Q13
2Q13
3Q13
4Q13
1Q14
Allowance for Loan & Lease Losses (ALLL) ($MM)
ALLL / Loans and Leases |
 8
©
Fifth Third Bank | All Rights Reserved
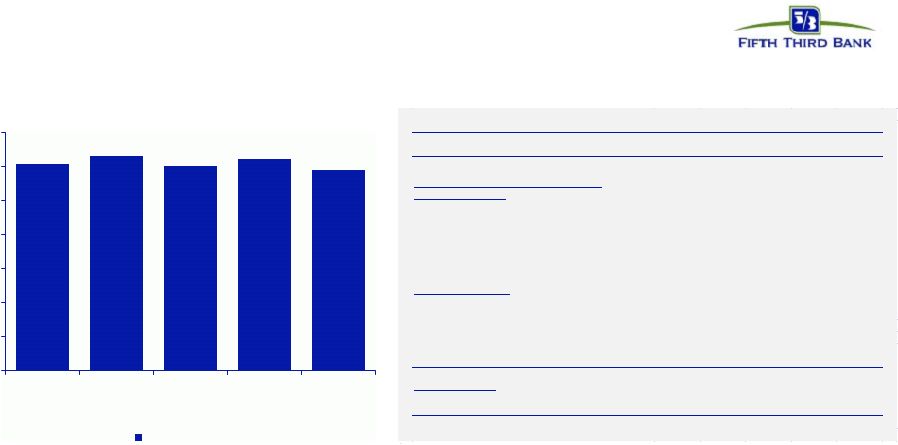
Capital management –
core focus
1
Non-GAAP measure; See Reg. G reconciliation in appendix.
2
Tier
1
common
equity
$710MM common
stock repurchases
(net of $398MM
shares issued
related to Series G
conversion)
$407MM common
dividends declared
$212MM common
stock repurchases
utilizing AT Vantiv
gains
Common Shares Outstanding (MM)
and Tangible Book Value per share
Basel III
Est.
9.0%²
Basel III
Est.
9.1%²
Basel III
Est.
9.5%²
•
2014 CCAR plan not objected to by Federal Reserve Board
•
Included the following potential actions for the period 2Q14-
1Q15, subject to Board approval and other factors:
•
2014 CCAR plan designed to maintain regulatory common equity
capital ratios generally at current levels
$0
$200
$400
$600
$800
$1,000
$1,200
$1,400
2013 Net Payouts
($MM)
9.7%
9.4%
9.9%
9.4%
9.5%
0%
2%
4%
6%
8%
10%
1Q13
2Q13
3Q13
4Q13
1Q14
913
901
888
878
858
$12.62
$12.69
$13.09
$13.00
$13.40
650
700
750
800
850
900
$11.00
$11.50
$12.00
$12.50
$13.00
$13.50
$14.00
1Q13
2Q13
3Q13
4Q13
1Q14
Common Shares O/S
TBV per share
–
The potential increase in the quarterly common
stock dividend to $0.13 per share
–
The potential repurchase of common shares in an
amount up to $669MM
–
The additional ability to repurchase shares in the
amount of any after-tax gains from the sale of
Vantiv, Inc. stock, if realized
Capital ratios presented under current U.S. capital regulations. The pro forma Basel III
Tier I common equity ratio is management’s estimate based upon its current interpretation of recent
prospective regulatory capital requirements approved in July 2013.
1 |
 9
©
Fifth Third Bank | All Rights Reserved
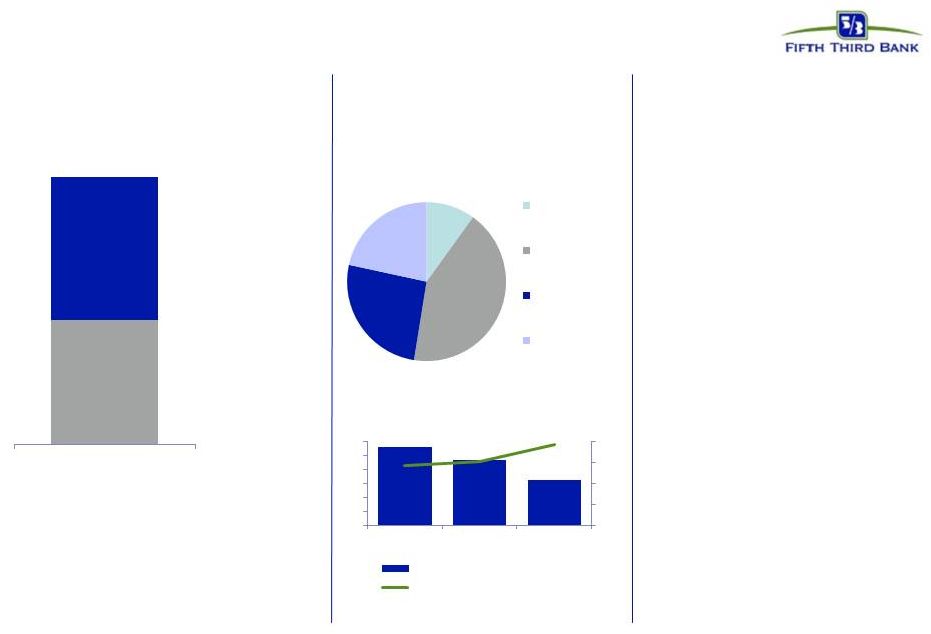
Valuable ownership stake in Vantiv, Inc.
March 2009
Significant unrecognized value unlocked
March
2009
–
Present
Realizing earning potential
Ongoing impact
Positioned well to generate future value
$2.35 billion
¹
enterprise value
Debt incurred
Equity value
¹
1
•
Equity valuation of $1.1B
–
Including $561MM cash payment
related to Advent’s 51% ownership
and put rights
–
Fifth Third retained 49% ownership
with additional warrants
Recognized value to date
($MM pre-tax)
•
Currently own 26% interest in
Vantiv Holding, LLC, convertible to
Vantiv, Inc. shares (NYSE: VNTV)
–
Carrying (book) value of
$437MM as of 3/31/14
–
Ownership (market) value of
~$1.5B as of 3/31/14
•
Ongoing equity method earnings
•
Warrant to purchase additional
shares in Vantiv
–
Carried as a derivative asset at
fair value of $348MM as of
3/31/14
•
Annual payment corresponding
with tax benefits accruing to Fifth
Third associated with the tax
receivable agreement (TRA)
–
Vantiv reported FITB TRA at a
gross value of $551MM as of
1Q14
–
FITB realized $9MM in 4Q13
Equity ownership & earnings
Total gains / earnings recognized ~$3 billion
$1.10B
$1.25B
Enterprise Value Components
$115
$493
$299
$250
Gain on IPO
Gains on share
sales and TRA
Net put and
warrant
valuation gains
Equity method
earnings
83.9
70.2
48.8
$0
$20
$40
$60
$80
0
15
30
45
60
75
90
2011
2012
2013
Class B shares (MM)
Equity method earnings ($MM)
•
Pre-tax gain of $1.8B
Before Fifth Third’s valuation of warrants, put rights, and minority interest discounts expected
to reduce its implied valuation of the business by an estimated $50 million. |
 10
©
Fifth Third Bank | All Rights Reserved
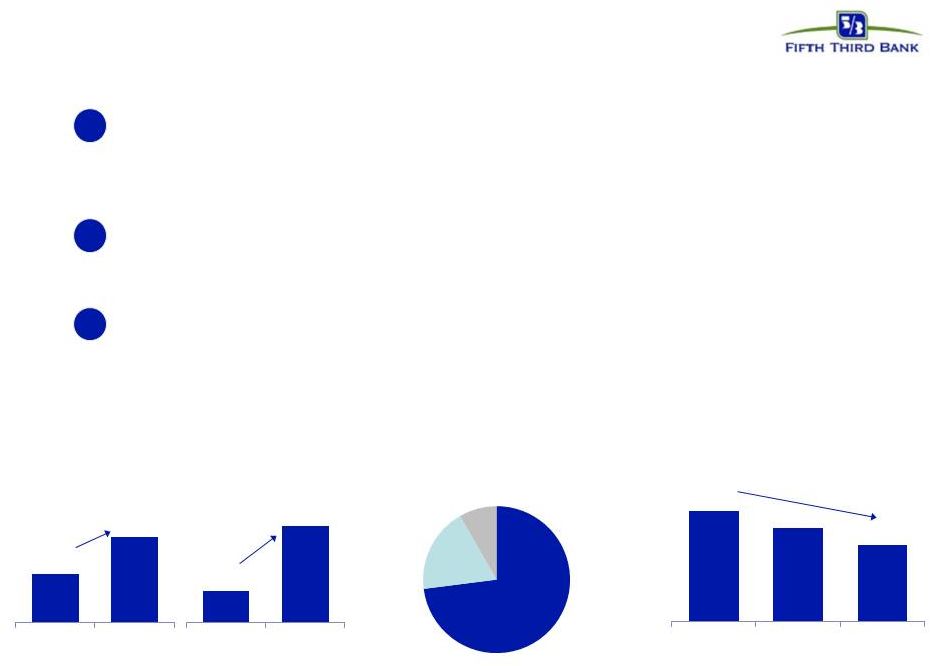
Repositioning consumer bank
with investments and strategic changes
Maximize the value offered and the revenue earned from every relationship
•
Growth in high value segments
–
Execution consistency
–
Dedicated team of specialists for focused segmentation
Optimize the current distribution model
•
Redesign branch formats and re-define job categories while preserving revenue
streams •
Testing to break through the previous minimum staffing levels by
deploying new technologies
Enhance digital capabilities to lower costs while improving the customer
experience •
Enhancement of customer service levels through the ease and convenience of digital
banking •
Deliver solutions in digital channels for increased sales effectiveness and drive
adoption 2
1
3
Online banking
2009
1Q14
47%
52%
Mobile banking
2011
1Q14
9%
26%
Alternative channel delivery
% of checking households with
Consumer deposit activity
Transaction volume by channel
73%
19%
Branch
ATM
7.5
6.8
6.1
1Q12
1Q13
1Q14
Branch Transactions
Average monthly trans. in millions
8% Mobile |
 11
©
Fifth Third Bank | All Rights Reserved
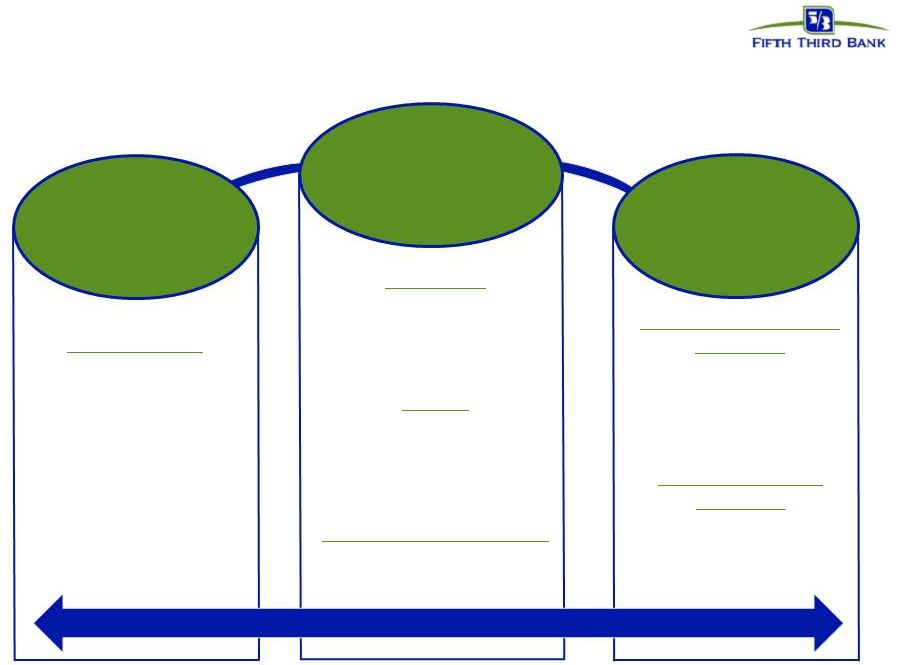
Commercial Bank –
Executing on key strategies
Healthcare
•
Expanded suite of
products designed to
meet full range of
healthcare clients’
needs
•
Innovative cash
management solutions
simplify cash handling
and improve cash flow
Currency Processing
Solutions
Segment
Specialization
Industry
Specialization
Treasury
Management
Capabilities
Energy
•
Launched in 3Q12
•
Focused on extraction and
distribution (upstream /
downstream)
Commercial Real Estate
•
Centralized group focused
on select opportunities
•
Target clients:
businesses that
generate $500MM to
$2B in revenue
•
Investments in capital
markets capabilities
•
“Lead left”
strategy
Mid-Corporate
•
Streamline processes,
reduce costs and
maximize convenience
Commercial Card
Solutions
CONSULTATIVE SALES APPROACH |
 12
©
Fifth Third Bank | All Rights Reserved
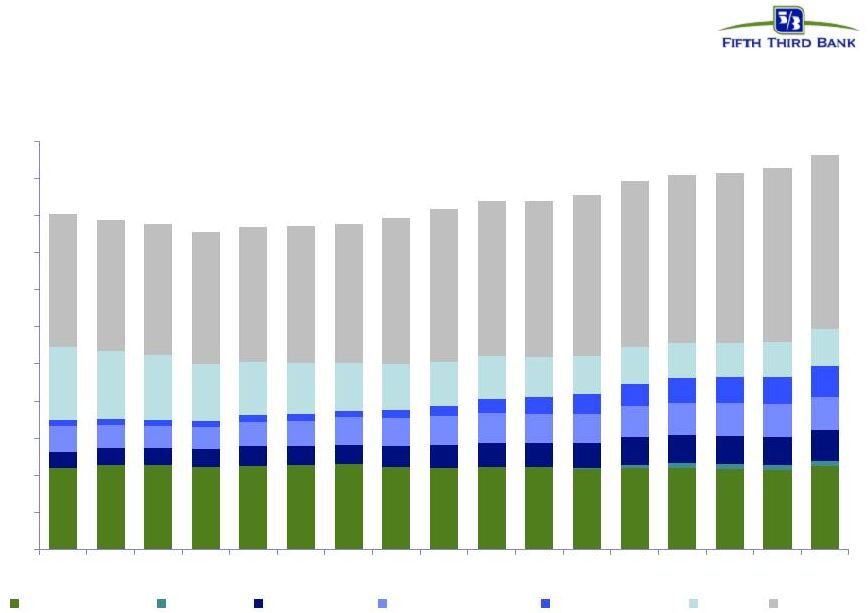
Commercial Specialization
$53.1B
$45.2B
$0
$5
$10
$15
$20
$25
$30
$35
$40
$45
$50
$55
1Q10
2Q10
3Q10
4Q10
1Q11
2Q11
3Q11
4Q11
1Q12
2Q12
3Q12
4Q12
1Q13
2Q13
3Q13
4Q13
1Q14
Total Average Commercial Loans ($B)
Middle Market
Energy
Healthcare
Large Corporate
Mid Corporate
CRE
Other |
 13
©
Fifth Third Bank | All Rights Reserved
Balance Sheet:
Average loans & leases (excl. HFS)
Average transaction deposits
Income Statement:
Net interest
income² Net
interest margin²
Noninterest
income¹
Noninterest expense
Pre-provision net revenue
1,2
ROA
¹
Effective tax rate
1,2
Asset Quality:
Net charge-offs
Loan loss allowance
4
Nonperforming assets
4
Tier 1 common equity
3,6
Category
Fifth Third: Outlook
2014 Outlook
¹
$87.0B
$82.9B
1
2013 results exclude a net $534MM benefit from gains on Vantiv share issuance and
Vantiv warrants. 2014 outlook does not include potential but currently unforecasted items, such as any
potential additional Vantiv gains or losses, future capital actions, or changes in
regulatory or accounting guidance. 2
Presented on a fully-taxable equivalent basis.
3
Non-GAAP measure; see Reg. G reconciliation in appendix.
4
Ratio as a percent of loans excluding held-for-sale; allowance expectation
assumes current expectation for credit and economic trends and is subject to review in each period.
5
As a percentage of loans and leases
6
Current period capital ratios estimated. Tier 1 common equity ratio outlook assumes
generally stable common equity levels managed through asset growth and share repurchases.
Repurchases subject to ongoing evaluation under the Federal Reserve’s CCAR
process. 2013-Adjusted
¹
Please see cautionary statement on slide 15 for risk factors related to
forward-looking statements Mid single digit growth
Mid single digit growth
Down ~$40MM (~0.50%
5
)
Lower vs. 4Q13
Down ~15% vs. 4Q13
$3.58B
3.32% (3.21% 4Q13)
$2.70B
$3.95B
$2.31B
~1.2%
~28.4%
9.39%
$501MM (0.58%
5
)
$1.6B (1.79%)
$980MM (1.10%)
~Consistent with 4Q13
Modest growth
~3.15% +/-
Down mid-to-high single digits
(up mid-single digits ex-mortgage)
Down mid-single digits
Up low-single digits
~1.15%
~27.0-27.5% |
 14
©
Fifth Third Bank | All Rights Reserved
Investment thesis
Consistent earnings power with high returns
Healthy balance sheet with strong growth potential
Long history of disciplined expense management
Commercial Bank with growing scale and scope of products and services
Redesign of Consumer Bank for long term profitability
Growing wealth management and brokerage services
Balanced capital management supporting growth and shareholder returns
|
 15
©
Fifth Third Bank | All Rights Reserved
Cautionary statement
This report contains statements that we believe are “forward-looking statements” within
the meaning of Section 27A of the Securities Act of 1933, as amended, and Rule 175 promulgated
thereunder, and Section 21E of the Securities Exchange Act of 1934, as amended, and Rule
3b-6 promulgated thereunder. These statements relate to our financial condition, results of
operations, plans, objectives, future performance or business. They usually can be identified
by the use of forward-looking language such as “will likely result,” “may,” “are expected to,” “is
anticipated,” “estimate,” “forecast,” “projected,” “intends
to,” or may include other similar words or phrases such as “believes,” “plans,”
“trend,” “objective,” “continue,” “remain,” or similar
expressions, or future or conditional verbs such as “will,” “would,” “should,” “could,”
“might,” “can,” or similar verbs. You should not place undue reliance on these
statements, as they are subject to risks and uncertainties, including but not limited to the
risk factors set forth in our most recent Annual Report on Form 10-K. When considering these forward-looking
statements, you should keep in mind these risks and uncertainties, as well as any cautionary
statements we may make. Moreover, you should treat these statements as speaking only as of the
date they are made and based only on information then actually known to us.
There are a number of important factors that could cause future results to differ materially from
historical performance and these forward- looking statements. Factors that might cause such
a difference include, but are not limited to: (1) general economic conditions and weakening in
the economy, specifically the real estate market, either nationally or in the states in which Fifth Third, one or more acquired
entities and/or the combined company do business, are less favorable than expected; (2) deteriorating
credit quality; (3) political developments, wars or other hostilities may disrupt or increase
volatility in securities markets or other economic conditions; (4) changes in the interest rate
environment reduce interest margins; (5) prepayment speeds, loan origination and sale volumes, charge-offs and loan loss
provisions; (6) Fifth Third’s ability to maintain required capital levels and adequate sources of
funding and liquidity; (7) maintaining capital requirements may limit Fifth Third’s
operations and potential growth; (8) changes and trends in capital markets; (9) problems encountered by
larger or similar financial institutions may adversely affect the banking industry and/or Fifth Third;
(10) competitive pressures among depository institutions increase significantly; (11) effects
of critical accounting policies and judgments; (12) changes in accounting policies or
procedures as may be required by the Financial Accounting Standards Board (FASB) or other regulatory
agencies; (13) legislative or regulatory changes or actions, or significant litigation,
adversely affect Fifth Third, one or more acquired entities and/or the combined company or the
businesses in which Fifth Third, one or more acquired entities and/or the combined company are engaged, including the
Dodd-Frank Wall Street Reform and Consumer Protection Act; (14) ability to maintain favorable
ratings from rating agencies; (15) fluctuation of Fifth Third’s stock price; (16) ability
to attract and retain key personnel; (17) ability to receive dividends from its subsidiaries; (18)
potentially dilutive effect of future acquisitions on current shareholders’ ownership of Fifth
Third; (19) effects of accounting or financial results of one or more acquired entities; (20)
difficulties from Fifth Third’s investment in, relationship with, and nature of the operations of Vantiv,
LLC; (21) loss of income from any sale or potential sale of businesses that could have an adverse
effect on Fifth Third’s earnings and future growth; (22) ability to secure confidential
information and deliver products and services through the use of computer systems and
telecommunications networks; and (23) the impact of reputational risk created by these developments on
such matters as business generation and retention, funding and liquidity. You
should refer to our periodic and current reports filed with the Securities and Exchange Commission, or “SEC,” for further information on
other factors, which could cause actual results to be significantly different from those expressed or
implied by these forward-looking statements. |
 16
©
Fifth Third Bank | All Rights Reserved
Appendix |
 17
©
Fifth Third Bank | All Rights Reserved
Pre-tax pre-provision earnings
PPNR trend
1
Non-GAAP measure; see Reg. G reconciliation in appendix.
2
Prior quarters include similar adjustments.
3
PPNR declined 17% sequentially, reflecting impact of $83MM and $9MM in net detriments
to 1Q14 and 4Q13, respectively. Excluding those items, adjusted PPNR declined
5% from 4Q13, driven by seasonal increase in FICA
and
unemployment
tax
expense
and
lower
mortgage
banking
net
revenue.
1
$608
$632
$603
$623
$590
$0
$100
$200
$300
$400
$500
$600
$700
1Q13
2Q13
3Q13
4Q13
1Q14
Adjusted PPNR
PPNR
$653 $905
$655 $614 $507
($ in millions)
1Q13
2Q13
3Q13
4Q13
1Q14
Income before income taxes (U.S. GAAP) (a)
$591
$841
$604
$561
$438
Add: Provision expense (U.S. GAAP) (b)
62
64
51
53
69
PPNR (a) + (b)
$653
$905
$655
$614
$507
In noninterest income:
Gain from sales of Vantiv shares
-
(242)
(85)
-
-
Vantiv warrant valuation
(34)
(76)
(6)
(91)
36
Other Vantiv-related income
-
-
-
(9)
-
Valuation of 2009 Visa total return swap
7
5
2
18
(1)
Sale of certain Fifth Third funds
(7)
-
-
-
-
BOLI settlement
-
(10)
-
-
-
Securities (gains) / losses
(17)
-
(2)
(2)
(7)
In noninterest expense:
Debt extinguishment (gains) / losses
-
-
-
8
-
Severance expense
3
1
5
8
4
Large bank assessment fees
-
-
5
-
-
Gain on sale of affordable housing investments
(9)
(2)
(1)
-
-
Donation to Fifth Third Foundation
3
-
-
8
-
Litigation reserve charges
9
51
30
69
51
Adjusted PPNR
$608
$632
$603
$623
$590
Credit-related items:
In noninterest income
10
6
5
5
10
In noninterest expense
24
35
16
(12)
9
Credit-adjusted PPNR
3
$642
$673
$624
$616
$609
Adjustments to remove (benefit) / detriment² : There are
limitations on the usefulness of credit-adjusted PPNR, including the significant degree to which changes in credit and fair value are integral, recurring components of the Bancorp’s
core operations as a financial institution. This measure has been included herein to facilitate a
greater understanding of the Bancorp’s financial condition.
Note: 1Q14, 2Q13, and 1Q13 included the impact of $3MM, $20MM, and $22MMM, respectively in
mortgage repurchase provision. 4Q13 and 3Q13 also included benefits to the mortgage repurchase
provision of $28MM and $4MM, respectively. These impacts are reflected in “Credit-related items” and “Adjusted Efficiency Ratio” listed above.
PPNR reconciliation |
 18
©
Fifth Third Bank | All Rights Reserved
Available and contingent borrowing capacity
(1Q14):
–
FHLB ~$11B available, ~$12B total
–
Federal Reserve ~$29B
Holding Company cash at 3/31/14: $2.4B
Cash currently sufficient to satisfy all fixed
obligations in a stressed environment for over
21 months (debt maturities, common and
preferred dividends, interest and other
expenses) without accessing capital markets;
relying on dividends from subsidiaries or any
other discretionary actions
Holding company unsecured debt maturities ($MM)
Bank
unsecured
debt
maturities
($MM
–
excl.
Brokered
CDs)
Heavily core funded
Strong liquidity profile
S-T
wholesale
5%
$1,250
2,312
2014
2015
2016
2017
2018
2019
2020 on
Fifth Third Bancorp
Fifth Third Capital Trust (Bancorp)
$415
$500
$2,450
$600
2014
2015
2016
2017
2018
2019
2020 On
Demand
24%
Interest
checking
20%
Savings/
MMDA
23%
Consumer
time
3%
Foreign
Office
1%
Non-Core
Deposits
3%
S-T
borrowings
2%
Other
liabilities
4%
Equity
11%
L-T debt
9%
$500
$500
$500 |
 19
©
Fifth Third Bank | All Rights Reserved
Regulation G Non-GAAP reconciliation
Fifth Third Bancorp and Subsidiaries
Regulation G Non-GAAP Reconcilation
$ and shares in millions
(unaudited)
March
December
September
June
March
2014
2013
2013
2013
2013
Income before income taxes (U.S. GAAP)
$438
$561
$604
$841
$591
Add:
Provision expense (U.S. GAAP)
69
53
51
64
62
Pre-provision net revenue (a)
507
614
655
905
653
Net income available to common shareholders (U.S. GAAP)
309
383
421
582
413
Add:
Intangible amortization, net of tax
1
1
1
1
1
Tangible net
income available to common shareholders 310
384
422
583
414
Tangible net income available to common
shareholders (annualized) (b) 1,257
1,523
1,674
2,338
1,679
Average Bancorp shareholders' equity (U.S. GAAP)
14,862
14,757
14,440
14,221
13,779
Less:
Average preferred stock
(1,034)
(703)
(593)
(717)
(398)
Average goodwill
(2,416)
(2,416)
(2,416)
(2,416)
(2,416)
Average intangible assets
(19)
(20)
(22)
(24)
(26)
Average tangible common equity
(c) 11,393
11,618
11,409
11,064
10,939
Total Bancorp shareholders' equity (U.S. GAAP)
14,826
14,589
14,641
14,239
13,882
Less:
Preferred stock
(1,034)
(1,034)
(593)
(991)
(398)
Goodwill
(2,416)
(2,416)
(2,416)
(2,416)
(2,416)
Intangible assets
(18)
(19)
(21)
(23)
(25)
Tangible common equity, including
unrealized gains / losses (d) 11,358
11,120
11,611
10,809
11,043
Less: Accumulated other comprehensive income
(196)
(82)
(218)
(149)
(333)
Tangible common equity, excluding unrealized gains /
losses (e) 11,162
11,038
11,393
10,660
10,710
Total assets (U.S. GAAP)
129,654
130,443
125,673
123,360
121,382
Less:
Goodwill
(2,416)
(2,416)
(2,416)
(2,416)
(2,416)
Intangible assets
(18)
(19)
(21)
(23)
(25)
Tangible assets, including
unrealized gains / losses (f) 127,220
128,008
123,236
120,921
118,941
Less: Accumulated other comprehensive income / loss, before tax
(302)
(126)
(335)
(229)
(512)
Tangible assets, excluding unrealized gains / losses
(g) 126,918
127,882
122,901
120,692
118,429
Common shares outstanding (h)
848
855
887
851
875
Ratios:
Return on average tangible common equity (b) / (c)
11.0%
13.1%
14.7%
21.1%
15.4%
Tangible common equity (excluding unrealized gains/losses) (e) / (g)
8.79%
8.63%
9.27%
8.83%
9.03%
Tangible common equity (including unrealized gains/losses) (d) / (f)
8.93%
8.69%
9.42%
8.94%
9.28%
Tangible book value per share (d) / (h)
13.40
13.00
13.09
12.69
12.62
For the Three Months Ended |
 20
©
Fifth Third Bank | All Rights Reserved
Regulation G Non-GAAP reconciliation
Fifth Third Bancorp and Subsidiaries
Regulation G Non-GAAP Reconcilation
$ and shares in millions
(unaudited)
March
December
September
June
March
2014
2013
2013
2013
2012
Total Bancorp shareholders' equity (U.S. GAAP)
$14,826
$14,589
$14,641
$14,239
$13,882
Goodwill and certain other intangibles
(2,490)
(2,492)
(2,492)
(2,496)
(2,504)
Unrealized gains
(196)
(82)
(218)
(149)
(333)
Qualifying trust preferred securities
60
60
810
810
810
Other
(18)
19
21
22
23
Tier I capital
12,182
12,094
12,762
12,426
11,878
Less:
Preferred stock
(1,034)
(1,034)
(593)
(991)
(398)
Qualifying trust preferred securities
(60)
(60)
(810)
(810)
(810)
Qualifying noncontrolling interest in consolidated subsidiaries
(1)
(37)
(39)
(38)
(38)
Tier I common equity (a)
11,087
10,963
11,320
10,587
10,632
Risk-weighted assets, determined in accordance with
prescribed regulatory requirements (b)
116,622
116,736
114,544
112,285
109,626
Ratio:
Tier I common equity (a) / (b)
9.51%
9.39%
9.88%
9.43%
9.70%
Basel III -
Estimated Tier 1 common equity ratio
March
December
September
2014
2013
2013
Tier 1 common equity (Basel I)
$11,087
$10,963
$11,320
Add:
Adjustment related to capital components
$99
$82
$88
Estimated Tier 1 common equity under final Basel III rules without AOCI (opt
out)(c) $11,186
$11,045
$11,408
Add:
Adjustment related to AOCI
$196
$82
$218
Estimated Tier 1 common equity under final Basel III rules with AOCI (non opt
out)(d) $11,382
$11,127
$11,626
Estimated risk-weighted assets under final Basel III rules (e)
122,659
122,851
120,447
Estimated
Tier
1
common
equity
ratio
under
final
Basel
III
rules
(opt
out)
(c)
/
(e)
9.12%
8.99%
9.47%
Estimated
Tier
1
common
equity
ratio
under
final
Basel
III
rules
(non
opt
out)
(d)
/
(e)
9.28%
9.06%
9.65%
(c), (d)
(e)
Under the final Basel III rules, non-advanced approach banks are permitted to
make a one-time election to opt out of the requirement to include AOCI in Tier 1 common equity.
Other
adjustments
include
mortgage
servicing
rights
and
deferred
tax
assets
subject
to
threshold
limitations
and
deferred
tax
liabilities
related
to
intangible
assets.
Key
differences
under
Basel
III
in
the
calculation
of
risk-weighted
assets
compared
to
Basel
I
include:
(1)
Risk
weighting
for
commitments
under
1
year;
(2)
Higher
risk
weighting
for
exposures
to
securitizations,
past
due
loans,
foreign
banks
and
certain
commercial
real
estate;
(3)
Higher
risk
weighting
for
mortgage
servicing
rights
and
deferred
tax
assets
that
are
under
certain
thresholds
as
a
percent
of
Tier
1
capital;
and
(4)
Derivatives
are
differentiated
between
exchange
clearing
and
over-the-counter
and
the
50%
risk-weight
cap is removed.
For the Three Months Ended |
 21
©
Fifth Third Bank | All Rights Reserved
Regulation G Non-GAAP reconciliation
Fifth Third Bancorp and Subsidiaries
Regulation G Non-GAAP Reconcilation
$ and shares in millions
(unaudited)
2013
2012
2011
2010
2009
Total Bancorp shareholders' equity (U.S. GAAP)
$14,589
$13,716
$13,201
$14,051
$13,497
Goodwill and certain other intangibles
(2,492)
(2,499)
(2,514)
(2,546)
(2,565)
Unrealized gains
(82)
(375)
(470)
(314)
(241)
Qualifying trust preferred securities
60
810
2,248
2,763
2,763
Other
19
33
38
11
(26)
Tier I capital
12,094
11,685
12,503
13,965
13,428
Less:
Preferred stock
(1,034)
(398)
(398)
(3,654)
(3,609)
Qualifying trust preferred securities
(60)
(810)
(2,248)
(2,763)
(2,763)
Qualifying noncontrolling interest in consolidated subsidiaries
(37)
(48)
(50)
(30)
-
Tier I common equity (a)
10,963
10,429
9,807
7,518
7,056
Risk-weighted assets, determined in accordance with
prescribed regulatory requirements (b)
116,736
109,699
104,945
100,561
100,933
Ratio:
Tier I common equity (a) / (b)
9.39%
9.51%
9.35%
7.48%
6.99%
For the Year Ended |