Attached files
| file | filename |
|---|---|
| 8-K - CURRENT REPORT - MUTUALFIRST FINANCIAL INC | v377998_8k.htm |
| EX-99.2 - PRESS RELEASE - MUTUALFIRST FINANCIAL INC | v377998_ex99-2.htm |

2013 ANNUAL MEETING MAY 7, 2014 SYMBOL: MFSF
This presentation contains statements which constitute forward looking statements within the meaning of the Private Securities Litigation Reform Act of 1995. These statements may appear in a number of places in this presentation and include statements regarding the intent, belief, outlook, estimate or expectations of the company, its directors or its officers primarily with respect to future events and the future financial performance of the company, including but not limited to preliminary estimated ProForma combined financial information. Readers of this presentation are cautioned that any such forward looking statements are not guarantees of future events or performance and involve risk and uncertainties, and that actual results may differ materially from those in the forward looking statements as a result of various factors. These factors include, but are not limited to, the loss of deposits and loan demand to competitors; substantial changes in financial markets; changes in real estate values and the real estate market; regulatory changes; or other risk factors discussed in the latest SEC form 10 - k. The Company does not undertake – and specifically disclaims any obligation – to publicly release the result of any revisions which may be made to any forward - looking statements to reflect events or circumstances after the date of such statements or to reflect the occurrence of anticipated or unanticipated events. Forward Looking Statement

A year of building momentum
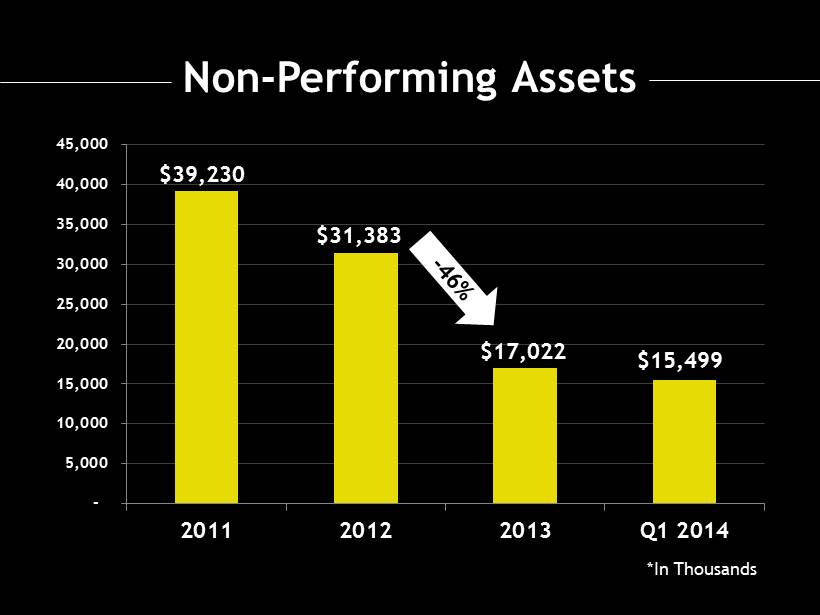
Non - Performing Assets - 5,000 10,000 15,000 20,000 25,000 30,000 35,000 40,000 45,000 2011 2012 2013 Q1 2014 *In Thousands $17,022 $15,499 $39,230 $31,383
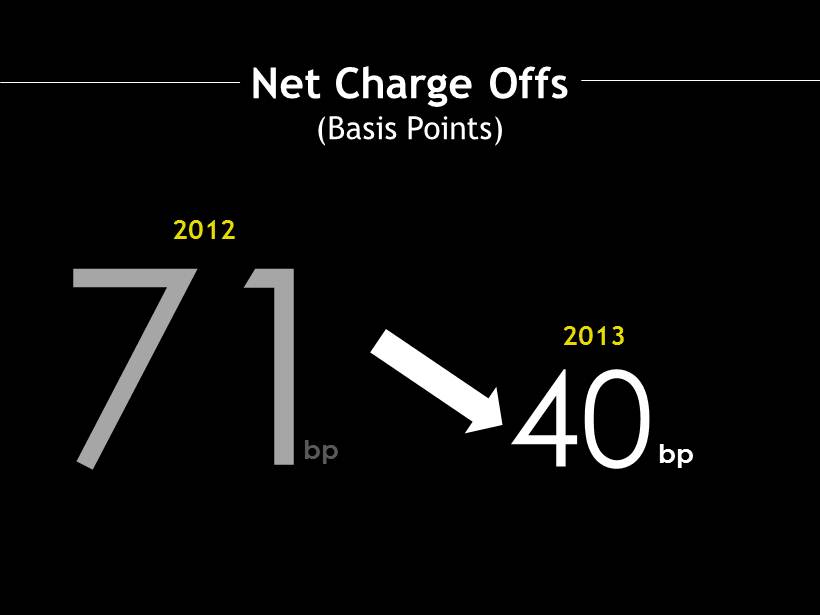
Net Charge Offs (Basis Points) 2012 40 2013 bp bp
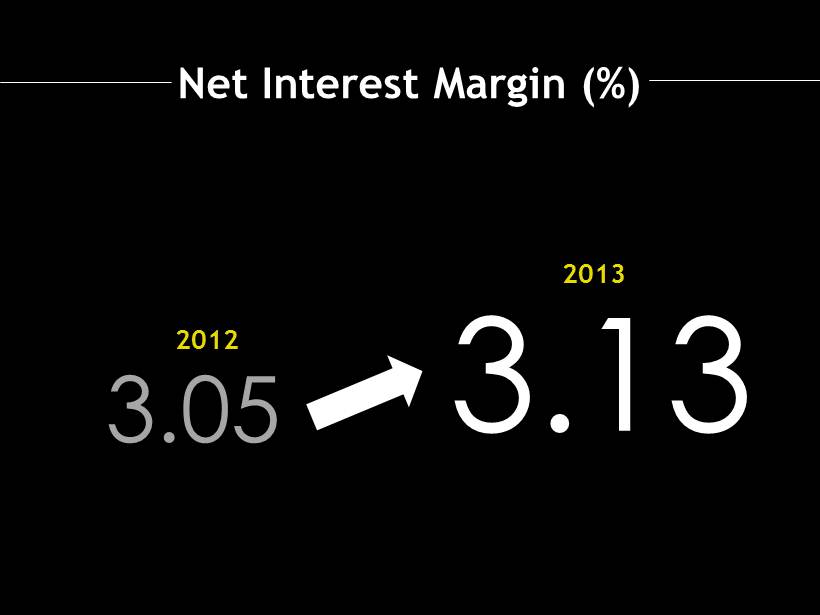
Net Interest Margin (%) 3.13 2012 3.05 2013
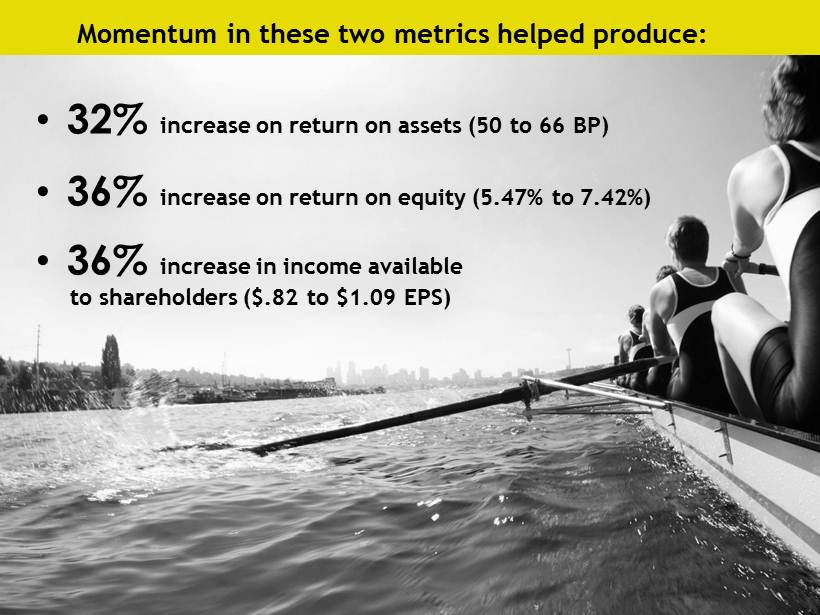
• 32% increase on return on assets (50 to 66 BP) • 36% increase on return on equity ( 5.47 % to 7.42 %) • 36% increase in income available to shareholders ($.82 to $1.09 EPS) Momentum in these two metrics helped produce:
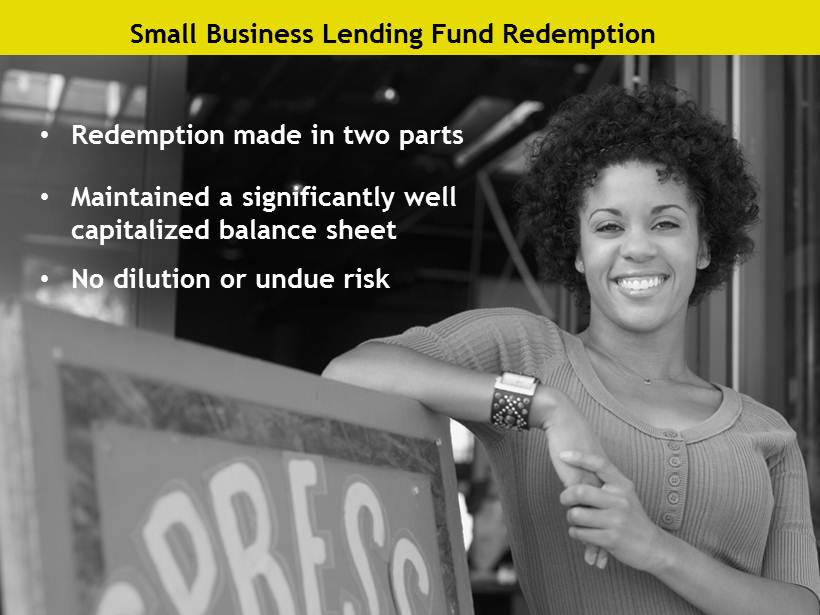
Small Business Lending Fund Redemption • Redemption made in two parts • Maintained a significantly well capitalized balance sheet • No dilution or undue risk

2012 - 2014 Strategic Plan Initiatives • Improve Credit Quality • Increase Earnings • Effectively Manage Our Capital • Enhance the Markets in which We Serve • Enhance Shareholder Value
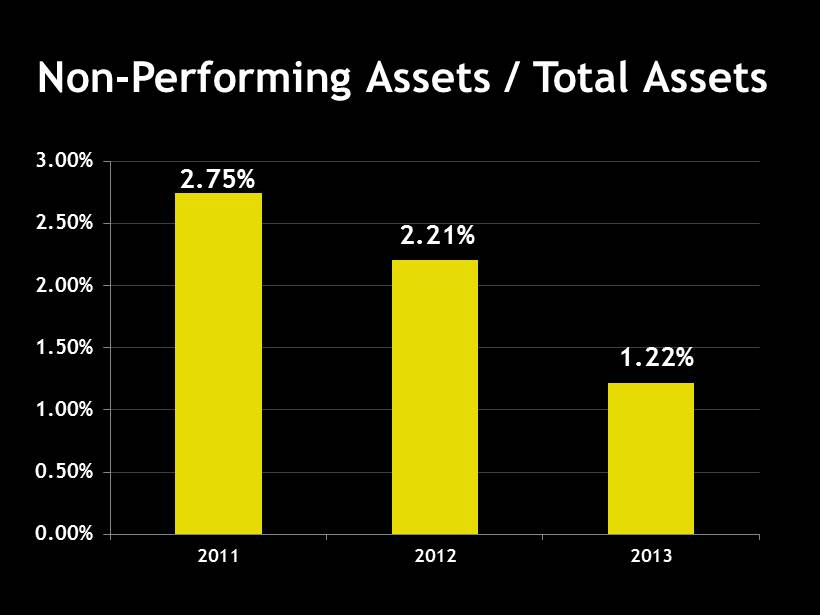
Non - Performing Assets / Total Assets 0.00% 0.50% 1.00% 1.50% 2.00% 2.50% 3.00% 2011 2012 2013 2.75% 2.21% 1.22%
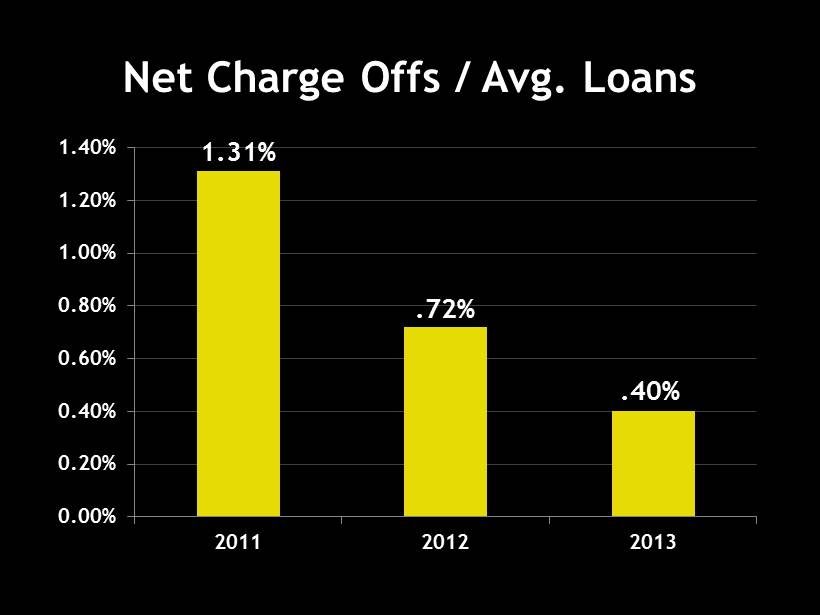
Net Charge Offs / Avg. Loans 0.00% 0.20% 0.40% 0.60% 0.80% 1.00% 1.20% 1.40% 2011 2012 2013 1.31% .72% .40%
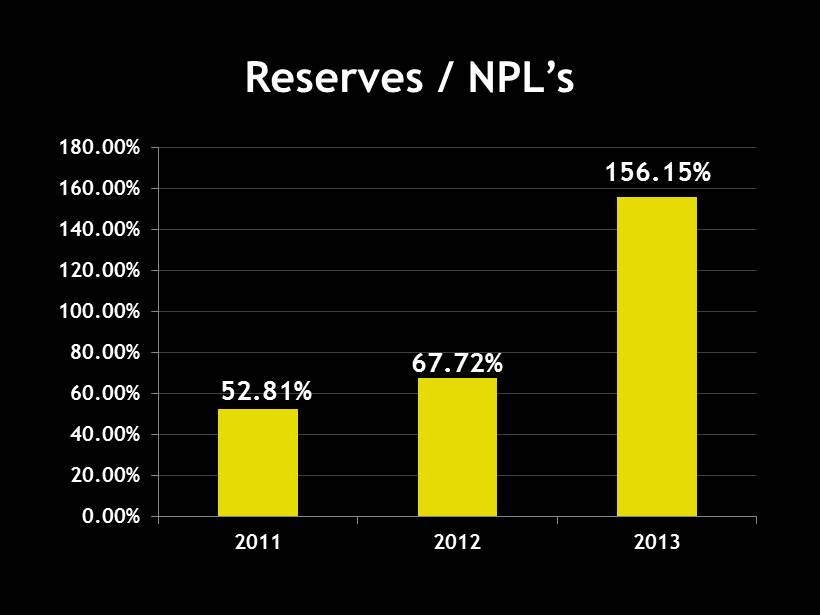
Reserves / NPL’s 0.00% 20.00% 40.00% 60.00% 80.00% 100.00% 120.00% 140.00% 160.00% 180.00% 2011 2012 2013 52.81% 67.72% 156.15%
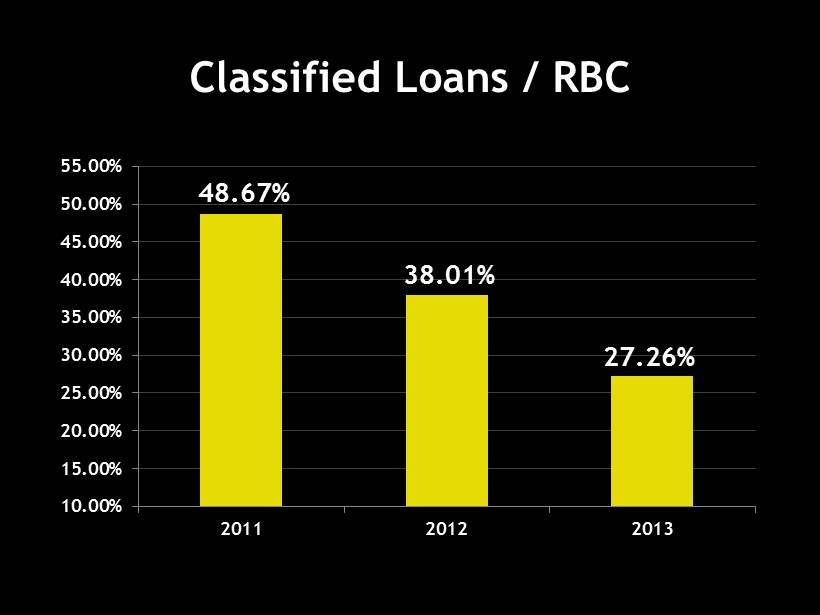
Classified Loans / RBC 10.00% 15.00% 20.00% 25.00% 30.00% 35.00% 40.00% 45.00% 50.00% 55.00% 2011 2012 2013 48.67% 38.01% 27.26%
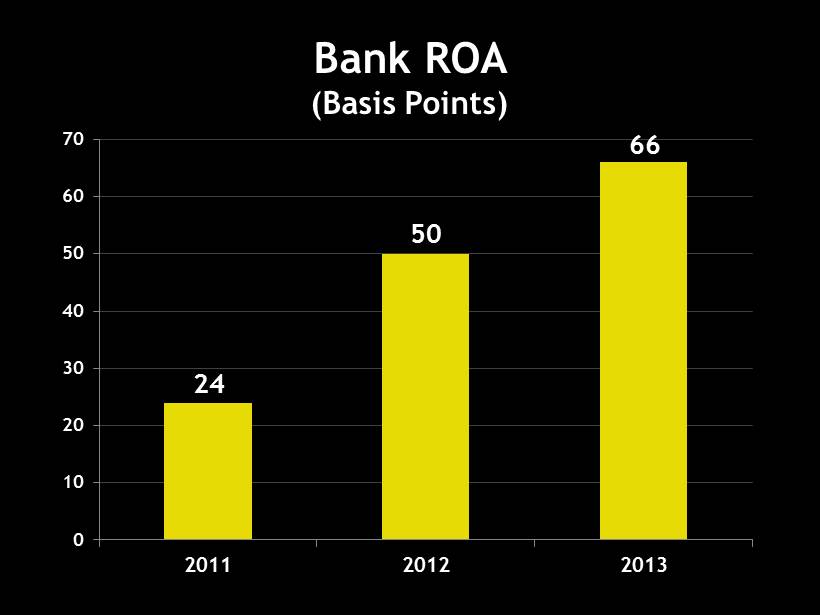
Bank ROA (Basis Points) 0 10 20 30 40 50 60 70 2011 2012 2013 24 50 66
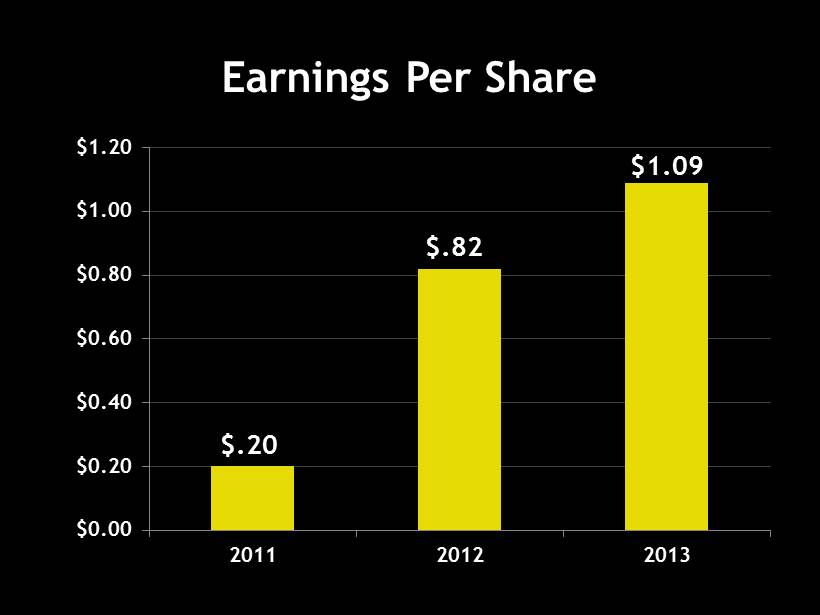
Earnings Per Share $0.00 $0.20 $0.40 $0.60 $0.80 $1.00 $1.20 2011 2012 2013 $ .20 $.82 $1.09
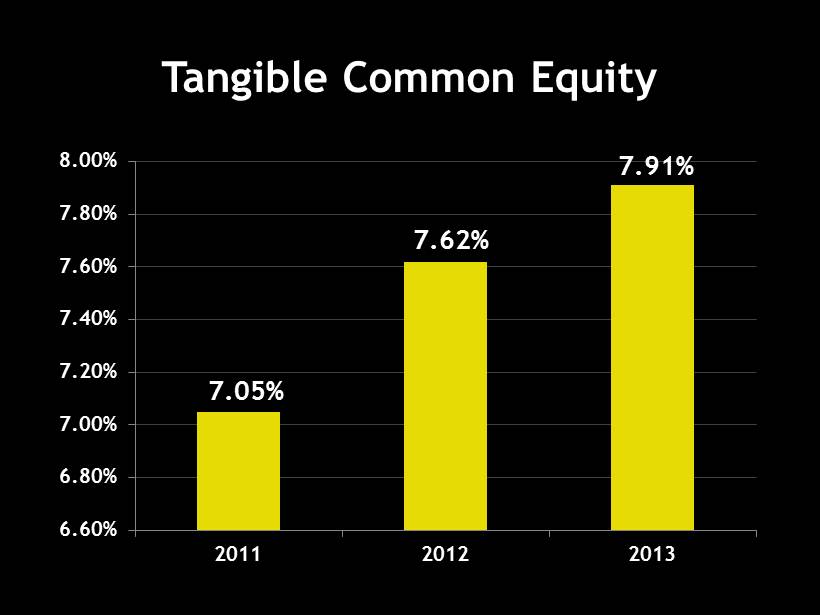
Tangible Common Equity 6.60% 6.80% 7.00% 7.20% 7.40% 7.60% 7.80% 8.00% 2011 2012 2013 7.05% 7.62% 7.91%
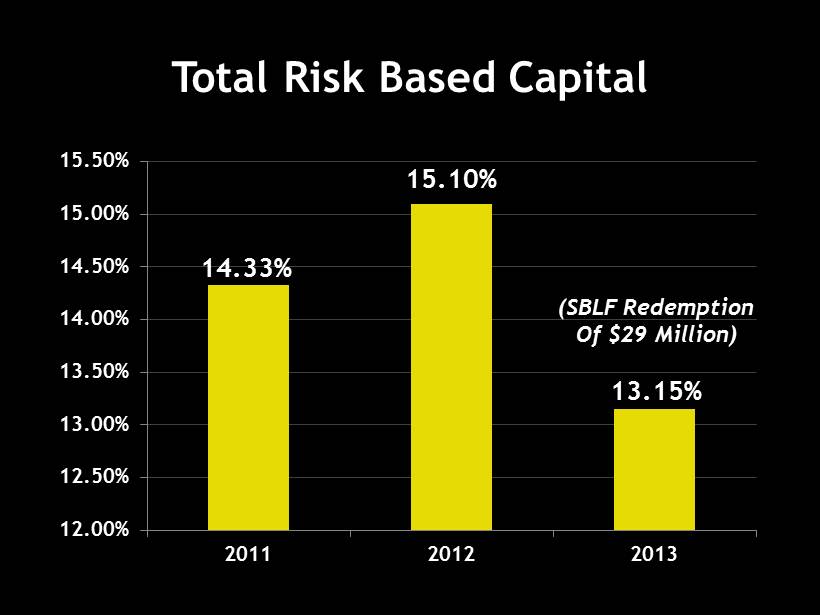
Total Risk Based Capital 12.00% 12.50% 13.00% 13.50% 14.00% 14.50% 15.00% 15.50% 2011 2012 2013 14.33% 15.10% 13.15% (SBLF Redemption Of $29 Million)
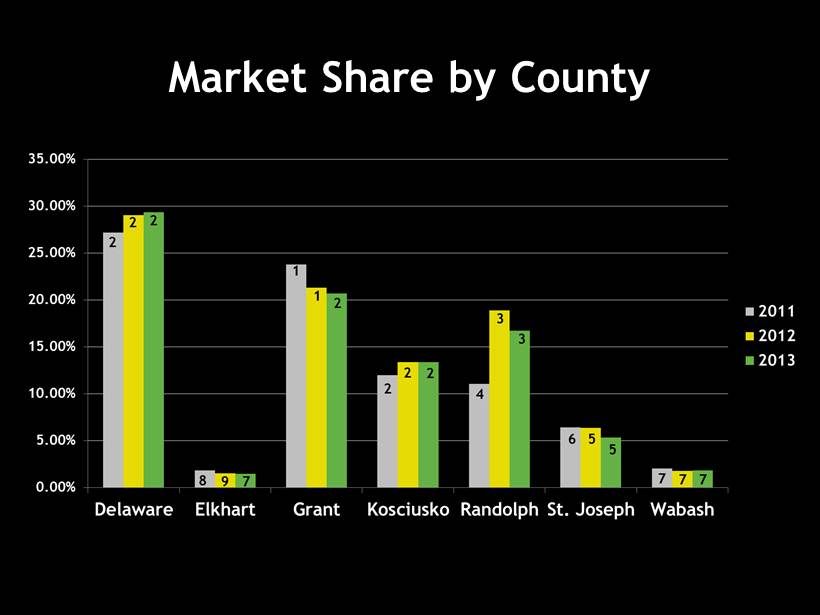
Market Share by County 2 2 2 8 9 7 1 1 2 2 2 2 4 3 3 6 5 5 7 7 7
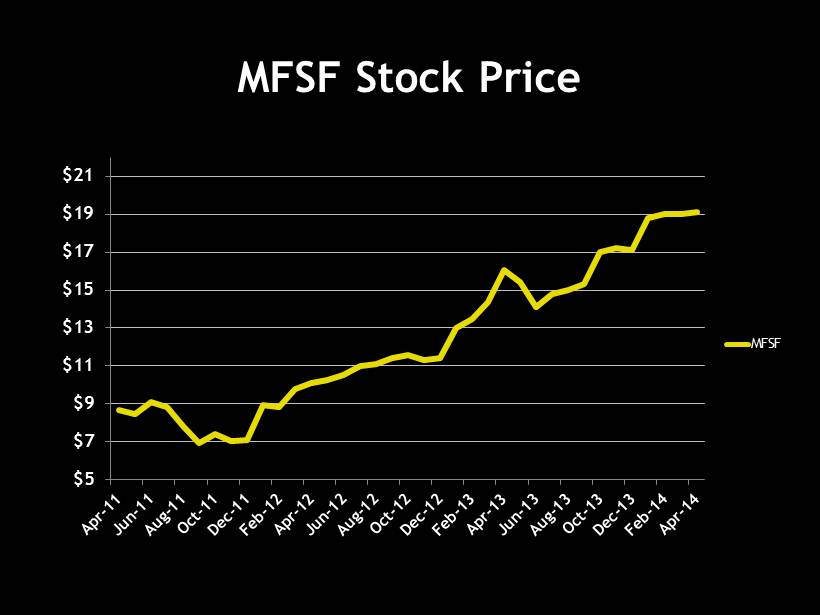
MFSF Stock Price $5 $7 $9 $11 $13 $15 $17 $19 $21 MFSF

2013 In Review Chris Cook, CFO, Treasurer MutualBank
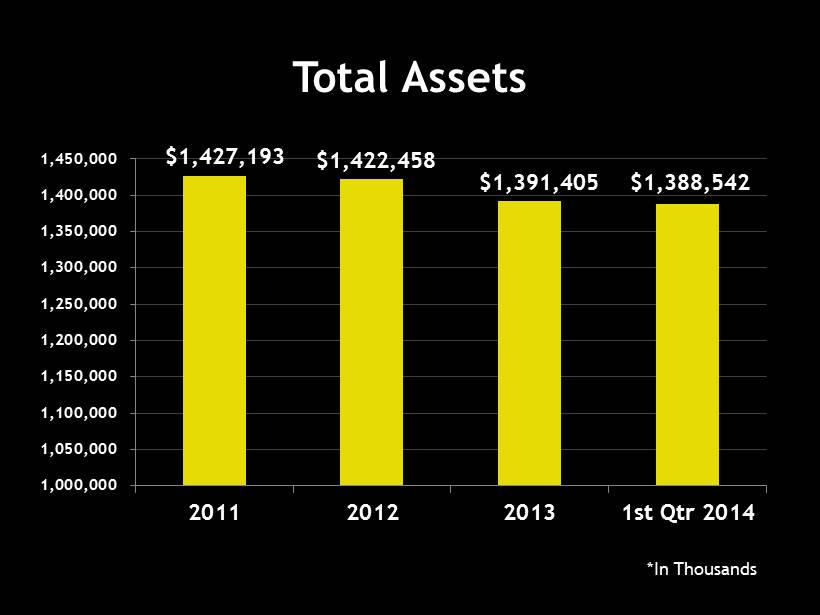
Total Assets *In Thousands 1,000,000 1,050,000 1,100,000 1,150,000 1,200,000 1,250,000 1,300,000 1,350,000 1,400,000 1,450,000 2011 2012 2013 1st Qtr 2014 $1,391,405 $1,388,542 $1,422,458 $1,427,193
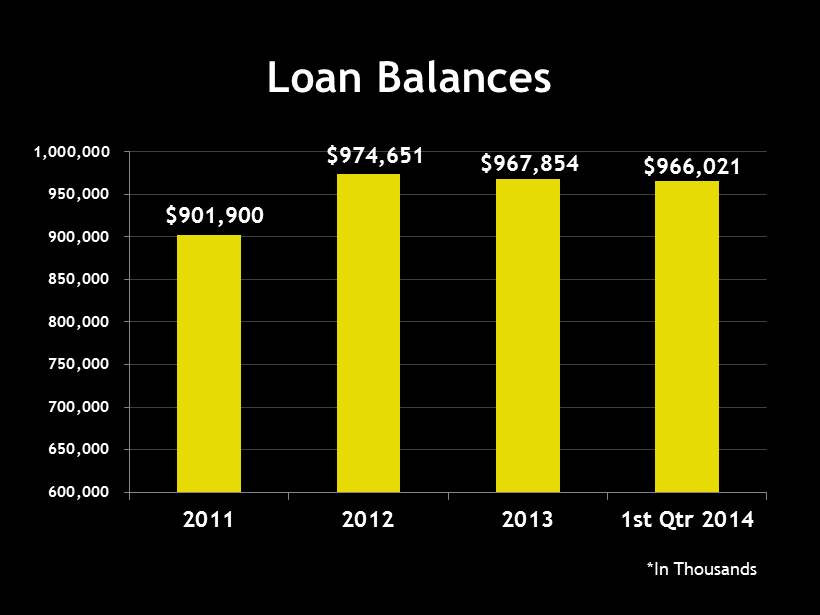
Loan Balances 600,000 650,000 700,000 750,000 800,000 850,000 900,000 950,000 1,000,000 2011 2012 2013 1st Qtr 2014 *In Thousands $967,854 $966,021 $901,900 $974,651
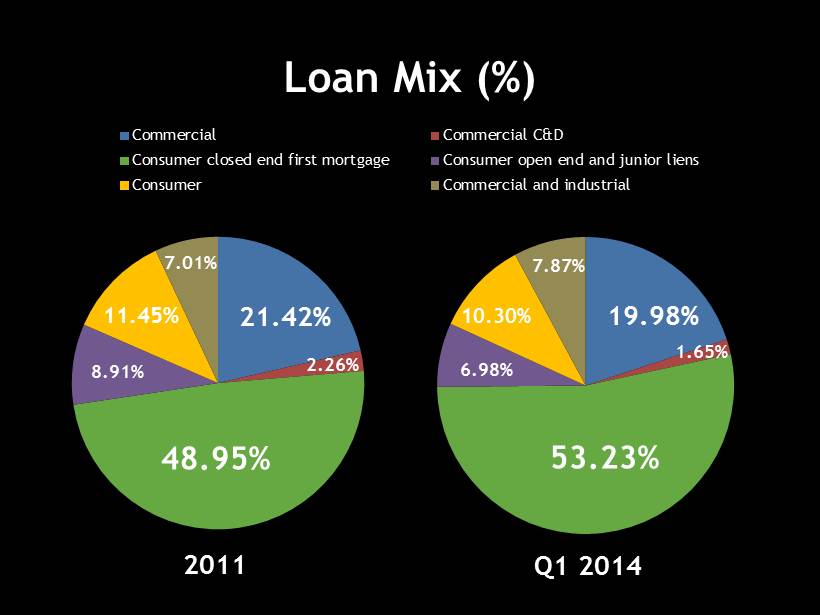
21.42% 2.26% 48.95% 8.91% 11.45% 7.01% Commercial Commercial C&D Consumer closed end first mortgage Consumer open end and junior liens Consumer Commercial and industrial Loan Mix (%) 2011 Q1 2014 19.98% 1.65% 53.23% 6.98% 10.30% 7.87%
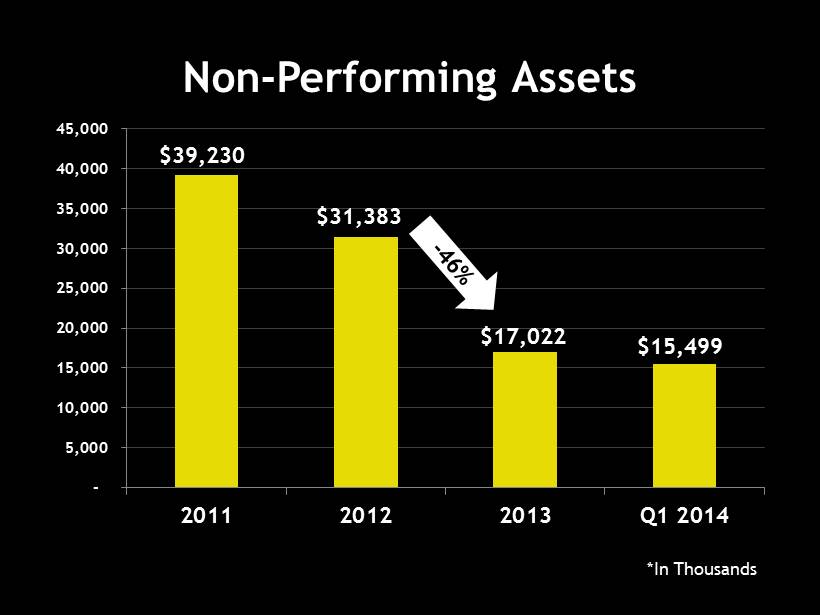
Non - Performing Assets - 5,000 10,000 15,000 20,000 25,000 30,000 35,000 40,000 45,000 2011 2012 2013 Q1 2014 *In Thousands $17,022 $15,499 $39,230 $31,383
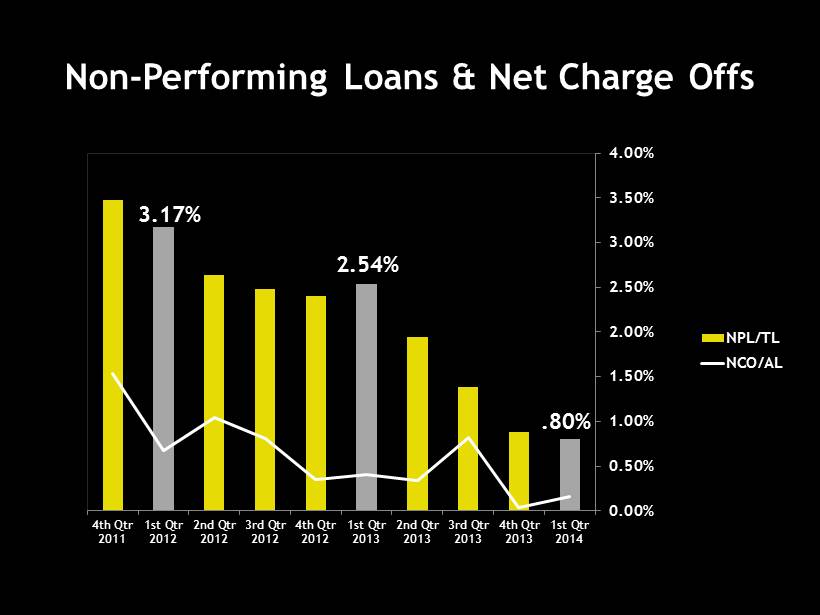
Non - Performing Loans & Net Charge Offs 4th Qtr 2011 1st Qtr 2012 2nd Qtr 2012 3rd Qtr 2012 4th Qtr 2012 1st Qtr 2013 2nd Qtr 2013 3rd Qtr 2013 4th Qtr 2013 1st Qtr 2014 0.00% 0.50% 1.00% 1.50% 2.00% 2.50% 3.00% 3.50% 4.00% NPL/TL NCO/AL 3.17% 2.54% .80%
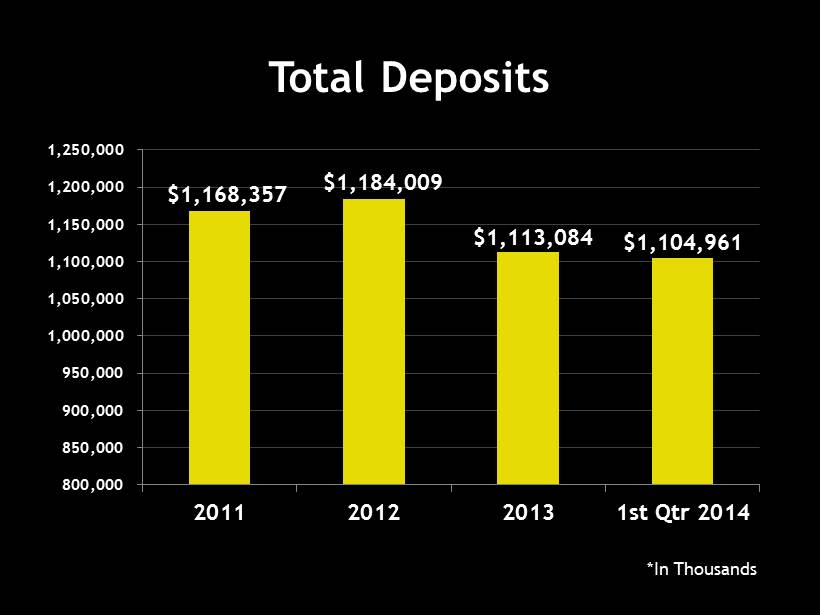
Total Deposits 800,000 850,000 900,000 950,000 1,000,000 1,050,000 1,100,000 1,150,000 1,200,000 1,250,000 2011 2012 2013 1st Qtr 2014 *In Thousands $1,113,084 $1,104,961 $1,168,357 $1,184,009
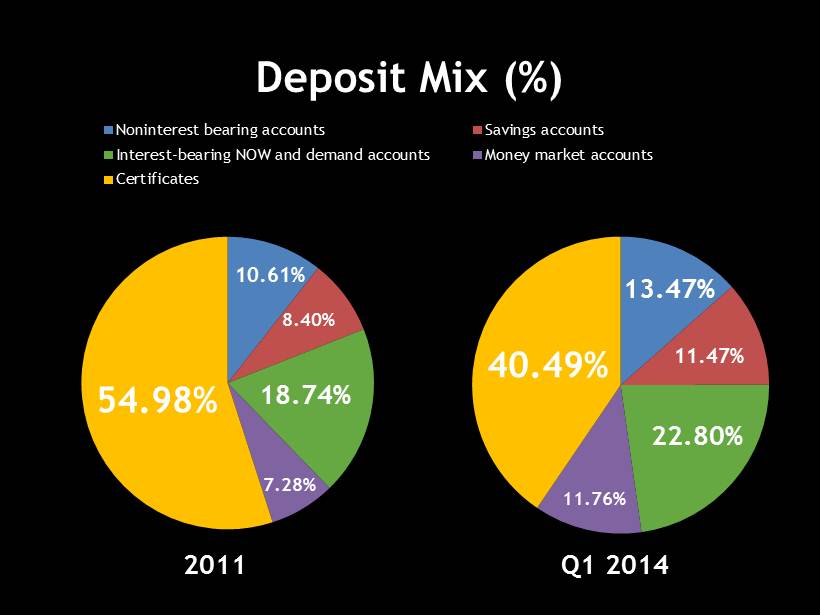
10.61% 8.40% 18.74% 7.28% 54.98% Noninterest bearing accounts Savings accounts Interest-bearing NOW and demand accounts Money market accounts Certificates Deposit Mix (%) 2011 Q1 2014 13.47% 11.47% 22.80% 11.76% 40.49%
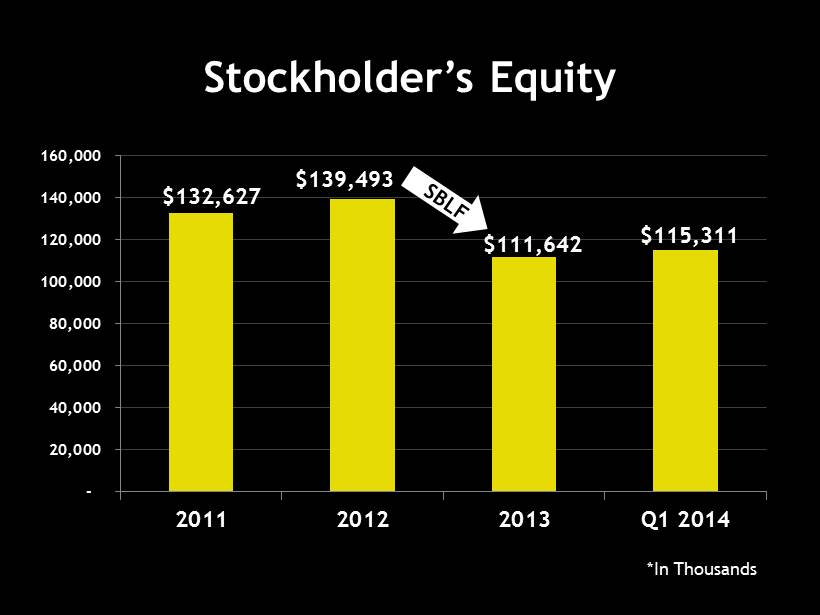
Stockholder’s Equity - 20,000 40,000 60,000 80,000 100,000 120,000 140,000 160,000 2011 2012 2013 Q1 2014 *In Thousands $111,642 $115,311 $132,627 $139,493
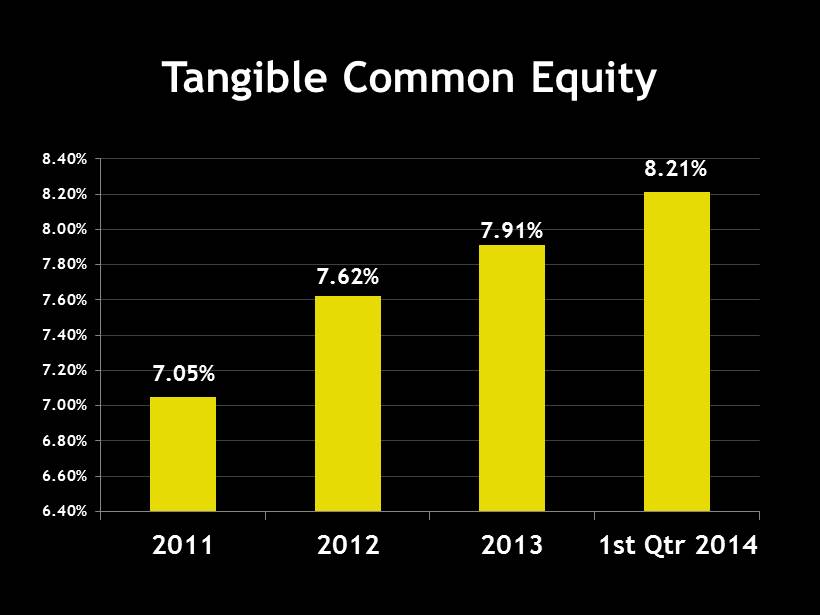
Tangible Common Equity 6.40% 6.60% 6.80% 7.00% 7.20% 7.40% 7.60% 7.80% 8.00% 8.20% 8.40% 2011 2012 2013 1st Qtr 2014 7.91% 8.21% 7.05% 7.62%
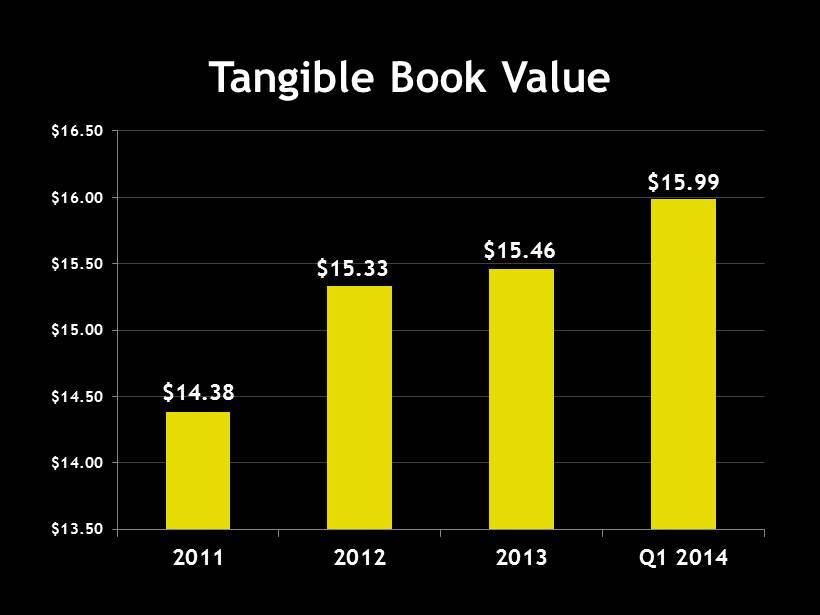
Tangible Book Value $13.50 $14.00 $14.50 $15.00 $15.50 $16.00 $16.50 2011 2012 2013 Q1 2014 $15.46 $15.99 $14.38 $15.33
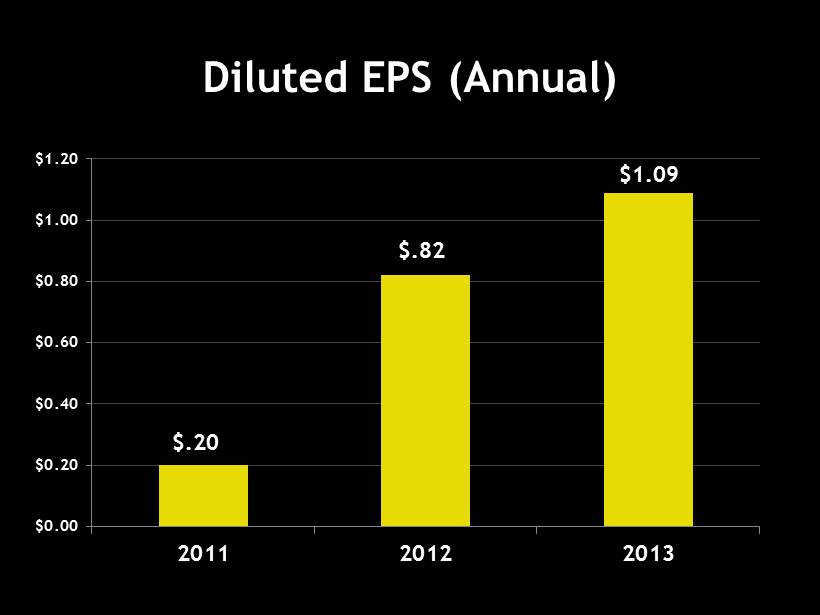
Diluted EPS (Annual) $0.00 $0.20 $0.40 $0.60 $0.80 $1.00 $1.20 2011 2012 2013 $1.09 $.20 $.82
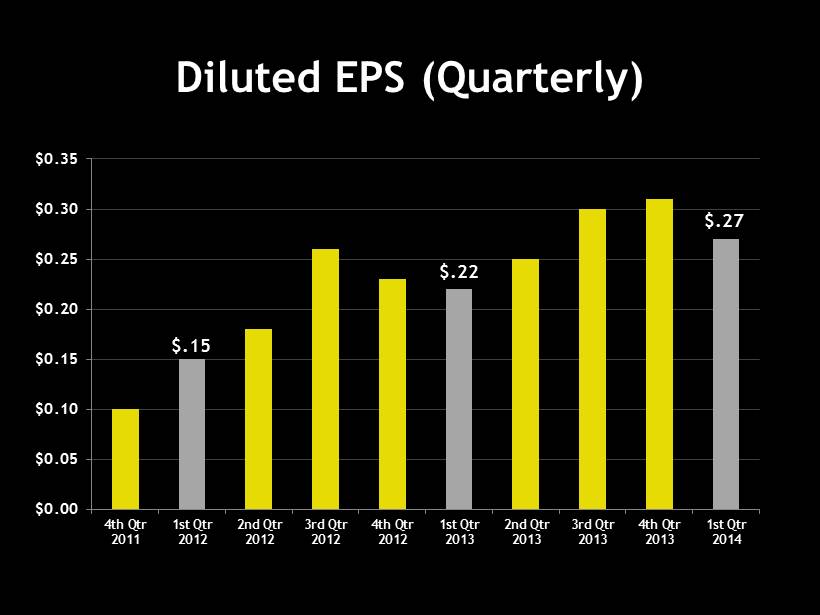
Diluted EPS (Quarterly) $0.00 $0.05 $0.10 $0.15 $0.20 $0.25 $0.30 $0.35 4th Qtr 2011 1st Qtr 2012 2nd Qtr 2012 3rd Qtr 2012 4th Qtr 2012 1st Qtr 2013 2nd Qtr 2013 3rd Qtr 2013 4th Qtr 2013 1st Qtr 2014 $.15 $.22 $.27
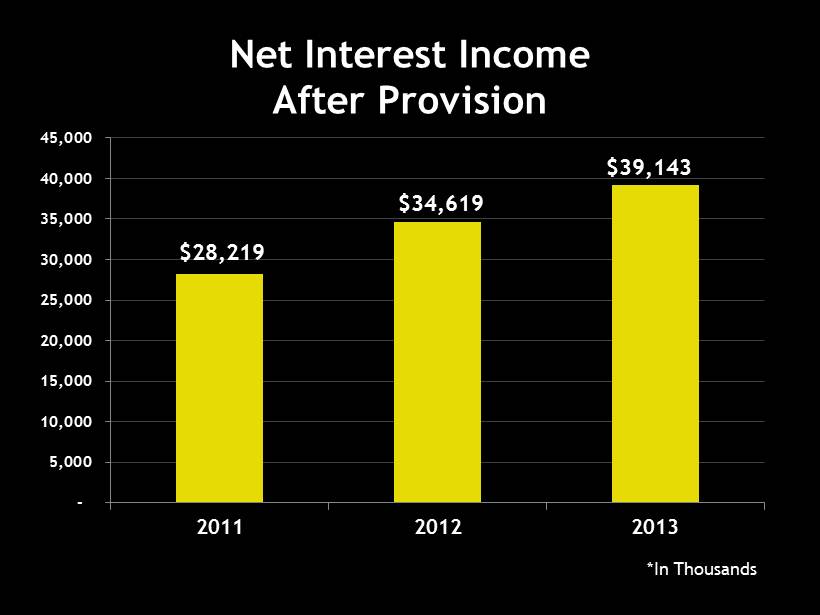
Net Interest Income After Provision - 5,000 10,000 15,000 20,000 25,000 30,000 35,000 40,000 45,000 2011 2012 2013 *In Thousands $39,143 $34,619 $28,219
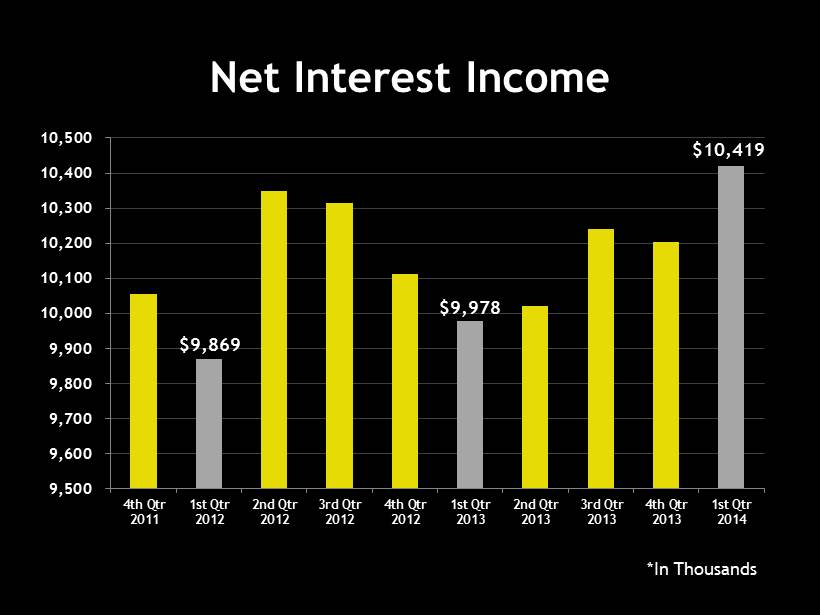
Net Interest Income 9,500 9,600 9,700 9,800 9,900 10,000 10,100 10,200 10,300 10,400 10,500 4th Qtr 2011 1st Qtr 2012 2nd Qtr 2012 3rd Qtr 2012 4th Qtr 2012 1st Qtr 2013 2nd Qtr 2013 3rd Qtr 2013 4th Qtr 2013 1st Qtr 2014 *In Thousands $9,869 $9,978 $10,419
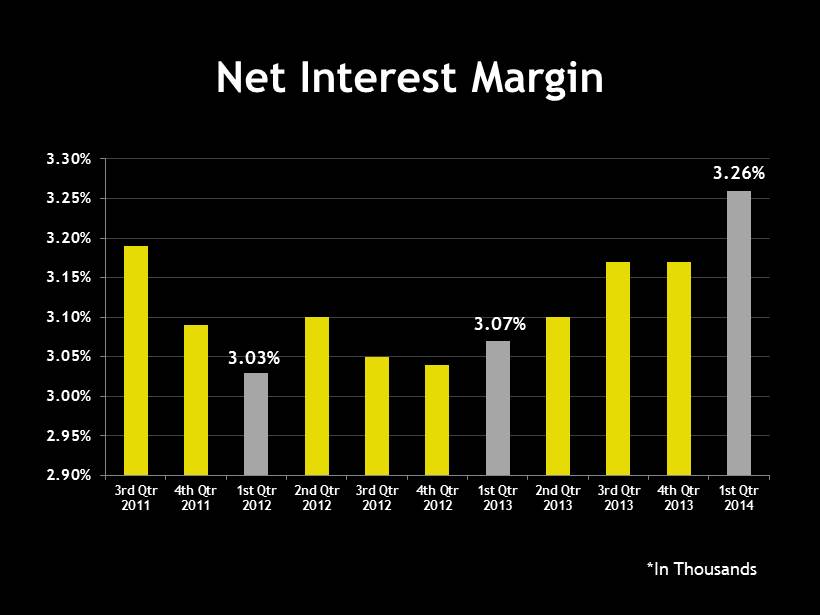
Net Interest Margin 2.90% 2.95% 3.00% 3.05% 3.10% 3.15% 3.20% 3.25% 3.30% 3rd Qtr 2011 4th Qtr 2011 1st Qtr 2012 2nd Qtr 2012 3rd Qtr 2012 4th Qtr 2012 1st Qtr 2013 2nd Qtr 2013 3rd Qtr 2013 4th Qtr 2013 1st Qtr 2014 *In Thousands 3.03% 3.07% 3.26%
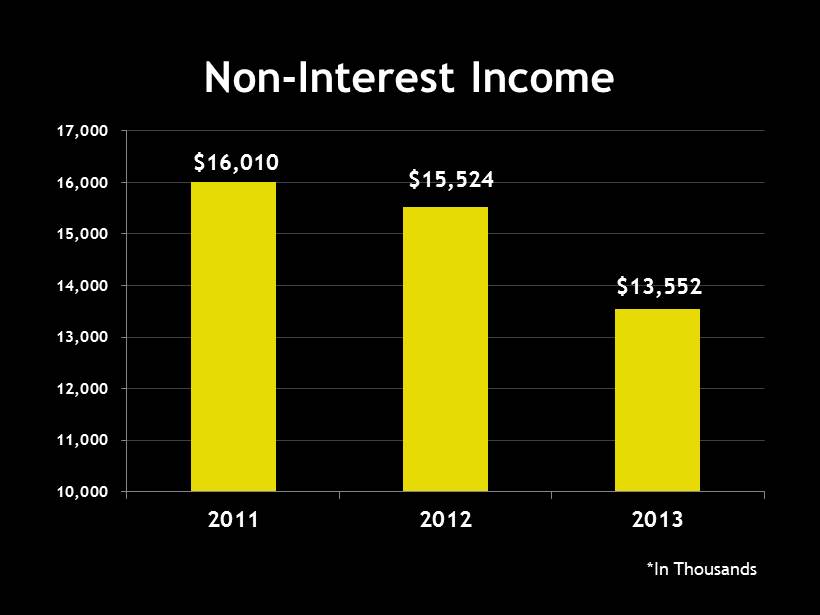
Non - Interest Income 10,000 11,000 12,000 13,000 14,000 15,000 16,000 17,000 2011 2012 2013 *In Thousands $13,552 $16,010 $15,524
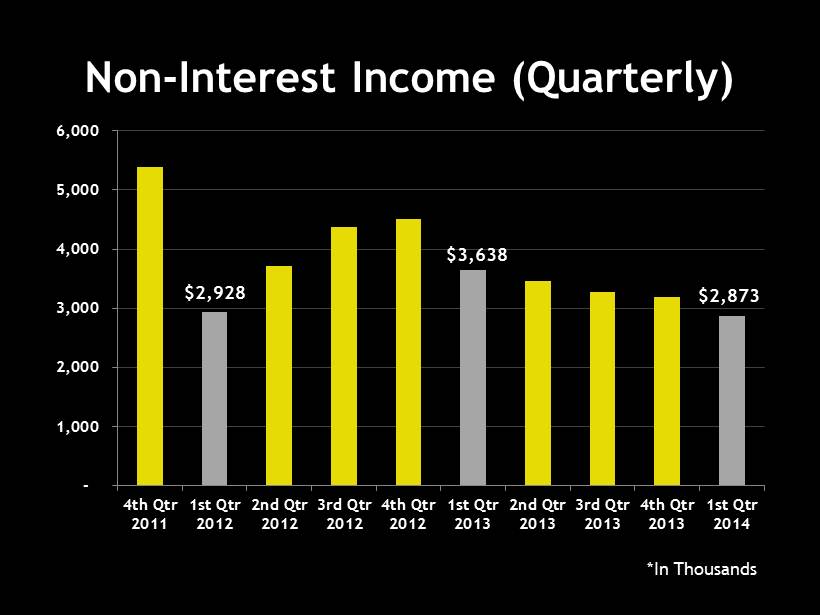
Non - Interest Income (Quarterly) - 1,000 2,000 3,000 4,000 5,000 6,000 4th Qtr 2011 1st Qtr 2012 2nd Qtr 2012 3rd Qtr 2012 4th Qtr 2012 1st Qtr 2013 2nd Qtr 2013 3rd Qtr 2013 4th Qtr 2013 1st Qtr 2014 *In Thousands $2,928 $3,638 $2,873
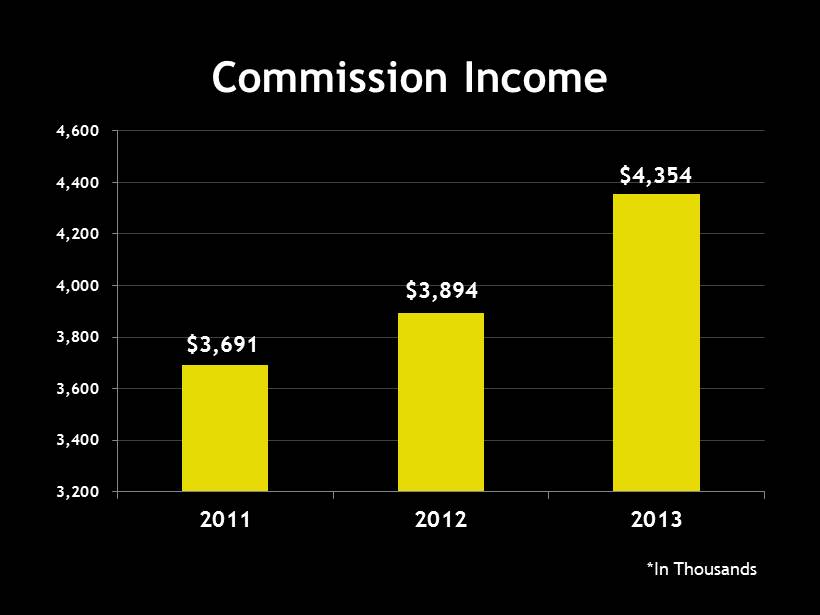
Commission Income 3,200 3,400 3,600 3,800 4,000 4,200 4,400 4,600 2011 2012 2013 *In Thousands $4,354 $3,894 $3,691
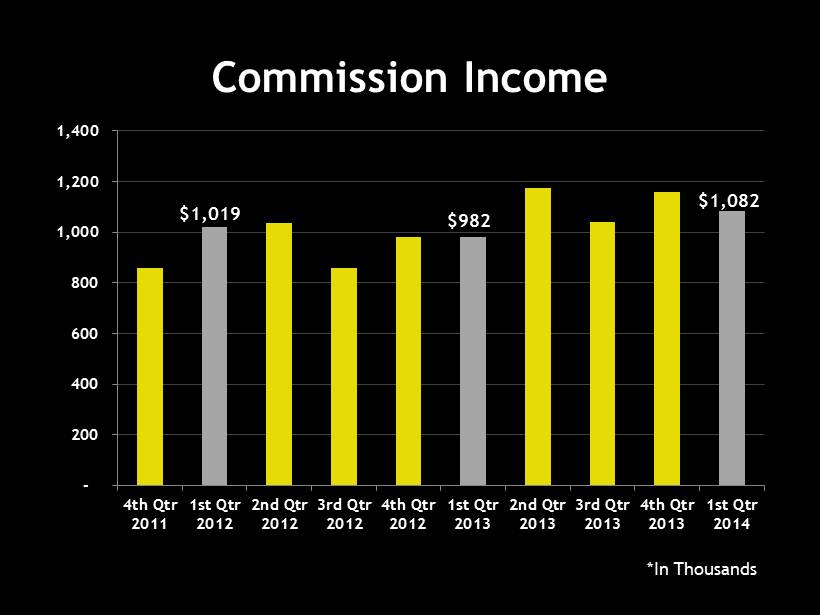
Commission Income - 200 400 600 800 1,000 1,200 1,400 4th Qtr 2011 1st Qtr 2012 2nd Qtr 2012 3rd Qtr 2012 4th Qtr 2012 1st Qtr 2013 2nd Qtr 2013 3rd Qtr 2013 4th Qtr 2013 1st Qtr 2014 *In Thousands $1,019 $982 $1,082
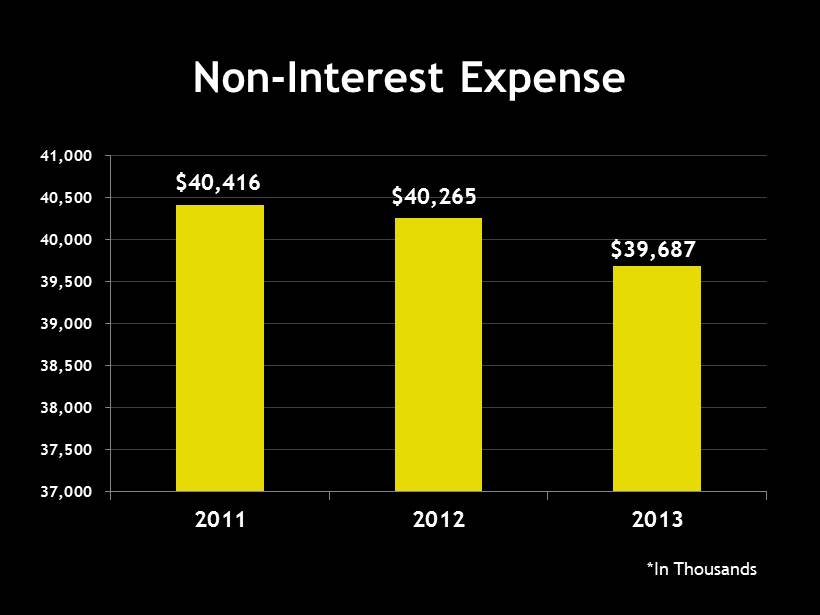
Non - Interest Expense *In Thousands 37,000 37,500 38,000 38,500 39,000 39,500 40,000 40,500 41,000 2011 2012 2013 $39,687 $40,416 $40,265
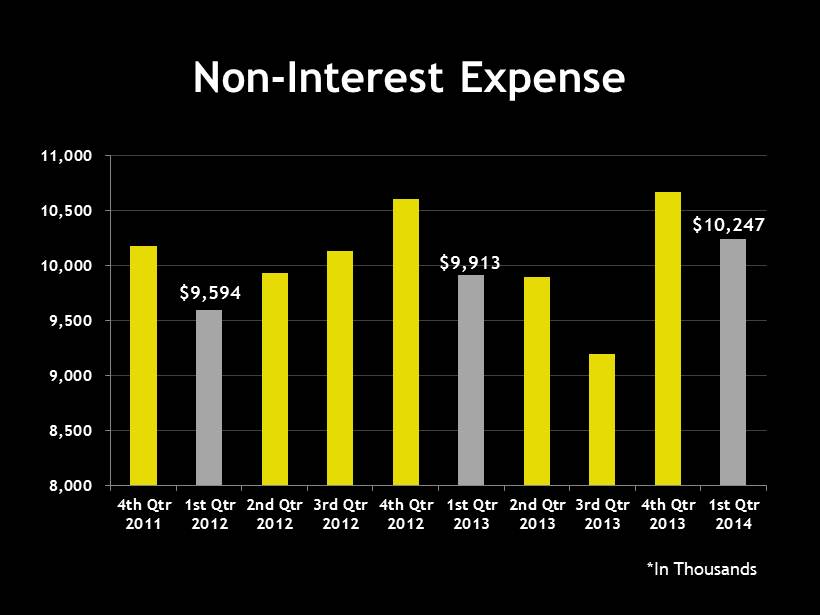
Non - Interest Expense *In Thousands 8,000 8,500 9,000 9,500 10,000 10,500 11,000 4th Qtr 2011 1st Qtr 2012 2nd Qtr 2012 3rd Qtr 2012 4th Qtr 2012 1st Qtr 2013 2nd Qtr 2013 3rd Qtr 2013 4th Qtr 2013 1st Qtr 2014 $9,594 $9,913 $10,247

A year of building momentum

Identified Challenges
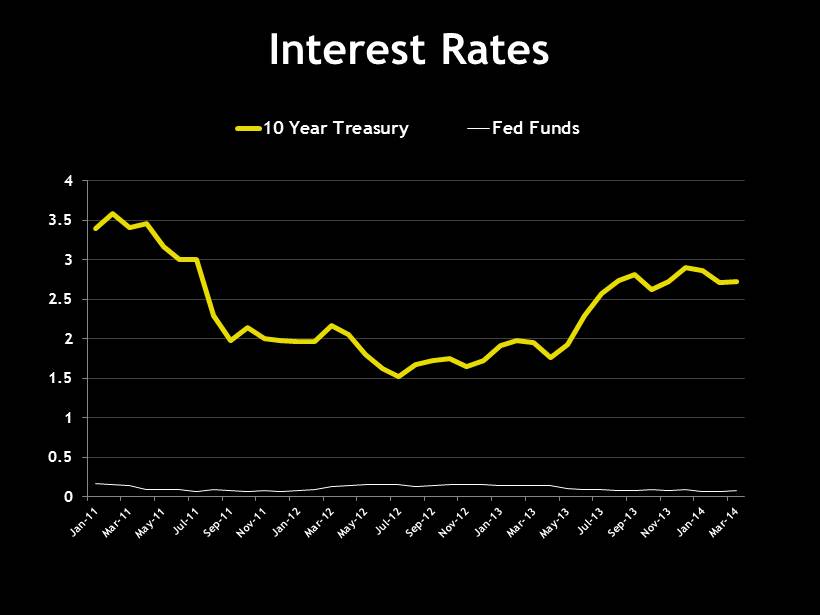
Interest Rates 0 0.5 1 1.5 2 2.5 3 3.5 4 10 Year Treasury Fed Funds

Identified Challenges

Trust Acquisition

2015 - 2019 Strategic Plan

THANK YOU!