Attached files
| file | filename |
|---|---|
| EX-5.1 - EX-5.1 - First Foundation Inc. | d695234dex51.htm |
| EX-23.1 - EX-23.1 - First Foundation Inc. | d695234dex231.htm |
| EX-21.1 - EX-21.1 - First Foundation Inc. | d695234dex211.htm |
Table of Contents
As filed with the Securities and Exchange Commission on May 9, 2014
Registration No. 333-195392
UNITED STATES
SECURITIES AND EXCHANGE COMMISSION
Washington, D.C. 20549
PRE-EFFECTIVE AMENDMENT NO. 1
TO
FORM S-1
REGISTRATION STATEMENT UNDER THE SECURITIES ACT OF 1933
First Foundation Inc.
(Exact name of registrant as specified in its charter)
| California | 6022 | 20-8639702 | ||
| (State or other jurisdiction of incorporation or organization) |
(Primary Standard Industrial Classification Code Number) |
(I.R.S. Employer Identification Number) |
18101 Von Karman Avenue, Suite 700
Irvine, California 92612
(949) 202-4160
(Address, including zip code, and telephone number, including area code, of registrant’s principal executive offices)
Scott F. Kavanaugh
Chief Executive Officer
18101 Von Karman Avenue, Suite 700
Irvine, California 92612
(949) 202-4160
(Name, address, including zip code, and telephone number, including area code, of agent for service)
Copies to:
| Ben A. Frydman, Esq. Ryan C. Wilkins, Esq. Stradling Yocca Carlson & Rauth, P.C. 660 Newport Center Drive, Suite 1600 Newport Beach, California 92660 (949) 725-4000 |
Craig D. Miller, Esq. Jordan E. Hamburger, Esq. Manatt, Phelps & Phillips, LLP One Embarcadero Center San Francisco, California 94111 (415) 291-7400 |
Approximate date of commencement of proposed sale to the public: As soon as practicable after the effective date of this registration statement.
If any of the securities being registered on this Form are to be offered on a delayed or continuous basis pursuant to Rule 415 under the Securities Act of 1933, check the following box. ¨
If this Form is filed to register additional securities for an offering pursuant to Rule 462(b) under the Securities Act, check the following box and list the Securities Act registration statement number of the earlier effective registration statement for the same offering. ¨
If this Form is a post-effective amendment filed pursuant to Rule 462(c) under the Securities Act, check the following box and list the Securities Act registration statement number of the earlier effective registration statement for the same offering. ¨
If this Form is a post-effective amendment filed pursuant to Rule 462(d) under the Securities Act, check the following box and list the Securities Act registration statement number of the earlier effective registration statement for the same offering. ¨
Indicate by check mark whether the registrant is a large accelerated filer, an accelerated filer, a non-accelerated filer, or a smaller reporting company. See the definitions of “large accelerated filer,” “accelerated filer” and “smaller reporting company” in Rule 12b-2 of the Exchange Act. (Check one):
| Large accelerated filer | ¨ | Accelerated filer | ¨ | |||
| Non-accelerated filer | ¨ (Do not check if a smaller reporting company) | Smaller reporting company | x |
CALCULATION OF REGISTRATION FEE
|
| ||||
| Title of Each Class of Securities to be Registered |
Proposed Maximum Aggregate Offering Price(1) |
Amount of Registration Fee(2) | ||
| Common Stock, $0.001 par value per share |
$58,000,000 | 7,471.00 | ||
|
| ||||
|
| ||||
| (1) | Estimated solely for the purpose of calculating the registration fee pursuant to Rule 457(o) under the Securities Act of 1933, as amended, and includes shares of our common stock that the underwriters have an option to purchase within 30 days of the date of this prospectus to cover overallotments. |
| (2) | Calculated pursuant to Rule 457(o) based on an estimate of the proposed maximum aggregate offering price. |
The registrant hereby amends this registration statement on such date or dates as may be necessary to delay its effective date until the registrant shall file a further amendment which specifically states that this registration statement shall thereafter become effective in accordance with Section 8(a) of the Securities Act of 1933 or until the registration statement shall become effective on such date as the Commission, acting pursuant to said Section 8(a), may determine.
Table of Contents
The information in this preliminary prospectus is not complete and may be changed. We may not sell these securities until the registration statement filed with the Securities and Exchange Commission is effective. This preliminary prospectus is not an offer to sell these securities and it is not soliciting an offer to buy these securities in any state where the offer or sale is not permitted.
Subject to Completion
Preliminary Prospectus dated May 9, 2014
PRELIMINARY PROSPECTUS
2,222,222 Shares

Common Stock
This prospectus relates to the initial public offering of First Foundation Inc. We are offering 2,222,222 shares of our common stock.
Prior to this offering, there has been no established public market for our common stock. We currently estimate that the public offering price of our common stock will be between $21.00 and $24.00 per share. We have applied to list our common stock on The NASDAQ Global Market under the symbol “FFWM.”
We are an “emerging growth company” as defined in the Jumpstart Our Business Startups Act of 2012 and, as a result, are eligible for certain reduced public company reporting and disclosure requirements, the implications of which to purchasers of our common stock are set forth in “About This Prospectus” on page ii.
See “Risk Factors,” beginning on page 12 of this prospectus, for a discussion of certain risks that you should consider before making a decision to purchase our common stock.
| Per Share | Total |
|||||||
| Public offering price |
$ | [ ] | $ | [ ] | ||||
| Underwriting discount(1) |
$ | [ ] | $ | [ ] | ||||
| Proceeds, before expenses, to us |
$ | [ ] | $ | [ ] | ||||
| (1) | See “Underwriting” for additional information regarding the underwriting discount and certain expenses payable to the underwriters by us. |
We have granted the underwriters an option to purchase up to an additional 333,333 shares of our common stock, at the public offering price, less the underwriting discount, within 30 days after the date of this prospectus, to cover overallotments, if any.
Neither the Securities and Exchange Commission nor any state securities commission nor any other regulatory authority has approved or disapproved of these securities or passed on the adequacy or accuracy of this prospectus. Any representation to the contrary is a criminal offense.
The shares of our common stock that you purchase in this offering will not be deposits, savings accounts or other obligations of any bank or nonbank subsidiaries and are not insured or guaranteed by the Federal Deposit Insurance Corporation or any other governmental agency.
The underwriters expect to deliver the shares of our common stock against payment in New York, New York on or about [ ], 2014.
| Sandler O’Neill + Partners, L.P. |
Keefe, Bruyette & Woods A Stifel Company | |||
| Sterne Agee | ||||
The date of this prospectus is [ ], 2014.
Table of Contents
Corporate Organization Chart

| Asset Management Equities, Fixed Income, Hedge Funds, Private Equities, Real Estate, Commodities |
Banking Personal and Business Loans, Residential and Commercial Real Estate Loans, Deposit Accounts, Cash Management Services | |
| Wealth Planning Lifestyle/Retirement, Estate and Gift Planning, Philanthropic Giving, Generational Wealth Transfer, Tax Planning, Risk Management |
Trust Trustee Services, Estate Settlement Services, Guardianship Services, Family Business Services, Nevada Trust Powers | |
| Family and Philanthropic Consulting Consulting Services, Financial Competency Education, Life Skills Training, Foundation Services, Business Succession |

| |
Location of Wealth Management Offices
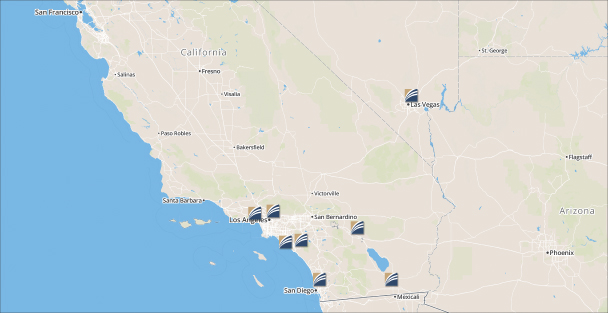
Table of Contents
| (ii) | ||||
| 1 | ||||
| 12 | ||||
| 28 | ||||
| 30 | ||||
| 31 | ||||
| 32 | ||||
| 34 | ||||
| 36 | ||||
| Management’s Discussion and Analysis of Financial Condition and Results of Operations |
48 | |||
| 80 | ||||
| 89 | ||||
| 94 | ||||
| 96 | ||||
| 99 | ||||
| 101 | ||||
| 103 | ||||
| Certain Material U.S. Federal Income Tax Consequences for Non-U.S. Holders of Common Stock |
117 | |||
| 120 | ||||
| 124 | ||||
| 124 | ||||
| 124 | ||||
| F-1 |
(i)
Table of Contents
In considering whether to purchase shares of common stock in this offering, you should rely only on the information contained in this prospectus and any free writing prospectus we may file with the Securities and Exchange Commission, or SEC. We and the underwriters have not authorized anyone to provide any information different from that contained in this prospectus or in any free writing prospectuses we have prepared. We and the underwriters take no responsibility for, and can provide no assurance as to the reliability of, any other information that others may give you.
This prospectus is an offer to sell only the shares offered hereby, but only under circumstances and in jurisdictions where it is lawful to do so. The information contained in this prospectus is accurate only as of the date on the front cover of this prospectus, regardless of the time of delivery of this prospectus or any sale of our common stock. Information contained on, or accessible through, our website is not part of this prospectus. Unless otherwise expressly stated or the context otherwise requires, all information in this prospectus assumes the underwriters have not exercised their overallotment option to purchase additional shares of our common stock.
Market Data
Market data used in this prospectus has been obtained from independent industry sources and publications as well as from research reports prepared for other purposes. Industry publications, surveys and reports generally state that the information contained therein has been obtained from sources believed to be reliable. However, we have not independently verified the data obtained from these sources. Forecasts and other forward-looking information obtained from these sources are subject to the same qualifications and uncertainties that apply to the other forward-looking statements that are described in this prospectus. In addition, while we are not aware of any misstatements regarding the market or industry data presented herein, such statements involve risks and uncertainties and are subject to change based on various factors, including those discussed under the heading “Risk Factors” beginning on page 12 of this prospectus.
Implications of Being an Emerging Growth Company
As a company with less than $1.0 billion in revenue during our last fiscal year, we qualify as an “emerging growth company” as defined in the Jumpstart our Business Startups Act of 2012 (or the JOBS Act). An emerging growth company may take advantage of specified reduced reporting requirements and is relieved of certain other significant requirements that are otherwise generally applicable to public companies. As an emerging growth company:
| • | we are permitted to present only two years of audited financial statements and only two years of related Management’s Discussion and Analysis of Financial Condition and Results of Operations; |
| • | we are exempt from the requirement to obtain an attestation and report from our auditors on the assessment of our internal control over financial reporting pursuant to the Sarbanes-Oxley Act of 2002; |
| • | we are permitted to provide less extensive disclosure about our executive compensation arrangements; |
| • | we are not required to give our shareholders non-binding advisory votes on executive compensation or golden parachute arrangements; and |
| • | we may elect to use an extended transition period for complying with new or revised accounting standards generally applicable to public companies. |
We may take advantage of these provisions for up to five years subsequent to the effective date of this prospectus or such earlier time that we are no longer an emerging growth company. We will cease to be an emerging growth company upon the earliest of (i) the last day of the first fiscal year in which our annual gross
(ii)
Table of Contents
revenues exceed $1 billion, (ii) December 31 of the fiscal year that we become a “large accelerated filer” as defined in Rule 12b-2 under the Securities Exchange Act of 1934, or the Exchange Act, which would occur if the market value of our common stock held by non-affiliates exceeds $700 million as of the last business day of our most recently completed second fiscal quarter and we have been publicly reporting for at least 12 months, or (iii) the date on which we have issued more than $1 billion in non-convertible debt during the preceding three-year period.
We have taken advantage of reduced reporting requirements in this prospectus. Accordingly, the information contained herein may be different from the information you receive from our competitors that are public companies, or other public companies in which you hold stock.
Representations and Warranties
The representations, warranties and covenants made by us in any agreement that is filed as an exhibit to the registration statement of which this prospectus is a part were made solely for the benefit of the parties to such agreement, including, in some cases, for the purpose of allocating risk among the parties to such agreement, and should not be deemed to be a representation, warranty or covenant made to you or for your benefit. Moreover, such representations, warranties or covenants were accurate only as of the date they were made. Accordingly, such representations, warranties and covenants should not be relied on as accurately representing the current state of our affairs.
Trademarks
“First Foundation” and its logos are trademarks and/or service marks of First Foundation Inc. and its subsidiaries. All other trademarks, service marks and trade names referred to in this prospectus are the property of their respective owners.
(iii)
Table of Contents
This summary highlights selected information contained elsewhere in this prospectus. This summary does not contain all of the information that you should consider before deciding whether to purchase shares of our common stock in this offering. You should read the entire prospectus carefully, including the sections entitled “Risk Factors” and “Management’s Discussion and Analysis of Financial Condition and Results of Operations” and our consolidated financial statements and the related notes thereto, before making an investment decision. Unless we state otherwise or the context otherwise requires, references in this prospectus to “we,” “our,” and “us” refer to First Foundation Inc., a California corporation, (or FFI or the Company) and its consolidated subsidiaries, First Foundation Advisors (or FFA) and First Foundation Bank (or FFB).
Overview
We are a California based financial services company that provides a comprehensive platform of personalized financial services to high net-worth individuals (that is, individuals with a net worth greater than $1.0 million, exclusive of their primary residence) and their families, family businesses and other affiliated organizations. Our integrated platform provides investment management, wealth planning, consulting, trust and banking products and services to effectively and efficiently meet the financial needs of our clients. We have also established a lending platform that offers loans to individuals and entities that own and operate multifamily residential and commercial real estate properties. In addition, we provide business banking products and services to small to moderate-sized businesses and professional firms, and consumer banking products and services to individuals and families who would not be considered high net-worth. As of March 31, 2014, we had $2.80 billion of assets under management (or AUM), $1.09 billion of total assets, $949 million of loans and $855 million of deposits. Our investment management, wealth planning, consulting, and trust services provide us with substantial, fee-based, recurring revenues, such that in 2013, our noninterest income was 36% of our total revenues.
Our strategy is focused on expanding our strong and stable client relationships by delivering high quality, coordinated investment management, wealth planning, consulting, trust and banking products and services. We are able to maintain a client-focused approach by recruiting and retaining experienced and qualified staff, including highly qualified relationship managers, private bankers and financial planners.
We intend to continue to grow our business by (i) cross-selling our services among our wealth management and banking clients; (ii) obtaining new client referrals from existing clients, attorney and accountant referral sources and through referral agreements with asset custodial firms; (iii) marketing our services directly to prospective new clients; (iv) adding experienced relationship managers and private bankers who may have established client relationships that we can serve; (v) establishing de novo wealth management offices in select markets, both within and outside our existing market areas; and (vi) making opportunistic acquisitions of complementary businesses.
Our History and Growth
We commenced our operations in 1990 as a fee-based investment advisory company, with the philosophy of providing personalized investment advisory services primarily to high net-worth individuals and their families to assist them in meeting their financial goals. From 1990 to 2007, we grew our client base and added relationship managers and supporting staff. We also entered into referral agreements with asset custodial firms from which we derived a significant portion of our new clients. As a result of this growth, our assets under management exceeded $1.2 billion and we had total staff of 23 as of June 30, 2007.
1
Table of Contents
In 2005 and 2006, we experienced increased competition from other companies offering a more comprehensive platform of services to their clients, including banking, investment advisory and wealth planning services. In response to this competition, we considered various strategic options, including selling our business to a larger financial institution, expanding our services or continuing on with our then-current limited offerings. In late 2006, we decided to establish a federally insured bank to expand the financial services we could provide to our clients to include trust and banking services, and to attract private banking clients to whom we could cross-sell our investment advisory and wealth planning services. As a result, we retained experienced banking executives to prepare and file an application to open a bank, and in September 2007, FFB was granted an insured federal savings bank charter and commenced its banking operations in the subsequent month. During the fourth quarter of 2007, we moved our corporate operations to our existing location and opened our first wealth management office in Irvine, California. We refer to each of our offices as a wealth management office since we offer a full suite of financial and investment advisory services at all locations.
In early 2008, we expanded our wealth planning and consulting offerings to include foundation administration and consulting services and family consulting services. While the trust and banking operations began to grow in 2008 and 2009, all of our operations were negatively impacted by the economic recession which began in 2008. As a result of the recession, FFB focused its lending efforts on lower risk and lower yielding products, such as multifamily lending. Our AUM at FFA decreased by over 20% between September 2007 and March 2009, resulting in decreased revenues. However, we believe that because of our strong capital position and our conservative approach to underwriting our loans, FFB did not experience the significant difficulties that most other banks faced, and we were allowed to continue to grow our business in line with our business plan. During this time, we took advantage of the opportunities to hire highly qualified relationship managers, private bankers and investment professionals that existed as a result of the turmoil being experienced by many of our competitors. As of December 31, 2009, we had $1.29 billion of AUM, $201 million of loans, $182 million of deposits, $239 million of total assets and our staff totaled 66.
From 2010 through 2012, we continued to focus on expanding our client base. Over this period, we opened new wealth management offices in Pasadena and San Diego and a small branch office in La Quinta, California. Effective June 28, 2012, we converted FFB from a federal savings bank to a California state chartered bank. On August 15, 2012 we acquired Desert Commercial Bank (or DCB), a California state-chartered commercial bank, based in Palm Desert, California, and merged DCB into FFB. As a result of that acquisition, we increased our total assets by $140 million, our loans by $90 million, and our deposits by $127 million, and we acquired our two wealth management offices in Palm Desert and in El Centro. Our small branch office in La Quinta was merged into the Palm Desert office. Subsequent to the acquisition of DCB in 2012, and during 2013, we opened new wealth management offices in West Los Angeles and in Las Vegas, Nevada, and completed the integration of DCB into our operations. Currently, we conduct our business from our corporate offices located in Irvine, California, and from seven wealth management offices, six of which are located in Southern California and one of which is located in Las Vegas, Nevada. As of March 31, 2014, we had $2.80 billion of AUM, $949 million of loans, $855 million of deposits and $1.09 billion of total assets and our staff totaled 194.
We believe that as a result of our client-focused approach, and our ability to offer a comprehensive platform of personalized financial services to our clients, we have been able to retain existing clients and attract new clients. This has resulted in significant growth during the four year period that ended December 31, 2013, which is demonstrated by the following financial metrics:
| • | AUM increased at a compound annual growth rate of 19.2%; |
| • | Loans increased at a compound annual growth rate of 45.6%; |
| • | Deposits increased at a compound annual growth rate of 44.9%; |
| • | Total assets increased at a compound annual growth rate of 44.4%; |
2
Table of Contents
| • | Trust AUM increased at a compound annual growth rate of 43.0%; and |
| • | Total revenues increased at a compound annual growth rate of 38.9%. |
To achieve this growth, we have raised additional capital to support the growth of FFB and made significant investments in our staff. The number of relationship managers and private bankers has increased from 18 at December 31, 2009 to 38 at March 31, 2014. As it typically takes two to three years to break even on the investment in a relationship manager or private banker, we are in a position to benefit from these investments in the coming years as the revenues generated from these relationship managers and private bankers begins to exceed the related costs. However, these investments in relationship managers and private bankers have, and over the next few years, will continue to result in higher costs in relation to our revenues.
Our Competitive Strengths
We believe that we are well-positioned to create additional value for our shareholders, particularly as a result of our competitive strengths, which include:
Breadth of our Services. As a result of our ability to provide investment management, wealth planning, and consulting services, in addition to traditional banking services, we believe that we offer a more comprehensive range of financial services than do most banks of comparable size in our market areas. Additionally, we believe that few banks of comparable size in our market currently provide trust services, which can provide us with a competitive advantage over those banks, as well as a source of additional fee income.
Executive Management Team with Demonstrated Ability to Grow. Our executive management team, which has been together since 2007, has proven its ability to effectively lead us and has demonstrated an ability to grow our operations, as evidenced by the over 40% compound annual growth rate in loans, deposits and total assets from December 31, 2009 to December 31, 2013, and the 19% compound annual growth rate in AUM from December 31, 2009 to December 31, 2013.
Experienced and Collaborative Wealth Management and Banking Professionals. We believe we have built a strong team of relationship managers and private bankers who have, on average, 24 years of industry experience. Moreover, our relationship managers and private bankers work collaboratively to coordinate the investment management, wealth planning, consulting, trust and banking services that we provide to our clients and have developed considerable experience in cross-selling our services.
Commitment to High Quality and Personalized Services. We believe that our growth is largely attributable to our commitment and success in providing high quality, coordinated and personalized financial services to our clients. Our client-focused culture has resulted in the majority of our new clients coming to us from referrals from existing clients, centers of influence, including attorneys and accountants, and from unaffiliated asset custodial firms with which we have entered into non-exclusive referral arrangements. Our team oriented approach provides our clients with multiple points of contact and resources to address their various financial needs. Our fee-based investment management services allow us to make unbiased decisions regarding our clients’ investments, as we are not motivated by higher fees in our selection of investment alternatives, and our fee structure does not reward us for making higher risk investments that may adversely impact our clients during a downturn in the markets.
Stable and Scalable Platform. We have built a scalable corporate and administrative infrastructure, and have made significant investments in technology for our banking and investment management processes. In addition to our relationship managers and private bankers, we have in place highly qualified executives, senior managers, and investment professionals who we believe are capable of supporting our continued growth. The
3
Table of Contents
nature of our business requires significant investments in operational and administrative functions. By growing our interest-earning assets and AUM, we are able to spread this fixed cost over a larger revenue base. To achieve increased profitability, we believe that it is essential for us to build our operations to a level that allows us to provide our investment management, wealth planning, consulting, trust and banking products and services in a cost effective manner.
Strong Credit Culture. We have implemented policies and procedures for credit underwriting and administration which have enabled us to maintain strong asset quality and at the same time grow our banking business, despite the continuing economic uncertainties and the sluggishness of the economic recovery in the United States. Our ratio of nonperforming assets (or NPAs) to total assets was 0.55% at March 31, 2014 and the ratio of net loan charge-offs-to average loans outstanding has averaged 0.07% for the three year period ended December 31, 2013.
Successful Multifamily and Commercial Real Estate Lending Platform. We have created a multifamily and commercial real estate lending platform that has resulted in the origination of over $700 million of loans since the beginning of 2009. We believe that this platform has enabled us to add interest-earning assets with minimal adverse credit results. Since FFB commenced its operations in 2007, we have not experienced any chargeoffs on loans that were originated through this platform and secured by multifamily and commercial real estate properties. As of March 31, 2014, multifamily and commercial real estate loans originated on this platform represented 56.9% of our total loans outstanding.
Located in Strategic Markets. Our wealth management offices are located in areas that either have a high concentration of high net-worth households or are in areas where we believe the competition from other companies that provide a comprehensive platform of financial services to high net-worth individuals is limited. In addition, our wealth management office in Las Vegas offers Nevada trust powers which can offer significant benefits to high net-worth individuals and their families.
Retention of Clients. We believe that because of our client-focused culture, we have experienced a high level of retention of our clients. As an example, during the five year period ending December 31, 2013, the weighted average amount of AUM withdrawn each year as a result of client terminations as a percentage of the beginning of that year’s AUM balance was less than 5%.
Diverse Revenue Base. We have a diverse revenue base as a result of our comprehensive platform of services. For 2013 our total revenue was comprised of net interest income (64%), investment management fees (28%), trust fees (3%), deposit and other banking fees (3%) and consulting fees (2%).
Strong Deposit Base. An important driver of our financial performance has been, and we believe will continue to be, the growth and stability of our deposit base, which we use to fund our loans and other interest-earning assets. In addition to the increase in the amount of our deposits, which have grown at a compound annual rate of 44.9% from December 31, 2009 to December 31, 2013, we have been able to increase the proportion of more stable demand deposits, which represented 53% of our total deposits at March 31, 2014 as compared to 12% at December 31, 2009.
Our Strategy
Grow Our Business Organically. In growing our business organically we intend to focus on adding experienced, high quality relationship managers and private bankers at both our existing wealth management offices and at new wealth management offices we may open in selected market areas, both within and outside of California, with demographics similar to those in our existing markets. Because a significant portion of our new business comes from referral sources, we plan to continue to work to obtain referrals from our clients, from
4
Table of Contents
centers of influence, including accountants and attorneys, and from loan brokers, and we will maintain referral agreements with unaffiliated asset custodial firms. We intend to continue our practice of establishing and maintaining advisory boards in each of our markets to provide client referrals.
Continue Cross-Selling our Services and Expand the Services We Offer Our Clients. We intend to continue to cross-sell our investment management, wealth planning, consulting, trust and banking products and services to our existing and future clients. Our compensation structures encourage a team approach to client service and reward relationship managers and private bankers for facilitating the cross selling of services to clients. We believe that our service-oriented culture and high quality client service will continue to enable us to strengthen and expand our client relationships and will foster continued growth in the services and products we offer them and, thereby, enabling us to increase and diversify our sources of revenues.
Grow our Business through Acquisitions. We intend to make opportunistic acquisitions that we believe will enable us to grow our franchise geographically. While we believe that banks provide the most likely opportunities for acquisition, we will also consider acquisitions of investment management firms and insurance brokerage firms. We believe that our experience with previous transactions makes us qualified to acquire other institutions and integrate their operations into our platform. In addition to providing us increased interest-earning assets and deposits, bank acquisitions would allow us to cross sell our investment management, wealth planning, consulting and trust services to clients acquired in the acquisition as well as new clients situated in the related geographic area. Although we do not have any immediate plans, arrangements or understandings related to any material acquisitions, we believe that the completion of this offering will further enhance our ability to compete for acquisition opportunities by providing available equity to invest and enabling us to offer publicly-traded shares of our common stock to the shareholders of prospective acquisition candidates.
Provide High Quality Client Services. We believe that stable long-term growth and profitability are the result of building strong client relationships, one at a time, and providing high quality, coordinated financial services. Our relationship managers and private bankers strive to build long-term relationships with our clients by understanding their financial needs and identifying and delivering appropriate and coordinated financial services to them. We believe that our service-oriented culture and high quality client service differentiates us from many of our competitors.
Attract and Retain High Quality Service Professionals. Having successful and high quality service professionals is critical to driving the development of our business and delivering high quality financial services. We have experienced low turnover in our client service personnel and intend to continue hiring and developing professionals who can establish and maintain long-term customer relationships which are the key to our culture, business and growth. We also believe that our business model, culture and scalable platform enable us to attract and retain high quality relationship managers and private bankers who share our work ethic and our commitment to providing personalized and client-focused financial services.
Our Management Team
We believe that our management team, led by Scott Kavanaugh, our Chief Executive Officer, Ulrich (“Rick”) Keller, Jr., our Executive Chairman of the Board, John Hakopian, President of FFA, Dave Rahn, President of FFB and John Michel, our Chief Financial Officer have the breadth of experience necessary to effectively execute our business strategy.
Our Market
Because our primary target market is high net-worth individuals and their families, family businesses and other affiliated organizations, we have located our offices in areas we believe offer us the best opportunity to
5
Table of Contents
locate and serve this client base. The Los Angeles-Long Beach Core-Based Statistical Area (CBSA), which includes Orange County, has over 250,000 high net-worth households (defined as those with $1.0 million or more of investable assets), making it the largest high net-worth market in the Western United States. As of December 31, 2013, 68% of our AUM was from clients located in the in Los Angeles-Long Beach CBSA. Our wealth management offices are located in or adjacent to four of the top 12 markets in the Western United States as ranked by estimated number of high net-worth households. Listed below are the largest core-based statistical areas by estimated number of high net worth households in the Western United States as of December 31, 2013, according to data obtained from Phoenix Marketing International’s “Global Wealth Monitor”:
| Rank | Statistical Areas in Western United States (1) |
Estimated Number of High Net Worth Households |
Wealth Management Office in Area | |||
| 1 | Los Angeles-Long Beach (CA) | 252,000 | Irvine, Pasadena, West Los Angeles | |||
| 2 | San Francisco-Oakland (CA) | 128,000 | ||||
| 3 | Seattle-Tacoma-Bellevue (WA) | 90,000 | ||||
| 4 | Phoenix-Mesa-Glendale (AZ) | 72,000 | ||||
| 5 | Riverside (CA) | 70,000 | Palm Desert | |||
| 6 | San Diego-Carlsbad (CA) | 69,000 | San Diego | |||
| 7 | Denver-Aurora-Broomfield (CO) | 63,000 | ||||
| 8 | San Jose-Sunnyvale (CA) | 52,000 | ||||
| 9 | Sacramento—Arden (CA) | 48,000 | ||||
| 10 | Portland-Vancouver (OR-WA) | 46,000 | ||||
| 11 | Las Vegas-Paradise (NV) | 31,000 | Las Vegas | |||
| 12 | Honolulu (HI) | 25,000 | ||||
| (1) | The Western United States is defined as Alaska, Arizona, California, Colorado, Hawaii, Idaho, Montana, New Mexico, Nevada, Oregon, Utah, Washington and Wyoming. |
In addition to offering our comprehensive platform of personalized financial services primarily to high net-worth individuals and their families, family businesses and other affiliated organizations, we have established a lending platform that offers loans to individuals and entities that own and operate multifamily residential properties and commercial real estate properties. The underlying properties which secure these loans are primarily located in communities throughout California that have a significant population base and are already built out. The following is a breakdown of the location of our multifamily and commercial real estate loans by county as of December 31, 2013:
| (dollars in thousands) | Amount | % of Total | ||||||
| California Counties: |
||||||||
| Los Angeles |
$ | 325,738 | 58.0% | |||||
| Orange |
51,366 | 9.2% | ||||||
| Riverside |
48,460 | 8.6% | ||||||
| San Diego |
38,163 | 6.8% | ||||||
| San Francisco |
34,781 | 6.2% | ||||||
| Other counties—Northern California |
30,198 | 5.4% | ||||||
| Other counties—Southern California |
18,226 | 3.3% | ||||||
| Nevada—all counties |
2,305 | 0.4% | ||||||
| Other states |
11,935 | 2.1% | ||||||
|
|
|
|
|
|||||
| Total |
$ | 561,172 | 100.0% | |||||
|
|
|
|
|
|||||
6
Table of Contents
Our Challenges
As with all financial institutions, we face many challenges. There are a number of risks that you should consider before investing in our common stock. These risks are discussed more fully in the section entitled “Risk Factors,” beginning on page 12.
Additional Information
We were incorporated in California in 2006 to become the parent holding company of First Foundation Advisors and First Foundation Bank. We are registered as a bank holding company under the Bank Holding Company Act of 1956.
Our principal executive office is located at 18101 Von Karman Avenue, Suite 700, Irvine, California 92612, where our telephone number is (949) 202-4160. Our website address is www.ff-inc.com. The information contained on our website is not a part of, or incorporated by reference into, this prospectus.
7
Table of Contents
THE OFFERING
| Common stock offered by us |
2,222,222 shares |
| Underwriters’ overallotment option |
333,333 shares. |
| Shares of common stock offered as a percentage of our outstanding shares of common stock |
28.7%, assuming the underwriters do not exercise their overallotment option. |
| Shares of common stock outstanding after completion of this offering |
9,955,736 shares, assuming the underwriters do not exercise their overallotment option.(1) |
| Shares of common stock owned by our directors and executive officers |
Our directors and executive officers own, in the aggregate, a total of 2,620,099 shares of our common stock, which is not expected to materially change as a result of this offering. Each of our directors and executive officers has entered into a lock-up agreement agreeing not to sell any of their shares for 180 days after completion of this offering, subject to certain exceptions. For additional information, see “Underwriting”. |
| Use of proceeds |
The net proceeds from the sale of our common stock in this offering, after deducting estimated underwriting discounts and offering expenses, will be approximately $46.1 million (or $53.1 million if the underwriters exercise their overallotment option in full). We intend to use the net proceeds from this offering: |
| • | To repay a term loan obtained from an unaffiliated bank, the aggregate principal amount of which was $21.9 million at March 31, 2014. We used $17.5 million of the net proceeds of that loan for to make capital contributions to FFB to fund the continued growth of our banking business. |
| • | To support our organic growth, including the addition of new wealth management offices. |
| • | To fund possible acquisitions that we believe are complementary to our business and provide attractive risk-adjusted returns, although we do not have any immediate plans, arrangements or understandings relating to any material acquisition. |
| • | For other general corporate purposes, which may include the hiring of additional personnel and the payment of costs associated with operating as a public company. |
| For additional information, see “Use of Proceeds.” |
| Dividend policy |
We have not previously paid cash dividends on our common stock. It is our current intention to invest our cash flow and earnings in the |
8
Table of Contents
| growth of our businesses and, therefore, we have no plans to pay cash dividends for the foreseeable future. Investors should not purchase our common stock with the expectation of receiving cash dividends. |
| For additional information, see “Dividend Policy.” |
| Rank |
Our common stock may be subordinate to any new series of preferred stock that we may issue in the future. However, we have no current plans to issue any preferred stock. |
| Proposed Nasdaq Global Market Symbol |
We intend to apply to list our common stock on the Nasdaq Global Market under the trading symbol “FFWM.” |
| Risk factors |
Investing in our common stock involves risks. See “Risk Factors,” beginning on page 12, for a discussion of certain factors that you should carefully consider before making an investment decision. In addition, see “Cautionary Note Regarding Forward-Looking Statements.” |
| (1) | References in this section to the number of shares of our common stock outstanding after this offering are based on 7,733,514 shares of our common stock issued and outstanding as of March 31, 2014. Unless otherwise noted, these references exclude: |
| • | 1,497,092 shares of common stock are issuable upon exercise of outstanding options to purchase shares of common stock under the First Foundation Inc. 2007 Equity Incentive Plan and the First Foundation Inc. 2007 Management Stock Incentive Plan (or collectively, the Stock Incentive Plans) as of March 31, 2014, at a weighted average exercise price of $12.62 per share (of which options to acquire 1,263,789 shares of our common stock were vested as of March 31, 2014); |
| • | 296,345 shares of our common stock reserved for issuance under the Stock Incentive Plans; and |
| • | Up to an additional 270,000 shares of our common stock which may become issuable to the former shareholders of DCB. The number of these shares that will become issuable is dependent on the performance, over the two year period ending August 15, 2014, of certain assets we acquired as part of our acquisition of DCB in August 2012. Based on the performance of those assets through March 31, 2014, we believed, as of that date, that it was unlikely that any of these shares would become issuable. However, since the final determination will be based on the performance of those assets through August 15, 2014, some of these shares may ultimately become issuable to the former shareholders of DCB. |
9
Table of Contents
SELECTED HISTORICAL CONSOLIDATED FINANCIAL INFORMATION
With the exception of the certain items included in the selected performance and capital ratios, the following selected consolidated financial information as of and for the years ended December 31, 2013 and 2012 has been derived from our audited consolidated financial statements appearing elsewhere in this prospectus, and the selected consolidated financial information as of and for the year ended December 31, 2011 has been derived from our audited consolidated financial statements not appearing in this prospectus.
You should read the following selected financial and operating data in conjunction with other information contained in this prospectus, including the information set forth in the sections entitled “Capitalization” and “Management’s Discussion and Analysis of Financial Condition and Results of Operations”, as well as our consolidated financial statements and the related notes included elsewhere in this prospectus. The average balances used in computing certain ratios, have been computed using daily averages, except for average equity, which is computed using the average of beginning and end of month balances. Our historical results as set forth below are not necessarily indicative of results to be expected in any future period. In addition, as described elsewhere in this prospectus, on August 15, 2012 we consummated the acquisition of DCB. The results of operations and other financial data of DCB for all periods prior to the date of its acquisition are not included in the table below and, therefore, our results and other financial data for these prior periods are not comparable in all respects to those for the periods subsequent to that acquisition. In addition, the income statement data set forth below may not be predictive of our future operating results.
| As of and for the Year Ended December 31, |
As of and for the Quarter Ended March 31 |
|||||||||||||||||||
| (In thousands, except share and per share |
2013 | 2012(1) | 2011 | 2014 | 2013 | |||||||||||||||
| Selected Income Statement Data: |
||||||||||||||||||||
| Net interest income |
$ | 35,674 | $ | 27,729 | $ | 20,141 | $ | 9,750 | $ | 8,192 | ||||||||||
| Provision for loan losses |
2,395 | 2,065 | 2,297 | $ | 235 | 622 | ||||||||||||||
| Noninterest Income: |
||||||||||||||||||||
| Asset management, consulting and other fees |
18,240 | 15,326 | 13,211 | 5,039 | 4,286 | |||||||||||||||
| Other(2) |
1,584 | 1,294 | 4,489 | 512 | 247 | |||||||||||||||
| Noninterest expense |
43,622 | 34,476 | 26,446 | 12,546 | 10,396 | |||||||||||||||
| Income before taxes |
9,481 | 7,808 | 9,098 | 2,520 | 1,707 | |||||||||||||||
| Net income |
7,851 | 5,801 | 9,098 | 1,462 | 1,058 | |||||||||||||||
| Share and Per Share Data: |
||||||||||||||||||||
| Net income per share: |
||||||||||||||||||||
| Basic |
$ | 1.06 | $ | 0.88 | $ | 1.48 | $ | 0.19 | $ | 0.14 | ||||||||||
| Diluted |
1.01 | 0.85 | 1.42 | 0.18 | 0.14 | |||||||||||||||
| Shares used in computation: |
||||||||||||||||||||
| Basic |
7,424,210 | 6,603,533 | 6,164,283 | 7,733,514 | 7,376,988 | |||||||||||||||
| Diluted |
7,742,215 | 6,831,955 | 6,393,713 | 8,093,777 | 7,613,234 | |||||||||||||||
| Tangible book value per share(3) |
$ | 11.18 | $ | 9.94 | $ | 7.98 | $ | 11.46 | $ | 10.15 | ||||||||||
| Shares outstanding at end of period(4) |
7,733,514 | 7,366,126 | 6,166,574 | 7,733,514 | 7,409,860 | |||||||||||||||
| Selected Balance Sheet Data: |
||||||||||||||||||||
| Cash and cash equivalents |
$ | 56,954 | $ | 63,108 | $ | 10,098 | $ | 50,287 | $ | 42,443 | ||||||||||
| Loans, net of deferred fees |
903,645 | 743,627 | 524,103 | 948,844 | 785,760 | |||||||||||||||
| Allowance for loan and lease losses (“ALLL”) |
(9,915 | ) | (8,340 | ) | (6,550 | ) | (10,150 | ) | (8,210 | ) | ||||||||||
| Total assets |
1,037,360 | 830,509 | 551,584 | 1,090,348 | 869,830 | |||||||||||||||
| Noninterest-bearing deposits |
217,782 | 131,827 | 66,383 | 225,473 | 181,251 | |||||||||||||||
| Interest-bearing deposits |
584,255 | 517,914 | 340,443 | 629,211 | 523,577 | |||||||||||||||
| Borrowing - FHLB Advances |
134,000 | 100,000 | 91,000 | 119,000 | 85,000 | |||||||||||||||
| Borrowings – term note |
7,063 | - | - | 21,875 | - | |||||||||||||||
| Shareholders’ equity(4) |
86,762 | 73,580 | 49,197 | 88,841 | 75,499 | |||||||||||||||
10
Table of Contents
| As of and for the Year Ended December 31, | As of and for the Quarter Ended March 31 |
|||||||||||||||||||
| (In thousands, except share and per |
2013 | 2012(1) | 2011 | 2014 | 2013 | |||||||||||||||
| Selected Performance and Capital Ratios: |
||||||||||||||||||||
| Return on average assets-annualized |
0.86% | 0.80% | 1.91% | 0.55% | 0.51% | |||||||||||||||
| Return on average equity-annualized |
10.2% | 9.9% | 20.7% | 6.6% | 5.7% | |||||||||||||||
| Net yield on interest-earning assets |
4.04% | 4.20% | 4.43% | 3.76% | 4.13% | |||||||||||||||
| Efficiency ratio(5) |
78.6% | 77.7% | 77.4% | 82.0% | 81.7% | |||||||||||||||
| Noninterest income as a % of total revenues |
35.7% | 37.5% | 46.8% | 36.3% | 35.6% | |||||||||||||||
| Tangible common equity to tangible assets(3) |
8.34% | 8.82% | 8.92% | 8.13% | 8.65% | |||||||||||||||
| Tier 1 leverage ratio |
8.67% | 9.19% | 8.92% | 8.22% | 9.19% | |||||||||||||||
| Tier 1 risk-based capital ratio |
13.04% | 13.60% | 13.54% | 12.40% | 13.12% | |||||||||||||||
| Total risk-based capital ratio |
14.30% | 14.85% | 14.80% | 13.65% | 14.37% | |||||||||||||||
| Other Information: |
||||||||||||||||||||
| Assets under management (end of period) |
$ | 2,594,961 | $ | 2,229,116 | $ | 1,827,436 | $ | 2,797,562 | 2,372,056 | |||||||||||
| NPAs to total assets |
0.32% | 0.17% | 0.00% | 0.55% | 0.41% | |||||||||||||||
| Charge-offs to average loans |
0.10% | 0.04% | 0.05% | 0.00% | 0.40% | |||||||||||||||
| Ratio of ALLL to loans(6) |
1.16% | 1.25% | 1.25% | 1.08% | 1.15% | |||||||||||||||
| Number of wealth management offices |
7 | 6 | 4 | 7 | 6 | |||||||||||||||
| (1) | Includes the results of operations of DCB for the period from the date of its acquisition on August 15, 2012 to December 31, 2012. |
| (2) | 2011 amount includes a $3.7 million gain on the sale of other real estate owned. |
| (3) | Tangible common equity, (also referred to as tangible book value) and tangible assets, are equal to common equity and assets, respectively, less $0.2 million of intangible assets as of March 31, 2014 or less $0.3 million of intangible assets as of December 31, 2013 and December 31, 2012. As of December 31, 2011, we did not have any intangible assets. |
| (4) | In December 2013, we sold and issued 318,987 shares of our common stock, at a price of $18 per share, in a private offering. We sold a total of 413,172 shares in a private offering, at a price of $15 per share, of which 374,438 were sold and issued in 2012 and 38,734 shares were sold and issued in 2013. Effective August 15, 2012, we issued a total of 815,447 shares of our common stock, valued at $15.00 per share, to the former DCB shareholders in our acquisition of DCB in exchange for all of the outstanding shares of DCB. |
| (5) | The efficiency ratio is the ratio of noninterest expense to the sum of net interest income and noninterest income. |
| (6) | This ratio excludes loans acquired in our acquisition of DCB, as generally accepted accounting principles in the United States, or GAAP, requires estimated credit losses for acquired loans to be recorded as discounts to those loans. |
11
Table of Contents
An investment in our common stock involves significant risks. You should consider carefully the risks described below, together with all of the other information included in this prospectus, before investing in our common stock. If any of the following risks actually occur, our business, financial condition, operating results and prospects could suffer. In that case, the trading price of our common stock may decline and you might lose all or part of your investment. Certain statements below are forward-looking statements. See the section entitled “Cautionary Note Regarding Forward-Looking Statements” beginning on page 28 of this prospectus.
Risks Affecting our Business
We could incur losses on the loans we make.
Loan defaults and the incurrence of losses on loans are inherent risks in our business. The incurrence of loan losses necessitate loan charge-offs and write-downs in the carrying values of a bank’s assets and, therefore, can adversely affect a bank’s results of operations and financial condition. As a result, our results of operations will be directly affected by the volume and timing of loan losses, which for a number of reasons can vary from period to period. The risks of loan losses are exacerbated by economic recessions and downturns, as evidenced by the substantial magnitude of the loan losses which many banks incurred as a result of the economic recession that commenced in 2008 and continued into 2010, or by other events that can lead to local or regional business downturns. Although an economic recovery in the U.S. has begun, unemployment remains high and there continues to be uncertainties about the strength and sustainability of the recovery. If the economic recovery were to remain weak or economic conditions were again to deteriorate, our borrowers may fail to perform in accordance with the terms of their loans and loan charge-offs and asset write-downs could increase, which could have a material adverse effect on our business, financial condition, results of operations and prospects.
If our allowance for loan and lease losses is not adequate to cover actual or estimated future loan losses, our earnings may decline.
On a quarterly basis we conduct various analyses to estimate the losses and risks inherent in our loan portfolio. However, this evaluation requires us to make a number of estimates and judgments regarding the financial condition of our borrowers, the fair value of the properties collateralizing the loans we have made to them and economic trends that could affect the ability of borrowers to meet their loan payment obligations to us and our ability to offset or mitigate loan losses by foreclosing and reselling the real properties collateralizing many of those loans. Based on those estimates and judgments, we make determinations, which are necessarily subjective, with respect to the adequacy of our allowance for loan and lease losses, or ALLL, and the extent to which it is necessary to increase our ALLL by making additional provisions for loan and lease losses through a charge to income. Inaccurate management assumptions, deterioration of economic conditions affecting borrowers, new information regarding existing loans, identification of additional problem loans and other factors, both within and outside of our control, may require us to increase our ALLL. In addition, our regulators, as an integral part of their examination process, periodically review our loan portfolio and the adequacy of our ALLL and may require adjustments based on judgments different than those of management. Further, if actual charge-offs in future periods exceed the amounts allocated to the ALLL, we may need additional provision for loan losses to restore the adequacy of our ALLL. If we are required to materially increase our level of ALLL for any reason, our business, financial condition, results of operations and prospects could be materially and adversely affected.
Adverse changes in economic conditions in Southern California could disproportionately harm us.
The substantial majority of our clients and the properties securing a large proportion of the loans we have made and will continue to make are located in Southern California, where foreclosure rates and unemployment
12
Table of Contents
have remained high relative to most other regions of the country. For example, the foreclosure rate in Los Angeles County as of March 2014 was 0.10% as compared to the national average of 0.08% and the unemployment rate in Los Angeles County as of February 2014 was 8.9% as compared to the national average of 6.7%. A downturn in economic conditions, or even the continued weakness of the economic recovery in California, or the occurrence of natural disasters, such as earthquakes or fires, which are more common in Southern California than in other parts of the country, could harm our business by:
| • | reducing loan demand which, in turn, would lead to reductions in our net interest margins and net interest income; |
| • | adversely affecting the financial capability of borrowers to meet their loan obligations to us, which could result in increases in loan losses and require us to make additional provisions for possible loan losses, thereby adversely affecting our operating results or causing us to incur losses in the future; and |
| • | causing reductions in real property values that, due to our reliance on real properties to collateralize many of our loans, could make it more difficult for us to prevent losses from being incurred on nonperforming loans through the foreclosure and sale of those real properties. |
Adverse changes in economic and market conditions, and changes in government regulations and government monetary policies could materially and negatively affect our business and results of operations.
Our business and results of operations are directly affected by factors such as political, economic and market conditions, broad trends in industry and finance, legislative and regulatory changes, changes in government monetary and fiscal policies and inflation, all of which are beyond our control. Deterioration in economic conditions, whether caused by global, national, regional or local concerns or problems, or a further downgrade in the United States debt rating, could result in the following consequences, any of which could have a material adverse effect on our business, financial condition, results of operations or prospects:
| • | a deterioration in the credit quality of our banking clients; |
| • | an increase in loan delinquencies and losses; |
| • | an increase in problem assets and foreclosures; |
| • | declines in the values of real properties collateralizing the loans we make; |
| • | the need to increase our ALLL; |
| • | fluctuations in the value of, or impairment losses which may be incurred with respect to, FFB’s investment securities; |
| • | decreases in the demand for our products and services; |
| • | increases in competition for low cost or non-interest bearing deposits; and |
| • | decreases in the investment management and advisory fees we generate. |
Changes in interest rates could reduce our net interest margin and net interest income.
Income and cash flows from our banking operations depend to a great extent on the difference or “spread” between the interest we earn on interest-earning assets, such as loans and investment securities, and the interest rates we pay on interest-bearing liabilities, such as deposits and borrowings. Interest rates are highly sensitive to many factors that are beyond our control, including general economic conditions, the monetary policies of the Federal Reserve Board, and competition from other banks and financial institutions. Changes in monetary policy, including changes in interest rates, will influence the origination and market value of and our yields on loans and investment securities and the interest we pay on deposits and on our borrowings. If we are unable to adjust our interest rates on loans and deposits on a timely basis in response to such changes in economic conditions or monetary policies, our earnings could be adversely affected. In addition, if the rates of interest we pay on deposits, borrowings and other interest-bearing liabilities increase faster than we are able to increase the rates of
13
Table of Contents
interest we charge on loans or the yields we realize on investments and other interest-earning assets, our net interest income and, therefore, our earnings will decrease. Rising interest rates also generally result in a reduction in loan originations, declines in loan repayment rates and reductions in the ability of borrowers to repay their current loan obligations, which could result in increased loan defaults and charge-offs and could require increases to our ALLL. Additionally, we could be prevented from increasing the interest rates we charge on loans or from reducing the interest rates we offer on deposits due to price competition from other banks and financial institutions with which we compete. Conversely, in a declining interest rate environment, our earnings could be adversely affected if the interest rates we are able to charge on loans or other investments decline more quickly than those we pay on deposits and borrowings.
Residential real estate loans represent a high percentage of the loans we make, making our results of operations vulnerable to downturns in the real estate market.
At March 31, 2014, loans secured by multifamily and single family residences represented 70% of FFB’s outstanding loans. The repayment of residential real estate loans is highly dependent on the market values of the real properties that collateralize these loans and on the ability of the borrowers to meet their loan repayment obligations to us, which can be adversely affected by economic downturns that lead to increases in unemployment, or by rising interest rates which can increase the amount of the interest borrowers are required to pay on their loans. As a result, our operating results are more vulnerable to adverse changes in the real estate market than other financial institutions with more diversified loan portfolios and we could incur losses in the event of changes in economic conditions that disproportionately affect the real estate markets.
Liquidity risk could adversely affect our ability to fund operations and hurt our financial condition.
Liquidity is essential to our banking business, as we use cash to make loans and purchase investment securities and other interest-earning assets and to fund deposit withdrawals that occur in the ordinary course of our business. Our principal sources of liquidity include earnings, deposits, Federal Home Loan Bank (or FHLB) borrowings, sales of loans or investment securities held for sale, and repayments by clients of loans we have made to them, and capital contributions that we may make to FFB with proceeds from sales of our common stock or from borrowings that we may incur. If the ability to obtain funds from these sources becomes limited or the costs of those funds increase, whether due to factors that affect us specifically, including our financial performance, or due to factors that affect the financial services industry in general, including weakening economic conditions or negative views and expectations about the prospects for the financial services industry as a whole, then our ability to grow our banking and investment advisory and wealth management businesses would be harmed, which could have a material adverse effect on our business, financial condition, results of operations and prospects.
Our 5 largest deposit clients account for 33% of our total deposits.
As of March 31, 2014, our 5 largest bank depositors accounted for, in the aggregate, 33% of our total deposits. As a result, a material decrease in the volume of those deposits by a relatively small number of our depositors could reduce our liquidity, in which event it could became necessary for us to replace those deposits with higher-cost deposits, lower-yielding securities or FHLB borrowings, which would adversely affect our net interest income and, therefore, our results of operations.
Although we plan to grow our business by acquiring other banks, there is no assurance that we will succeed in doing so.
One of the key elements of our business plan is to grow our banking franchise and increase our market share, and for that reason, we intend to take advantage of opportunities to acquire other banks. However, there is no assurance that we will succeed in doing so. Our ability to execute on our strategy to acquire other banks may require us to raise additional capital and to increase FFB’s capital position to support the growth of our banking
14
Table of Contents
franchise, and will also depend on market conditions, over which we have no control. Moreover, any bank acquisitions will require the approval of our bank regulators and there can be no assurance that we will be able to obtain such approvals on acceptable terms, if at all.
Expansion of our banking franchise may not increase our profitability and may adversely affect our future operating results.
Since we commenced our banking business in October 2007, we have grown our banking franchise by establishing three new wealth management offices in Southern California and one in Las Vegas, Nevada and acquiring two new offices in Palm Desert and El Centro, California as part of our acquisition of Desert Commercial Bank, or DCB. We plan to continue to grow our banking franchise both organically and through potential acquisitions of other banks. However, the implementation of our growth strategy will pose a number of risks, including:
| • | the risk that any newly established wealth management offices will not generate revenues in amounts sufficient to cover the start-up costs of those offices, which would reduce our income or possibly cause us to incur operating losses; |
| • | the risk that any bank acquisitions we might consummate in the future will prove not to be accretive to or may reduce our earnings if we do not realize anticipated cost savings or if we incur unanticipated costs in integrating the acquired banks into our operations or if a substantial number of the clients of the acquired banks move their banking business to our competitors; |
| • | the risk that such expansion efforts will divert management time and effort from our existing banking operations, which could adversely affect our future financial performance; and |
| • | the risk that the additional capital which we may need to support our growth or the issuance of shares in any bank acquisitions will be dilutive of the share ownership of our existing shareholders. |
We have borrowings of $21.9 million under a five year term loan that is secured by a pledge of all of FFB’s shares. As a result, a failure by us either to meet certain financial covenants applicable to that term loan or to repay that loan when due would have a material adverse effect on us.
In April 2013, we obtained a five year term loan in the amount of $7.5 million from an unaffiliated bank. In March 2014, we obtained a $15 million increase in that loan, bringing the total principal amount to approximately $21.9 million. We used $17.5 million of the proceeds of the loan to make capital contributions to FFB to fund the growth of our banking business. In order to obtain that loan, however, we were required to pledge all of the shares of FFB stock to the bank lender as security for our payment and other obligations under that loan agreement. Additionally, the loan agreement contains a number of financial and other covenants which we are required to meet over the five year term of the loan. As a result, such borrowings may make us more vulnerable to general economic downturns and competitive pressures, which could cause us to fail to meet one or more of those financial covenants. If we were unable to meet any of those covenants, we could be required to repay the loan sooner than its maturity date in May 2018. If we are unable to repay the loan when due, whether at maturity or earlier, the lender would have the right to sell our FFB shares to recover the amounts that are due it by us under the loan agreement. Since the stock of FFB comprises one of our most important assets on which our success is dependent, an inability on our part to repay the loan would have a material adverse effect on our business, financial condition, results of operations and prospects and cause us to incur significant losses. See the section entitled “Management’s Discussion and Analysis of Financial Condition and Results of Operations—Financial Condition—Term Loan” for additional information about this loan.
We face intense competition from other banks and financial institutions and other wealth and investment management firms that could hurt our business.
We conduct our business operations primarily in Southern California, where the banking business is highly competitive and is dominated by large multi-state and in-state banks with operations and offices covering
15
Table of Contents
wide geographic areas. We also compete with other financial service businesses, including investment advisory and wealth management firms, mutual fund companies, and securities brokerage and investment banking firms that offer competitive banking and financial products and services as well as products and services that we do not offer. Larger banks and many of those other financial service organizations have greater financial and marketing resources that enable them to conduct extensive advertising campaigns and to shift resources to regions or activities of greater potential profitability. They also have substantially more capital and higher lending limits, which enable them to attract larger clients and offer financial products and services that we are unable to offer, putting us at a disadvantage in competing with them for loans and deposits and investment management clients. If we are unable to compete effectively with those banking or other financial services businesses, we could find it more difficult to attract new and retain existing clients and our net interest margins, net interest income and investment management advisory fees could decline, which would adversely affect our results of operations and could cause us to incur losses in the future.
In addition, our ability to successfully attract and retain investment advisory and wealth management clients is dependent on our ability to compete with competitors’ investment products, level of investment performance, client services and marketing and distribution capabilities. If we are not successful in attracting new and retaining existing clients, our business, financial condition, results of operations and prospects may be materially and adversely affected.
The loss of key personnel or inability to attract additional personnel could hurt our future financial performance.
We currently depend heavily on the contributions and services provided by Rick Keller, our Executive Chairman, Scott Kavanaugh, Chief Executive Officer of FFI and FFB, John Hakopian, President of FFA, Dave Rahn, President of FFB and John Michel, Chief Financial Officer of FFI, FFB and FFA, as well as a number of other key management personnel. Our future success also will depend, in part, on our ability to attract and retain additional qualified relationship managers, private banking officers and investment managers. Competition for such personnel is intense and we may not succeed in retaining our existing personnel or attracting additional personnel we will need to continue to grow our business. If we are unable to continue to retain the services of any of our existing executive management personnel, or attract and retain qualified relationship managers, private banking officers and investment managers, our ability to retain existing clients or attract new clients could be adversely affected and our business, financial condition, results of operations or prospects could be significantly harmed.
Banking laws and government regulations may adversely affect our operations, restrict our growth or increase our operating costs.
We are also subject to extensive supervision and regulation by federal and California state bank regulatory agencies. The primary objective of these agencies is to protect bank depositors and not shareholders, whose respective interests often differ. These regulatory agencies have the legal authority to impose restrictions which they believe are needed to protect depositors, even if those restrictions would adversely affect the ability of a banking institution to expand its business, restrict its ability to pay cash dividends, cause its costs of doing business to increase, or hinder its ability to compete with less regulated financial services companies.
We are also subject to numerous laws and government regulations that are applicable to banks and other financial institutions, including:
Consumer Protection Laws and Regulations. We are required to comply with various consumer protection laws, including the Community Reinvestment Act, the Equal Credit Opportunity Act, the Fair Housing Act and other fair lending laws and regulations impose nondiscriminatory lending requirements on financial institutions.
16
Table of Contents
Bank Secrecy Act and other Anti-Money Laundering Laws and Regulations. As a financial institution, we are required by the Bank Secrecy Act, the USA PATRIOT Act of 2001 and other anti-money laundering laws and regulations, to institute and maintain an effective anti-money laundering program and file suspicious activity and currency transaction reports as appropriate. We are also subject to increased scrutiny of compliance with the rules enforced by the Office of Foreign Assets Control.
If the policies, procedures or systems which we have adopted to comply with these laws and regulations are found by any regulatory or other government agencies to be deficient or we fail to comply with any of these banking laws or regulations, we would be subject to liability, including fines and regulatory actions, which may lead to the imposition of restrictions on our ability to pay dividends or to proceed with certain aspects of our business plan, including our acquisition plans. Additionally, a failure to maintain and implement adequate programs to combat money laundering and terrorist financing could also have serious reputational consequences for us. Due, moreover, to the complex and technical nature of many of these laws and government regulations, inadvertent violations may and sometimes do occur. In such an event, we would be required to correct or implement measures to prevent a recurrence of such violations, which could increase our operating costs. If more serious violations were to occur, the regulatory agencies could limit our activities or growth, fine us, or ultimately put FFB out of business if it was to encounter severe liquidity problems or a significant erosion of capital below the minimum amounts required under applicable bank regulations. Any of these occurrences could have a material adverse effect on our business, financial condition, results of operations or prospects.
The enactment of the Dodd-Frank Act and the new Basel III capital rules pose uncertainties for our business and are likely to increase our costs of doing business in the future.
On July 21, 2010, the President signed the Dodd-Frank Wall Street Reform and Consumer Protection Act, or the Dodd-Frank Act, into law. Changes made by the Dodd-Frank Act include, among others: (i) the establishment of new requirements on banking, derivative and investment activities, including modified capital requirements, (ii) the repeal of the prohibition on the payment of interest on business demand deposit accounts, (iii) the imposition of limitations on debit card interchange fees, (iv) the promulgation of enhanced financial institution safety and soundness regulations, (v) increases in assessment fees and deposit insurance coverage, and (vi) the establishment of new regulatory bodies, such as the Bureau of Consumer Financial Protection, or the BCFP. The BCFP has been granted rulemaking authority over several federal consumer financial protection laws and, in some instances, has the authority to examine and supervise and enforce compliance by banks and other financial service organizations with these laws and regulations. We expect that the Dodd-Frank Act and its implementing regulations will increase the costs of doing business for us, as well as for other banking institutions. We also expect that the repeal of the prohibition on the payment by banks of interest on business demand deposits will result in increased “price” competition among banks for such deposits, which could increase the costs of funds to us (as well as to other banks) and result in a reduction in our net interest margins and income in the future.
In July 2013, the Board of Governors of the Federal Reserve System (or the Federal Reserve Board or FRB) adopted final rules (the “New Capital Rules”) establishing a new comprehensive capital framework for U.S. banking organizations based on capital guidelines adopted by the International Basel Committee on Banking Supervision (the “Basel Committee”), and the Federal Deposit Insurance Corporation (or FDIC) has adopted substantially identical rules. The rules not only implement the Basel Committee’s December 2010 framework for strengthening international capital standards, but also certain provisions of the Dodd-Frank Act. The New Capital Rules substantially revise and heighten the risk-based capital requirements applicable to U.S. banking organizations, including FFI and FFB, from the current U.S. risk-based capital rules and replace the existing approach used in risk-weighting of a banking organization’s assets with a more risk-sensitive approach. The New Capital Rules will become effective for FFI and FFB on January 1, 2015 (subject in the case of certain of those rules to phase-in periods). These new Capital Rules will increase the amount of capital which both FFI
17
Table of Contents
and FFB will have to maintain and it is expected that it will also increase the costs of capital for bank holding companies and banks in the United States. See “Supervision and Regulation—First Foundation Bank—New Basel III Capital Rules” below for additional information regarding these new capital requirements.
The fair value of our investment securities can fluctuate due to factors outside of our control.
As of March 31, 2014, the fair value of our investment securities portfolio was $73.3 million. Factors beyond our control can significantly influence the fair value of securities in our portfolio and can cause potential adverse changes to the fair value of these securities. These factors include, but are not limited to, rating agency actions in respect of the securities, defaults by the issuer or with respect to the underlying securities, changes in market interest rates and continued instability in the capital markets. Any of these factors, among others, could cause other-than-temporary impairments and realized and/or unrealized losses in future periods and declines in other comprehensive income, which could materially and adversely affect our business, results of operations, financial condition and prospects. In addition, the process for determining whether impairment of a security is other-than-temporary usually requires complex, subjective judgments about the future financial performance and liquidity of the issuer and any collateral underlying the security in order to assess the probability of receiving all contractual principal and interest payments on the security.
Premiums for federal deposit insurance have increased and may increase even more.
The FDIC uses the Deposit Insurance Fund, or DIF, to cover insured deposits in the event of bank failures, and maintains that Fund by assessing insurance premiums on FDIC-insured banks and other depository institutions. The increase in bank failures during the three years ended December 31, 2010 caused the DIF to fall below the minimum balance required by law, forcing the FDIC to raise the insurance premiums assessed on FDIC-insured banks in order to rebuild the DIF. Depending on the frequency and severity of bank failures in the future, the FDIC may further increase premiums or assessments. In addition, our FDIC insurance premiums will increase as we grow our banking business. Such increases in FDIC insurance premiums would increase our costs of doing business and, therefore, could adversely affect our results of operations and earnings in the future.
Technology and marketing costs may negatively impact our future operating results.
The financial services industry is constantly undergoing technological changes in the types of products and services provided to clients to enhance client convenience. Our future success will depend upon our ability to address the changing technological needs of our clients and to compete with other financial services organizations which have successfully implemented new technologies. The costs of implementing technological changes, new product development and marketing costs may increase our operating expenses without a commensurate increase in our business or revenues, in which event our business, financial condition, results of operations and prospects could be materially and adversely affected.
We rely on communications, information, operating and financial control systems technology from third-party service providers, and we could suffer an interruption in those systems.
We rely heavily on third-party service providers for much of our communications, information, operating and financial control systems technology, including our internet banking services and data processing systems. Any failure or interruption, or breaches in security, of these systems could result in failures or interruptions in our client relationship management, general ledger, deposit, servicing and/or loan origination systems and, therefore, could harm our business, financial condition, results of operations and prospects. Additionally, interruptions in service and security breaches could lead existing clients to terminate their business relationships with us, could make it more difficult for us to attract new clients and subject us to additional regulatory scrutiny and possibly financial liability, any of which could have a material adverse effect on our business, financial condition, results of operations and prospects.
18
Table of Contents
We may bear costs associated with the proliferation of computer theft and cyber-crime.
In the ordinary course of our business, we are required to collect, use and hold data concerning our clients. Threats to data security, including unauthorized access and cyber-attacks, rapidly emerge and change, exposing us to additional costs for protection or remediation and competing time constraints to secure our data in accordance with customer expectations and statutory and regulatory requirements. It is difficult or impossible to defend against every risk being posed by changing technologies, as well as against criminals who are intent on committing cyber-crime. Increasing sophistication of cyber-criminals and terrorists make keeping up with new threats difficult and could result in security breaches. Patching and other measures to protect existing systems and servers could be inadequate, especially on systems that are being retired. Controls employed by our information technology department and cloud vendors could prove inadequate. We could also experience a breach by intentional or negligent conduct on the part of employees or other internal sources. Our systems and those of our third-party vendors may become vulnerable to damage or disruption due to circumstances beyond our or their control, such as from catastrophic events, power anomalies or outages, natural disasters, network failures, and viruses and malware.
A breach of our security that results in unauthorized access to our data could expose us to a disruption or challenges relating to our daily operations, as well as to data loss, litigation, damages, fines and penalties, significant increases in compliance costs, and reputational damage, any of which could have a material adverse effect on our business, results of operations, financial condition and prospects.
Our ability to attract and retain clients and employees could be adversely affected if our reputation is harmed.
The ability of FFB and FFA to attract and retain clients and key employees could be adversely affected if our reputation is harmed. Any actual or perceived failure to address various issues, including legal or regulatory compliance issues, questions regarding our ability to protect the privacy of client and employee financial or other personal information; or potential conflicts of interest or other ethical issues could cause us reputational harm. Moreover, any failure to appropriately address any issues of this nature could give rise to additional regulatory restrictions and legal risks which could lead to costly litigation or subject us to enforcement actions, fines, or penalties and cause us to incur related costs and expenses. In addition, our banking, investment advisory and wealth management businesses are dependent on the integrity of our banking personnel and our investment advisory and wealth managers. Lapses in integrity could cause reputational harm to our businesses which could result in the loss of clients and, therefore, could have a material adverse effect on our business, financial condition, results of operations and prospects.
We are exposed to risk of environmental liabilities with respect to real properties that we may acquire.
From time to time, in the ordinary course of our business, we acquire, by or in lieu of foreclosure, real properties which collateralize nonperforming loans (often referred to as “Real Estate Owned” or “REO”). As an owner of such properties, we could become subject to environmental liabilities and incur substantial costs for any property damage, personal injury, investigation and clean-up that may be required due to any environmental contamination that may be found to exist at any of those properties, even if we did not engage in the activities that led to such contamination and those activities took place prior to our ownership of the properties. In addition, if we are the owner or former owner of a contaminated site, we may be subject to common law claims by third parties seeking damages for environmental contamination emanating from the site. If we were to become subject to significant environmental liabilities or costs, our business, financial conditions, results of operations and prospects could be materially and adversely affected.
We may incur significant losses as a result of ineffective risk management processes and strategies.
We seek to monitor and control our risk exposure through a risk and control framework encompassing a variety of separate but complementary financial, credit, operational, compliance systems, and internal control and
19
Table of Contents
management review processes. However, those systems and review processes and the judgments that accompany their application may not be effective and, as a result, we may not anticipate every economic and financial outcome in all market environments or the specifics and timing of such outcomes, particularly in the event of the kinds of dislocations in market conditions experienced over the last several years, which highlight the limitations inherent in using historical data to manage risk. If those systems and review processes prove to be ineffective in identifying and managing risks, our results of operations could be adversely affected.
Our investment advisory and wealth management business may be negatively impacted by changes in economic and market conditions.
Our investment advisory and wealth management businesses may be negatively impacted by changes in general economic and market conditions because the performance of those businesses is directly affected by conditions in the financial and securities markets. The financial markets and businesses operating in the securities industry are highly volatile (meaning that performance results can vary greatly within short periods of time) and are directly affected by, among other factors, domestic and foreign economic conditions and general trends in business and finance, and by the threat, as well as the occurrence of global conflicts, all of which are beyond our control. We cannot assure you that broad market performance will be favorable in the future. Declines in the financial markets or a lack of sustained growth may result in a decline in the performance of our investment advisory and wealth management business and may adversely affect the market value and performance of the investment securities that we manage, which could lead to reductions in our investment management and advisory fees, because they are based primarily on the market value of the securities we manage and could lead some of our clients to reduce their assets under management by us. If any of these events occur, the financial performance of our investment advisory and wealth management business could be materially and adversely affected.
The investment management contracts we have with our clients are terminable without cause and on relatively short notice by our clients, which makes us vulnerable to short term declines in the performance of the securities under our management.
Like most other companies with an investment and wealth management business, the investment and wealth management contracts we have with our clients are typically terminable by the client without cause upon less than 30 days’ notice. As a result, even short term declines in the performance of the securities we manage, which can result from factors outside our control such as adverse changes in market or economic condition or the poor performance of some of the investments we have recommended to our clients, could lead some of our clients to move assets under our management to other asset classes such as broad index funds or treasury securities, or to investment advisors which have investment product offerings or investment strategies different than ours. Therefore, our operating results are heavily dependent on the financial performance of our investment portfolios and the investment strategies we employ in our investment advisory businesses and even short-term declines in the performance of the investment portfolios we manage for our clients, whatever the cause, could result in a decline in assets under management and a corresponding decline in investment management fees, which would adversely affect our results of operations.
The market for investment managers is extremely competitive and the loss of a key investment manager to a competitor could adversely affect our investment advisory and wealth management business.
We believe that investment performance is one of the most important factors that affect the amount of assets under our management. As a result, we rely heavily on our investment managers to produce attractive investment returns for our clients. However, the market for investment managers is extremely competitive and is increasingly characterized by frequent movement of investment managers among different firms. In addition, our individual investment managers often have regular direct contact with particular clients, which can lead to a strong client relationship based on the client’s trust in that individual manager. As a result, the loss of a key investment manager to a competitor could jeopardize our relationships with some of our clients and lead to the loss of client accounts. Losses of such accounts could have a material adverse effect on our business, financial condition, results of operations and prospects.
20
Table of Contents
FFA’s business is highly regulated, and the regulators have the ability to limit or restrict our activities and impose fines or other sanctions on FFA’s business.
FFA is registered as an investment adviser with the Securities and Exchange Commission, or SEC under the Investment Advisers Act of 1940, or Investment Advisers Act, and FFA’s business is highly regulated. The Investment Advisers Act imposes numerous obligations on registered investment advisers, including fiduciary, record keeping, operational and disclosure obligations. Moreover, the Investment Advisers Act grants broad administrative powers to regulatory agencies such as the SEC. If the SEC or other government agencies believe that FFA has failed to comply with applicable laws or regulations, these agencies have the power to impose fines, suspensions of individual employees or other sanctions, which could include revocation of FFA’s registration under the Investment Advisers Act. Changes in legal, regulatory, accounting, tax and compliance requirements also could adversely affect FFA’s operations and financial results, by, among other things, increasing its operating expenses and placing restraints on the marketing of certain investment products. Like other investment management companies, FFA also faces the risks of lawsuits by clients. The outcome of regulatory proceedings and lawsuits is uncertain and difficult to predict. An adverse resolution of any regulatory proceeding or lawsuit against FFA could result in substantial costs or reputational harm to FFA and, therefore, could have an adverse effect on the ability of FFA to retain key relationship and wealth managers and existing clients or attract new clients, which would have a material adverse effect on our business, financial condition, results of operations and prospects.
We are also subject to the provisions and regulations of the Employee Retirement Income Security Act of 1974, or ERISA to the extent that we act as a “fiduciary” under ERISA with respect to certain of our clients. ERISA and the applicable provisions of the federal tax laws, impose a number of duties on persons who are fiduciaries under ERISA and prohibit certain transactions involving the assets of each ERISA plan which is a client, as well as certain transactions by the fiduciaries (and certain other related parties) to such plans.
We may be adversely affected by the soundness of brokerage firms which act as custodians for the assets we manage.
FFA does not provide custodial services for its clients. Instead, client investment accounts are maintained under custodial arrangements with large, well established brokerage firms, either directly or through FFB. As a result, the performance of, or even rumors or questions about, one or more of these brokerage firms could adversely affect the confidence of FFA’s customers in the services provided by those brokerage firms or otherwise adversely impact their custodial holdings. Such an occurrence could negatively impact the ability of FFA to attract or retain its customer relationships and, as a result, could have a material adverse effect on our business, financial condition, results of operations and prospects.
Risks Related to this Offering and an Investment in our Common Stock
We do not plan to pay dividends for the foreseeable future. Additionally, our ability to pay dividends is subject to regulatory and other restrictions.
In order to implement our growth strategy, it is our policy to retain cash for our businesses and, as a result, we have never paid any cash dividends and we have no plans to pay cash dividends at least for the foreseeable future. Additionally, our ability to pay dividends to our shareholders is restricted by California and federal law. Moreover, the term loan agreement we entered into in April 2013 prohibits us from paying cash dividends to our shareholders without the lender’s prior written consent. See the section entitled “Management’s Discussion and Analysis of Financial Condition and Results of Operations—Financial Condition—Term Loan” for additional information about this loan.
Our ability to pay dividends is also dependent on the payment to us of dividends by FFB and FFA, which are subject to statutory and regulatory restrictions as well. FFA’s ability to pay cash dividends to us is restricted under California law. FFB’s ability to pay dividends to us is limited by various banking statutes and regulations. Moreover, based on their assessment of the financial condition of FFB or other factors, the FDIC or the California Department of Business Oversight (or the DBO) could find that the payment of cash dividends to us
21
Table of Contents
by FFB would constitute an unsafe or unsound banking practice and, therefore, prohibit FFB from paying cash dividends to us, even if FFB meets the statutory requirements to do so. See the section entitled “Dividend Policy” for additional information about our dividend policy and the dividend payments restrictions that apply to us and to FFB.
An active trading market for our common stock may not develop or may not be sustained, and you may not be able to sell your common stock at or above the initial public offering price.
Prior to this offering, there has been no public market for our common stock. An active trading market for shares of our common stock may never develop or be sustained following this offering. If an active trading market does not develop, or cannot be sustained, you may have difficulty selling your shares of common stock at an attractive price, or at all. The initial public offering price for our common stock will be determined by negotiations between us and the representative of the underwriters and may not be indicative of prices that will prevail in the open market following this offering. Consequently, you may not be able to sell your common stock at or above the initial public offering price or at any other price or at the time that you would like to sell. An inactive market may also impair our ability to raise capital by selling our common stock and may impair our ability to expand our business by using our common stock as consideration.
The market prices and trading volume of our common stock may be volatile.
Even if a market develops for our common stock, the market prices of our common stock may be volatile and the trading volume may fluctuate and cause significant price variations to occur. We cannot assure you that, if a market does develop for our common stock, the market prices of our common stock will not fluctuate or decline significantly in the future. Some of the factors that could negatively affect the prices of our shares or result in fluctuations in those prices or in trading volume of our common stock could include the following, many of which are outside of our control:
| • | quarterly variations in our operating results or the quality of our earnings or assets; |
| • | operating results that vary from the expectations of management, securities analysts, and investors; |
| • | recommendations or lack thereof by securities analysts; |
| • | changes in expectations as to our future financial performance; |
| • | the operating and securities price performance of other companies that investors believe are comparable to us; |
| • | our implementation of our growth strategy and performance of acquired businesses that vary from the expectations of securities analysts and investors; |
| • | the effects of, and changes in, trade, monetary and fiscal policies, including the interest rate policies of the Federal Reserve; |
| • | the adoption of new more costly government regulations that are applicable to our businesses or the imposition of regulatory restrictions on us; |
| • | our past and future dividend practices; |
| • | additions or departures of key personnel; |
| • | future sales of our equity or equity-related securities; |
| • | perceptions in the marketplace regarding us and/or our competitors; |
| • | new technology used, or services offered, by competitors; |
| • | proposed or adopted changes in laws or policies affecting us; and |
| • | announcements of strategic developments, material acquisitions and other material events in our business or in the businesses of our competitors, including the failures of other financial institutions in the recent economic downturn. |
22
Table of Contents
In addition, if the market for stocks in our industry, or the stock market in general, experiences a loss of investor confidence, the trading price of our common stock could decline for reasons unrelated to our business, financial condition or results of operations. If any of the foregoing occurs, it could cause our stock price to fall and may expose us to lawsuits that, even if unsuccessful, could be costly to defend and a distraction to management.
Securities class action litigation has often been instituted against companies following periods of volatility in the overall market and in the market price of a company’s securities. This litigation, if instituted against us, could result in substantial costs, divert our management’s attention and resources, and have a material adverse effect on our business, financial condition, results of operations and prospects.
If equity research analysts do not publish research reports about our business, or if they do publish such reports but issue unfavorable commentary or downgrade our common stock, the price and trading volume of our common stock could decline.
The trading market for our common stock could be affected by whether and the extent to which equity research analysts publish research reports about us and our business. We cannot predict at this time whether any research analysts will cover us and our common stock or whether they will publish research reports on us. If any of the analysts who elect to cover us downgrade their recommendation with respect to our common stock, our stock price could decline rapidly. If any of these analysts ceases coverage of us, we could lose visibility in the market, which in turn could cause our common stock price or trading volume to decline and our common stock to become less liquid.
Share ownership by our officers and directors and certain agreements make it more difficult for third parties to acquire us or effectuate a change of control that might be viewed favorably by other shareholders.
As of March 31, 2014, our executive officers and directors owned, in the aggregate, 34% of our outstanding shares. As a result, if the officers and directors were to oppose a third party’s acquisition proposal for, or a change in control of, FFI, the officers and directors may have sufficient voting power to be able to block or at least delay such an acquisition or change in control from taking place, even if other shareholders would support such a sale or change of control. In addition, a number of FFI’s officers have change of control agreements which could increase the costs and, therefore, lessen the attractiveness of an acquisition of FFI to a potential acquiring party. See the section entitled “Executive Compensation—Change of Control Agreements” for additional information about the change of control arrangements we have with certain executive officers.
Our corporate governance documents, and certain corporate and banking laws applicable to us, could make a takeover attempt, which may be beneficial to our shareholders, more difficult.
Our Board of Directors, or Board, has the power, under our articles of incorporation, to issue additional shares of common stock and create and authorize the sale of one or more series of preferred stock without having to obtain shareholder approval for such action. As a result, our Board could authorize the issuance of shares of a series of preferred stock to implement a shareholders rights plan (often referred to as a “poison pill”) or could sell and issue preferred shares with special voting rights or conversion rights, which could deter or delay attempts by our shareholders to remove or replace management, and attempts of third parties either to engage in proxy contests or to acquire control of FFI. In addition, our charter documents:
| • | enable our Board to fill vacant directorships except for vacancies created by the removal of a director; |
| • | enable our Board to amend our bylaws without shareholder approval subject to certain exceptions; and |
23
Table of Contents
| • | require compliance with an advance notice procedure with regard to business to be brought by a shareholder before an annual or special meeting of shareholders and with regard to the nomination by shareholders of candidates for election as directors. |
Furthermore, federal and state banking laws and regulations applicable to us require prior regulatory application and approval of certain transactions involving control of FFI or of FFB. These provisions may discourage potential acquisition proposals and could delay or prevent a change of control, including under circumstances in which our shareholders might otherwise receive a premium over the market price of our common stock.
Our management will have broad discretion as to the use of proceeds from this offering, you may not agree with the manner in which we use the proceeds and our use of those proceeds may not yield a favorable return on investment.
While we anticipate using $21.5 million of the offering proceeds to retire our term loan, we have not formally designated the amount of net proceeds that we will use for any other particular purpose. Accordingly, our management will have broad discretion as to the application of the net proceeds of this offering and could use them for purposes other than those contemplated at the time of this offering. We may not be successful in using the net proceeds from this offering to increase our profitability or market value, and we cannot predict whether the proceeds will yield a favorable return on investment.
You will incur immediate dilution as a result of this offering.
If you purchase common stock in this offering, you will pay more for your shares than our existing net tangible book value per share. As a result, you will incur immediate dilution of $8.97 per share, representing the difference between the initial public offering price of $22.50 per share and our adjusted net tangible book value per share after giving effect to this offering. This represents 39.9% dilution from the initial public offering price.
Future equity issuances could result in dilution, which could cause our common stock price to decline.
We are generally not restricted from issuing additional shares of our common stock up to the number of shares authorized in our Articles of Incorporation which currently is 20 million shares. Among other scenarios, we may issue additional shares of our common stock in the future pursuant to current or future equity incentive plans, in connection with future acquisitions or financings, to enhance our capital position or as a result of a regulatory order or directive. In addition, we could be required to issue up to 270,000 additional shares of our common stock, valued at $15.00 per share, to former shareholders of DCB depending on the performance of certain assets we acquired from DCB. If we were to raise capital in the future by selling shares of our common stock, or securities that are convertible into our common stock or issuing shares in a business acquisition, their issuance would have a dilutive effect on the percentage ownership of our shareholders and, depending on the prices at which such shares or convertible securities are sold or issued, on their investment in our common stock and, therefore, could have a material adverse effect on the market prices of our common stock.
Future sales of our common stock could depress the market prices of our common stock.
Sales of a substantial number of shares of our common stock in the public market following this offering, or the perception that large sales of our shares could occur, could cause the market prices of our common stock to decline or limit our future ability to raise capital through an offering of equity securities.
After completion of this offering, there will be 9,955,736 shares of our common stock outstanding. All of the shares of common stock sold in this offering will be freely tradable without restriction or further registration under the federal securities laws, other than shares which our directors or executive officers may
24
Table of Contents
purchase, which will be subject to the resale limitations of Rule 144 under the Securities Act of 1933, as amended (the “Securities Act”). Our directors, executive officers and certain other shareholders have agreed to enter into lock-up agreements generally providing, subject to limited exceptions, that they will not, without the prior written consent of Sandler O’Neill + Partners, L.P., directly or indirectly offer to sell, or otherwise dispose of any shares of our common stock during the period ending 180 days after the date of this prospectus.
On January 30, 2014, we registered under the Securities Act a total of 1,799,103 shares of our common stock reserved for issuance under our Equity Plans (as described in the section of this prospectus titled “Executive Compensation—Equity Incentive Plans”). Accordingly, subject to certain vesting requirements and transferability restrictions on shares reserved for issuance to our executive officers and directors under the Equity Plans, those shares will be available for sale in the open market immediately by persons other than our executive officers and directors, and immediately after the lock-up agreements expire in the case of our executive officers and directors.
The requirements of being a public company will increase our costs and may strain our management and financial resources.
We have been a public reporting company since December 16, 2013 and will continue to be a public company following this offering. As a public company, we face increased legal, accounting, administrative and other costs and expenses that we have not previously incurred as a private company. We are also subject to numerous other laws that impose significant disclosure and governance requirements on public companies, including the Sarbanes-Oxley Act of 2002, or the Sarbanes-Oxley Act, and the Dodd-Frank Act. In addition, we are subject to the rules of the Public Company Accounting Oversight Board and, following this offering, will be subject to the rules of the NASDAQ Stock Market, each of which imposes additional reporting, governance and other requirements on public companies.
As a public company, we are required to:
| • | prepare and distribute periodic reports, proxy statements, and other shareholder communications in compliance with federal securities laws and the listing rules of the NASDAQ Stock Market; |
| • | expand the roles and duties of our board of directors and committees thereof, and potentially retain and compensate advisers retained by the board or those committees; |
| • | institute more comprehensive financial reporting and disclosure compliance functions; |
| • | involve and retain to a greater degree outside counsel and accountants in the activities listed above; |
| • | establish new internal policies, including those relating to trading in our securities and disclosure controls and procedures; |
| • | comply with the Sarbanes-Oxley Act, in particular Section 404 and Section 302; and |
| • | comply with certain disclosure and governance requirements set forth in the Dodd-Frank Act. |
We expect these rules and regulations to increase our legal and financial compliance costs and to make some activities more time-consuming and costly, although we are currently unable to estimate these costs with any degree of certainty. A number of these requirements will require us to carry out activities we have not performed previously and complying with these requirements may divert management’s attention from their other responsibilities, which could have a material adverse effect on our business, financial condition, and operating results. We also expect that it will be more difficult and expensive to maintain director and officer liability insurance, and we may be required to accept reduced policy limits and coverage or incur substantially higher costs to obtain the same or similar coverage. Furthermore, if we are unable to satisfy our obligations as a public company, we could be subject to delisting of our common stock, fines, sanctions and other regulatory action and potentially civil litigation.
25
Table of Contents
We have elected under the JOBS Act to use an extended transition period for complying with new or revised accounting standards.
We are electing to take advantage of the extended transition period afforded by the Jumpstart our Business Startups Act of 2012, or the JOBS Act, for the implementation of new or revised accounting standards. As a result, we will not be required to comply with new or revised accounting standards that have different effective dates for public and private companies until those standards apply to private companies or we cease to be an “emerging growth” company as defined in the JOBS Act. As a result of this election, our financial statements may not be comparable to the financial statements of companies that comply with public company effective dates.
The reduced disclosures and relief from certain other significant disclosure requirements that are available to emerging growth companies may make our common stock less attractive to investors.
We are an “emerging growth company,” as defined in the JOBS Act, and we intend to take advantage of certain exemptions from various reporting requirements that apply to other public companies that are not “emerging growth companies.” These exemptions include the following:
| • | not being required to comply with the auditor attestation requirements of Section 404 of the Sarbanes-Oxley Act; |
| • | less extensive disclosure obligations regarding executive compensation in our periodic reports and proxy statements; and |
| • | exemptions from the requirements to hold nonbinding advisory votes on executive compensation and shareholder approval of any golden parachute payments not previously approved. |
In addition, even if we comply with the greater obligations of public companies that are not emerging growth companies immediately after this offering, we may avail ourselves of the reduced requirements applicable to emerging growth companies from time to time in the future, so long as we are an emerging growth company.
We will remain an emerging growth company for up to five years, though we may cease to be an emerging growth company earlier under certain circumstances, including if, before the end of such five years, we are deemed to be a large accelerated filer under the rules of the SEC (which depends on, among other things, having a market value of common stock held by non-affiliates in excess of $700 million). Investors and securities analysts may find it more difficult to evaluate our common stock because we will rely on one or more of these exemptions. If, as a result, some investors find our common stock less attractive, there may be a less active trading market for our common stock, which could result in a reductions and greater volatility in the prices of our common stock.
Further, Section 102(b)(1) of the JOBS Act exempts emerging growth companies from being required to comply with new or revised financial accounting standards until private companies (that is, those that have not had a Securities Act registration statement declared effective or do not have a class of securities registered under the Securities Exchange Act of 1934, or the Exchange Act) are required to comply with the new or revised financial accounting standards. The JOBS Act provides that a company can elect to opt out of the extended transition period and comply with the requirements that apply to non-emerging growth companies but any such election to opt out is irrevocable. We have elected not to opt out of such extended transition period which means that when a standard is issued or revised and it has different application dates for public or private companies, we, as an emerging growth company, can adopt the new or revised standard at the time private companies adopt the new or revised standard. As a result, our financial statements may not be comparable with those of another public company which is neither an emerging growth company nor an emerging growth company which has opted out of using the extended transition period because of the potential differences in accounting standards used.
26
Table of Contents
Pursuant to the JOBS Act, our independent registered public accounting firm will not be required to attest to the effectiveness of our internal control over financial reporting for so long as we are an “emerging growth company.”
Under existing SEC rules and regulations, we will be required to disclose changes made in our internal control over financial reporting on a quarterly basis and management will be required to assess the effectiveness of our disclosure controls and our internal control over financial reporting annually. However, under the JOBS Act, our independent registered public accounting firm will not be required to attest to the effectiveness of our internal control over financial reporting pursuant to Section 404 of the Sarbanes-Oxley Act until we are no longer an “emerging growth company.”
A failure to maintain effective internal control over financial reporting in accordance with Section 404 of the Sarbanes-Oxley Act could have a material adverse effect on our business and stock prices.
The rules governing the standards that must be met for our management to assess our internal control over financial reporting are complex and require significant documentation, testing and possible remediation, which could significantly increase our operating expenses.
Moreover, if we identify material weaknesses in our internal control over financial reporting in the future, or if we cannot comply with the requirements of the Sarbanes-Oxley Act in a timely manner or attest that our internal control over financial reporting is effective, we may not be able to report our financial results accurately and timely. In such an event, investors and clients could lose confidence in the accuracy and completeness of our financial reports; our liquidity, access to capital markets, and perceptions of our creditworthiness could be adversely affected; and the market prices of our common stock could decline. In addition, we could become subject to investigations by the stock exchange on which our securities are listed, the SEC, the Federal Reserve or the FDIC, or other regulatory authorities, which could require additional financial and management resources. These events could have a material adverse effect on our business, financial condition, results of operations and prospects.
We may also encounter problems or delays in implementing any changes necessary to make a favorable assessment of our internal control over financial reporting or in completing the implementation of any requested improvements that may be needed for this purpose. If we cannot favorably assess the effectiveness of our internal control over financial reporting, investors could lose confidence in our financial information which could adversely affect the market prices of our common stock.
An investment in our common stock is not an insured deposit and is not guaranteed by the FDIC, so you could lose some or all of your investment.
An investment in our common stock is not a bank deposit and, therefore, is not insured against loss or guaranteed by the FDIC, any other deposit insurance fund or by any other public or private entity. An investment in our common stock is inherently risky for the reasons described herein. As a result, if you acquire our common stock, you could lose some or all of your investment.
Other risks and uncertainties.
Additional risks that we currently do not know about or that we currently believe to be immaterial may also impair our business, financial condition, operating results and future prospects.
27
Table of Contents
CAUTIONARY NOTE REGARDING FORWARD-LOOKING STATEMENTS
This prospectus, including in the sections entitled “Prospectus Summary,” “Risk Factors,” “Use of Proceeds,” “Management’s Discussion and Analysis of Financial Condition and Results of Operations,” and “Business,” contains estimates and forward-looking statements. Our estimates and forward-looking statements are based on our current assumptions and expectations about future events and trends, which affect or may affect our business, strategy, operations or financial performance. Although we believe that these estimates and forward-looking statements are based upon reasonable assumptions, they are subject to numerous known and unknown risks and uncertainties and are made in light of information currently available to us. Many important factors, in addition to the factors described in this prospectus, may materially and adversely affect the results of our operations that are described in the forward-looking statements. You should read this prospectus and the documents that we have filed as exhibits to the registration statement of which this prospectus is a part completely and with the understanding that our actual future results may be materially different and worse from what we expect.
All statements in this prospectus other than statements of historical fact are forward-looking statements. The words “believe,” “may,” “might,” “could,” “will,” “aim,” “estimate,” “continue,” “anticipate,” “intend,” “expect,” “plan” and similar words are intended to identify estimates and forward-looking statements.
Our estimates and forward-looking statements may be affected by one or more of the following factors:
| • | business and economic conditions generally, and in the financial services industry, both nationally and within our local market area, principally Southern California; |
| • | liquidity, credit and interest rate risks associated with our business; |
| • | geographic concentration of our business operations and clients; |
| • | changes in real estate values; |
| • | our ability to execute our strategy; |
| • | our ability to identify potential candidates for, and consummate acquisitions of other financial institutions or financial service businesses; |
| • | our ability to cross-sell our services between our banking business and our investment advisory and wealth management business; |
| • | increased competition in the financial services industry, nationally or locally; |
| • | changes in the regulatory environment, including changes in existing banking laws or regulations, accounting regulations or standards, and federal tax law or policy; |
| • | additional or changes in government intervention in the U.S. financial system; |
| • | changes in the scope and cost of FDIC insurance and other coverage; |
| • | unexpected loss of key management personnel, relationship managers or private bankers; |
| • | natural and man-made disasters, acts of terrorism, an outbreak of hostilities, and other matters beyond our control; |
| • | cyber-crime and theft of our clients’ personal and financial data; |
| • | data processing system failures and errors; and |
| • | other factors that are discussed in the section entitled “Risk Factors,” beginning on page 12 of this prospectus. |
Other sections of this prospectus include additional factors that could adversely impact our business, strategy, operations, or financial performance. Moreover, we operate in an evolving environment. New risk factors and uncertainties emerge from time to time and it is not possible for us to predict all risk
28
Table of Contents
factors and uncertainties, nor can we assess the impact of all factors on our business or the extent to which any factor, or combination of factors, may cause actual results to differ materially from those contained in any forward-looking statements. We qualify all of our forward-looking statements by these cautionary statements.
Estimates and forward-looking statements speak only as of the date they were made, and, except to the extent required by law, we undertake no obligation to update or to review any estimate and/or forward-looking statement because of new information, future events or other factors. You should, however, review the factors and risks we describe in the reports we will file from to time to time with the SEC, after the date of this prospectus. See “Where You Can Find Additional Information.” Estimates and forward-looking statements involve risks and uncertainties and are not guarantees of future performance. As a result of the risks and uncertainties described above, the results and outcomes set forth in the forward-looking statements discussed in this prospectus might not occur and our future results and our performance may differ materially from those expressed in these forward-looking statements due to, but not limited to, the factors mentioned above. Because of these uncertainties, you should not place undue reliance on these forward-looking statements when making an investment decision.
29
Table of Contents
We estimate that our net proceeds from the sale of 2,222,222 shares of our common stock in this offering will be approximately $46.1 million, or $53.1 million if the underwriters fully exercise their overallotment option to purchase additional shares, assuming an initial public offering price of $22.50 per share, which is the midpoint of the range set forth on the cover page of this prospectus, and after deducting the underwriting discount and estimated offering expenses payable by us.
We currently anticipate that we will use a portion of the net proceeds received by us to:
| • | repay the full amount of the indebtedness outstanding under our term loan described below, the aggregate principal amount of which was $21.9 million at March 31, 2014; and |
| • | support our organic growth, including the addition of new wealth management offices; |
| • | fund possible acquisitions that we believe are complementary to our business and provide attractive risk-adjusted returns, although we do not have any immediate plans, arrangements or understandings relating to any material acquisition; |
| • | for other general corporate purposes, which purposes may include hiring of additional personnel and the payment of costs of operating as a public company. |
In April 2013, we obtained a five year term loan in the amount of $7.5 million from an unaffiliated bank lender. In March 2014, we obtained a $15 million increase in the amount of that loan, bringing the total principal amount of that loan outstanding to approximately $21.9 million. We have used $17.5 million of the proceeds of the loan to make capital contributions to FFB, to fund the continued growth of our banking business. The principal amount of the loan bears interest at a rate of 90 day Libor plus 4.0% per annum. We intend to use $21.5 million of the net proceeds of this offering to repay that loan in full. See “Management’s Discussion and Analysis of Financial Condition and Results of Operations—Financial Condition—Term Loan” for additional information about this term loan.
Our expected use of the net proceeds from this offering is based upon our present plans and business condition. As of the date of this prospectus, we cannot predict with certainty all of the particular uses for the net proceeds to be received upon the completion of this offering or the amounts that we will actually spend on the uses set forth above. The amounts and timing of our actual use of proceeds will vary depending on numerous factors, including the factors described under the heading “Risk Factors” beginning on page 12 of this prospectus. As a result, management will retain broad discretion over the allocation of the net proceeds from this offering, and investors will be relying on the judgment of our management regarding the application of the net proceeds.
30
Table of Contents
We have not previously paid cash dividends on our common stock. It is our current intention to invest our cash flow and earnings in the growth of our businesses and, therefore, we have no plans to pay cash dividends for the foreseeable future. Investors should not purchase our common stock with the expectation of receiving cash dividends.
Additionally, our ability to pay dividends to our shareholders is subject to the restrictions set forth in the California General Corporation Law, or CGCL. The CGCL provides that a corporation may pay a dividend to its shareholders if the amount of the corporation’s retained earnings immediately prior to the dividend, equals or exceeds the amount of the proposed dividend plus, if the corporation has shares of preferred stock outstanding, the amount of the unpaid accumulated dividends on those preferred shares. The CGCL further provides that, in the event that sufficient retained earnings are not available for the proposed dividend, a corporation may nevertheless pay a dividend to its shareholders if, immediately after the dividend, the value of its assets would equal or exceed the sum of its total liabilities plus, if the corporation has shares of preferred stock outstanding, the amount of the unpaid accumulated dividends on those preferred shares. In addition, since we are a bank holding company subject to regulation by the FRB, it may become necessary for us to obtain the approval of the FRB before we can pay cash dividends to our shareholders. As a bank holding company, we are required to be a source of financial strength for our bank subsidiary and, therefore, we will not be permitted to pay dividends if, in the view of the FRB, doing so would weaken our financial condition or capital resources or would otherwise be prohibited pursuant to a regulatory order.
Cash dividends from our two wholly-owned subsidiaries, First Foundation Bank and First Foundation Advisors, represent the principal source of funds available to us, which we might use to pay cash dividends to our shareholders or for other corporate purposes. Since FFA is a California corporation, the same dividend payment restrictions, described above, that apply to us under the CGCL also apply to FFA. In addition the laws of the State of California, as they pertain to the payment of cash dividends by California state chartered banks, limit the amount of funds that FFB would be permitted to dividend to us more strictly than does the CGCL and, depending on the amount of dividend, may require prior approval of the DBO. In particular, under California law, cash dividends by a California state chartered bank may not exceed, in any calendar year, the lesser of (i) the sum of the bank’s net income for its last three fiscal years (after deducting all dividends or other distributions paid during the period), or (ii) the amount of its retained earnings.
Additionally, because FFB is considered a de novo institution under FDIC guidelines until September 2014, we are required to obtain prior approval from the FDIC before FFB may pay any dividends. Also, because the payment of cash dividends has the effect of reducing capital, capital requirements imposed on FFB by the DBO and the FDIC may operate, as a practical matter, to preclude the payment, or limit the amount, of cash dividends that might otherwise be permitted to be made under California law, and the DBO and the FDIC, as part of their supervisory powers, generally require insured banks to adopt dividend policies which limit the payment of cash dividends much more strictly than do applicable state laws.
Furthermore, the loan agreement governing our term loan requires us to obtain the prior approval of the lender for the payment by us of any dividends to our shareholders. However, we intend to repay the full amount of the indebtedness outstanding under the term loan with a portion of the net proceeds from this offering. See the section entitled “Use of Proceeds” for additional information.
31
Table of Contents
The following table sets forth our capitalization, including regulatory capital ratios, as of March 31, 2014:
| • | on an actual basis; and |
| • | on an “as adjusted” basis after giving pro forma effect to the sale of 2,222,222 shares of common stock in this offering assuming an initial public offering price of $22.50 per share, which is the midpoint of the price range set forth on the cover page of this prospectus, and after deducting the underwriting discount and estimated offering expenses payable by us. |
The “as adjusted” information below is illustrative only and our capitalization following the closing of this offering will be adjusted based on the actual initial public offering price and other terms of this offering determined at pricing. You should read this table in conjunction with “Selected Historical Consolidated Financial Information,” “Use of Proceeds,” “Management’s Discussion and Analysis of Financial Condition and Results of Operations” and our consolidated financial statements and the related notes included elsewhere in this prospectus.
| As of March 31, 2014 | ||||||||
| (In thousands, except share and per share data) | Actual | As Adjusted for the Offering |
||||||
| Capitalization: |
||||||||
| Debt, net of current portion |
$ | 19,489 | $ | - | ||||
|
|
|
|
|
|||||
| Shareholders’ equity: |
||||||||
| Preferred stock, par value $0.001 per share, 5,000,000 shares authorized, none issued or outstanding |
- | - | ||||||
| Common stock, par value $0.001; 20,000,000 shares authorized; 7,733,514 shares (actual) and 9,955,736 shares (as adjusted) issued and outstanding(1) |
8 | 10 | ||||||
| Additional paid-in-capital |
76,480 | 122,565 | ||||||
| Retained earnings |
13,452 | 13,452 | ||||||
| Accumulated other comprehensive (loss) |
(1,099 | ) | (1,099 | ) | ||||
|
|
|
|
|
|||||
| Total shareholders’ equity |
88,841 | 134,928 | ||||||
|
|
|
|
|
|||||
| Total capitalization |
$ | 108,330 | $ | 134,928 | ||||
|
|
|
|
|
|||||
| Book Value Per Share(2) |
$ | 11.49 | $ | 13.55 | ||||
| Capital Ratios:(3) |
||||||||
| Tangible common equity to tangible assets(4) |
8.13 | % | 12.08 | % | ||||
| Tier 1 leverage ratio |
8.22 | % | 12.30 | % | ||||
| Tier 1 risk-based capital ratio(5) |
12.40 | % | 18.98 | % | ||||
| Total risk-based capital ratio(5) |
13.65 | % | 20.23 | % | ||||
| (1) | The number of as adjusted shares of common stock issued and outstanding assumes the issuance of 2,222,222 shares of our common stock upon the consummation of this offering. The actual and as adjusted numbers of shares of issued and outstanding common stock exclude: |
| • | 1,497,092 shares of common stock are issuable upon exercise of outstanding options to purchase shares of common stock under the Stock Incentive Plans as of March 31, 2014, at a weighted average exercise price of $12.62 per share (of which options to acquire 1,263,789 shares of our common stock were vested as of March 31, 2014); |
| • | 296,345 shares of our common stock reserved for issuance under the Stock Incentive Plans; and |
32
Table of Contents
| • | up to an additional 270,000 shares of our common stock which may become issuable to the former shareholders of DCB. The number of these shares that will become issuable is dependent on the performance, over the two year period ending August 15, 2014, of certain assets we acquired as part of our acquisition of DCB in August 2012. Based on the performance of those assets through March 31, 2014, we believed, as of that date, that it was unlikely that any of these shares would become issuable. However, since the final determination will be based on the performance of those assets through August 15, 2014, some of these shares may ultimately become issuable to the former shareholders of DCB. |
| (2) | Book value per share as of March 31, 2014 equals our total shareholders’ equity as of that date divided by the 7,733,514 shares of our common stock that were outstanding on that date. The as-adjusted book value per share as of March 31, 2014 equals our as-adjusted shareholders’ equity as of that date divided by the 9,955,736 shares of our common stock assumed to be outstanding after this offering. |
| (3) | We expect that an aggregate of $24.6 million of the net proceeds from the sale of our common stock in this offering will remain after the anticipated repayment of $21.5 million principal amount of our term loan and those remaining net proceeds are presumed, for purposes of this table, to be invested in securities which carry no risk weighting for purposes of all adjusted risk-based capital ratios. If the underwriters exercise their overallotment option in full, the net proceeds of this offering expected to be remaining after such anticipated repayment of the term loan would be $31.6 million, in which event our tangible common equity to tangible assets ratio, our Tier 1 leverage ratio, our Tier 1 capital to risk-weighted assets and our total capital to risk-weighted assets, would be 12.63%, 12.86%, 19.98% and 21.23%, respectively. |
| (4) | Tangible common equity (also referred to as tangible book value) and tangible assets, are equal to common equity and assets, respectively, less $0.2 million of intangible assets as of March 31, 2014. |
| (5) | We calculated our risk-weighted assets using the standardized method of the Basel II Framework, as implemented by the Federal Reserve Board and the FDIC. |
33
Table of Contents
If you invest in our common stock in this offering, your ownership interest will be diluted to the extent of the difference between the initial public offering price per share of our common stock and the as-adjusted net tangible book value per share of our common stock upon completion of this offering. Historical net tangible book value per share is determined by dividing our total shareholders’ equity, less our intangible assets of $0.2 million as of March 31, 2014, by the number of our outstanding shares of common stock. Our net tangible book value at March 31, 2014 was $88.6 million, or $11.46 per share of our common stock.
Assuming an initial public offering price of $22.50 per share (which is the midpoint of the range set forth on the cover page of this prospectus), and after deducting the underwriting discount and estimated offering expenses payable by us, our as-adjusted net tangible book value as of March 31, 2014 would have been $134.7 million, or $13.53 per share of our common stock. This represents an immediate increase in net tangible book value of $2.07 per share to our existing shareholders, and an immediate dilution of $8.97 per share to investors purchasing shares in this offering, or approximately 39.9% of the midpoint of the range set forth on the cover page.
The following table illustrates the calculation of the amount of dilution per share that a purchaser of our common stock in this offering will incur:
| As to Existing Shareholders |
As to Investors in this Offering |
|||||||
| Assumed initial public offering price per share |
$ | 22.50 | ||||||
| Historical net tangible book value per share as of March 31, 2014 |
$ | 11.46 | ||||||
| Increase in net tangible book value per share attributable to investors purchasing shares in this offering |
$ | 2.07 | ||||||
| As adjusted net tangible book value per share after giving effect to this offering | $ | 13.53 | $ | 13.53 | ||||
| Dilution per share to investors purchasing shares of common stock in this offering | $ | 8.97 | ||||||
The following table summarizes as of March 31, 2014, on an as-adjusted basis, the number of shares of common stock purchased from us, the total consideration paid to us and the average price per share paid by our existing shareholders and by investors purchasing shares in this offering, respectively, based upon the initial public offering price of $22.50. per share and before deducting estimated underwriting discounts and offering expenses payable by us.
| (dollars in thousands except per share amounts) |
Shares | Consideration Paid | Price Per Share | |||||||||||||||||
| Number | Percent | Amount | Percent | |||||||||||||||||
| Existing shareholders |
7,733,514 | 77.7 | % | $ | 59,466 | 54.3 | % | $ | 7.69 | |||||||||||
| New investors |
2,222,222 | 22.3 | % | 50,000 | 45.7 | % | $ | 22.50 | ||||||||||||
|
|
|
|
|
|||||||||||||||||
| Total |
9,955,736 | $ | 109,466 | |||||||||||||||||
|
|
|
|
|
|||||||||||||||||
Except as otherwise indicated, the discussion and tables above:
(1) Assumes no exercise of the underwriters’ overallotment option. If the underwriters exercise their overallotment option in full, the number of shares of common stock held by existing shareholders will be reduced to 75.2% of the total number of shares of common stock to be outstanding upon consummation of this offering, and the number of shares of common stock held by new investors purchasing shares in this offering will be increased to 2,555,555 shares or 24.8% of the total number of shares of common stock to be outstanding upon consummation of this offering.
34
Table of Contents
(2) Do not take into account:
| • | 1,497,092 shares of common stock are issuable upon exercise of outstanding options to purchase shares of common stock under the Stock Incentive Plans as of March 31, 2014, at a weighted average exercise price of $12.62 per share (of which options to acquire 1,263,789 shares of our common stock were vested as of March 31, 2014); |
| • | 296,345 shares of our common stock reserved for issuance under the Stock Incentive Plans; and |
| • | up to an additional 270,000 shares of our common stock which may become issuable to the former shareholders of DCB. The number of these shares that will become issuable is dependent on the performance, over the two year period ending August 15, 2014, of certain assets we acquired as part of our acquisition of DCB in August 2012. Based on the performance of those assets through March 31, 2014, we believed, as of that date, that it was unlikely that any of these shares would become issuable. However, since the final determination will be based on the performance of those assets through August 15, 2014, some of these shares may ultimately become issuable to the former shareholders of DCB. |
35
Table of Contents
Overview
We are a California based financial services company that provides a comprehensive platform of personalized financial services to high net-worth individuals (that is, individuals with a net worth greater than $1.0 million, exclusive of their primary residence) and their families, family businesses and other affiliated organizations. Our integrated platform provides investment management, wealth planning, consulting, trust and banking products and services to effectively and efficiently meet the financial needs of our clients. We have also established a lending platform that offers loans to individuals and entities that own and operate multifamily residential and commercial real estate properties. In addition, we provide business banking products and services to small to moderate-sized businesses and professional firms, and consumer banking products and services to individuals and families who would not be considered high net-worth. As of March 31, 2014, we had $2.80 billion of AUM, $1.09 billion of total assets, $949 million of loans and $855 million of deposits. Our investment management, wealth planning, consulting, and trust services provide us with substantial, fee-based, recurring revenues, such that in 2013, our noninterest income was 36% of our total revenues.
Our strategy is focused on expanding our strong and stable client relationships by delivering high quality, coordinated investment management, wealth planning, consulting, trust and banking products and services. We are able to maintain a client-focused approach by recruiting and retaining experienced and qualified staff, including highly qualified relationship managers, private bankers and financial planners.
We intend to continue to grow our business by (i) cross-selling our services among our wealth management and banking clients; (ii) obtaining new client referrals from existing clients, attorney and accountant referral sources and through referral agreements with asset custodial firms; (iii) marketing our services directly to prospective new clients; (iv) adding experienced relationship managers and private bankers who may have established client relationships that we can serve; (v) establishing de novo wealth management offices in select markets, both within and outside our existing market areas; and (vi) making opportunistic acquisitions of complementary businesses.
As a bank holding company, we are subject to regulation and examination by the FRB and the Federal Reserve Bank of San Francisco (or the FRBSF) under delegated authority from the FRB. As an FDIC-insured, California state chartered bank, FFB is subject to regulation and examination by the FDIC and the DBO. FFB also is a member of the Federal Home Loan Bank of San Francisco (or “FHLB”), which provides it with a source of funds in the form of short-term and long-term borrowings. FFA is a registered investment adviser under the Investment Advisers Act and is subject to regulation by the SEC under that Act.
Our History and Growth
We commenced our operations in 1990 as a fee-based investment advisory company, with the philosophy of providing personalized investment advisory services primarily to high net-worth individuals and their families to assist them in meeting their financial goals. From 1990 to 2007, we grew our client base and added relationship managers and supporting staff. We also entered into referral agreements with asset custodial firms from which we derived a significant portion of our new clients. As a result of this growth, our assets under management exceeded $1.2 billion and we had total staff of 23 as of June 30, 2007.
In 2005 and 2006, we experienced increased competition from other companies offering a more comprehensive platform of services to their clients, including banking, investment advisory and wealth planning services. In response to this competition, we considered various strategic options, including selling our business to a larger financial institution, expanding our services or continuing on with our then-current limited offerings. In late 2006, we decided to establish an insured bank to expand the financial services we could provide to our clients to include trust and banking services, and to attract private banking clients to whom we could cross-sell our investment advisory and wealth planning services.
36
Table of Contents
As a result of our decision to establish an insured bank, beginning in late 2006 and into 2007, we retained experienced banking executives to prepare an application. In March 2007, we filed the application, together with a business plan, with the U.S. Office of Thrift Supervision (or the OTS) for approval to establish a federal savings bank insured by the FDIC under the name First Foundation Bank. In September 2007, FFB was granted an insured federal savings bank charter and commenced its banking operations in October 2007. During the fourth quarter of 2007, we moved our corporate operations to our existing location and opened our first wealth management office in Irvine, California. We refer to each of our offices as a wealth management office since we offer a full suite of financial and investment advisory services at all locations.
In early 2008, we expanded our wealth planning and consulting offerings to include foundation administration and consulting services and family consulting services. While the trust and banking operations began to grow in 2008 and 2009, all of our operations were negatively impacted by the economic recession which began in 2008. As a result of the recession, FFB focused its lending efforts on lower risk and lower yielding products, such as multifamily lending. Our AUM at FFA decreased by over 20% between September 2007 and March 2009, resulting in decreased revenues. However, we believe that because of our strong capital position and our conservative approach to underwriting our loans, FFB did not experience the significant difficulties that most other banks faced, and we were allowed to continue to grow our business in line with our business plan. During this time, we took advantage of the opportunities to hire highly qualified relationship managers, private bankers and investment professionals that existed as a result of the turmoil being experienced by many of our competitors. As of December 31, 2009, we had $1.29 billion of AUM, $201 million of loans, $182 million of deposits, $239 million of total assets and our staff totaled 66.
From 2010 through 2012, we continued to focus on expanding our client base. Over this period, we opened new wealth management offices in Pasadena and San Diego and a small branch office in La Quinta, California. In 2011, the OTS was dissolved and the FRB and the Office of the Comptroller of the Currency became the primary regulators of FFI and FFB, respectively. Effective June 28, 2012, we converted FFB from a federal savings bank to a California state chartered bank, and converted FFI to a bank holding company. On August 15, 2012 we acquired DCB, a California state-chartered commercial bank, based in Palm Desert, California, and merged DCB into FFB. As a result of that acquisition, we increased our total assets by $140 million, our loans by $90 million, and our deposits by $127 million, and we acquired our two wealth management offices in Palm Desert and in El Centro. Our small branch office in La Quinta was merged into the Palm Desert office. Subsequent to the acquisition of DCB in 2012, and during 2013, we opened new wealth management offices in West Los Angeles and in Las Vegas, Nevada, and completed the integration of DCB into our operations. Currently, we conduct our business from our corporate offices located in Irvine, California, and from seven wealth management offices, six of which are located in Southern California and one of which is located in Las Vegas, Nevada. As of March 31, 2014, we had $2.80 billion of AUM, $949 million of loans, $855 million of deposits and $1.09 billion of total assets and our staff totaled 194.
We believe that as a result of our client-focused approach, and our ability to offer a comprehensive platform of personalized financial services to our clients, we have been able to retain existing clients and attract new clients. This has resulted in significant growth during the four year period that ended December 31, 2013, which is demonstrated by the following financial metrics:
| • | AUM increased at a compound annual growth rate of 19.2%; |
| • | Loans increased at a compound annual growth rate of 45.6%; |
| • | Deposits increased at a compound annual growth rate of 44.9%; |
| • | Total assets increased at a compound annual growth rate of 44.4%; |
| • | Trust AUM increased at a compound annual growth rate of 43.0%; and |
| • | Total revenues increased at a compound annual growth rate of 38.9%. |
37
Table of Contents
To achieve this growth, we have raised additional capital to support the growth of FFB and made significant investments in our staff. The number of relationship managers and private bankers has increased from 18 at December 31, 2009 to 38 at March 31, 2014. As it typically takes two to three years to break even on the investment in a relationship manager or private banker, we are in a position to benefit from these investments in the coming years as the revenues generated from these relationship managers and private bankers begin to exceed the related costs. However, these investments in relationship managers and private bankers have, and over the next few years, will continue to result in higher costs in relation to our revenues.
Our Competitive Strengths
We believe that we are well-positioned to create additional value for our shareholders, particularly as a result of our competitive strengths, which include:
Breadth of our Services. As a result of our ability to provide investment management, wealth planning, and consulting services, in addition to traditional banking services, we believe that we offer a more comprehensive range of financial services than do most banks of comparable size in our market areas. Additionally, we believe few banks of comparable size in our market provide trust services, which can provide us with a competitive advantage over those banks, as well as a source of additional fee income.
Executive Management Team with Demonstrated Ability to Grow. Our executive management team, which has been together since 2007, has proven its ability to effectively lead us and has demonstrated an ability to grow our operations, as evidenced by the over 40% compound annual growth rate in loans, deposits and total assets from December 31, 2009 to December 31, 2013, and the 19% compound annual growth rate in AUM from December 31, 2009 to December 31, 2013.
Experienced and Collaborative Wealth Management and Banking Professionals. We believe we have built a strong team of relationship managers and private bankers, who have, on average, 24 years of industry experience. Moreover, our relationship managers and private bankers work collaboratively to coordinate the investment management, wealth planning, consulting, trust and banking services that we provide to our clients and have developed considerable experience in cross-selling our services.
Commitment to High Quality and Personalized Services. We believe that our growth is largely attributable to our commitment and success in providing high quality, coordinated and personalized financial services to our clients. Our client-focused culture has resulted in the majority of our new clients coming to us from referrals from existing clients, centers of influence, including attorneys and accountants, and from unaffiliated asset custodial firms with which we have entered into non-exclusive referral arrangements. Our team oriented approach provides our clients with multiple points of contact and resources to address their various financial needs. Our fee-based investment management services allow us to make unbiased decisions regarding our clients’ investments, as we are not motivated by higher fees in our selection of investment alternatives, and our fee structure does not reward us for making higher risk investments that may adversely impact our clients during a downturn in the markets.
Stable and Scalable Platform. We have built a scalable corporate and administrative infrastructure, and have made significant investments in technology for our banking and investment management processes. In addition to our relationship managers and private bankers, we have in place highly qualified executives, senior managers, and investment professionals who we believe are capable of supporting our continued growth. The nature of our business requires significant investments in operational and administrative functions. By growing our interest-earning assets and AUM, we are able to spread this fixed cost over a larger revenue base. To achieve increased profitability, we believe that it is essential for us to build our operations to a level that allows us to provide our investment management, wealth planning, consulting, trust and banking products and services in a cost effective manner.
38
Table of Contents
Strong Credit Culture. We have implemented policies and procedures for credit underwriting and administration which have enabled us to maintain strong asset quality and at the same time grow our banking business, despite the continuing economic uncertainties and the sluggishness of the economic recovery in the United States. Our ratio of NPAs to total assets was 0.55% at March 31, 2014 and the ratio of net loan charge-offs-to average loans outstanding has averaged 0.07% for the three year period ended December 31, 2013.
Successful Multifamily and Commercial Real Estate Lending Platform. We have created a multifamily and commercial real estate lending platform that has resulted in the origination of over $700 million of loans since the beginning of 2009. We believe that this platform has enabled us to add interest-earning assets with minimal adverse credit results. Since FFB commenced its operations in 2007, we have not experienced any chargeoffs on loans that were originated through this platform and secured by multifamily and commercial real estate properties. As of March 31, 2014, multifamily and commercial real estate loans originated on this platform represented 56.9% of our total loans outstanding.
Located in Strategic Markets. Our wealth management offices are located in areas that either have a high concentration of high net-worth households or are in areas where we believe the competition from other companies that provide a comprehensive platform of financial services to high net-worth individuals is limited. In addition, our wealth management office in Las Vegas offers Nevada trust powers which can offer significant benefits to high net-worth individuals and their families. These benefits include the availability of asset protection trusts in Nevada and the absence of state income taxes in Nevada.
Retention of Clients. We believe that because of our client-focused culture, we have experienced a high level of retention of our clients. As an example, during the five year period ending December 31, 2013, the weighted average amount of AUM withdrawn as a result of client terminations as a percentage of the beginning of year AUM balance was less than 5%.
Diverse Revenue Base. We have a diverse revenue base as a result of our comprehensive platform of services. For 2013 our total revenue was comprised of net interest income (64%), investment management fees (28%), trust fees (3%), deposit and other banking fees (3%) and consulting fees (2%).
Strong Deposit Base. An important driver of our financial performance has been, and we believe will continue to be, the growth and stability of our deposit base, which we use to fund our loans and other interest-earning assets. In addition to the increase in the amount of our deposits, which have grown at a compound annual rate of 44.9% from December 31, 2009 to December 31, 2013, we have been able to increase the proportion of more stable demand deposits, which represented 53% of our total deposits at March 31, 2014, as compared to 12% at December 31, 2009.
Our Strategy
Grow Our Business Organically. In growing our business organically we intend to focus on adding experienced, high quality relationship managers and private bankers at both our existing wealth management offices and at new wealth management offices we may open in selected market areas, both within and outside of California, with demographics similar to those in our existing markets. Because a significant portion of our new business comes from referral sources, we plan to continue to work to obtain referrals from our clients, from centers of influence, including accountants and attorneys, and from loan brokers, and we will maintain referral agreements with unaffiliated asset custodial firms. We intend to continue our practice of establishing and maintaining advisory boards in each of our markets to provide client referrals.
Continue Cross-Selling our Services and Expand the Services We Offer Our Clients. We intend to continue to cross-sell our investment management, wealth planning, consulting, trust and banking products and services to our existing and future clients. Our compensation structures encourage a team approach to client
39
Table of Contents
service and reward relationship managers and private bankers for facilitating the cross selling of services to clients. We believe that our service-oriented culture and high quality client service will continue to enable us to strengthen and expand our client relationships and will foster continued growth in the services and products we offer them and, thereby, enabling us to increase and diversify our sources of revenues.
Grow our Business through Acquisitions. We intend to make opportunistic acquisitions that we believe will enable us to grow our franchise geographically. While we believe that banks provide the most likely opportunities for acquisition, we will also consider acquisitions of investment management firms and insurance brokerage firms. We believe that our experience with previous transactions makes us qualified to acquire other institutions and integrate their operations into our platform. In addition to providing us increased interest-earning assets and deposits, bank acquisitions would allow us to cross sell our investment management, wealth planning, consulting and trust services to clients acquired in the acquisition as well as new clients situated in the related geographic area. Although we do not have any immediate plans, arrangements or understandings related to any material acquisitions, we believe that the completion of this offering will further enhance our ability to compete for acquisition opportunities by providing available equity to invest and enabling us to offer publicly-traded shares of our common stock to the shareholders of prospective acquisition candidates.
Provide High Quality Client Services. We believe that stable long-term growth and profitability are the result of building strong client relationships, one at a time, and providing high quality, coordinated financial services. Our relationship managers and private bankers strive to build long-term relationships with our clients by understanding their financial needs and identifying and delivering appropriate and coordinated financial services to them. We believe that our service-oriented culture and high quality client service differentiates us from many of our competitors.
Attract and Retain High Quality Service Professionals. Having successful and high quality service professionals is critical to driving the development of our business and delivering high quality financial services. We have experienced low turnover in our client service personnel and intend to continue hiring and developing professionals who can establish and maintain long-term customer relationships which are the key to our culture, business and growth. We also believe that our business model, culture and scalable platform enable us to attract and retain high quality relationship managers and private bankers who share our work ethic and our commitment to providing personalized and client-focused financial services.
Our Markets
Because our primary target market is high net-worth individuals and their families, family businesses and other affiliated organizations, we have located our offices in areas we believe offer us the best opportunity to locate and serve this client base. The Los Angeles-Long Beach Core-Based Statistical Area (CBSA), which includes Orange County, has over 250,000 high net-worth households (defined as those with $1.0 million or more of investable assets), making it the largest high net-worth market in the Western United States. As of December 31, 2013, 68% of our AUM was from clients located in the in Los Angeles-Long Beach CBSA. Our wealth management offices are located in or adjacent to four of the top 12 markets in the Western United States as ranked by estimated number of high net-worth households. Listed below are the largest core-based statistical areas by estimated number of high net worth households in the Western United States as of December 31, 2013, according to data obtained from Phoenix Marketing International’s “Global Wealth Monitor”:
40
Table of Contents
| Rank |
Statistical Areas in Western United States(1) |
Estimated Number of High Net-Worth Households |
Wealth Management Office in Area | |||
| 1 |
Los Angeles-Long Beach (CA) | 252,000 | Irvine, Pasadena, West Los Angeles | |||
| 2 |
San Francisco-Oakland (CA) | 128,000 | ||||
| 3 |
Seattle-Tacoma-Bellevue (WA) | 90,000 | ||||
| 4 |
Phoenix-Mesa-Glendale (AZ) | 72,000 | ||||
| 5 |
Riverside (CA) | 70,000 | Palm Desert | |||
| 6 |
San Diego-Carlsbad (CA) | 69,000 | San Diego | |||
| 7 |
Denver-Aurora-Broomfield (CO) | 63,000 | ||||
| 8 |
San Jose-Sunnyvale (CA) | 52,000 | ||||
| 9 |
Sacramento-Arden (CA) | 48,000 | ||||
| 10 |
Portland-Vancouver (OR-WA) | 46,000 | ||||
| 11 |
Las Vegas-Paradise (NV) | 31,000 | Las Vegas | |||
| 12 |
Honolulu (HI) | 25,000 | ||||
| (1) | The Western United States is defined as Alaska, Arizona, California, Colorado, Hawaii, Idaho, Montana, New Mexico, Nevada, Oregon, Utah, Washington and Wyoming. |
In addition to offering our comprehensive platform of personalized financial services primarily to high net-worth individuals and their families, family businesses and other affiliated organizations, we have established a lending platform that offers loans to individuals and entities that own and operate multifamily residential properties and commercial real estate properties. The underlying properties which secure these loans are primarily located in communities throughout California that have a significant population base and are already built out.
The following is a breakdown of the location of our multifamily and commercial real estate loans by county as of December 31, 2013:
| (dollars in thousands) | Amount | % of Total | ||||||
| California Counties: |
||||||||
| Los Angeles |
$ | 325,738 | 58.0% | |||||
| Orange |
51,366 | 9.2% | ||||||
| Riverside |
48,460 | 8.6% | ||||||
| San Diego |
38,163 | 6.8% | ||||||
| San Francisco |
34,781 | 6.2% | ||||||
| Other counties – Northern California |
30,198 | 5.4% | ||||||
| Other counties – Southern California |
18,226 | 3.3% | ||||||
| Nevada – all counties |
2,305 | 0.4% | ||||||
| Other states |
11,935 | 2.1% | ||||||
|
|
|
|
|
|||||
| Total |
$ | 561,172 | 100.0% | |||||
|
|
|
|
|
|||||
Our Business
Through FFA and FFB, we offer a comprehensive platform of personalized financial services to high net-worth individuals and their families, family businesses and other affiliated organizations. Our integrated platform provides investment management, wealth planning, consulting, trust and banking products and services to effectively and efficiently meet the financial needs of our clients. Our broad range of financial product and services are more consistent with those offered by larger financial institutions, while our high level of personalized service, accessibility and responsiveness to our clients are more typical of the services offered by boutique investment management firms and community banks. We believe this combination of an integrated platform of comprehensive financial services and products and personalized and responsive service differentiates us from many of our competitors and has contributed to the growth of our client base and our business.
41
Table of Contents
Overview of our Investment Advisory and Wealth Management Business
FFA is a fee-based investment adviser which provides investment advisory services primarily to high net-worth individuals, their families and their family businesses, and other affiliated organizations. FFA strives to provide its clients with a high level of personalized service by its staff of experienced relationship managers. As of March 31, 2014, FFA had $2.80 billion of AUM as compared to $1.24 billion, $1.00 billion, $1.29 billion, $1.56 billion, $1.83 billion, $2.23 billion and $2.59 billion at December 31, 2007, 2008, 2009, 2010, 2011, 2012 and 2013, respectively. FFA’s operations comprise the investment management, wealth planning and consulting segment of our business.
Overview of Our Banking Business
FFB is engaged in private and commercial banking, offering a broad range of personal and business banking products and services and trust services to its clients. Its private banking services include a variety of deposit products, including personal checking, savings and money market deposits and certificates of deposit, single family real estate loans, and consumer loans. FFB also provides the convenience of online and other personal banking services to its clients. FFB’s business banking products and services include multifamily and commercial real estate loans, commercial term loans and lines of credit, transaction and other deposit accounts, online banking and enhanced business services. FFB has also established a lending platform that offers loans to individuals and entities who own and operate multifamily residential and commercial real estate properties. In addition, we provide business banking products and services to small to moderate-sized businesses and professional firms, and consumer banking products and services to individuals and families who would not be considered high net-worth. At March 31, 2014, FFB had $1.09 billion of total assets, $949 million of loans and $855 million of deposits. FFB’s operations comprise the trust and banking segment of our business.
Relationship Managers and Private Bankers
Our operating strategy has been to build strong and stable long-term client relationships, one at a time, by delivering high quality, coordinated investment management, wealth planning, consulting, trust and banking products and services. The success of this strategy is largely attributable to our experienced and high quality client relationship managers and private bankers. The primary role of our relationship managers and private bankers, in addition to attracting new clients, is to develop and maintain a strong relationship with their clients and to coordinate the services we provide to their clients. We have experienced low turnover in our client service personnel and we believe we can continue to attract and retain experienced and client-focused relationship managers and private bankers. At March 31, 2014, we employed 16 relationship managers and 22 private bankers.
Wealth Management Products and Services
FFA provides fee-based investment advisory services and wealth management and consulting services primarily for high net-worth individuals and their families, family businesses and other affiliated organizations (including public and closely-held corporations, family foundations and private charitable organizations). FFA provides high net-worth clients with personalized services designed to enable them to reach their personal and financial goals by coordinating FFA’s investment advisory and wealth management services with risk management and estate and tax planning services provided by outside service providers, for which FFA does not receive commissions or referral fees. FFA’s clients benefit from certain cost efficiencies available to institutional managers, such as block trading, access to institutionally priced no-load mutual funds, the ability to seek competitive bid/ask pricing for bonds, low transaction costs and investment management fees charged as a percentage of the assets managed, with tiered pricing for larger accounts.
FFA’s investment management team strives to create diversified investment portfolios for its clients that are individually designed, monitored and adjusted based on the discipline of fundamental investment analysis. FFA focuses on creating investment portfolios that are commensurate with a client’s objectives, risk preference and time horizon, using traditional investments such as individual stocks and bonds and mutual funds. FFA also
42
Table of Contents
provides comprehensive and ongoing advice and coordination regarding estate planning, retirement planning, charitable and business ownership issues, and issues faced by executives of publicly-traded companies.
AUM at FFA has grown at a compound annual growth rate of 19.2% over the four year period ending December 31, 2013. Changes in our AUM reflects additions from new clients, the gains or losses recognized from investment results, additional funds received from existing clients, withdrawals of funds by clients, and terminations. During the 3 year period ending December 31, 2013, additions from new clients and net gains from investment results were 71% and 29%, respectively, of the total of additions from new clients and net gains from investment results.
FFA does not provide custodial services for its clients. Instead, client investment accounts are maintained under custodial arrangements with large, well established brokerage firms, either directly or through FFB. However, FFA advises its clients that they are not obligated to use those services and that they are free to select securities brokerage firms and custodial service providers of their own choosing. FFA has entered into referral agreements with certain of the asset custodial firms that provide custodial services to our clients. Under these arrangements, the asset custodial firms provide referrals of prospective new clients whose increase in wealth warrants a more personalized and expansive breath of financial services that we are able to provide in exchange for a fee. This fee is either a percentage of the fees we charge to the client or a percentage of the AUM of the client. The asset custodial firms are entitled to continue to receive these fees for as long as we continue to provide services to the referral client. These referral agreements do not require the client to maintain their assets at the custodial firm and are fully disclosed to the client prior to our providing services to them.
FFA also provides wealth management services, consisting of financial, investment and economic advisory and related services, to high-net-worth individuals and their families, family businesses, and other affiliated organizations (including public and closely-held corporations, family foundations and private charitable organizations). Those services include education, instruction and consultation on financial planning and management matters, and Internet-based data processing administrative support services involving the processing and transmission of financial and economic data primarily for charitable organizations.
Banking Products and Services
Through FFB, we offer a wide range of loan products, deposit products, business and personal banking services and trust services. Our loan products are designed to meet the credit needs of our clients in a manner that, at the same time, enables us to effectively manage the credit and interest rate risks inherent in our lending activities. Deposits represent our principal source of funds for making loans and investments and acquiring other interest-earning assets. The yields we realize on our loans and other interest-earning assets and the interest rates we pay to attract and retain deposits are the principal determinants of our banking revenues. See “Management’s Discussion and Analysis of Financial Condition and Results of Operations” elsewhere in this prospectus.
FFB also provides trust services to clients in California and Nevada. Those services, which consist primarily of the management of trust assets, complement the investment and wealth management services that FFA offers to our clients and, as a result, provide us with cross-selling opportunities. Additionally, trust service fees provide an additional source of noninterest income for us. At March 31, 2014, trust AUM totaled $364 million as compared to $173 million, $309 million and $341 million at December 31, 2011, 2012 and 2013, respectively.
Our lending activities serve the credit needs of high net-worth individuals and their businesses, owners of multifamily and commercial real estate properties, individuals and families who would not be considered high net-worth, small to moderate size businesses and professional firms in our market areas. As a result we offer a variety of loan products consisting of multifamily and single family residential real estate loans, commercial real estate loans, commercial term loans and lines of credit, and consumer loans. We handle all loan processing, underwriting and servicing at our administrative office in Irvine, California.
43
Table of Contents
The following table sets forth information regarding the types of loans that we make, by amounts and as a percentage of our total loans outstanding at:
| March 31, 2014 | December 31, 2013 | |||||||||||||||
| (dollars in thousands) | Balance | % of Total | Balance | % of Total | ||||||||||||
| Outstanding principal balance: |
||||||||||||||||
| Loans secured by real estate: |
||||||||||||||||
| Residential properties: |
||||||||||||||||
| Multifamily |
$ | 401,877 | 42.4% | $ | 405,984 | 44.9% | ||||||||||
| Single family |
263,922 | 27.9% | 227,096 | 25.2% | ||||||||||||
|
|
|
|
|
|
|
|
|
|||||||||
| Total loans secured by residential properties |
665,799 | 70.3% | 633,080 | 70.1% | ||||||||||||
| Commercial properties |
166,290 | 17.5% | 154,982 | 17.2% | ||||||||||||
| Land |
2,345 | 0.2% | 3,794 | 0.4% | ||||||||||||
|
|
|
|
|
|
|
|
|
|||||||||
| Total real estate loans |
834,434 | 88.0% | 791,856 | 87.7% | ||||||||||||
| Commercial and industrial loans |
97,248 | 10.2% | 93,255 | 10.3% | ||||||||||||
| Consumer loans |
17,201 | 1.8% | 18,484 | 2.0% | ||||||||||||
|
|
|
|
|
|
|
|
|
|||||||||
| Total loans |
$ | 948,883 | 100.0% | $ | 903,595 | 100.0% | ||||||||||
|
|
|
|
|
|
|
|
|
|||||||||
Residential Mortgage Loans – Multi-family: We make multi-family residential mortgage loans for terms up to 30 years primarily for properties located in Southern California. These loans generally are adjustable rate loans with interest rates tied to a variety of independent indexes; although in some cases these loans have fixed interest rates for periods ranging from 3 to 7 years and adjust thereafter based on an applicable index. These loans generally have interest rate floors, payment caps, and prepayment penalties. The loans are underwritten based on a variety of underwriting criteria, including an evaluation of the character and creditworthiness of the borrower and guarantors, loan-to-value and debt service coverage ratios, borrower liquidity and credit history. In addition, we perform stress testing for changes in interest rates, capitalization rates and other factors and review general economic trends such as lease rates, values and absorption rates. We typically require personal guarantees from the owners of the entities to which we make such loans.
Residential Mortgage Loans – Single-family: We offer single family residential mortgage loans primarily as an accommodation to our existing clients. In most cases, these take the form of non-conforming loans and FFB does not sell or securitize any of its single family residential mortgage loan originations. FFB does not originate loans defined as high cost by state or federal banking regulators. The majority of FFB’s single family residential loan originations are collateralized by first mortgages on real properties located in Southern California. These loans are generally adjustable rate loans with fixed terms ranging from 3 to 7 years terms. These loans generally have interest rate floors and payment caps. The loans are underwritten based on a variety of underwriting criteria, including an evaluation of the character and creditworthiness of the borrower and guarantors, loan-to-value and debt to income ratios, borrower liquidity, income verification and credit history. In addition, we perform stress testing for changes in interest rates and other factors and review general economic trends such as market values.
Commercial Real Estate Loans: Our commercial real estate loans are secured by first trust deeds on nonresidential real property. These loans generally are adjustable rate loans with interest rates tied to a variety of independent indexes; although in some cases these loans have fixed interest rates for periods ranging from 3 to 7 years and adjust thereafter based on an applicable index. These loans generally have interest rate floors, payment caps, and prepayment penalties. The loans are underwritten based on a variety of underwriting criteria, including an evaluation of the character and creditworthiness of the borrower and guarantors, loan-to-value and debt service coverage ratios, borrower liquidity and credit history. In addition, we perform stress testing for changes in interest rates, cap rates and other factors and review general economic trends such as lease rates, values and absorption rates. We typically require personal guarantees from the owners of the entities to which we make such loans.
44
Table of Contents
Commercial Loans: We offer commercial term loans and commercial lines of credit to our clients. Commercial loans generally are made to businesses that have demonstrated a history of profitable operations. To qualify for such loans, prospective borrowers generally must have operating cash flow sufficient to meet their obligations as they become due, and good payment histories. Commercial term loans are either fixed rate loans or adjustable rate loans with interest rates tied to a variety of independent indexes and are made for terms ranging from one to five years. Commercial lines of credit are adjustable rate loans with interest rates usually tied to the Wall Street Journal prime rate, are made for terms ranging from one to two years, and contain various covenants, including a requirement that the borrower reduce its credit line borrowings to zero for specified time periods during the term of the line of credit. The loans are underwritten based on a variety of underwriting criteria, including an evaluation of the character and creditworthiness of the borrower and guarantors, debt service coverage ratios, historical and projected client income, borrower liquidity and credit history. In addition, we perform stress testing for changes in interest rates and other factors and review general economic trends in the client’s industry. We typically require personal guarantees from the owners of the entities to which we make such loans.
Consumer Loans: We offer a variety of consumer loans and credit products, including personal installment loans and lines of credit, and home equity lines of credit designed to meet the needs of our clients. Consumer loans are either fixed rate loans or adjustable rate loans with interest rates tied to a variety of independent indexes and are made for terms ranging from one to ten years. The loans are underwritten based on a variety of underwriting criteria, including an evaluation of the character creditworthiness and credit history of the borrower and guarantors, debt to income ratios, borrower liquidity, income verification, and the value of any collateral securing the loan. Consumer loan collections are dependent on the borrower’s ongoing cash flows and financial stability and, as a result, generally pose higher credit risks than the other loans that we make.
For all of our loan offerings, we utilize a comprehensive approach in our underwriting process. This includes the requirement that all factors considered in our underwriting be appropriately documented. In our underwriting, our primary focus is always on the borrower’s ability to repay. However, because our underwriting process allows us to view the totality of the borrower’s capacity to repay, concerns or issues in one area can be compensated for by other favorable financial criteria. This personalized and detailed approach allows us to better understand and meet our clients’ lending needs.
Bank Deposit Products
We offer a wide range of deposit products, including personal and business checking, savings accounts, interest-bearing negotiable order of withdrawal accounts, money market accounts and time certificates of deposit. The following table sets forth information regarding the type of deposits which our clients maintained with us and the average interest rates on those deposits as of:
| March 31, 2014 | December 31, 2013 | |||||||||||||||||||||||
| (dollars in thousands) | Amount | % of Total | Weighted Average Rate |
Amount | % of Total | Weighted Average Rate |
||||||||||||||||||
| Demand deposits: |
||||||||||||||||||||||||
| Noninterest-bearing |
$ | 225,473 | 26.4% | - | $ | 217,782 | 27.1% | - | ||||||||||||||||
| Interest-bearing |
228,587 | 26.8% | 0.497 | % | 217,129 | 27.1% | 0.504 | % | ||||||||||||||||
| Money market and savings |
125,872 | 14.7% | 0.496 | % | 121,260 | 15.1% | 0.499 | % | ||||||||||||||||
| Certificates of deposits |
274,752 | 32.1% | 0.557 | % | 245,866 | 30.7% | 0.606 | % | ||||||||||||||||
|
|
|
|
|
|
|
|
|
|||||||||||||||||
| Total |
$ | 854,684 | 100.0% | 0.385 | % | $ | 802,037 | 100.0% | 0.398 | % | ||||||||||||||
|
|
|
|
|
|
|
|
|
|||||||||||||||||
Insurance Services
Through First Foundation Insurance Services (or FFIS), a wholly owned subsidiary of FFB, we offer life insurance products provided by unaffiliated insurance carriers from whom we collect a brokerage fee.
45
Table of Contents
Competition
The banking and investment and wealth management businesses in California and Las Vegas, Nevada, generally, and in FFI’s market areas, in particular, are highly competitive. A relatively small number of major national and regional banks, operating over wide geographic areas, including Wells Fargo, JP Morgan Chase, US Bank, Comerica, Union Bank and Bank of America, dominate the Southern California banking market. Those banks, or their affiliates, also offer private banking and investment and wealth management services. We also compete with large, well known private banking and wealth management firms, including City National, First Republic, Northern Trust and Boston Private. Those banks and investment and wealth management firms generally have much greater financial and capital resources than we do and as a result of their ability to conduct extensive advertising campaigns and their relatively long histories of operations in Southern California, are generally better known than us. In addition, by virtue of their greater total capitalization, the large banks have substantially higher lending limits than we do, which enables them to make much larger loans and to offer loan products that we are not able to offer to our clients.
We compete with these much larger banks and investment and wealth management firms primarily on the basis of the personal and “one-on-one” service that we provide to our clients, which many of these competitors are unwilling or unable to provide, other than to their wealthiest clients, due to costs involved or their “one size fits all” approaches to providing financial services to their clients. We believe that our principal competitive advantage is our ability to offer our banking, trust, and investment and wealth management services through one integrated platform, enabling us to provide our clients with the efficiencies and benefits of dealing with a cohesive group of professional advisors and banking officers working together to assist our clients to meet their personal investment and financial goals. We believe that only the largest financial institutions in our area provide similar integrated platforms of products and services, which they sometimes reserve for their wealthiest and institutional clients. In addition, while we also compete with many local and regional banks and numerous local and regional investment advisory and wealth management firms, we believe that only a very few of these banks offer investment or wealth management services and that a very few of these investment and wealth management firms offer banking services and, therefore, these competitors are not able to provide such an integrated platform of comprehensive financial services to their clients. This enables us to compete effectively for clients who are dissatisfied with the level of service provided at larger financial institutions, yet are not able to receive an integrated platform of comprehensive financial services from other regional or local financial service organizations.
While we provide our clients with the convenience of technological access services, such as remote deposit capture and internet banking, we compete primarily by providing a high level of personal service associated with our private banking focus. As a result, we do not try to compete exclusively on pricing. However, because we are located in a highly competitive market place and because we are seeking to grow our businesses, we attempt to maintain our pricing in line with our principal competitors.
Employees
As of March 31, 2014, we had a total of 188 full time employees and 6 part time employees. None of our employees are represented by labor unions and we believe that employee relations are good.
Facilities
Our headquarters and administrative offices are located at 18101 Von Karman Avenue, Suite 700, Irvine, California 92612. In addition, we operate seven wealth management offices located, respectively, in Newport Beach, Pasadena, West Los Angeles, Palm Desert, El Centro and San Diego, California and Las Vegas, Nevada. All of these offices are leased pursuant to non-cancelable operating leases that will expire between 2015 and 2020.
46
Table of Contents
Legal Proceedings
In the ordinary course of business, we are subject to claims, counter claims, suits and other litigation of the type that generally arise from the conduct of financial services businesses. We are not aware of any threatened or pending litigation that we expect will have a material adverse effect on our business operations, financial condition or results of operations.
47
Table of Contents
MANAGEMENT’S DISCUSSION AND ANALYSIS OF FINANCIAL CONDITION AND RESULTS OF OPERATIONS
The following discussion and analysis is intended to facilitate the understanding and assessment of significant changes and trends in our results of operations in the quarter ended March 31, 2014 as compared to our results of operations in the quarter ended March 31, 2013; our financial condition at March 31, 2014 as compared to our financial condition at December 31, 2013; our results of operations in the year ended, and our financial condition at, December 31, 2013, as compared to our results of operation in the year ended and our financial condition at December 31, 2012; and our results of operations in the year ended December 31, 2012, as compared to our results of operation in December 31, 2011. This discussion and analysis is based on and should be read in conjunction with our consolidated financial statements and the accompanying notes thereto contained elsewhere in this prospectus. This information is intended to facilitate the understanding and assessment of significant changes and trends related to our results of operations or financial condition. In addition to historical information, this discussion contains forward-looking statements that involve risks, uncertainties and assumptions that could cause results to differ materially from management’s expectations. Some of the factors that could cause results to differ materially from expectations are discussed in the sections entitled “Risk Factors” and “Cautionary Note Regarding Forward-Looking Statements” contained elsewhere in this prospectus.
Critical Accounting Policies
Our consolidated financial statements are prepared in accordance with generally accepted accounting principles in the United States (“GAAP”) and accounting practices in the banking industry. Certain of those accounting policies are considered critical accounting policies, because they require us to make estimates and assumptions regarding circumstances or trends that could materially affect the value of those assets, such as economic conditions or trends that could impact our ability to fully collect our loans or ultimately realize the carrying value of certain of our other assets. Those estimates and assumptions are made based on current information available to us regarding those economic conditions or trends or other circumstances. If changes were to occur in the events, trends or other circumstances on which our estimates or assumptions were based, or other unanticipated events were to occur that might affect our operations, we may be required under GAAP to adjust our earlier estimates and to reduce the carrying values of the affected assets on our balance sheet, generally by means of charges against income, which could also affect our results of operations in the fiscal periods when those charges are recognized.
Utilization and Valuation of Deferred Income Tax Benefits. We record as a “deferred tax asset” on our balance sheet an amount equal to the tax credit and tax loss carryforwards and tax deductions (collectively “tax benefits”) that we believe will be available to us to offset or reduce income taxes in future periods. Under applicable federal and state income tax laws and regulations, tax benefits related to tax loss carryforwards will expire if they cannot be used within specified periods of time. Accordingly, the ability to fully use our deferred tax asset related to tax loss carryforwards to reduce income taxes in the future depends on the amount of taxable income that we generate during those time periods. At least once each year, or more frequently, if warranted, we make estimates of future taxable income that we believe we are likely to generate during those future periods. If we conclude, on the basis of those estimates and the amount of the tax benefits available to us, that it is more likely, than not, that we will be able to fully utilize those tax benefits prior to their expiration, we recognize the deferred tax asset in full on our balance sheet. On the other hand, if we conclude on the basis of those estimates and the amount of the tax benefits available to us that it has become more likely, than not, that we will be unable to utilize those tax benefits in full prior to their expiration, then, we would establish a valuation allowance to reduce the deferred tax asset on our balance sheet to the amount with respect to which we believe it is still more likely, than not, that we will be able to use to offset or reduce taxes in the future. The establishment of such a valuation allowance, or any increase in an existing valuation allowance, would be effectuated through a charge to the provision for income taxes or a reduction in any income tax credit for the period in which such valuation allowance is established or increased.
48
Table of Contents
Allowance for Loan and Lease Losses. Our ALLL is established through a provision for loan losses charged to expense and may be reduced by a recapture of previously established loss reserves, which are also reflected in the statement of income. Loans are charged against the ALLL when management believes that collectability of the principal is unlikely. The ALLL is an amount that management believes will be adequate to absorb estimated losses on existing loans that may become uncollectible based on an evaluation of the collectability of loans and prior loan loss experience. This evaluation also takes into consideration such factors as changes in the nature and volume of the loan portfolio, overall portfolio quality, review of specific problem loans, current economic conditions and certain other subjective factors that may affect the borrower’s ability to pay. While we use the best information available to make this evaluation, future adjustments to our ALLL may be necessary if there are significant changes in economic or other conditions that can affect the collectability in full of loans in our loan portfolio.
Adoption of new or revised accounting standards. We have elected to take advantage of the extended transition period afforded by the JOBS Act, for the implementation of new or revised accounting standards. As a result, we will not be required to comply with new or revised accounting standards that have different effective dates for public and private companies until those standards apply to private companies or we cease to be an “emerging growth” company as defined in the JOBS Act. As a result of this election, our financial statements may not be comparable to the financials statements of companies that comply with public company effective dates.
We have two business segments, “Banking” and “Investment Management, Wealth Planning and Consulting” (“Wealth Management”). Banking includes the operations of FFB and FFIS and Wealth Management includes the operations of FFA. The financial position and operating results of the stand-alone holding company, FFI, are included under the caption “Other” in certain of the tables that follow, along with any consolidation elimination entries.
Recent Developments and Overview
We have continued to grow both our Banking and Wealth Management operations. Comparing the first quarter of 2014 to the first quarter of 2013, we have increased our revenues (net interest income and noninterest income) by 20%. This growth in revenues is the result of the growth in Banking’s total interest-earning assets and the growth in Wealth Management’s AUM. During the first quarter of 2014, total loans and total deposits in Banking increased 5% and 7%, respectively, while the AUM in Wealth Management increased by $203 million or 8% and totaled $2.80 billion as of March 31, 2014. The growth in AUM includes the addition of $158 million of net new accounts and $66 million of gains realized in client accounts during the first quarter of 2014.
The results of operations for Banking reflect the benefits of this growth as income before taxes for Banking increased $0.9 million from $2.8 million in the first quarter of 2013 to $3.7 million in the first quarter of 2014. Because we continue to add new staff and locations as part of our business plan, the increases in our revenues in Wealth Management were partially offset by increases in noninterest expenses. On a consolidated basis, our earnings before taxes increased from $1.7 million in the first quarter of 2013 to $2.5 million in the first quarter of 2014.
In the second quarter of 2013, we entered into a loan agreement to borrow $7.5 million for a term of five years. This note bears interest at a rate of ninety day Libor plus 4.0% per annum. In the first quarter of 2014, we entered into an amendment to this loan agreement pursuant to which we obtained an additional $15,000,000 of borrowings. As a result, as of March 31, 2014, the outstanding principal amount of the loan was $21,875,000. This amendment did not alter any of the terms of the loan agreement or the loan, other than the $15,000,000 increase in the principal amount of the loan and a corresponding increase in the amount of the monthly installments of principal and interest payable on the Loan. The amended loan agreement requires us to make monthly payments of principal of $0.2 million plus interest, with a final payment of the unpaid principal balance, in the amount of approximately $12.1 million, plus accrued but unpaid interest, at the maturity date of the loan in May 2018. We have the right, in our discretion, to prepay the loan at any time in whole or, from time to time, in part, without any penalties or premium. We are required to meet certain financial covenants during the term of
49
Table of Contents
the loan. As security for our repayment of the loan, we pledged all of the common stock of FFB to the lender. See “Financial Condition—Term Loan” below for additional information regarding this loan.
Results of Operations
Quarters Ended March 31, 2014 and 2013.
Our net income for the first quarter of 2014 was $1.5 million, as compared to $1.1 million for first quarter of 2013. Income before taxes was $2.5 million in the first quarter of 2014 as compared to $1.7 million in the first quarter of 2013. The effective tax rate increased to 42.0% in the first quarter of 2014 as compared to 38.0% in the first quarter of 2013 due in part to the elimination of certain credits under California tax laws. The following is a comparison of our income before taxes between the first quarter of 2014 and first quarter of 2013.
The following tables show key operating results for each of our business segments for the quarters ended March 31:
| (dollars in thousands) | Banking | Wealth Management |
Other | Total | ||||||||||||
| 2014: |
||||||||||||||||
| Interest income |
$ | 10,675 | $ | - | $ | - | $ | 10,675 | ||||||||
| Interest expense |
851 | - | 74 | 925 | ||||||||||||
|
|
|
|
|
|
|
|
|
|||||||||
| Net interest income |
9,824 | - | (74) | 9,750 | ||||||||||||
| Provision for loan losses |
235 | - | - | 235 | ||||||||||||
| Noninterest income |
1,042 | 4,625 | (116) | 5,551 | ||||||||||||
| Noninterest expense |
6,942 | 4,842 | 762 | 12,546 | ||||||||||||
|
|
|
|
|
|
|
|
|
|||||||||
| Income (loss) before taxes on income |
$ | 3,689 | $ | (217) | $ | (952) | $ | 2,520 | ||||||||
|
|
|
|
|
|
|
|
|
|||||||||
| 2013: |
||||||||||||||||
| Interest income |
$ | 9,004 | $ | - | $ | - | $ | 9,004 | ||||||||
| Interest expense |
812 | - | - | 812 | ||||||||||||
|
|
|
|
|
|
|
|
|
|||||||||
| Net interest income |
8,192 | - | - | 8,192 | ||||||||||||
| Provision for loan losses |
622 | - | - | 622 | ||||||||||||
| Noninterest income |
819 | 3,816 | (102) | 4,533 | ||||||||||||
| Noninterest expense |
5,612 | 4,325 | 459 | 10,396 | ||||||||||||
|
|
|
|
|
|
|
|
|
|||||||||
| Income (loss) before taxes on income |
$ | 2,777 | $ | (509) | $ | (561) | $ | 1,707 | ||||||||
|
|
|
|
|
|
|
|
|
|||||||||
The primary sources of revenue for Banking are net interest income, fees from its deposits, trust and insurance services, and certain loan fees. The primary sources of revenue for Wealth Management are asset management fees assessed on the balance of AUM and fees charged for consulting and administrative services. Compensation and benefit costs, which represent the largest component of noninterest expense accounted for 65% and 77%, respectively, of the total noninterest expense for Banking and Wealth Management in the first quarter of 2014.
General. Consolidated income before taxes increased $0.8 million in the first quarter of 2014 as compared to the first quarter of 2013 as a result of an increase in income before taxes for Banking and a decrease in loss before taxes for Wealth Management, which were partially offset by increases in corporate expenses. Income before taxes in Banking was $3.7 million in the first quarter of 2014 as compared to $2.8 million in the
50
Table of Contents
first quarter of 2013 as higher net interest income, a lower provision for loan losses and higher noninterest income was partially offset by higher noninterest expenses. As a result of higher noninterest income, which was only partially offset by higher noninterest expenses, the loss before taxes for Wealth Management was $0.3 million lower in the first quarter of 2014 as compared to the first quarter of 2013. Our operating losses in Wealth Management are due in part to our continued investment in new relationship managers which are a key component in growing our revenues. Typically, it takes two to three years to realize enough revenues to cover the costs associated with hiring and retaining a new relationship manager. Corporate expenses were $0.4 million higher in the first quarter of 2014 as compared to the first quarter of 2013 due to interest costs on the term loan entered into in the second quarter of 2013, increased allocations of compensation costs from FFB and increased contributions made under our community support programs.
Net Interest Income. The following tables set forth information regarding (i) the total dollar amount of interest income from interest-earning assets and the resultant average yields on those assets; (ii) the total dollar amount of interest expense and the average rate of interest on our interest-bearing liabilities; (iii) net interest income; (iv) net interest rate spread; and (v) net yield on interest-earning assets for the quarters ended March 31:
| 2014 | 2013 | |||||||||||||||||||||||
| (dollars in thousands) |
Average Balances |
Interest | Average Yield /Rate |
Average Balances |
Interest | Average Yield /Rate |
||||||||||||||||||
| Interest-earning assets: |
||||||||||||||||||||||||
| Loans |
$ | 925,893 | $ | 10,104 | 4.37% | $ | 757,781 | $ | 8,919 | 4.72% | ||||||||||||||
| Securities and FHLB Stock |
63,675 | 392 | 2.46% | 8,748 | 23 | 1.08% | ||||||||||||||||||
| Fed funds and deposits |
49,267 | 179 | 1.48% | 28,274 | 62 | 0.89% | ||||||||||||||||||
|
|
|
|
|
|
|
|
|
|
|
|
|
|||||||||||||
| Total interest-earning assets |
1,038,835 | 10,675 | 4.12% | 794,803 | 9,004 | 4.54% | ||||||||||||||||||
|
|
|
|
|
|
|
|
|
|||||||||||||||||
| Noninterest-earning assets: |
||||||||||||||||||||||||
| Nonperforming assets |
3,112 | 2,290 | ||||||||||||||||||||||
| Other |
16,410 | 15,318 | ||||||||||||||||||||||
|
|
|
|
|
|||||||||||||||||||||
| Total assets |
$ | 1,058,357 | $ | 812,411 | ||||||||||||||||||||
|
|
|
|
|
|||||||||||||||||||||
| Interest-bearing liabilities: |
||||||||||||||||||||||||
| Demand deposits |
$ | 221,199 | 278 | 0.51% | $ | 110,674 | 150 | 0.55% | ||||||||||||||||
| Money market and savings |
124,945 | 151 | 0.49% | 91,737 | 106 | 0.47% | ||||||||||||||||||
| Certificates of deposit |
255,267 | 375 | 0.60% | 312,778 | 526 | 0.68% | ||||||||||||||||||
|
|
|
|
|
|
|
|
|
|
|
|
|
|||||||||||||
| Total interest-bearing deposits |
601,411 | 804 | 0.54% | 515,189 | 782 | 0.62% | ||||||||||||||||||
| Borrowings |
151,582 | 121 | 0.32% | 58,322 | 30 | 0.21% | ||||||||||||||||||
|
|
|
|
|
|
|
|
|
|
|
|
|
|||||||||||||
| Total interest-bearing liabilities |
752,993 | 925 | 0.50% | 573,511 | 812 | 0.57% | ||||||||||||||||||
|
|
|
|
|
|
|
|
|
|||||||||||||||||
| Noninterest-bearing liabilities: |
||||||||||||||||||||||||
| Demand deposits |
210,330 | 158,194 | ||||||||||||||||||||||
| Other liabilities |
7,200 | 6,596 | ||||||||||||||||||||||
|
|
|
|
|
|||||||||||||||||||||
| Total liabilities |
970,523 | 738,301 | ||||||||||||||||||||||
| Stockholders’ equity |
87,834 | 74,110 | ||||||||||||||||||||||
|
|
|
|
|
|||||||||||||||||||||
| Total liabilities and equity |
$ | 1,058,357 | $ | 812,411 | ||||||||||||||||||||
|
|
|
|
|
|||||||||||||||||||||
| Net Interest Income |
$ | 9,750 | $ | 8,192 | ||||||||||||||||||||
|
|
|
|
|
|||||||||||||||||||||
| Net Interest Rate Spread |
3.62% | 3.97% | ||||||||||||||||||||||
|
|
|
|
|
|||||||||||||||||||||
| Net Yield on Interest-earning Assets |
3.76% | 4.13% | ||||||||||||||||||||||
|
|
|
|
|
|||||||||||||||||||||
51
Table of Contents
Net interest income is impacted by the volume (changes in volume multiplied by prior rate), interest rate (changes in rate multiplied by prior volume) and mix of interest-earning assets and interest-bearing liabilities. The following table provides a breakdown of the changes in net interest income due to volume and rate changes between the first quarter of 2014 as compared to first quarter of 2013.
| Increase (Decrease) due to | Net Increase (Decrease) |
|||||||||||
| (dollars in thousands) | Volume | Rate | ||||||||||
| Interest earned on: |
||||||||||||
| Loans |
$ | 1,870 | $ | (685) | $ | 1,185 | ||||||
| Securities and FHLB Stock |
307 | 62 | 369 | |||||||||
| Fed funds and deposits |
60 | 57 | 117 | |||||||||
|
|
|
|
|
|
|
|||||||
| Total interest-earning assets |
2,237 | (566) | 1,671 | |||||||||
|
|
|
|
|
|
|
|||||||
| Interest paid on: |
||||||||||||
| Demand deposits |
141 | (13) | 128 | |||||||||
| Money market and savings |
40 | 5 | 45 | |||||||||
| Certificates of deposit |
(88) | (63) | (151) | |||||||||
| Borrowings |
67 | 24 | 91 | |||||||||
|
|
|
|
|
|
|
|||||||
| Total interest-bearing liabilities |
160 | (47) | 113 | |||||||||
|
|
|
|
|
|
|
|||||||
| Net interest income |
$ | 2,077 | $ | (519) | $ | 1,558 | ||||||
|
|
|
|
|
|
|
|||||||
Net interest income increased 19% from $8.2 million in the first quarter of 2013 to $9.8 million in the first quarter of 2014 because of a 32% increase in interest-earning assets, which was partially offset by a decrease in our net interest rate spread. The decrease in the net interest rate spread from 3.97% in the first quarter of 2013 to 3.62% in the first quarter of 2014 was due to a decrease in yield on total interest-earning assets which was partially offset by a decrease in rates paid on interest-bearing liabilities. The decrease in yield on interest-earning assets reflected the decrease in interest rates in the overall market, prepayments of higher yielding loans, and an increase in the proportion of lower yielding securities and deposits to total interest-earning assets. The decrease in rates on interest-bearing liabilities from 0.57% in the first quarter of 2013 to 0.50% in the first quarter of 2014 was due to decreases in market interest rates on deposits and an increase in the proportion of lower rate borrowings, which were partially offset by increased borrowing costs related to interest on the FFI term loan.
Provision for loan losses. The provision for loan losses represents our determination of the amount necessary to be charged against the current period’s earnings to maintain the ALLL at a level that is considered adequate in relation to the estimated losses inherent in the loan portfolio. The provision for loan losses is impacted by changes in loan balances as well as changes in estimated loss assumptions and charge-offs and recoveries. The amount of our provision also takes into consideration such factors as changes in the nature and volume of the loan portfolio, overall portfolio quality, review of specific problem loans, current economic conditions and certain other subjective factors that may affect the ability of borrowers to meet their repayment obligations to us. The provision for loan losses was $0.2 million in the first quarter of 2014 as compared to $0.6 million in the first quarter of 2013. The decrease in the provision for loan losses in the first quarter of 2014 as compared to the first quarter of 2013 was the result of reductions in estimated loss assumptions and the lower amount of chargeoffs. We did not recognized any chargeoffs in the first quarter of 2014, as compared to the $0.8 million of chargeoffs we recognized in the first quarter of 2013.
52
Table of Contents
Noninterest income. Noninterest income for Banking includes fees charged to clients for trust services and deposit services, prepayment and late fees charged on loans, insurance commissions and intercompany fees charged for services provided to Wealth Management. The following table provides a breakdown of noninterest income for Banking for the quarters ended March 31:
| (dollars in thousands) | 2014 | 2013 | ||||||
| Trust fees |
$ | 487 | $ | 527 | ||||
| Deposit charges |
93 | 92 | ||||||
| Prepayment fees |
116 | 54 | ||||||
| Other |
346 | 146 | ||||||
|
|
|
|
|
|||||
| Total noninterest income |
$ | 1,042 | $ | 819 | ||||
|
|
|
|
|
|||||
The $0.2 million increase in noninterest income for Banking in the first quarter of 2014 as compared to the first quarter of 2013 was due primarily to a $0.2 million increase in insurance commissions as there was larger cases closed in the first quarter of 2014 as compared to the first quarter of 2013.
Noninterest income for Wealth Management includes fees charged to high net-worth clients for managing their assets and for providing financial planning and consulting services, as well as fees for administration services provided to family foundations and private charitable organizations. The following table provides a breakdown of noninterest income for Wealth Management for the quarters ended March 31:
| (dollars in thousands) | 2014 | 2013 | ||||||
| Asset management fees |
$ | 4,368 | $ | 3,552 | ||||
| Consulting and administration fees |
263 | 270 | ||||||
| Other |
(6) | (6) | ||||||
|
|
|
|
|
|||||
| Total noninterest income |
$ | 4,625 | $ | 3,816 | ||||
|
|
|
|
|
|||||
The $0.8 million increase in noninterest income in Wealth Management in the first quarter of 2014 as compared to the first quarter of 2013 was primarily due to increases in asset management fees of 23%. That increase was primarily due to the 16% increase in the AUM balances used for computing the asset management fees in 2014 as compared to 2013.
Noninterest Expense. The following table provides a breakdown of noninterest expense for Banking and Wealth Management for the quarters ended March 31:
| Banking | Wealth Management | |||||||||||||||
| (dollars in thousands) | 2014 | 2013 | 2014 | 2013 | ||||||||||||
| Compensation and benefits |
$ | 4,520 | $ | 3,844 | $ | 3,728 | $ | 3,313 | ||||||||
| Occupancy and depreciation |
1,284 | 926 | 515 | 393 | ||||||||||||
| Professional services and marketing |
503 | 371 | 464 | 456 | ||||||||||||
| Other expenses |
635 | 471 | 135 | 163 | ||||||||||||
|
|
|
|
|
|
|
|
|
|||||||||
| Total noninterest expense |
$ | 6,942 | $ | 5,612 | $ | 4,842 | $ | 4,325 | ||||||||
|
|
|
|
|
|
|
|
|
|||||||||
The $1.3 million increase in noninterest expense in Banking in the first quarter of 2014 as compared to the first quarter of 2013 was due primarily to increases in staffing and costs associated with FFB’s higher balances of loans and deposits and our continuing expansion. Compensation and benefits for Banking increased $0.7 million during in the first quarter of 2014 as compared to the first quarter of 2013 as the number of full-time equivalent employees, (“FTE”) in Banking increased to 136.3 during the first quarter of 2014 from 112.8 during the first
53
Table of Contents
quarter of 2013. The $0.4 million increase in occupancy and depreciation costs for Banking in the first quarter of 2014 as compared to the first quarter of 2013 was due to the one additional office being open during the first quarter of 2014 as compared to the first quarter of 2013 and the expansion into additional space at the administrative office in the second quarter of 2013. For Banking, the combined $0.3 million increase in professional services and marketing, which includes costs for legal, accounting, consulting and information technology services, as well as management fees paid to FFA for providing asset management services for FFB’s trust clients, and other expenses, which includes office related costs, FDIC and other regulatory assessments, director fees, insurance costs, loan related expenses, employee reimbursements and REO expenses, reflect increased costs related to our larger loan and deposit balances, increased staffing and increased number of wealth management offices.
The $0.5 million increase in noninterest expense in Wealth Management in the first quarter of 2014 as compared to the first quarter of 2013 was primarily due to increases in staffing and costs associated with our continuing expansion and growth. Compensation and benefits for Wealth Management increased $0.4 million in the first quarter of 2014 as compared to the first quarter of 2013 as the number of FTE in Wealth Management increased to 54.7 during the first quarter of 2014 from 51.0 during the first quarter of 2013.
Years Ended December 31, 2013 and 2012.
Our net income for 2013 was $7.9 million, as compared to $5.8 million for 2012. The proportional increase in net income was more than the proportional increase in income before taxes because of a decrease in our effective tax rate from 26% in 2012 to 17% in 2013. In 2013 and 2012, the valuation allowance for deferred taxes was reduced by $2.4 million and $1.0 million, respectively, resulting in lower effective tax rates as compared to a normalized income tax provision of 42%.
Income before taxes was $9.5 million in 2013 as compared to $7.8 million in 2012. The following is a comparison of our income before taxes between 2013 and 2012.
The following tables show key operating results for each of our business segments for the years ended December 31:
| (dollars in thousands) | Banking | Wealth Management |
Other | Total | ||||||||||||
| 2013: |
||||||||||||||||
| Interest income |
$ | 39,181 | $ | - | $ | - | $ | 39,181 | ||||||||
| Interest expense |
3,288 | - | 219 | 3,507 | ||||||||||||
|
|
|
|
|
|
|
|
|
|||||||||
| Net interest income |
35,893 | - | (219) | 35,674 | ||||||||||||
| Provision for loan losses |
2,395 | - | - | 2,395 | ||||||||||||
| Noninterest income |
3,514 | 16,715 | (405) | 19,824 | ||||||||||||
| Noninterest expense |
24,302 | 17,400 | 1,920 | 43,622 | ||||||||||||
|
|
|
|
|
|
|
|
|
|||||||||
| Income (loss) before taxes on income |
$ | 12,710 | $ | (685) | $ | (2,544) | $ | 9,481 | ||||||||
|
|
|
|
|
|
|
|
|
|||||||||
| 2012: |
||||||||||||||||
| Interest income |
$ | 30,874 | $ | - | $ | - | $ | 30,874 | ||||||||
| Interest expense |
3,145 | - | - | 3,145 | ||||||||||||
|
|
|
|
|
|
|
|
|
|||||||||
| Net interest income |
27,729 | - | - | 27,729 | ||||||||||||
| Provision for loan losses |
2,065 | - | - | 2,065 | ||||||||||||
| Noninterest income |
2,599 | 14,250 | (229) | 16,620 | ||||||||||||
| Noninterest expense |
18,280 | 14,896 | 1,300 | 34,476 | ||||||||||||
|
|
|
|
|
|
|
|
|
|||||||||
| Income (loss) before taxes on income |
$ | 9,983 | $ | (646) | $ | (1,529) | $ | 7,808 | ||||||||
|
|
|
|
|
|
|
|
|
|||||||||
54
Table of Contents
The primary sources of revenue for Banking are net interest income, fees from its deposits, trust and insurance services, and certain loan fees. The primary sources of revenue for Wealth Management are asset management fees assessed on the balance of AUM and fees charged for consulting and administrative services. Compensation and benefit costs, which represent the largest component of noninterest expense accounted for 62% and 76%, respectively, of the total noninterest expense for Banking and Wealth Management in 2013.
General. As a result of an increase in income before taxes for Banking, which was partially offset by an increase in corporate expenses, consolidated income before taxes increased $1.7 million in 2013 as compared to 2012. Income before taxes in Banking was $2.7 million higher in 2013 as compared to 2012 as higher net interest income and higher noninterest income was partially offset by a higher noninterest expenses. The loss before taxes for Wealth Management for 2013 was comparable to the loss for 2012 as increases in noninterest income were offset by increases in noninterest expenses. Our operating losses in Wealth Management are due in part to our continued investment in new relationship managers which are a key component in growing our revenues. Typically, it takes two to three years to realize enough revenues to cover the costs associated with hiring and retaining a new relationship manager. Corporate expenses were $1.0 million higher in 2013 as compared to 2012 due to increased sales and marketing activities, increased allocations of compensation costs from FFB and interest costs on the term loan.
Net Interest Income. The following tables set forth information regarding (i) the total dollar amount of interest income from interest-earning assets and the resultant average yields on those assets; (ii) the total dollar amount of interest expense and the average rate of interest on our interest-bearing liabilities; (iii) net interest income; (iv) net interest rate spread; and (v) net yield on interest-earning assets for the year ended December 31:
| 2013 | 2012 | |||||||||||||||||||||||
| (dollars in thousands) | Average Balances |
Interest | Average Yield /Rate |
Average Balances |
Interest | Average Yield /Rate |
||||||||||||||||||
| Interest-earning assets: |
||||||||||||||||||||||||
| Loans |
$ | 808,747 | $ | 37,918 | 4.69% | $ | 626,866 | $ | 30,552 | 4.87% | ||||||||||||||
| Securities |
37,325 | 864 | 2.31% | 16,047 | 193 | 1.20% | ||||||||||||||||||
| Fed funds and deposits |
37,919 | 399 | 1.05% | 17,346 | 129 | 0.75% | ||||||||||||||||||
|
|
|
|
|
|
|
|
|
|
|
|
|
|||||||||||||
| Total interest-earning assets |
883,991 | 39,181 | 4.43% | 660,259 | 30,874 | 4.68% | ||||||||||||||||||
|
|
|
|
|
|
|
|
|
|||||||||||||||||
| Noninterest-earning assets: |
||||||||||||||||||||||||
| Nonperforming assets |
2,778 | 1,232 | ||||||||||||||||||||||
| Other |
13,935 | 12,631 | ||||||||||||||||||||||
|
|
|
|
|
|||||||||||||||||||||
| Total assets |
$ | 900,704 | $ | 674,122 | ||||||||||||||||||||
|
|
|
|
|
|||||||||||||||||||||
| Interest-bearing liabilities: |
||||||||||||||||||||||||
| Demand deposits |
$ | 165,736 | 857 | 0.52% | $ | 43,776 | 251 | 0.58% | ||||||||||||||||
| Money market and savings |
99,826 | 434 | 0.44% | 92,404 | 516 | 0.56% | ||||||||||||||||||
| Certificates of deposit |
279,470 | 1,876 | 0.67% | 283,677 | 2,151 | 0.76% | ||||||||||||||||||
|
|
|
|
|
|
|
|
|
|
|
|
|
|||||||||||||
| Total interest-bearing deposits |
545,032 | 3,167 | 0.58% | 419,857 | 2,918 | 0.70% | ||||||||||||||||||
| Borrowings |
84,409 | 340 | 0.40% | 99,257 | 227 | 0.23% | ||||||||||||||||||
|
|
|
|
|
|
|
|
|
|
|
|
|
|||||||||||||
| Total interest-bearing liabilities |
629,441 | 3,507 | 0.56% | 519,114 | 3,145 | 0.61% | ||||||||||||||||||
|
|
|
|
|
|
|
|
|
|||||||||||||||||
| Noninterest-bearing liabilities: |
||||||||||||||||||||||||
| Demand deposits |
186,760 | 92,641 | ||||||||||||||||||||||
| Other liabilities |
7,813 | 4,970 | ||||||||||||||||||||||
|
|
|
|
|
|||||||||||||||||||||
| Total liabilities |
824,014 | 616,725 | ||||||||||||||||||||||
| Stockholders’ equity |
76,690 | 57,397 | ||||||||||||||||||||||
|
|
|
|
|
|||||||||||||||||||||
| Total liabilities and equity |
$ | 900,704 | $ | 674,122 | ||||||||||||||||||||
|
|
|
|
|
|||||||||||||||||||||
| Net Interest Income |
$ | 35,674 | $ | 27,729 | ||||||||||||||||||||
|
|
|
|
|
|||||||||||||||||||||
| Net Interest Rate Spread |
3.87% | 4.07% | ||||||||||||||||||||||
|
|
|
|
|
|||||||||||||||||||||
| Net Yield on Interest-earning Assets |
4.04% | 4.20% | ||||||||||||||||||||||
|
|
|
|
|
|||||||||||||||||||||
55
Table of Contents
Net interest income is impacted by the volume (changes in volume multiplied by prior rate), interest rate (changes in rate multiplied by prior volume) and mix of interest-earning assets and interest-bearing liabilities. The following table provides a breakdown of the changes in net interest income due to volume and rate changes between 2013 as compared to 2012.
| Increase (Decrease) due to | Net Increase (Decrease) |
|||||||||||
| (dollars in thousands) | Volume | Rate | ||||||||||
| Interest earned on: |
||||||||||||
| Loans |
$ | 8,565 | $ | (1,199) | $ | 7,366 | ||||||
| Securities |
396 | 275 | 671 | |||||||||
| Fed funds and deposits |
201 | 69 | 270 | |||||||||
|
|
|
|
|
|
|
|||||||
| Total interest-earning assets |
9,162 | (855) | 8,307 | |||||||||
|
|
|
|
|
|
|
|||||||
| Interest paid on: |
||||||||||||
| Demand deposits |
635 | (29) | 606 | |||||||||
| Money market and savings |
39 | (121) | (82) | |||||||||
| Certificates of deposit |
(33) | (242) | (275) | |||||||||
| Borrowings |
(38) | 151 | 113 | |||||||||
|
|
|
|
|
|
|
|||||||
| Total interest-bearing liabilities |
603 | (241) | 362 | |||||||||
|
|
|
|
|
|
|
|||||||
| Net interest income |
$ | 8,559 | $ | (614) | $ | 7,945 | ||||||
|
|
|
|
|
|
|
|||||||
Net interest income increased 29% from $27.7 million in 2012 to $35.7 million in 2013 because of a 33% increase in interest-earning assets and because we realized $1.1 million of interest income in 2013 on the net recovery of mark to market adjustments related to payoffs of acquired loans, which were partially offset by a decrease in our net interest rate spread. Excluding this net recovery, the yield on total interest-earning assets would have been 4.31%, the net interest rate spread would have been 3.75% and the net yield on interest-earning assets would have been 3.91% in 2013. Excluding the net recovery on acquired loans, the decrease in the net interest rate spread from 4.07% in 2012 to 3.75% in 2013 was due to a decrease in yield on total interest-earning assets which was partially offset by a decrease in rates paid on interest-bearing liabilities. The decrease in yield on interest-earning assets reflected the decrease in interest rates in the overall market, prepayments of higher yielding loans, and an increase in the proportion of lower yielding securities and deposits to total interest-earning assets. The decrease in rates on interest-bearing liabilities from 0.61% in 2012 to 0.56% in 2013 was due to decreases in market interest rates on deposits which were partially offset by increased borrowing costs related to interest on the FFI term loan.
Provision for loan losses. The provision for loan losses represents our determination of the amount necessary to be charged against the current period’s earnings to maintain the ALLL at a level that is considered adequate in relation to the estimated losses inherent in the loan portfolio. The provision for loan losses is impacted by changes in loan balances as well as changes in estimated loss assumptions and charge-offs and recoveries. The amount of our provision also takes into consideration such factors as changes in the nature and volume of the loan portfolio, overall portfolio quality, review of specific problem loans, current economic conditions and certain other subjective factors that may affect the ability of borrowers to meet their repayment obligations to us. The provision for loan losses was $2.4 million for 2013 and $2.1 million for 2012. The increase in the provision for loan losses in 2013 as compared to 2012 was the result of higher loan balances and a $0.5 million increase in charge-offs which were partially offset by reductions in estimated loss assumptions.
56
Table of Contents
Noninterest income. Noninterest income for Banking includes fees charged to clients for trust services and deposit services, prepayment and late fees charged on loans and intercompany fees charged for services provided to Wealth Management. The following table provides a breakdown of noninterest income for Banking for the years ended December 31:
| (dollars in thousands) | 2013 | 2012 | ||||||
| Trust fees |
$ | 1,785 | $ | 1,170 | ||||
| Deposit charges |
366 | 143 | ||||||
| Prepayment fees |
846 | 779 | ||||||
| Other |
517 | 507 | ||||||
|
|
|
|
|
|||||
| Total noninterest income |
$ | 3,514 | $ | 2,599 | ||||
|
|
|
|
|
|||||
The $0.9 million increase in noninterest income for Banking in 2013, as compared to 2012 was due primarily to higher trust fees. The increase in trust fees reflects the continuing growth of the trust operations as evidenced by the higher level of trust AUM, which has increased to $341 million as of December 31, 2013.
Noninterest income for Wealth Management includes fees charged to high net-worth clients for managing their assets and for providing financial planning consulting services, as well as fees for administration services provided to family foundations and private charitable organizations. The following table provides a breakdown of noninterest income for Wealth Management for the years ended December 31:
| (dollars in thousands) | 2013 | 2012 | ||||||
| Asset management fees |
$ | 15,560 | $ | 12,983 | ||||
| Consulting and administration fees |
1,164 | 1,341 | ||||||
| Other |
(9) | (74) | ||||||
|
|
|
|
|
|||||
| Total noninterest income |
$ | 16,715 | $ | 14,250 | ||||
|
|
|
|
|
|||||
The $2.5 million increase in noninterest income in Wealth Management in 2013, as compared to 2012 was primarily due to increases in asset management fees of 20%. That increase was primarily due to the 19% increase in the AUM balances used for computing the asset management fees in 2013 as compared to 2012.
Noninterest Expense. The following table provides a breakdown of noninterest expense for Banking and Wealth Management for the years ended December 31:
| Banking | Wealth Management | |||||||||||||||
| (dollars in thousands) | 2013 | 2012 | 2013 | 2012 | ||||||||||||
| Compensation and benefits |
$ | 14,971 | $ | 11,208 | $ | 13,176 | $ | 11,673 | ||||||||
| Occupancy and depreciation |
4,568 | 3,656 | 1,922 | 1,393 | ||||||||||||
| Professional services and marketing |
1,752 | 1,000 | 1,536 | 1,179 | ||||||||||||
| Other expenses |
3,011 | 2,416 | 766 | 651 | ||||||||||||
|
|
|
|
|
|
|
|
|
|||||||||
| Total noninterest expense |
$ | 24,302 | $ | 18,280 | $ | 17,400 | $ | 14,896 | ||||||||
|
|
|
|
|
|
|
|
|
|||||||||
The $6.0 million increase in noninterest expense in Banking during 2013 as compared to 2012 was due primarily to increases in staffing and costs associated with FFB’s higher balances of loans and deposits and our continuing expansion, including the DCB Acquisition in August 2012. Compensation and benefits for Banking increased $3.8 million during 2013 as compared to 2012 as the number of full-time equivalent employees, (“FTE”) in Banking increased to 123.1 during 2013 from 87.9 during 2012. The $0.9 million increase in occupancy and depreciation costs for Banking during 2013 as compared to 2012 was due to the four additional offices being open at some time during 2013 as compared to 2012 and the expansion into additional space at the
57
Table of Contents
administrative office in the second quarter of 2013. Those increases were partially offset by reduced operating system costs relating to $0.6 million of costs incurred in 2012 as part of FFB’s conversion to a new core processing system. Professional services and marketing for Banking, which includes costs for legal, accounting, consulting and information technology services, as well as management fees paid to FFA for providing asset management services for FFB’s trust clients, increased $0.8 million during 2013 as compared to 2012. This increase was due primarily to additional consulting and legal costs incurred in relation to strategic activities of FFB and an increase in asset management fees related to trust clients. Other expenses for Banking, which include office related costs, FDIC and other regulatory assessments, director fees, insurance costs, loan related expenses, employee reimbursements and real estate owned (“REO”) expenses, increased $0.6 million during 2013 as compared to 2012. This increase was primarily due to a $0.3 million charge to REO reserves in 2013 and $0.1 million increases in employee reimbursements and in loan related expenses, both of which were related to our continued growth.
The $2.5 million increase in noninterest expense in Wealth Management during 2013 as compared to 2012 was primarily due to increases in staffing and costs associated with our continuing expansion and growth. Compensation and benefits for Wealth Management increased $1.5 million during 2013 as compared to 2012 as the number of FTE in Wealth Management increased to 53.4 during 2013 from 44.7 during 2012. The $0.5 million increase in occupancy and depreciation costs for Wealth Management during 2013 as compared to 2012 was due to additional offices being open during all or a portion of 2013 as compared to 2012 and $0.2 million of costs incurred related to an upgrade of our asset management operating system. Professional services and marketing for Wealth Management, which includes costs for legal, accounting and information technology services, as well as recurring referral fees paid to third parties, increased $0.4 million during 2013 as compared to 2012. This $0.4 million increase was due primarily to higher referral fees related to the increased asset management fees and higher recruiting fees paid related to the increase in staffing during 2013. Other expenses for Wealth Management, which include office related costs, insurance costs and employee reimbursements did not change significantly in 2013 as compared to 2012.
Years Ended December 31, 2012 and 2011.
Our net income for 2012 was $5.8 million, as compared to $9.1 million for 2011. The proportional decrease in net income was greater than the proportional decrease in income before taxes because of an increase in our effective tax rate from 0% in 2011 to 26% in 2012. In 2012 and 2011, the valuation allowance for deferred taxes was reduced by $1.0 million and $3.6 million, respectively, resulting in lower effective tax rates as compared to a normalized income tax provision of 42%.
Income before taxes was $7.8 million in 2012 as compared to $9.1 million in 2011. The following is a comparison of our income before taxes between 2012 and 2011.
The following tables show key operating results for each of our business segments for the years ended December 31:
| (dollars in thousands) | Banking | Wealth Management |
Other | Total | ||||||||||||
| 2012: |
||||||||||||||||
| Interest income |
$ | 30,874 | $ | - | $ | $ | 30,874 | |||||||||
| Interest expense |
3,145 | - | - | 3,145 | ||||||||||||
|
|
|
|
|
|
|
|
|
|||||||||
| Net interest income |
27,729 | - | - | 27,729 | ||||||||||||
| Provision for loan losses |
2,065 | - | - | 2,065 | ||||||||||||
| Noninterest income |
2,599 | 14,250 | (229) | 16,620 | ||||||||||||
| Noninterest expense |
18,280 | 14,896 | 1,300 | 34,476 | ||||||||||||
|
|
|
|
|
|
|
|
|
|||||||||
| Income (loss) before taxes on income |
$ | 9,983 | $ | (646) | $ | (1,529) | $ | 7,808 | ||||||||
|
|
|
|
|
|
|
|
|
|||||||||
58
Table of Contents
| (dollars in thousands) | Banking | Wealth Management |
Other | Total | ||||||||||||
| 2011: |
||||||||||||||||
| Interest income |
$ | 23,022 | $ | - | $ | - | $ | 23,022 | ||||||||
| Interest expense |
2,881 | - | - | 2,881 | ||||||||||||
|
|
|
|
|
|
|
|
|
|||||||||
| Net interest income |
20,141 | - | - | 20,141 | ||||||||||||
| Provision for loan losses |
2,297 | - | - | 2,297 | ||||||||||||
| Noninterest income |
5,094 | 12,719 | (113) | 17,700 | ||||||||||||
| Noninterest expense |
12,137 | 13,027 | 1,282 | 26,446 | ||||||||||||
|
|
|
|
|
|
|
|
|
|||||||||
| Income (loss) before taxes on income |
$ | 10,801 | $ | (308) | $ (1,395) | $ | 9,098 | |||||||||
|
|
|
|
|
|
|
|
|
|||||||||
The primary sources of revenue for Banking are net interest income and fees from its deposit, trust and insurance services. The primary sources of revenue for Wealth Management are asset management fees assessed on the balance of AUM and fees charged for consulting and administrative services. For 2012, compensation and benefits comprised 61% and 78%, respectively, of the total noninterest expense for Banking and Wealth Management, respectively.
General: In 2011, FFB realized a $3.7 million gain on sale of REO which is included in noninterest income in Banking. Excluding the gain on sale of REO, income before taxes for Banking increased to $10.0 million in 2012 from $7.1 million in 2011 due primarily to higher net interest income and higher noninterest income which were partially offset by higher noninterest expenses. The net loss before taxes in Wealth Management increased to $0.6 million in 2012 from $0.3 million in 2011 as higher noninterest expenses in 2012 were only partially offset by higher asset management fees.
Net Interest Income: The following tables set forth information regarding (i) the total dollar amount of interest income from interest-earning assets and the resultant average yields on those assets; (ii) the total dollar amount of interest expense and the average rate of interest on our interest-bearing liabilities; (iii) net interest income; (iv) net interest rate spread; and (v) net yield on interest-earning assets for the years ended December 31:
| 2012 | 2011 | |||||||||||||||||||||||
| (dollars in thousands) | Average Balances |
Interest | Average Yield /Rate |
Average Balances |
Interest | Average Yield /Rate |
||||||||||||||||||
| Interest-earning assets: |
||||||||||||||||||||||||
| Loans |
$ | 626,866 | $ | 30,552 | 4.87% | $ | 436,247 | $ | 22,864 | 5.24% | ||||||||||||||
| Securities and FHLB stock |
16,047 | 193 | 1.20% | 9,710 | 135 | 1.35% | ||||||||||||||||||
| Fed funds and deposits |
17,346 | 129 | 0.75% | 8,902 | 23 | 0.26% | ||||||||||||||||||
|
|
|
|
|
|
|
|
|
|
|
|
|
|||||||||||||
| Total interest-earning assets |
660,259 | 30,874 | 4.68% | 454,859 | 23,022 | 5.06% | ||||||||||||||||||
|
|
|
|
|
|
|
|
|
|||||||||||||||||
| Noninterest-earning assets: |
||||||||||||||||||||||||
| Nonperforming assets |
1,232 | 467 | ||||||||||||||||||||||
| Other |
12,631 | 3,876 | ||||||||||||||||||||||
|
|
|
|
|
|||||||||||||||||||||
| Total assets |
$ | 674,122 | $ | 459,202 | ||||||||||||||||||||
|
|
|
|
|
|||||||||||||||||||||
| Interest-bearing liabilities: |
||||||||||||||||||||||||
| Demand deposits |
$ | 43,776 | 251 | 0.58% | $ | 11,375 | 74 | 0.65% | ||||||||||||||||
| Money market and savings |
92,404 | 516 | 0.56% | 60,844 | 405 | 0.67% | ||||||||||||||||||
| Certificates of deposit |
283,677 | 2,151 | 0.76% | 225,263 | 2,312 | 1.03% | ||||||||||||||||||
|
|
|
|
|
|
|
|
|
|
|
|
|
|||||||||||||
| Total interest-bearing deposits |
419,857 | 2,918 | 0.70% | 297,482 | 2,791 | 0.94% | ||||||||||||||||||
| Borrowings |
99,257 | 227 | 0.23% | 60,375 | 90 | 0.15% | ||||||||||||||||||
|
|
|
|
|
|
|
|
|
|
|
|
|
|||||||||||||
| Total interest-bearing liabilities |
519,114 | 3,145 | 0.61% | 357,857 | 2,881 | 0.81% | ||||||||||||||||||
|
|
|
|
|
|
|
|
|
|||||||||||||||||
59
Table of Contents
| 2012 | 2011 | |||||||||||||||||||||||
| (dollars in thousands) | Average Balances |
Interest | Average Yield /Rate |
Average Balances |
Interest | Average Yield /Rate |
||||||||||||||||||
| Noninterest-bearing liabilities: |
||||||||||||||||||||||||
| Demand deposits |
$ | 92,641 | $ | 59,650 | ||||||||||||||||||||
| Other liabilities |
4,970 | 2,641 | ||||||||||||||||||||||
|
|
|
|
|
|||||||||||||||||||||
| Total liabilities |
616,725 | 420,148 | ||||||||||||||||||||||
| Stockholders’ equity |
57,397 | 39,054 | ||||||||||||||||||||||
|
|
|
|
|
|||||||||||||||||||||
| Total liabilities and equity |
$ | 674,122 | $ | 459,202 | ||||||||||||||||||||
|
|
|
|
|
|||||||||||||||||||||
| Net Interest Income |
$ | 27,729 | $ | 20,141 | ||||||||||||||||||||
|
|
|
|
|
|||||||||||||||||||||
| Net Interest Rate Spread |
4.07% | 4.25% | ||||||||||||||||||||||
|
|
|
|
|
|||||||||||||||||||||
| Net Yield on Interest-earning Assets |
4.20% | 4.43% | ||||||||||||||||||||||
|
|
|
|
|
|||||||||||||||||||||
Net interest income is impacted by the volume (changes in volume multiplied by prior rate), interest rate (changes in rate multiplied by prior volume) and mix of interest-earning assets and interest-bearing liabilities. The following table provides a breakdown of the changes in net interest income due to volume and rate changes between 2012 as compared to corresponding period in 2011.
| Increase (Decrease) due to | Net Increase (Decrease) |
|||||||||||
| (dollars in thousands) | Volume | Rate | ||||||||||
| Interest earned on: |
||||||||||||
| Loans |
$ | 9,406 | $ (1,718) | $ | 7,688 | |||||||
| Securities and FHLB stock |
78 | (20) | 58 | |||||||||
| Fed funds and deposits |
35 | 71 | 106 | |||||||||
|
|
|
|
|
|
|
|||||||
| Total interest-earning assets |
9,519 | (1,667) | 7,852 | |||||||||
|
|
|
|
|
|
|
|||||||
| Interest paid on: |
||||||||||||
| Demand deposits |
186 | (9) | 177 | |||||||||
| Money market and savings |
186 | (75) | 111 | |||||||||
| Certificates of deposit |
528 | (689) | (161) | |||||||||
| Borrowings |
75 | 62 | 137 | |||||||||
|
|
|
|
|
|
|
|||||||
| Total interest-bearing liabilities |
975 | (711) | 264 | |||||||||
|
|
|
|
|
|
|
|||||||
| Net interest income |
$ | 8,544 | $ (956) | $ | 7,588 | |||||||
|
|
|
|
|
|
|
|||||||
The yield on interest-earning assets and the rate on interest-bearing liabilities have been impacted by the continuing decreases in market interest rates, which resulted in a 37 basis point decrease in the yield on average loans and a 20 basis point decrease in the rate paid on interest-bearing liabilities in 2012 as compared to 2011. Because the decrease in our yield on loans was greater than our decrease in the rate on interest-bearing liabilities, our net interest rate spread decreased to 4.07% in 2012 as compared to 4.25% in 2011. Because the loans and deposits acquired in the DCB Acquisition were valued at fair value, the results related to the assets acquired and liabilities assumed in the DCB Acquisition did not have a significant impact on our net yield on interest-earning assets in 2012.
Provision for loan losses: Our provision for loans losses in 2012 was $2.1 million as compared to $2.3 million in 2011 because the increase in our net loans in 2012, excluding the loans acquired in the DCB Acquisition, was 24% less than the increase in our net loans in 2011. The impact of this decrease was partially offset by a $0.3 million increase in net charge-offs in 2012 as compared to 2011. Under accounting guidelines, FFB is required to provide a calculated reserve for loan losses for its outstanding loan balances, including those acquired in the DCB Acquisition. However, these guidelines also require FFB to record the calculated reserve for acquired loans as a reduction of the carrying balance of those loans on the date they are acquired, and then amortize this calculated reserve into income for each loan over the life of the loan. Therefore, the ALLL represents the estimated credit losses of all loans not acquired in the DCB Acquisition, plus any
60
Table of Contents
deficiency in the estimated credit losses, which is included as a reduction of the carrying balance of those loans, for the loans acquired in the DCB Acquisition. Excluding the loans acquired in the DCB Acquisition, FFB’s ALLL levels at December 31, 2012 and 2011 equaled 1.25% of the respective loan balances then outstanding.
Noninterest income: The following table provides a breakdown of noninterest income for Banking for the years ended December 31:
| (dollars in thousands) | 2012 | 2011 | ||||||
| Trust fees |
$ | 1,170 | $ | 555 | ||||
| Prepayment fees |
779 | 208 | ||||||
| Gain on sale of REO |
- | 3,695 | ||||||
| Other |
650 | 636 | ||||||
|
|
|
|
|
|||||
| Total noninterest income |
$ | 2,599 | $ | 5,094 | ||||
|
|
|
|
|
|||||
During 2009, FFB foreclosed on properties securing two participation loans, with a book value of $3.6 million, resulting in a $0.3 million charge-off and the transfer of the remaining outstanding balances to REO. Subsequently, FFB recorded $1.9 million and $1.4 million provisions for REO losses related to these properties in 2010 and 2009, respectively. During 2011, we reached a settlement agreement with the bank who sold us these participation loans. As a result of the settlement we transferred the properties to the other bank and recognized a $3.7 million gain on sale of REO in 2011.
Excluding the $3.7 million gain on sale of REO recognized in 2011, the $1.2 million increase in noninterest income in Banking for 2012, as compared to 2011, was due to increased activity levels in the trust operations of FFB as well as increased fees related to the prepayment of loans. Trust AUM increased from $135 million at the beginning of 2011 to $309 million at the end of 2012. Loan prepayments totaled $116 million in 2012 as compared to $61 million in 2011.
The following table provides a breakdown of noninterest income for Wealth Management for the years ended December 31:
| (dollars in thousands) | 2012 | 2011 | ||||||
| Asset management fees |
$ | 12,983 | $ | 11,338 | ||||
| Consulting and administration fees |
1,341 | 1,393 | ||||||
| Other |
(74) | (12) | ||||||
|
|
|
|
|
|||||
| Total noninterest income |
$ | 14,250 | $ | 12,719 | ||||
|
|
|
|
|
|||||
Asset management fees increased by 15% in 2012 as compared to 2011 due to a 21% increase in the average billable AUM which was partially offset by a decrease in the weighted average investment advisory fee rate. At December 31, 2012, AUM totaled $2.23 billion as compared to $1.83 billion at December 31, 2011 and $1.56 billion at December 31, 2010.
Noninterest Expense: The following table provides a breakdown of noninterest expense for Banking and Wealth Management for the years ended December 31:
| Banking | Wealth Management | |||||||||||||||
| (dollars in thousands) | 2012 | 2011 | 2012 | 2011 | ||||||||||||
| Compensation and benefits |
$ | 11,208 | $ | 7,808 | $ | 11,673 | $ | 10,091 | ||||||||
| Occupancy and depreciation |
3,656 | 1,786 | 1,393 | 1,226 | ||||||||||||
| Professional services and marketing |
1,000 | 501 | 1,179 | 1,231 | ||||||||||||
| Other expenses |
2,416 | 2,042 | 651 | 479 | ||||||||||||
|
|
|
|
|
|
|
|
|
|||||||||
| Total noninterest expense |
$ | 18,280 | $ | 12,137 | $ | 14,896 | $ | 13,027 | ||||||||
|
|
|
|
|
|
|
|
|
|||||||||
61
Table of Contents
The increase in noninterest expense in Banking during 2012 as compared to 2011 was due to increases in staffing, increases in noninterest expenses as a result of the DCB Acquisition and costs associated with our higher balances of loans and deposits. Compensation and benefits increased $3.4 million in 2012 as compared to 2011 as the number of FTE in Banking increased to 87.9 FTE during 2012 as compared to 58.6 FTE during 2011. The increase in staffing was primarily due to the opening of our new office in West Los Angeles and increased staffing related to the DCB Acquisition. The $1.9 million increase in occupancy and depreciation for Banking in 2012 as compared to 2011 reflects the facility costs for those branches acquired or opened in 2012 as well as the full year of costs related to the branch and corporate expansions that occurred in 2011. The $0.5 million increase in professional services and marketing for Banking in 2012 as compared to 2011 was due to costs related to our increased activities, including information technology upgrades and projects and increased management fees paid on trust AUM. The $0.4 million increase in other expenses in 2012 as compared to 2011 reflects costs related to our continuing growth including FDIC insurance premiums and general office costs.
The $1.9 million increase in noninterest expenses in Wealth Management during 2012 as compared to 2011 was primarily due to $1.6 million of higher compensation and benefits costs resulting from increased staffing associated with opening of our new office in West Los Angeles and increased incentive compensation related to the growth in AUM. Staffing for Wealth Management increased to 44.7 FTE in 2012 from 42.0 FTE in 2011.
Financial Condition
The following table shows the financial position for each of our business segments, and of FFI and elimination entries used to arrive at our consolidated totals which are included in the column labeled Other, as of:
| (dollars in thousands) | Banking |
Wealth |
Other
and |
Total | ||||||||||||
| March 31, 2014: |
||||||||||||||||
| Cash and cash equivalents |
$ | 50,045 | $ | 1,058 | $ | (816) | $ | 50,287 | ||||||||
| Securities AFS |
73,257 | - | - | 73,257 | ||||||||||||
| Loans, net |
938,366 | 328 | - | 938,694 | ||||||||||||
| Premises and equipment |
2,096 | 782 | 100 | 2,978 | ||||||||||||
| FHLB Stock |
6,580 | - | - | 6,580 | ||||||||||||
| Deferred taxes |
10,512 | 878 | (190) | 11,200 | ||||||||||||
| REO |
1,875 | - | - | 1,875 | ||||||||||||
| Other assets |
3,840 | 910 | 727 | 5,477 | ||||||||||||
|
|
|
|
|
|
|
|
|
|||||||||
| Total assets |
$ | 1,086,571 | $ | 3,956 | $ | (179) | $ | 1,090,348 | ||||||||
|
|
|
|
|
|
|
|
|
|||||||||
| Deposits |
$ | 865,889 | $ | - | $ | (11,205) | $ | 854,684 | ||||||||
| Borrowings |
119,000 | - | 21,875 | 140,875 | ||||||||||||
| Intercompany balances |
365 | 400 | (765) | - | ||||||||||||
| Other liabilities |
2,897 | 1,515 | 1,536 | 5,948 | ||||||||||||
| Shareholders’ equity |
98,420 | 2,041 | (11,620) | 88,841 | ||||||||||||
|
|
|
|
|
|
|
|
|
|||||||||
| Total liabilities and equity |
$ | 1,086,571 | $ | 3,956 | $ | (179) | $ | 1,090,348 | ||||||||
|
|
|
|
|
|
|
|
|
|||||||||
| December 31, 2013: |
||||||||||||||||
| Cash and cash equivalents |
$ | 56,795 | $ | 2,134 | $ | (1,975) | $ | 56,954 | ||||||||
| Securities AFS |
59,111 | - | - | 59,111 | ||||||||||||
| Loans, net |
893,364 | 366 | - | 893,730 | ||||||||||||
| Premises and equipment |
2,286 | 863 | 100 | 3,249 | ||||||||||||
| FHLB Stock |
6,721 | - | - | 6,721 | ||||||||||||
| Deferred taxes |
11,426 | 865 | (239) | 12,052 | ||||||||||||
| REO |
375 | - | - | 375 | ||||||||||||
| Other assets |
3,840 | 717 | 611 | 5,168 | ||||||||||||
|
|
|
|
|
|
|
|
|
|||||||||
| Total assets |
$ | 1,033,918 | $ | 4,945 | $ | (1,503) | $ | 1,037,360 | ||||||||
|
|
|
|
|
|
|
|
|
|||||||||
62
Table of Contents
| (dollars in thousands) | Banking |
Wealth |
Other
and |
Total | ||||||||||||
| Deposits |
$ | 809,306 | $ | - | $ | (7,269) | $ | 802,037 | ||||||||
| Borrowings |
134,000 | - | 7,063 | 141,063 | ||||||||||||
| Intercompany balances |
857 | 248 | (1,105) | - | ||||||||||||
| Other liabilities |
4,018 | 2,590 | 890 | 7,498 | ||||||||||||
| Shareholders’ equity |
85,737 | 2,107 | (1,082) | 86,762 | ||||||||||||
|
|
|
|
|
|
|
|
|
|||||||||
| Total liabilities and equity |
$ | 1,033,918 | $ | 4,945 | $ | (1,503) | $ | 1,037,360 | ||||||||
|
|
|
|
|
|
|
|
|
|||||||||
| December 31, 2012: |
||||||||||||||||
| Cash and cash equivalents |
$ | 62,965 | $ | 1,895 | $ | (1,752) | $ | 63,108 | ||||||||
| Securities AFS |
5,813 | - | - | 5,813 | ||||||||||||
| Loans, net |
734,778 | 509 | - | 735,287 | ||||||||||||
| Premises and equipment |
1,661 | 657 | 66 | 2,384 | ||||||||||||
| FHLB Stock |
8,500 | - | - | 8,500 | ||||||||||||
| Deferred taxes |
8,734 | 981 | 340 | 10,055 | ||||||||||||
| REO |
650 | - | - | 650 | ||||||||||||
| Other assets |
3,509 | 638 | 565 | 4,712 | ||||||||||||
|
|
|
|
|
|
|
|
|
|||||||||
| Total assets |
$ | 826,610 | $ | 4,680 | $ | (781) | $ | 830,509 | ||||||||
|
|
|
|
|
|
|
|
|
|||||||||
| Deposits |
$ | 653,671 | $ | - | $ | (3,930) | $ | 649,741 | ||||||||
| Borrowings |
100,000 | - | - | 100,000 | ||||||||||||
| Intercompany balances |
1,451 | 205 | (1,656) | - | ||||||||||||
| Other liabilities |
3,302 | 2,168 | 1,718 | 7,188 | ||||||||||||
| Shareholders’ equity |
68,186 | 2,307 | 3,087 | 73,580 | ||||||||||||
|
|
|
|
|
|
|
|
|
|||||||||
| Total liabilities and equity |
$ | 826,610 | $ | 4,680 | $ | (781) | $ | 830,509 | ||||||||
|
|
|
|
|
|
|
|
|
|||||||||
Our consolidated balance sheet is primarily affected by changes occurring in our Banking operations as our Wealth Management operations do not maintain significant levels of assets. Banking has experienced and is expected to continue to experience increases in its total assets as a result of our growth strategy.
During the first quarter of 2014, total assets for the Company and FFB increased by $53 million. For FFB, during the first quarter of 2014, loans and deposits increased $45.2 million and $52.6 million, respectively, cash and cash equivalents decreased by $6.8 million, securities AFS increased by $14.1 million and FHLB advances decreased by $15.0 million. Borrowings at FFI increased by $14.8 million during the first quarter of 2014. During 2013, total assets for the Company and FFB increased by $207 million. For FFB, during 2013, loans and deposits increased $160.2 million and $155.6 million, respectively, cash and cash equivalents decreased by $6.2 million, securities AFS increased by $53.3 million and FHLB advances increased by $34.0 million. Borrowings at FFI increased by $7.1 million during 2013. During 2012, our consolidated total assets increased by $278.9 million primarily due to a $278.0 million increase in assets at FFB. As a result of the DCB Acquisition, FFB’s total assets and deposits increased $139.9 million and $126.9 million, respectively, in 2012. Excluding the DCB Acquisition, loans and deposits at FFB increased $129.6 million and $116.9 million, respectively during 2012.
Cash and cash equivalents, certificates of deposit and securities: Cash and cash equivalents, which primarily consist of funds held at the Federal Reserve Bank or at correspondent banks, including fed funds, decreased $6.8 million during the first quarter of 2014 and decreased $6.2 million during 2013. Changes in cash equivalents are primarily affected by the funding of loans, investments in securities, and changes in our sources of funding: deposits, FHLB advances and FFI borrowings. The $53.0 million increase in cash and cash equivalents during 2012 includes the $34.9 million received in the DCB Acquisition.
63
Table of Contents
Securities available for sale: The following table provides a summary of the Company’s AFS securities portfolio as of:
| Amortized Cost |
Gross Unrealized | Estimated Fair Value |
||||||||||||||
| (dollars in thousands) | Gains | Losses | ||||||||||||||
| March 31, 2014: |
||||||||||||||||
| US Treasury security |
$ | 300 | $ | - | $ | - | $ | 300 | ||||||||
| FNMA and FHLB Agency notes |
10,496 | - | (528) | 9,968 | ||||||||||||
| Agency mortgage-backed securities |
64,329 | 108 | (1,448) | 62,989 | ||||||||||||
|
|
|
|
|
|
|
|
|
|||||||||
| Total |
$ | 75,125 | $ | 108 | $ | (1,976) | $ | 73,257 | ||||||||
|
|
|
|
|
|
|
|
|
|||||||||
| December 31, 2013: |
||||||||||||||||
| US Treasury security |
$ | 300 | $ | - | $ | - | $ | 300 | ||||||||
| FNMA and FHLB Agency notes |
10,496 | - | (716) | 9,780 | ||||||||||||
| Agency mortgage-backed securities |
50,983 | - | (1,952) | 49,031 | ||||||||||||
|
|
|
|
|
|
|
|
|
|||||||||
| Total |
$ | 61,779 | $ | - | $ | (2,668) | $ | 59,111 | ||||||||
|
|
|
|
|
|
|
|
|
|||||||||
| December 31, 2012: |
||||||||||||||||
| US Treasury Securities |
$ | 300 | $ | - | $ | - | $ | 300 | ||||||||
| FHLB Agency Notes |
5,513 | - | - | 5,513 | ||||||||||||
|
|
|
|
|
|
|
|
|
|||||||||
| Total |
$ | 5,813 | $ | - | $ | - | $ | 5,813 | ||||||||
|
|
|
|
|
|
|
|
|
|||||||||
| December 31, 2011: |
||||||||||||||||
| US Treasury Securities |
$ | 200 | $ | - | $ | - | $ | 200 | ||||||||
| FHLB Agency Note |
10,000 | - | (14) | 9,986 | ||||||||||||
|
|
|
|
|
|
|
|
|
|||||||||
| Total |
$ | 10,200 | $ | - | $ | (14) | $ | 10,186 | ||||||||
|
|
|
|
|
|
|
|
|
|||||||||
The US Treasury Securities are pledged as collateral to the State of California to meet regulatory requirements related to FFB’s trust operations.
The $14.1 million increase in AFS Securities during in the first quarter of 2014 and the $53.3 million increase in AFS Securities during 2013 reflected our actions to increase our on-balance sheet sources of liquidity.
The scheduled maturities of securities AFS, other than agency mortgage backed securities, and the related weighted average yield is as follows as of March 31, 2014:
| (dollars in thousands) | Less than 1 Year |
1 Through 5 years |
5 Through 10 Years |
After 10 Years |
Total | |||||||||||||||
| Amortized Cost: |
||||||||||||||||||||
| US Treasury securities |
$ | 300 | $ | - | $ | - | $ | - | $ | 300 | ||||||||||
| FNMA and FHLB Agency notes |
- | - | 10,496 | - | 10,496 | |||||||||||||||
|
|
|
|
|
|
|
|
|
|
|
|||||||||||
| Total |
$ | 300 | $ | - | $ | 10,496 | $ | - | $ | 10,796 | ||||||||||
|
|
|
|
|
|
|
|
|
|
|
|||||||||||
| Weighted average yield |
0.21% | 0.00% | 1.78% | 0.00% | 1.74% | |||||||||||||||
|
|
|
|
|
|
|
|
|
|
|
|||||||||||
| Estimated Fair Value: |
||||||||||||||||||||
| US Treasury securities |
$ | 300 | $ | - | $ | - | $ | - | $ | 300 | ||||||||||
| FNMA and FHLB Agency notes |
- | - | 9,968 | - | 9,968 | |||||||||||||||
|
|
|
|
|
|
|
|
|
|
|
|||||||||||
| Total |
$ | 300 | $ | - | $ | 9,968 | $ | - | $ | 10,268 | ||||||||||
|
|
|
|
|
|
|
|
|
|
|
|||||||||||
Agency mortgage backed securities are excluded from the above table because such securities are not due at a single maturity date. The weighted average yield of the agency mortgage backed securities as of March 31, 2014 was 2.57%.
64
Table of Contents
Loans. The following table sets forth our loans, by loan category, as of:
| (dollars in thousands) | March 31, 2014 |
December 31, 2013 |
December 31, 2012 |
December 31, 2011 |
December 31, 2010 |
December 31, 2009 |
||||||||||||||||||
| Outstanding principal balance: |
||||||||||||||||||||||||
| Loans secured by real estate: |
||||||||||||||||||||||||
| Residential properties: |
||||||||||||||||||||||||
| Multifamily |
$ | 401,877 | $ | 405,984 | $ | 367,412 | $ | 320,053 | $ | 196,059 | $ | 124,120 | ||||||||||||
| Single family |
263,922 | 227,096 | 155,864 | 85,226 | 44,281 | 20,019 | ||||||||||||||||||
|
|
|
|
|
|
|
|
|
|
|
|
|
|||||||||||||
| Total real estate loans secured by residential properties |
665,799 | 633,080 | 523,276 | 405,279 | 240,340 | 144,139 | ||||||||||||||||||
| Commercial properties |
166,290 | 154,982 | 132,217 | 75,542 | 57,633 | 33,028 | ||||||||||||||||||
| Land and construction |
2,345 | 3,794 | 7,575 | – | – | – | ||||||||||||||||||
|
|
|
|
|
|
|
|
|
|
|
|
|
|||||||||||||
| Total real estate loans |
834,434 | 791,856 | 663,068 | 480,821 | 297,973 | 177,167 | ||||||||||||||||||
| Commercial and industrial loans |
97,248 | 93,255 | 67,920 | 35,377 | 30,696 | 13,821 | ||||||||||||||||||
| Consumer loans |
17,201 | 18,484 | 12,585 | 8,012 | 8,582 | 10,263 | ||||||||||||||||||
|
|
|
|
|
|
|
|
|
|
|
|
|
|||||||||||||
| Total loans |
948,883 | 903,595 | 743,573 | 524,210 | 337,251 | 201,251 | ||||||||||||||||||
| Premiums, discounts and deferred fees and expenses |
(39 | ) | 50 | 54 | (107 | ) | (71 | ) | 20 | |||||||||||||||
|
|
|
|
|
|
|
|
|
|
|
|
|
|||||||||||||
| Total |
$ | 948,844 | $ | 903,645 | $ | 743,627 | $ | 524,103 | $ | 337,180 | $ | 201,271 | ||||||||||||
|
|
|
|
|
|
|
|
|
|
|
|
|
|||||||||||||
The $45.2 million increase in loans during the first quarter of 2014 was the result of loan originations and funding of existing credit commitments of $91.8 million, offset by $46.6 million of payoffs and scheduled principal payments. The $160.0 million increase in loans during 2013 was the result of loan originations and funding of existing credit commitments of $353.4 million, offset by $193.4 million of payoffs and scheduled principal payments. During 2012, the $219.5 million increase in loans was the result of $90.1 million in loans acquired in the DCB Acquisition and loan originations and funding of existing credit commitments of $279.4 million, partially offset by $150.0 million of payoffs and scheduled principal payments.
The scheduled maturities, as of December 31, 2013, of the performing loans categorized as land and construction loans and as commercial and industrial loans, are as follows:
| Scheduled Maturity | Loans With a Scheduled Maturity After One Year |
|||||||||||||||||||
| (dollars in thousands) | Due in One Year or Less |
Due After One Year Through Five Years |
Due After Five Years |
Loans With Fixed Rates |
Loan With Adjustable Rates |
|||||||||||||||
| Land and construction loans |
$ | 2,933 | $ | 19 | $ | 842 | $ | 19 | $ | 842 | ||||||||||
| Commercial and industrial loans |
$ | 50,272 | $ | 17,968 | $ | 24,671 | $ | 41,775 | $ | 864 | ||||||||||
65
Table of Contents
Deposits: The following table sets forth information with respect to our deposits and the average rates paid on deposits, as of:
| March 31, 2014 | December 31, 2013 | December 31, 2012 | December 31, 2011 | |||||||||||||||||||||||||||||
| (dollars in thousands) |
Amount | Weighted Average Rate |
Amount | Weighted Average Rate |
Amount | Weighted Average Rate |
Amount | Weighted Average Rate |
||||||||||||||||||||||||
| Demand deposits: |
||||||||||||||||||||||||||||||||
| Noninterest- |
$ | 225,473 | - | $ | 217,782 | - | $ | 131,827 | - | $ | 66,383 | - | ||||||||||||||||||||
| Interest-bearing |
228,587 | 0.497% | 217,129 | 0.504% | 103,085 | 0.558% | 13,411 | 0.622% | ||||||||||||||||||||||||
| Money market and savings |
125,872 | 0.496% | 121,260 | 0.499% | 91,278 | 0.488% | 75,534 | 0.589% | ||||||||||||||||||||||||
| Certificates of deposits |
274,752 | 0.557% | 245,866 | 0.606% | 323,551 | 0.732% | 251,498 | 0.895% | ||||||||||||||||||||||||
|
|
|
|
|
|
|
|
|
|||||||||||||||||||||||||
| Total |
$ | 854,684 | 0.385% | $ | 802,037 | 0.398% | $ | 649,741 | 0.522% | $ | 406,826 | 0.683% | ||||||||||||||||||||
|
|
|
|
|
|
|
|
|
|||||||||||||||||||||||||
The $52.6 million increase in deposits during the first quarter of 2014, the $152.3 million increase in deposits during 2013 and, excluding the $126.9 million in deposits acquired in the DCB Acquisition, the $116.9 million increase in deposits during 2012, reflects the organic growth of our Banking operations.
As market interest rates have continued to decline, FFB has been able to lower the cost of its deposit products. As a result, the weighted average rate of interest-bearing deposits has decreased from 0.65% at December 31, 2012 to 0.55% at December 31, 2013 to 0.52% at March 31, 2014, while the weighted average interest rates of both interest-bearing and noninterest-bearing deposits have decreased from 0.52% at December 31, 2012 to 0.40% at December 31, 2013 to 0.39% at March 31, 2014.
The maturities of our certificates of deposit of $100,000 or more were as follows as of March 31, 2014:
| (dollars in thousands) | ||||
| 3 months or less |
$ | 85,390 | ||
| Over 3 months through 6 months |
86,705 | |||
| Over 6 months through 12 months |
61,081 | |||
| Over 12 months |
25,715 | |||
|
|
|
|||
| Total |
$ | 258,891 | ||
|
|
|
|||
FFB utilizes a third party program called CDARs which allows FFB to transfer funds of its clients in excess of the FDIC insurance limit (currently $250,000) to other institutions in exchange for an equal amount of funds from clients of these other institutions. This has allowed FFB to provide FDIC insurance coverage to its clients. As of March 31, 2014 FFB held $95.1 million of CDARs deposits. Under certain regulatory guidelines, these deposits are considered brokered deposits. As of March 31, 2014, FFB did not have any other brokered certificates of deposit.
Borrowings: At March 31, 2014, our borrowings consisted of $119.0 million of overnight FHLB advances at FFB and a $21.9 million term loan at FFI. At December 31, 2013, our borrowings consisted of $134.0 million of overnight FHLB advances at FFB and a $7.1 million term loan at FFI. At December 31, 2012, our borrowings consisted of $100.0 million of overnight FHLB advances. These FHLB advances were paid in full in the early parts of April, 2014, January 2014 and January 2013, respectively. Because FFB utilizes overnight borrowings, the balance of outstanding borrowings fluctuates on a daily basis. The average balance of overnight borrowings during the first quarter of 2014 was $144.5 million, as compared to $79.2 million during 2013, $99.3 million during 2012 and $60.4 million during 2011. The weighted average interest rate on these overnight borrowings was 0.13% for the first quarter of 2014, as compared to 0.15% during 2013, 0.23% during 2012 and 0.15% during 2011. The maximum amount of overnight borrowings
66
Table of Contents
outstanding at any month-end during the first quarter of 2014, during 2013, and during 2012 and during 2011, was $161.0 million, $134.0 million, and $197.0 million and $114.0 million, respectively.
Term Loan. In the second quarter of 2013, we entered into a loan agreement to borrow $7.5 million for a term of five years. This note bears interest at a rate of ninety day Libor plus 4.0% per annum. In the first quarter of 2014, we entered into an amendment to this loan agreement pursuant to which we obtained an additional $15,000,000 of borrowings. As a result, as of March 31, 2014, the outstanding principal amount of the loan was $21,875,000. This amendment did not alter any of the terms of the loan agreement or the loan, other than the $15,000,000 increase in the principal amount of the loan and a corresponding increase in the amount of the monthly installments of principal and interest payable on the Loan. The amended loan agreement requires us to make monthly payments of principal of $0.2 million plus interest, with a final payment of the unpaid principal balance, in the amount of approximately $12.1 million, plus accrued but unpaid interest, at the maturity date of the loan in May 2018. We have the right, in our discretion, to prepay all or a portion of the loan at any time, without any penalties or premium. We have pledged all of the common stock of FFB to the lender as security for the performance of our payment and other obligations under the loan agreement. The loan agreement obligates us to meet certain financial covenants, including the following:
| • | a Tier 1 capital (leverage) ratio at FFB of at least 5.0% at the end of each calendar quarter; |
| • | a total risk-based capital ratio at FFB of not less than 10.0% at the end of each calendar quarter; |
| • | a ratio at FFB of nonperforming assets to net tangible capital, as adjusted, plus our ALLL, of not more than 40.0% at the end of each calendar quarter; |
| • | a ratio at FFB of classified assets to tier 1 capital, plus our ALLL, of no more than 50.0% at the end of each calendar quarter; |
| • | a consolidated fixed charge coverage ratio of not less than 1.50 to 1.0, measured quarterly for the immediately preceding 12 months; and |
| • | minimum liquidity at all times of not less than $1.0 million. |
As of March 31, 2014, we were in compliance with all of those financial covenants.
The loan agreement also prohibits FFI (but not FFB or FFA) from doing any of the following without the lender’s prior approval: (i) paying any cash dividends to our shareholders, (ii) incurring any other indebtedness, (iii) granting any security interests or permitting the imposition of any liens, other than certain permitted liens, on any of FFI’s assets, or (iv) entering into significant merger or acquisition transactions outside of our banking operations. The loan agreement provides that if we fail to pay principal or interest when due, or we commit a breach of any of our other obligations or covenants in the loan agreement, or certain events occur that adversely affect us, then, unless we are able to cure such a breach, we will be deemed to be in default of the loan agreement and the lender will become entitled to require us to immediately pay in full the then principal amount of and all unpaid interest on the loan. If in any such event we fail to repay the loan and all accrued but unpaid interest, then the lender would become entitled to sell our FFB shares which we pledged as security for the loan in order to recover the amounts owed to it.
We plan to use a $21.5 million of the net proceeds from this offering to pay the entire outstanding principal balance of this loan, together with accrued but unpaid interest due the lender. See “Use of Proceeds” elsewhere in this prospectus. The lender is contractually obligated, upon repayment in full of the loan, to release its pledge and security interest in our FFB shares.
67
Table of Contents
Delinquent Loans, Nonperforming Assets and Provision for Credit Losses
Loans are considered past due following the date when either interest or principal is contractually due and unpaid. Loans on which the accrual of interest has been discontinued are designated as nonaccrual loans. Accrual of interest on loans is discontinued when reasonable doubt exists as to the full, timely collection of interest or principal and, generally, when a loan becomes contractually past due for 90 days or more with respect to principal or interest. However, the accrual of interest may be continued on a well-secured loan contractually past due 90 days or more with respect to principal or interest if the loan is in the process of collection or collection of the principal and interest is deemed probable. The following tables provide a summary of past due and nonaccrual loans as of:
| Past Due and Still Accruing | Total Past Due and Nonaccrual |
|||||||||||||||||||||||||||
| (dollars in thousands) | 30–59 Days | 60-89 Days | 90 Days or More |
Nonaccrual | Current | Total | ||||||||||||||||||||||
| March 31, 2014: |
||||||||||||||||||||||||||||
| Real estate loans: |
||||||||||||||||||||||||||||
| Residential properties |
$ | - | $ | - | $ | - | $ | 3,057 | $ | 3,057 | $ | 662,742 | $ 665,799 | |||||||||||||||
| Commercial properties |
338 | - | - | 598 | 936 | 165,354 | 166,290 | |||||||||||||||||||||
| Land and construction |
- | - | - | - | - | 2,345 | 2,345 | |||||||||||||||||||||
| Commercial and industrial loans | 959 | - | 2,950 | 344 | 4,253 | 92,995 | 97,248 | |||||||||||||||||||||
| Consumer loans |
- | - | - | 130 | 130 | 17,071 | 17,201 | |||||||||||||||||||||
|
|
|
|
|
|
|
|
|
|
|
|
|
|
|
|||||||||||||||
| Total |
$ | 1,297 | $ | - | $ | 2,950 | $ | 4,129 | $ | 8,376 | $ | 940,507 | $ 948,883 | |||||||||||||||
|
|
|
|
|
|
|
|
|
|
|
|
|
|
|
|||||||||||||||
| Percentage of total loans |
0.14% | 0.00% | 0.31% | 0.44% | 0.88% | |||||||||||||||||||||||
| December 31, 2013: |
||||||||||||||||||||||||||||
| Real estate loans: |
||||||||||||||||||||||||||||
| Residential properties |
$ | - | $ | - | $ | - | $ | 1,820 | $ | 1,820 | $ | 631,260 | $ 633,080 | |||||||||||||||
| Commercial properties |
- | - | 417 | 598 | 1,015 | 153,967 | 154,982 | |||||||||||||||||||||
| Land and construction |
- | - | 1,480 | - | 1,480 | 2,314 | 3,794 | |||||||||||||||||||||
| Commercial and industrial loans | - | 2,744 | 1,315 | 344 | 4,403 | 88,852 | 93,255 | |||||||||||||||||||||
| Consumer loans |
- | - | - | 132 | 132 | 18,352 | 18,484 | |||||||||||||||||||||
|
|
|
|
|
|
|
|
|
|
|
|
|
|
|
|||||||||||||||
| Total |
$ | - | $ | 2,744 | $ | 3,212 | $ | 2,894 | $ | 8,850 | $ | 894,745 | $ 903,595 | |||||||||||||||
|
|
|
|
|
|
|
|
|
|
|
|
|
|
|
|||||||||||||||
| Percentage of total loans |
0.00% | 0.30% | 0.36% | 0.32% | 0.98% | |||||||||||||||||||||||
| December 31, 2012: |
||||||||||||||||||||||||||||
| Real estate loans: |
||||||||||||||||||||||||||||
| Residential properties |
$ | - | $ | - | $ | - | $ | 146 | $ | 146 | $ | 523,130 | $ 523,276 | |||||||||||||||
| Commercial properties |
2,012 | - | - | - | 2,012 | 130,205 | 132,217 | |||||||||||||||||||||
| Land and construction |
- | - | 3,169 | 524 | 3,693 | 3,882 | 7,575 | |||||||||||||||||||||
| Commercial and industrial loans | 1,188 | 1,113 | 11 | 97 | 2,409 | 65,511 | 67,920 | |||||||||||||||||||||
| Consumer loans |
- | 147 | - | - | 147 | 12,438 | 12,585 | |||||||||||||||||||||
|
|
|
|
|
|
|
|
|
|
|
|
|
|
|
|||||||||||||||
| Total |
$ | 3,200 | $ | 1,260 | $ | 3,180 | $ | 767 | $ | 8,407 | $ | 735,166 | $ 743,573 | |||||||||||||||
|
|
|
|
|
|
|
|
|
|
|
|
|
|
|
|||||||||||||||
| Percentage of total loans |
0.43% | 0.17% | 0.43% | 0.10% | 1.13% | |||||||||||||||||||||||
The amount of delinquent loans and nonaccrual loans have been adversely impacted by the loans acquired in the DCB Acquisition. As of March 31, 2014, the Company had $0.1 million of loans classified as troubled debt restructurings, which are included as nonaccrual loans in the table above.
As of December 31, 2011, the Company had $0.5 million of loans 30 to 59 days past due which represented 0.10% of total loans outstanding. The Company did not have any loans over 60 days past due as of December 31, 2011.
68
Table of Contents
The Company did not have any loans over 30 days past due as of December 31, 2010 and December 31, 2009. The Company did not have any loans classified as nonaccrual as of December 31, 2011, December 31, 2010 or December 31, 2009.
The following is a breakdown of our loan portfolio by the risk category of loans as of:
| (dollars in thousands) | Pass | Special Mention |
Substandard | Impaired | Total | |||||||||||||||
| March 31, 2014: |
||||||||||||||||||||
| Real estate loans: |
||||||||||||||||||||
| Residential properties |
$ | 662,315 | $ | - | $ | - | $ | 3,484 | $ | 665,799 | ||||||||||
| Commercial properties |
161,739 | - | 3,734 | 817 | 166,290 | |||||||||||||||
| Land and construction |
2,345 | - | - | - | 2,345 | |||||||||||||||
| Commercial and industrial loans |
92,213 | 35 | 2,032 | 2,968 | 97,248 | |||||||||||||||
| Consumer loans |
17,028 | - | 173 | - | 17,201 | |||||||||||||||
|
|
|
|
|
|
|
|
|
|
|
|||||||||||
| Total |
$ | 935,640 | $ | 35 | $ | 5,939 | $ | 7,269 | $ | 948,883 | ||||||||||
|
|
|
|
|
|
|
|
|
|
|
|||||||||||
| December 31, 2013: |
||||||||||||||||||||
| Real estate loans: |
||||||||||||||||||||
| Residential properties |
$ | 630,832 | $ | - | $ | - | $ | 2,248 | $ | 633,080 | ||||||||||
| Commercial properties |
150,053 | - | 4,108 | 821 | 154,982 | |||||||||||||||
| Land and construction |
2,314 | - | 1,480 | - | 3,794 | |||||||||||||||
| Commercial and industrial loans |
88,166 | 43 | 2,047 | 2,999 | 93,255 | |||||||||||||||
| Consumer loans |
18,309 | - | 175 | - | 18,484 | |||||||||||||||
|
|
|
|
|
|
|
|
|
|
|
|||||||||||
| Total |
$ | 889,674 | $ | 43 | $ | 7,810 | $ | 6,068 | $ | 903,595 | ||||||||||
|
|
|
|
|
|
|
|
|
|
|
|||||||||||
| December 31, 2012: |
||||||||||||||||||||
| Real estate loans: |
||||||||||||||||||||
| Residential properties |
$ | 519,288 | $ | - | $ | 1,731 | $ | 2,257 | $ | 523,276 | ||||||||||
| Commercial properties |
127,803 | - | 4,414 | - | 132,217 | |||||||||||||||
| Land and construction |
3,818 | - | 3,214 | 543 | 7,575 | |||||||||||||||
| Commercial and industrial loans |
62,000 | 889 | 2,295 | 2,736 | 67,920 | |||||||||||||||
| Consumer loans |
12,387 | 127 | 71 | - | 12,585 | |||||||||||||||
|
|
|
|
|
|
|
|
|
|
|
|||||||||||
| Total |
$ | 725,296 | $ | 1,016 | $ | 11,725 | $ | 5,536 | $ | 743,573 | ||||||||||
|
|
|
|
|
|
|
|
|
|
|
|||||||||||
| December 31, 2011: |
||||||||||||||||||||
| Real estate loans: |
||||||||||||||||||||
| Residential properties |
$ | 402,630 | $ | 291 | $ | 2,358 | - | $ | 405,279 | |||||||||||
| Commercial properties |
75,542 | - | - | - | 75,542 | |||||||||||||||
| Commercial and industrial loans |
31,627 | 3,750 | - | - | 35,377 | |||||||||||||||
| Consumer loans |
7,860 | 152 | - | - | 8,012 | |||||||||||||||
|
|
|
|
|
|
|
|
|
|
|
|||||||||||
| Total |
$ | 517,659 | $ | 4,193 | $ | 2,358 | - | $ | 524,210 | |||||||||||
|
|
|
|
|
|
|
|
|
|
|
|||||||||||
| December 31, 2010: |
||||||||||||||||||||
| Real estate loans: |
||||||||||||||||||||
| Residential properties |
$ | 240,340 | $ | - | $ | - | - | $ | 240,340 | |||||||||||
| Commercial properties |
57,633 | - | - | - | 57,633 | |||||||||||||||
| Commercial and industrial loans |
26,743 | 3,721 | 232 | - | 30,696 | |||||||||||||||
| Consumer loans |
8,403 | 179 | - | - | 8,582 | |||||||||||||||
|
|
|
|
|
|
|
|
|
|
|
|||||||||||
| Total |
$ | 333,119 | $ | 3,900 | $ | 232 | - | $ | 337,251 | |||||||||||
|
|
|
|
|
|
|
|
|
|
|
|||||||||||
| December 31, 2009: |
||||||||||||||||||||
| Real estate loans: |
||||||||||||||||||||
| Residential properties |
$ | 144,139 | $ | - | $ | - | - | $ | 144,139 | |||||||||||
| Commercial properties |
33,028 | - | - | - | 33,028 | |||||||||||||||
| Commercial and industrial loans |
13,577 | 244 | - | - | 13,821 | |||||||||||||||
| Consumer loans |
10,263 | - | - | - | 10,263 | |||||||||||||||
|
|
|
|
|
|
|
|
|
|
|
|||||||||||
| Total |
$ | 201,007 | $ | 244 | $ | - | - | $ | 201,251 | |||||||||||
|
|
|
|
|
|
|
|
|
|
|
|||||||||||
69
Table of Contents
As of March 31, 2014, $5.9 million of the loans classified as substandard and $1.0 million of the loans classified as impaired were loans acquired in the DCB acquisition.
We consider a loan to be impaired when, based upon current information and events, we believe that it is probable that we will be unable to collect all amounts due according to the contractual terms of the loan. We measure impairment using either the present value of the expected future cash flows discounted at the loan’s effective interest rate, or the fair value of the properties collateralizing the loan. Impairment losses are included in the allowance for loan losses through a charge to provision for loan losses. Adjustments to impairment losses due to changes in the fair value of the property collateralizing an impaired loan are considered in computing the provision for loan losses. Loans collectively reviewed for impairment include all loans except for loans which are individually reviewed based on specific criteria, such as delinquency, debt coverage, adequacy of collateral and condition of property collateralizing the loans. Impaired loans include nonaccrual loans (excluding those collectively reviewed for impairment), certain restructured loans and certain performing loans less than ninety days delinquent (“other impaired loans”) which we believe are not likely to be collected in accordance with contractual terms of the loans.
In 2012, we purchased loans, for which there was, at acquisition, evidence of deterioration of credit quality since origination and it was probable, at acquisition, that all contractually required payments would not be collected. The carrying amount of these purchased credit impaired loans is as follows as of:
| (dollars in thousands) | March 31, 2014 | December 31, 2013 | December 31, 2012 | |||||||||
| Outstanding principal balance: |
||||||||||||
| Loans secured by real estate: |
||||||||||||
| Residential properties |
$ | - | $ | - | $ | 2,574 | ||||||
| Commercial properties |
5,007 | 5,543 | 5,567 | |||||||||
| Land and construction |
- | 2,331 | 6,137 | |||||||||
|
|
|
|
|
|
|
|||||||
| Total real estate loans |
5,007 | 7,874 | 14,278 | |||||||||
| Commercial and industrial loans |
2,467 | 2,489 | 2,621 | |||||||||
| Consumer loans |
257 | 260 | 276 | |||||||||
|
|
|
|
|
|
|
|||||||
| Total loans |
7,731 | 10,623 | 17,175 | |||||||||
| Unaccreted discount on purchased credit impaired loans |
(1,921) | (2,945) | (5,782) | |||||||||
|
|
|
|
|
|
|
|||||||
| Total |
$ | 5,810 | $ | 7,678 | $ | 11,393 | ||||||
|
|
|
|
|
|
|
|||||||
Allowance for Loan Losses.
The following table summarizes the activity in our ALLL for the periods indicated:
| (dollars in thousands) | Beginning Balance |
Provision for Loan Losses |
Charge-offs | Recoveries | Ending Balance |
|||||||||||||||
| Quarter ended March 31, 2014: |
||||||||||||||||||||
| Real estate loans: |
||||||||||||||||||||
| Residential properties |
$ | 6,157 | $ | 98 | $ | - | $ | - | $ | 6,255 | ||||||||||
| Commercial properties |
1,440 | 153 | - | - | 1,593 | |||||||||||||||
| Commercial and industrial loans |
2,149 | 8 | - | - | 2,157 | |||||||||||||||
| Consumer loans |
169 | (24) | - | - | 145 | |||||||||||||||
|
|
|
|
|
|
|
|
|
|
|
|||||||||||
| Total |
$ | 9,915 | $ | 235 | $ | - | $ | - | $ | 10,150 | ||||||||||
|
|
|
|
|
|
|
|
|
|
|
|||||||||||
| Year ended December 31, 2013: |
||||||||||||||||||||
| Real estate loans: |
||||||||||||||||||||
| Residential properties |
$ | 4,355 | $ | 1,802 | $ | - | $ | - | $ | 6,157 | ||||||||||
| Commercial properties |
936 | 561 | (57) | - | 1,440 | |||||||||||||||
| Commercial and industrial loans |
2,841 | 71 | (763) | - | 2,149 | |||||||||||||||
| Consumer loans |
208 | (39) | - | - | 169 | |||||||||||||||
|
|
|
|
|
|
|
|
|
|
|
|||||||||||
| Total |
$ | 8,340 | $ | 2,395 | $ | (820) | $ | - | $ | 9,915 | ||||||||||
|
|
|
|
|
|
|
|
|
|
|
|||||||||||
70
Table of Contents
| (dollars in thousands) | Beginning Balance |
Provision for Loan Losses |
Charge-offs | Recoveries | Ending Balance |
|||||||||||||||
| Year ended December 31, 2012: |
||||||||||||||||||||
| Real estate loans: |
||||||||||||||||||||
| Residential properties |
$ | 3,984 | $ | 646 | $ | (275) | $ | - | $ | 4,355 | ||||||||||
| Commercial properties |
1,218 | (282) | - | - | 936 | |||||||||||||||
| Commercial and industrial loans |
1,104 | 1,737 | - | - | 2,841 | |||||||||||||||
| Consumer loans |
244 | (36) | - | - | 208 | |||||||||||||||
|
|
|
|
|
|
|
|
|
|
|
|||||||||||
| Total |
$ | 6,550 | $ | 2,065 | $ | (275) | $ | - | $ | 8,340 | ||||||||||
|
|
|
|
|
|
|
|
|
|
|
|||||||||||
| Year ended December 31, 2011: |
||||||||||||||||||||
| Real estate loans: |
||||||||||||||||||||
| Residential properties |
$ | 2,185 | $ | 1,524 | $ | - | $ | 275 | $ | 3,984 | ||||||||||
| Commercial properties |
900 | 318 | - | - | 1,218 | |||||||||||||||
| Commercial and industrial loans |
955 | 381 | (232) | - | 1,104 | |||||||||||||||
| Consumer loans |
170 | 74 | - | - | 244 | |||||||||||||||
|
|
|
|
|
|
|
|
|
|
|
|||||||||||
| Total |
$ | 4,210 | $ | 2,297 | $ | (232) | $ | 275 | $ | 6,550 | ||||||||||
|
|
|
|
|
|
|
|
|
|
|
|||||||||||
| Year ended December 31, 2010: |
||||||||||||||||||||
| Real estate loans: |
||||||||||||||||||||
| Residential properties |
$ | 1,379 | $ | 806 | $ | - | $ | - | $ | 2,185 | ||||||||||
| Commercial properties |
333 | 567 | - | - | 900 | |||||||||||||||
| Commercial and industrial loans |
413 | 542 | - | - | 955 | |||||||||||||||
| Consumer loans |
385 | (215) | - | - | 170 | |||||||||||||||
|
|
|
|
|
|
|
|
|
|
|
|||||||||||
| Total |
$ | 2,510 | $ | 1,700 | $ | - | $ | - | $ | 4,210 | ||||||||||
|
|
|
|
|
|
|
|
|
|
|
|||||||||||
| Year ended December 31, 2009: |
||||||||||||||||||||
| Real estate loans: |
||||||||||||||||||||
| Residential properties |
$ | 818 | $ | 561 | $ | - | $ | - | $ | 1,379 | ||||||||||
| Commercial properties |
165 | 268 | - | - | 333 | |||||||||||||||
| Land |
100 | 175 | (275) | - | - | |||||||||||||||
| Commercial and industrial loans |
135 | 278 | - | - | 413 | |||||||||||||||
| Consumer loans |
12 | 373 | - | - | 385 | |||||||||||||||
|
|
|
|
|
|
|
|
|
|
|
|||||||||||
| Total |
$ | 1,130 | $ | 1,655 | $ | (275) | $ | - | $ | 2,510 | ||||||||||
|
|
|
|
|
|
|
|
|
|
|
|||||||||||
Excluding the loans acquired in the DCB Acquisition, our ALLL as a percentage of total loans was 1.08%, 1.16% and 1.25% as of March 31, 2014, December 31, 2013, and December 31, 2012, respectively.
The amount of the ALLL is adjusted periodically by charges to operations (referred to in our income statement as the “provision for loan losses”) (i) to replenish the ALLL after it has been reduced due to loan write-downs or charge-offs, (ii) to reflect increases in the volume of outstanding loans, and (iii) to take account of changes in the risk of potential loan losses due to a deterioration in the condition of borrowers or in the value of property securing non–performing loans or adverse changes in economic conditions. The amounts of the provisions we make for loan losses are based on our estimate of losses in our loan portfolio. In estimating such losses, we use economic and loss migration models that are based on bank regulatory guidelines and industry standards, and our historical charge-off experience and loan delinquency rates, local and national economic conditions, a borrower’s ability to repay its borrowings, and the value of any property collateralizing the loan, as well as a number of subjective factors. However, these determinations involve judgments about changes and trends in current
71
Table of Contents
economic conditions and other events that can affect the ability of borrowers to meet their loan obligations to us and a weighting among the quantitative and qualitative factors we consider in determining the sufficiency of the ALLL. Moreover, the duration and anticipated effects of prevailing economic conditions or trends can be uncertain and can be affected by a number of risks and circumstances that are outside of our control. If changes in economic or market conditions or unexpected subsequent events were to occur, or if changes were made to bank regulatory guidelines or industry standards that are used to assess the sufficiency of the ALLL, it could become necessary for us to incur additional, and possibly significant, charges to increase the ALLL, which would have the effect of reducing our income.
In addition, the FDIC and the DBO, as an integral part of their examination processes, periodically review the adequacy of our ALLL. These agencies may require us to make additional provisions for loan losses, over and above the provisions that we have already made, the effect of which would be to reduce our income.
The following table presents the balance in the ALLL and the recorded investment in loans by impairment method as of:
| (dollars in thousands) | Allowance for Loan Losses | Unaccreted Credit Component Other Loans |
||||||||||||||||||
| Evaluated for Impairment | Purchased Impaired |
Total | ||||||||||||||||||
| Individually | Collectively | |||||||||||||||||||
| March 31, 2014: |
||||||||||||||||||||
| Allowance for loan losses: |
||||||||||||||||||||
| Real estate loans: |
||||||||||||||||||||
| Residential properties |
$ | - | $ | 6,255 | $ | - | $ | 6,255 | $ | 34 | ||||||||||
| Commercial properties |
190 | 1,403 | - | 1,593 | 269 | |||||||||||||||
| Land and construction |
- | - | - | - | 14 | |||||||||||||||
| Commercial and industrial loans |
895 | 1,262 | - | 2,157 | 117 | |||||||||||||||
| Consumer loans |
- | 145 | - | 145 | 11 | |||||||||||||||
|
|
|
|
|
|
|
|
|
|
|
|||||||||||
| Total |
$ | 1,085 | $ | 9,065 | $ | - | $ | 10,150 | $ | 445 | ||||||||||
|
|
|
|
|
|
|
|
|
|
|
|||||||||||
| Loans: |
||||||||||||||||||||
| Real estate loans: |
||||||||||||||||||||
| Residential properties |
$ | 3,484 | $ | 662,315 | $ | - | $ | 665,799 | $ | 3,428 | ||||||||||
| Commercial properties |
817 | 161,738 | 3,735 | 166,290 | 23,775 | |||||||||||||||
| Land and construction |
- | 2,345 | - | 2,345 | 1,784 | |||||||||||||||
| Commercial and industrial loans |
2,968 | 92,248 | 2,032 | 97,248 | 10,505 | |||||||||||||||
| Consumer loans |
- | 17,158 | 43 | 17,201 | 153 | |||||||||||||||
|
|
|
|
|
|
|
|
|
|
|
|||||||||||
| Total |
$ | 7,269 | $ | 935,804 | $ | 5,810 | $ | 948,883 | $ | 39,645 | ||||||||||
|
|
|
|
|
|
|
|
|
|
|
|||||||||||
| December 31, 2013: |
||||||||||||||||||||
| Allowance for loan losses: |
||||||||||||||||||||
| Real estate loans: |
||||||||||||||||||||
| Residential properties |
$ | - | $ | 6,157 | $ | - | $ | 6,157 | $ | 36 | ||||||||||
| Commercial properties |
190 | 1,250 | - | 1,440 | 290 | |||||||||||||||
| Land and construction |
- | - | - | - | 26 | |||||||||||||||
| Commercial and industrial loans |
925 | 1,224 | - | 2,149 | 126 | |||||||||||||||
| Consumer loans |
- | 169 | - | 169 | 11 | |||||||||||||||
|
|
|
|
|
|
|
|
|
|
|
|||||||||||
| Total |
$ | 1,115 | $ | 8,800 | $ | - | $ | 9,915 | $ | 489 | ||||||||||
|
|
|
|
|
|
|
|
|
|
|
|||||||||||
72
Table of Contents
| (dollars in thousands) | Allowance for Loan Losses | Unaccreted Credit Component Other Loans |
||||||||||||||||||
| Evaluated for Impairment | Purchased Impaired |
Total | ||||||||||||||||||
| Individually | Collectively | |||||||||||||||||||
| Loans: |
||||||||||||||||||||
| Real estate loans: |
||||||||||||||||||||
| Residential properties |
$ | 2,248 | $ | 630,832 | $ | - | $ | 633,080 | $ | 3,449 | ||||||||||
| Commercial properties |
821 | 150,053 | 4,108 | 154,982 | 23,968 | |||||||||||||||
| Land and construction |
- | 2,314 | 1,480 | 3,794 | 1,939 | |||||||||||||||
| Commercial and industrial loans |
2,999 | 88,209 | 2,047 | 93,255 | 10,354 | |||||||||||||||
| Consumer loans |
- | 18,441 | 43 | 18,484 | 160 | |||||||||||||||
|
|
|
|
|
|
|
|
|
|
|
|||||||||||
| Total |
$ | 6,068 | $ | 889,849 | $ | 7,678 | $ | 903,595 | $ | 39,870 | ||||||||||
|
|
|
|
|
|
|
|
|
|
|
|||||||||||
| December 31, 2012: |
||||||||||||||||||||
| Allowance for loan losses: |
||||||||||||||||||||
| Real estate loans: |
||||||||||||||||||||
| Residential properties |
$ | - | $ | 4,355 | $ | - | $ | 4,355 | $ | 62 | ||||||||||
| Commercial properties |
- | 936 | - | 936 | 617 | |||||||||||||||
| Land and construction |
- | - | - | - | 129 | |||||||||||||||
| Commercial and industrial loans |
1,536 | 1,305 | - | 2,841 | 302 | |||||||||||||||
| Consumer loans |
- | 208 | - | 208 | 19 | |||||||||||||||
|
|
|
|
|
|
|
|
|
|
|
|||||||||||
| Total |
$ | 1,536 | $ | 6,804 | $ | - | $ | 8,340 | $ | 1,129 | ||||||||||
|
|
|
|
|
|
|
|
|
|
|
|||||||||||
| Loans: |
||||||||||||||||||||
| Real estate loans: |
||||||||||||||||||||
| Residential properties |
$ | 2,257 | $ | 519,288 | $ | 1,731 | $ | 523,276 | $ | 5,121 | ||||||||||
| Commercial properties |
- | 128,035 | 4,182 | 132,217 | 39,862 | |||||||||||||||
| Land and construction |
543 | 3,818 | 3,214 | 7,575 | 4,521 | |||||||||||||||
| Commercial and industrial loans |
2,736 | 62,989 | 2,195 | 67,920 | 16,512 | |||||||||||||||
| Consumer loans |
- | 12,514 | 71 | 12,585 | 324 | |||||||||||||||
|
|
|
|
|
|
|
|
|
|
|
|||||||||||
| Total |
$ | 5,536 | $ | 726,644 | $ | 11,393 | $ | 743,573 | $ | 66,340 | ||||||||||
|
|
|
|
|
|
|
|
|
|
|
|||||||||||
The column labeled “Unaccreted Credit Component Other Loans” represents the amount of unaccreted credit component discount for loans acquired in the DCB acquisition, that were not classified as purchased impaired or individually evaluated for impairment as of the dates indicated, and the stated principal balance of the related loans. The unaccreted credit component discount is equal to 1.12%, 1.23% and 1.70% of the stated principal balance of these loans as of March 31, 2014, December 31, 2013, and December 31, 2012, respectively. In addition to this unaccreted credit component discount, an additional $0.2 million of the ALLL has been provided for these loans as of March 31, 2014.
Liquidity
Liquidity management focuses on our ability to generate, on a timely and cost-effective basis, cash sufficient to meet the funding needs of current loan demand, deposit withdrawals, principal and interest payments with respect to outstanding borrowings and to pay operating expenses. Our liquidity management is both a daily and long-term function of funds management. Liquid assets are generally invested in marketable securities or held as cash at the FRB or other financial institutions.
We monitor our liquidity in accordance with guidelines established by our Board of Directors and applicable regulatory requirements. Our need for liquidity is affected by our loan activity, net changes in deposit
73
Table of Contents
levels and the maturities of our borrowings. The principal sources of our liquidity consist of deposits, loan interest and principal payments and prepayments, investment management and consulting fees, FHLB advances and proceeds from borrowings and sales of shares by FFI. The remaining balances of the Company’s lines of credit available to draw down totaled $193.4 million at March 31, 2014.
Cash Flows Provided by Operating Activities. During the quarter ended March 31, 2014, operating activities provided net cash of $0.9 million, comprised primarily of our net income of $1.5 million and $1.2 million of non-cash charges, including provisions for loan losses, stock based compensation expense and depreciation and amortization and deferred taxes recognized in our net income. These were partially offset by a $0.3 million increase in other assets and a $1.5 million decrease in other liabilities. During the year ended December 31, 2013 operating activities provided net cash of $11.2 million, comprised primarily of our net income of $7.9 million and $4.3 million of non-cash charges, including provisions for loan losses, REO losses, stock based compensation expense and depreciation and amortization, offset by $1.3 million non-cash deferred tax benefit recognized in our net income. In 2012, operating activities provided net cash of $8.4 million, comprised primarily of net income of $5.8 million and $3.3 million of non-cash charges, including provision for loan losses, stock based compensation expense and depreciation and amortization, partially offset by a $2.1 million non-cash deferred tax benefit recognized in our net income.
Cash Flows Used in Investing Activities. During the quarter ended March 31, 2014, investing activities used net cash of $60.0 million, primarily to fund a $46.7 million net increase in loans and a $13.4 million net increase in securities AFS. During the year ended December 31, 2013, investing activities used net cash of $217.0 million, primarily to fund a $160.8 million net increase in loans and a $56.1 million net increase in securities AFS. In 2012, investing activities used net cash of $86.0 million, primarily to fund a $129.9 million net increase in loans, which was partially offset by a $10.4 million decrease net decrease in AFS securities and FHLB stock and $34.9 million of cash acquired in the DCB Acquisition.
Cash Flow Provided by Financing Activities. During the quarter ended March 31, 2014, financing activities provided net cash of $52.5 million, consisting primarily of a net increase of $52.6 million in deposits and a $15.0 million borrowing under a term note, offset by a $15.0 million decrease in FHLB advances. During the year ended December 31, 2013, financing activities provided net cash of $199.7 million, consisting primarily of a net increase of $152.3 million in deposits, a net increase of $41.1 million in borrowings and $6.3 million received from the sale of shares in a private offering. In 2012, financing activities provided net cash of $130.6 million, consisting primarily of a net increase of $116.0 million in deposits, a net increase of $9.0 million in borrowings, and $5.6 million from the sale of shares in a private offering.
Ratio of Loans to Deposits. The relationship between gross loans and total deposits can provide a useful measure of a bank’s liquidity. Since repayment of loans tends to be less predictable than the maturity of investments and other liquid resources, the higher the loan-to-deposit ratio the less liquid are our assets. On the other hand, since we realize greater yields on loans than we do on other interest-earning assets, a lower loan-to-deposit ratio can adversely affect interest income and earnings. As a result, our goal is to achieve a loan-to-deposit ratio that appropriately balances the requirements of liquidity and the need to generate a fair return on our assets. At March 31, 2014, December 31, 2013 and December 31, 2012, the loan-to-deposit ratios at FFB were 108.4%, 110.4%, and 112.4%, respectively.
Off-Balance Sheet Arrangements
The following table provides the off-balance sheet arrangements of the Company as of March 31, 2014:
| (dollars in thousands) | ||||
| Commitments to fund new loans |
$ | 27,660 | ||
| Commitments to fund under existing loans, lines of credit |
98,809 | |||
| Commitments under standby letters of credit |
1,327 | |||
74
Table of Contents
Some of the commitments to fund existing loans, lines of credit and letters of credit are expected to expire without being drawn upon. Therefore, the total commitments do not necessarily represent future cash requirements. As of March 31, 2014, FFB was obligated on $68.5 million of letters of credit to the FHLB which were being used as collateral for public fund deposits, including $56.0 million of deposits from the State of California.
Asset and Liability Management: Interest Rate Risk
Interest rate risk is inherent in financial services businesses. Management of interest-earning assets and interest-bearing liabilities in terms of rate and maturity has an important effect on our liquidity and net interest margin. Interest rate risk results from interest-earning assets and interest-bearing liabilities maturing or repricing at different times, on a different basis or in unequal amounts. The Board of Directors of FFB approves policies and limits governing the management of interest rate risk. The asset / liability committee formed by these policies is responsible for monitoring our interest rate risk and providing periodic reports to the Board of Directors regarding our compliance with these policies and limits. We have established three primary measurement processes to quantify and manage our interest rate risk. These include: (i) gap analysis which measures the repricing mismatches of asset and liability cash flows; (ii) net interest income simulations which are used to measure the impact of instantaneous changes in interest rates on net interest income over a 12 month forecast period; and (iii) economic value of equity calculations which measure the sensitivity of our economic value of equity to simultaneous changes in interest rates.
Gap Analysis. Under this analysis, rate sensitivity is measured by the extent to which our interest-earning assets and interest-bearing liabilities reprice or mature at different times. Rate sensitivity gaps in which the repricing of interest-earning assets exceed the repricing of interest-bearing liabilities tend to produce an expanded net yield on interest-earning assets in rising interest rate environments and a reduced net yield on interest-earning assets in declining interest rate environments. Conversely, when the repricing of interest-bearing liabilities exceed the repricing of interest-earning assets, the net yield on interest-earning assets generally declines in rising interest rate environments and increases in declining interest rate environments. The following table sets forth the interest-earning assets and interest-bearing liabilities on the basis of when they reprice or mature as of December 31, 2013:
| (dollars in thousands) | Less than 1 year |
From 1 to 3 Years |
From 3 to 5 Years |
Over 5 Years |
Total | |||||||||||||||
| Interest-earnings assets: |
||||||||||||||||||||
| Cash equivalents |
$ | 56,954 | $ | - | $ | - | $ | - | $ | 56,954 | ||||||||||
| Securities, FHLB stock |
12,233 | 9,102 | 7,573 | 39,592 | 68,500 | |||||||||||||||
| Loans |
151,521 | 143,593 | 289,987 | 318,688 | 903,789 | |||||||||||||||
| Interest-bearing liabilities: |
||||||||||||||||||||
| Deposits: |
||||||||||||||||||||
| Interest-bearing checking |
(217,129) | - | - | - | (217,129) | |||||||||||||||
| Money market and savings |
(121,260) | - | - | - | (121,260) | |||||||||||||||
| Certificates of deposit |
(221,414) | (24,452) | - | - | (245,866) | |||||||||||||||
| Borrowings |
(141,063) | - | - | - | (141,063) | |||||||||||||||
|
|
|
|
|
|
|
|
|
|
|
|||||||||||
| Net: Current Period |
$ | (480,158) | $ | 128,243 | $ | 297,560 | $ | 358,280 | $ | 303,925 | ||||||||||
|
|
|
|
|
|
|
|
|
|
|
|||||||||||
| Net: Cumulative |
$ | (480,158) | $ | (351,915) | $ | (54,355) | $ | 303,925 | ||||||||||||
|
|
|
|
|
|
|
|
|
|||||||||||||
The cumulative positive total of $304.0 million reflects the funding provided by noninterest-bearing deposits and equity. Because we had a $480.2 million net negative position at December 31, 2013 for the repricing period of less than one year, the result of this analysis indicate that we would be adversely impacted by a short term increase in interest rates and would benefit from a short term decrease in interest rates.
However, the extent to which our net interest margin will be impacted by changes in prevailing interest rates will depend on a number of factors, including how quickly interest-earning assets and interest-bearing liabilities react to interest rate changes. It is not uncommon for rates on certain assets or liabilities to lag behind changes in the market rates of interest. Additionally, prepayments of loans and early withdrawals of certificates of deposit could cause
75
Table of Contents
interest sensitivities to vary. As a result, the relationship or “gap” between interest-earning assets and interest-bearing liabilities, as shown in the above table, is only a general indicator of interest rate sensitivity and the effect of changing rates of interest on our net interest income is likely to be different from that predicted solely on the basis of the interest rate sensitivity analysis set forth in the above table.
For our loan portfolio, we also measure our interest rate sensitivity using duration analysis. The duration number is a measure of the sensitivity of the price of a fixed-income investment to a change in interest rates and is derived through a calculation involving present value, yield, coupon, final maturity and call features. The larger a duration number is, the greater the interest-rate risk exists. The duration of our loan portfolio was as 3.363 years as of December 31, 2013 as compared to 3.159 years as of December 31, 2012.
Net Interest Income Simulations (or NII). Under this analysis, we use a simulation model to measure and evaluate potential changes in our net interest income resulting from changes in interest rates. This model measures the impact of instantaneous shocks of 100, 200, 300 and 400 basis points on our net interest income over a 12 month forecast period. The computed changes to our net interest income between hypothetical rising and declining rate scenarios for the twelve month period beginning December 31, 2013 are as follows:
| Assumed Instantaneous Change in Interest Rates | Estimated Increase (Decrease) in Net Interest Income |
|||
| + 100 basis points |
(6.12) % | |||
| + 200 basis points |
(11.06) % | |||
| + 300 basis points |
(15.84) % | |||
| + 400 basis points |
(20.22) % | |||
| - 100 basis points |
0.99 % | |||
| - 200 basis points |
0.80 % | |||
We did not include scenarios below the minus 200 basis point scenario because we believe those scenarios are not meaningful based on current interest rate levels. The NII results indicate that we would be adversely impacted by a short term increase in interest rates and would benefit from a short term decrease in interest rates. The results of the NII are hypothetical, and a variety of factors might cause actual results to differ substantially from what is depicted. These could include non-parallel yield curve shifts, changes in market interest rate spreads and the actual reaction to changes in interest rate levels of interest-earning assets and interest-bearing liabilities. It is not uncommon for rates on certain assets or liabilities to lag behind changes in the market rates of interest. Additionally, prepayments of loans and early withdrawals of certificates of deposit could cause interest sensitivities to vary.
76
Table of Contents
Economic Value of Equity Calculations (or EVE). The EVE measures the sensitivity of our market value equity to simultaneous changes in interest rates. EVE is derived by subtracting the economic value of FFB’s liabilities from the economic value of its assets, assuming current and hypothetical interest rate environments. EVE is based on all of the future cash flows expected to be generated by the FFB’s current balance sheet, discounted to derive the economic value of FFB’s assets & liabilities. These cash flows may change depending on the assumed interest rate environment and the resulting changes in other assumptions, such as prepayment speeds. The computed changes to our economic value of equity between hypothetical rising and declining rate scenarios as of December 31, 2013 are as follows:
| Assumed Simultaneous Change in Interest Rates | Estimated Increase (Decrease) in Economic Value of Equity | |
| + 100 basis points |
(8.3) % | |
| + 200 basis points |
(17.9) % | |
| + 300 basis points |
(17.2) % | |
| + 400 basis points |
(14.7) % | |
| - 100 basis points |
(12.4) % | |
| - 200 basis points |
(19.3) % | |
We did not include scenarios below the minus 200 basis point scenario because we believe those scenarios are not meaningful based on current interest rate levels. The EVE results indicate that we would be adversely impacted by a short term increase in interest rates and a short term decrease in interest rates. This differs from the NII results because, in the current interest rate environment, assumed interest rate floors for loans eliminates the benefit normally derived for loans in a declining interest rate environment. The results of the EVE are hypothetical, and a variety of factors might cause actual results to differ substantially from what is depicted. These could include non-parallel yield curve shifts, changes in market interest rate spreads and the actual reaction to changes in interest rate levels of interest-earning assets and interest-bearing liabilities. It is not uncommon for rates on certain assets or liabilities to lag behind changes in the market rates of interest. Additionally, prepayments of loans and early withdrawals of certificates of deposit could cause interest sensitivities to vary.
The results of these analyses and simulations do not contemplate all of the actions that we may undertake in response to changes in interest rates. In response to actual or anticipated changes in interest rates, we have various alternatives for managing and reducing FFB’s exposure to interest rate risk, such as entering into hedges and obtaining long-term fixed rate FHLB advances. To date, we have not entered into any hedges or other derivative instruments for this or any other purpose and it is our policy not to use derivatives or other financial instruments for trading or other speculative purposes.
Capital Resources and Dividends
Under federal banking regulations that apply to all United States based bank holding companies and federally insured banks, the Company (on a consolidated basis) and FFB (on a stand-alone basis) must meet specific capital adequacy requirements that, for the most part, involve quantitative measures, primarily in terms of the ratios of their capital to their assets, liabilities, and certain off-balance sheet items, calculated under regulatory accounting practices. Under those regulations, which are based primarily on those quantitative measures, each bank holding company must meet a minimum capital ratio and each federally insured bank is determined by its primary federal bank regulatory agency to come within one of the following capital adequacy categories on the basis of its capital ratios: (i) well capitalized; (ii) adequately capitalized; (iii) undercapitalized; (iv) significantly undercapitalized; or (v) critically undercapitalized.
Certain qualitative assessments also are made by a banking institution’s primary federal regulatory agency that could lead the agency to determine that the banking institution should be assigned to a lower capital
77
Table of Contents
category than the one indicated by the quantitative measures used to assess the institution’s capital adequacy. At each successive lower capital category, a banking institution is subject to greater operating restrictions and increased regulatory supervision by its federal bank regulatory agency.
The following table sets forth the capital and capital ratios of FFI (on a consolidated basis) and FFB as of the respective dates indicated below, as compared to the respective regulatory requirements applicable to them:
| Actual | For Capital Adequacy Purposes |
To Be Well Capitalized Under Prompt Corrective Action Provisions |
||||||||||||||||||||||
| (dollars in thousands) | Amount | Ratio | Amount | Ratio | Amount | Ratio | ||||||||||||||||||
| FFI | ||||||||||||||||||||||||
| March 31, 2014 |
||||||||||||||||||||||||
| Tier 1 leverage ratio |
$ | 86,933 | 8.22 | % | $ | 42,278 | 4.00 | % | ||||||||||||||||
| Tier 1 risk-based capital ratio |
86,933 | 12.40 | % | 28,039 | 4.00 | % | ||||||||||||||||||
| Total risk-based capital ratio |
95,717 | 13.65 | % | 56,078 | 8.00 | % | ||||||||||||||||||
| December 31, 2013 |
||||||||||||||||||||||||
| Tier 1 leverage ratio |
$ | 85,268 | 8.67 | % | $ | 39,321 | 4.00 | % | ||||||||||||||||
| Tier 1 risk-based capital ratio |
85,268 | 13.04 | % | 26,150 | 4.00 | % | ||||||||||||||||||
| Total risk-based capital ratio |
93,465 | 14.30 | % | 52,300 | 8.00 | % | ||||||||||||||||||
| December 31, 2012 |
||||||||||||||||||||||||
| Tier 1 leverage ratio |
$ | 72,909 | 9.19 | % | $ | 31,730 | 4.00 | % | ||||||||||||||||
| Tier 1 risk-based capital ratio |
72,909 | 13.60 | % | 21,446 | 4.00 | % | ||||||||||||||||||
| Total risk-based capital ratio |
79,636 | 14.85 | % | 42,891 | 8.00 | % | ||||||||||||||||||
| FFB | ||||||||||||||||||||||||
| March 31, 2014 |
||||||||||||||||||||||||
| Tier 1 leverage ratio |
$ | 96,512 | 9.17 | % | $ | 42,100 | 4.00 | % | $ | 52,625 | 5.00 | % | ||||||||||||
| Tier 1 risk-based capital ratio |
96,512 | 13.66 | % | 28,263 | 4.00 | % | 42,394 | 6.00 | % | |||||||||||||||
| Total risk-based capital ratio |
105,365 | 14.91 | % | 56,526 | 8.00 | % | 70,657 | 10.00 | % | |||||||||||||||
| December 31, 2013 |
||||||||||||||||||||||||
| Tier 1 leverage ratio |
$ | 84,243 | 8.61 | % | $ | 39,115 | 4.00 | % | $ | 48,894 | 5.00 | % | ||||||||||||
| Tier 1 risk-based capital ratio |
84,243 | 12.95 | % | 26,017 | 4.00 | % | 39,025 | 6.00 | % | |||||||||||||||
| Total risk-based capital ratio |
92,399 | 14.21 | % | 52,034 | 8.00 | % | 65,042 | 10.00 | % | |||||||||||||||
| December 31, 2012 |
||||||||||||||||||||||||
| Tier 1 (core) capital ratio |
$ | 67,515 | 8.56 | % | $ | 31,563 | 4.00 | % | $ | 39,454 | 5.00 | % | ||||||||||||
| Tier 1 risk-based capital ratio |
67,515 | 12.68 | % | 21,292 | 4.00 | % | 31,939 | 6.00 | % | |||||||||||||||
| Total risk-based capital ratio |
74,194 | 13.94 | % | 42,585 | 8.00 | % | 53,231 | 10.00 | % | |||||||||||||||
As of each of the dates set forth in the above table, the Company (on a consolidated basis) exceeded the minimum required capital ratios applicable to it and FFB (on a stand-alone basis) qualified as a well-capitalized depository institution under the capital adequacy guidelines described above. As a condition of approval of the DCB Acquisition by the FDIC, FFB is required to maintain a Tier 1 Leverage Ratio of 8.5% through August 15, 2014.
As of March 31, 2014 the amount of capital at FFB in excess of amounts required to be Well Capitalized was $43.9 million for the Tier 1 Leverage Ratio, $54.1 million for the Tier 1 risk-based capital ratio and $34.7 million for the Total risk-based capital ratio. No conditions or events have occurred since March 31, 2014 which we believe have changed FFI’s or FFB’s capital adequacy classifications from those set forth in the above table.
78
Table of Contents
During the first quarter of 2014, FFI made a $10.0 million capital contribution to FFB. During 2013 and 2012, FFI made capital contributions to FFB of $8.5 million and $5.3 million, respectively. As of March 31, 2014, FFI had $11.1 million of available capital and, therefore, has the ability and financial resources to contribute additional capital to FFB, if needed.
Due to the adoption in June 2013 of the Basel III capital guidelines by the FRB and the FDIC, effective beginning on January 1, 2015, FFI and FFB will be required to meet higher and more stringent capital requirements than those that currently exist. For additional information regarding the Basel III capital rules, see “Supervision and Regulation—First Foundation Bank—New Basel III Capital Rules” elsewhere in this prospectus.
In 2007, we raised $32.0 million in a private placement. Subsequently, we raised $4.8 million, $8.8 million, $6.2 million and $5.7 million in private placements begun in 2008, 2010, 2012 and 2013, respectively.
We did not pay dividends in 2014, 2013 or 2012 and we have no plans to pay dividends at least for the foreseeable future. Instead, it is our intention to retain internally generated cash flow to support our growth. Moreover, the payment of dividends is subject to certain regulatory restrictions. For additional information regarding these restrictions, see the section of this prospectus entitled “Supervision and Regulation—Dividends.” included elsewhere in this prospectus. In addition, the agreement governing the term loan obtained by FFI in April 2013 provides that we must obtain the prior consent of the lender to pay dividends to our shareholders.
We had no material commitments for capital expenditures as of March 31, 2014.
79
Table of Contents
Executive Officers and Directors
The following table sets forth the name, age and position with the Company of each of the persons who we expect will serve as directors and executive officers upon completion of the offering. The business address for all of these individuals is 18101 Von Karman Avenue, Suite 700, Irvine, California 92612.
| Name | Age | Position | ||||
| Ulrich Keller, Jr., CFP |
57 | Executive Chairman and Director | ||||
| Scott Kavanaugh |
53 | Director, Vice Chairman of the Board and Chief Executive Officer | ||||
| John Hakopian |
45 | President of FFA and Director | ||||
| James Brakke(1) |
72 | Director | ||||
| Max Briggs, CFP(2)(3) |
48 | Director | ||||
| Victoria Collins, Ph.D., CFP |
71 | Director | ||||
| Warren Fix(2) |
75 | Director | ||||
| Gerald Larsen, J.D., LL.M., CFP, CPA(1)(2) |
65 | Director | ||||
| Mitchell Rosenberg, Ph.D.(1)(3) |
60 | Director | ||||
| Jacob Sonenshine, J.D., CFA(3) |
43 | Director | ||||
| John Michel |
54 | Executive Vice President and Chief Financial Officer | ||||
| David Rahn |
65 | President of FFB | ||||
| (1) | Member of the compensation committee. |
| (2) | Member of the audit committee. |
| (3) | Member of the nominating and corporate governance committee. |
Set forth below is a biographical summary of the experience of the members of our Board of Directors and our executive officers.
Directors
Ulrich Keller, Jr., CFP. Mr. Keller is one of the founders of the Company and currently is the Executive Chairman of FFI and FFA. Mr. Keller served as Chief Executive Officer (or CEO) of FFA from 1990, when it began operations as a fee-based investment advisor, until December 2009, at which time he became its Executive Chairman. In 2007, Mr. Keller became the Executive Chairman of FFI and from June 2007 until December 2009 he also served as the CEO of FFI. Mr. Keller earned a Bachelor of Science degree in Finance from San Diego State University. Mr. Keller currently serves as a trustee of the University of California, Irvine (or UCI) Foundation, as a consultant to the Investment Advisory Committee of The Board of Regents of the University of California and as a member of the Dean’s Advisory Board for the Center for Investment and Wealth Management at the Paul Merage School of Business at UCI. As one the founders of the Company, who played a key role in the development and successful implementation of our business strategy of providing high quality and personalized wealth management and investment advisory services to our clients and the expansion of the financial services we offer our clients, Mr. Keller brings to the Board considerable knowledge and valuable insights about the wealth management and investment advisory business and the Southern California financial services market.
Scott Kavanaugh. Mr. Kavanaugh is, and since December 2009 has been the CEO of FFI, and from June 2007 until December 2009, he served as President and Chief Operating Officer of FFI. Mr. Kavanaugh has been the Vice-Chairman of FFI since June 2007. He also is, and since September 2007 has been, the Chairman and CEO of FFB. Mr. Kavanaugh was a founding stockholder and served as an Executive Vice President and Chief Administrative Officer
80
Table of Contents
and a member of the board of directors of Commercial Capital Bancorp, Inc. the parent holding company of Commercial Capital Bank. During his tenure as an executive officer and director of Commercial Capital Bancorp, Inc. that company became a publicly traded company, listed on NASDAQ, and its total assets grew to more than $1.7 billion. From 1998 until 2003, Mr. Kavanaugh served as the Executive Vice President and Chief Operating Officer and a director of Commercial Capital Mortgage. From 1993 to 1998, Mr. Kavanaugh was a partner and head of trading for fixed income and equity securities at Great Pacific Securities, Inc., a west coast-based regional securities firm. Mr. Kavanaugh earned a Bachelor of Science degree in Business Administration and Accounting at the University of Tennessee and a Masters of Business Administration (or MBA) degree in Information Systems at North Texas State University. Mr. Kavanaugh is, and since 2008 has been, a member of the board of directors of Colorado Federal Savings Bank and its parent holding company, Silver Queen Financial Services, Inc. Mr. Kavanaugh also is, and since December 2013 has been, a member of the boards of directors of NexBank SSB and its parent holding company, NexBank Capital, Inc. From January 2000 until June 2012, Mr. Kavanaugh served as Independent Trustee and Chairman of the Audit Committee and from June 2012 until December 2013 served as Chairman of the Highland Mutual Funds, a mutual fund group managed by Highland Capital Management. The Board believes that Mr. Kavanaugh’s extensive experience as an executive officer of banks and other financial services organizations, combined with his experience as a director of both public and private companies, qualifies him to serve as a member of our Board of Directors. In addition, because Mr. Kavanaugh is the Company’s Chief Executive Officer, the Board of Directors believes that his participation as a member of the Board facilitates communication between the outside Board members and management.
John Hakopian. Mr. Hakopian is, and since April 2009 has been, the President of FFA and is and since 2007 has been a member of the Company’s Board of Directors. Mr. Hakopian was one of the founders of the Company in 1990, when it began its operations as a fee-based investment advisor and served as its Executive Vice President and Co-Portfolio Manager from 1994 through April 2009. Mr. Hakopian earned a Bachelor of Arts degree in Economics from UCI and a MBA degree in Finance from the University of Southern California. Mr. Hakopian’s extensive knowledge of the Company’s wealth management and investment advisory business makes him a valuable member of the Board who is able to provide the outside Board members with insight in to the operations and risks of that business.
James Brakke. Mr. Brakke has served as a director of FFI since 2007. From 2001 until 2006 Mr. Brakke served as a director of Commercial Capital Bancorp, Inc. and from 2000 until 2006, Mr. Brakke served as a director of Commercial Capital Bank. Mr. Brakke is, and since 2001 has been, Executive Vice President and director of the Dealer Protection Group, an insurance brokerage firm that Mr. Brakke co-founded, which specializes in providing insurance products to the automobile industry. Mr. Brakke also serves as a salesperson for Brakke-Schafnitz Insurance Brokers, a commercial insurance brokerage and consulting firm that he co-founded and where he was President and Chairman from 1971 until 2009. Mr. Brakke currently serves as a director of Maury Microwave Corporation and as Chairman of Advanced Wellness and Lasers. Mr. Brakke earned a Bachelor of Science degree in Business and Finance from Colorado State University. Mr. Brakke’s experience as a director of Commercial Capital Bancorp, Inc. and its wholly owned banking subsidiary, Commercial Capital Bank is valuable to other independent member of the Company’s Board of Directors. Moreover, we believe Mr. Brakke’s extensive knowledge of the insurance industry provides valuable insight and support for our insurance operations.
Max Briggs, CFP. From 2005 to 2012, Mr. Briggs served as Chairman of the Board of DCB. He was elected as a director of the Company following our acquisition of DCB in August 2012. Mr. Briggs is, and since 1996 has been the President and CEO of FLC Capital Advisors, a wealth management firm with over $300 million of assets under management. Mr. Briggs earned a Business Administration and Finance degree from Stetson University. We believe Mr. Briggs is a valuable member of our Board of Directors due to his knowledge of the banking business, gained from his service as Chairman of DCB, particularly as conducted in Palm Desert, California and its surrounding communities, where we have two of our wealth management offices, and his experience as President and CEO of a wealth management firm.
81
Table of Contents
Victoria Collins, Ph.D., CFP. Dr. Collins is and has been a director of FFI since 2007. Beginning in 1990, Dr. Collins served as an executive officer of FFA, including as an Executive Vice President from 1990 until 2009 and as a Senior Managing Director from 2009, until her retirement in December 2011. Dr. Collins currently serves on the Dean’s Advisory Board for the Center for Investment and Wealth Management at the Paul Merage School of Business at UCI. Dr. Collins earned a Bachelor’s of Administration degree in Psychology from San Diego State University, a Master of Arts degree in Educational Psychology from St. Mary’s College and a Doctor of Philosophy (or Ph.D.) degree in Cognitive Psychology from the University of California, Berkeley. Dr. Collins’ found that her knowledge of psychology was invaluable in her role as an executive officer and a senior wealth manager at FFA. We believe that the Board has found that Dr. Collins brings to the Board valuable insights about the FFA’s business from her knowledge of and her experience in wealth management, and her management experience at FFA.
Warren Fix. Mr. Fix has served as a director of FFI since 2007. Mr. Fix is, and since 1992 has been, a partner in The Contrarian Group, a business investment and management company. From 1995 to 2008, Mr. Fix served in various management capacities and on the Board of Directors of WCH, Inc., formerly Candlewood Hotel Company. From 1989 to 1992, Mr. Fix served as President of the Pacific Company, a real estate investment and development company. From 1964 to 1989, Mr. Fix held numerous positions at the Irvine Company, including serving as its Chief Financial Officer (or CFO) and a director. Mr. Fix currently serves as a director of Healthcare Trust of America, a publicly traded real estate investment trust, Clark Investment Group, Accel Networks and CT Realty. Mr. Fix earned a Bachelor of Administration degree from Claremont McKenna College. We believe Mr. Fix brings to the Board his knowledge of accounting as a result of his long tenure as CFO of the Irvine Company and his experience as an independent director of both public and private companies.
Gerald Larsen, J.D, LL.M, CFP, CPA. Mr. Larsen has served as a director of FFI since 2013. Mr. Larsen is, and since 1992 has served as the President, Principal and owner of the law firm of Larsen & Risley, located in Costa Mesa, California. Mr. Larsen’s law practice focuses on federal and state taxation, probate, estate planning, partnerships and corporate law. Mr. Larsen earned a Bachelor of Science degree in Accounting from California State University, Northridge, a J.D. degree from Stetson University and a LL.M. degree from the University of Florida. We believe that Mr. Larsen’s extensive experience as a tax and estate planning lawyer provides the Board with valuable insights regarding the tax and estate planning aspects of wealth management.
Mitchell Rosenberg, Ph.D. Dr. Rosenberg has served as a director of FFI since 2007. Dr. Rosenberg is, and since 2005 has served as, President and founder of the consulting firm of M. M. Rosenberg & Associates, which provides executive and organizational development services to technology companies, health care businesses and public entities. From 2002 to 2005, Dr. Rosenberg was Chief Executive Officer for The Picerne Group, an international investment firm investing primarily in real estate, and portfolios of loans. Prior to 2002, Dr. Rosenberg served as Executive Vice President and Director of Business Services for Ameriquest Capital Corporation and directed the Human Resource and Organizational Development functions for Washington Mutual Bank, American Savings Bank and Great Western Bank. Dr. Rosenberg earned a Bachelor of Science degree in Psychology from Ohio University, a Masters of Science degree in Industrial Psychology from California State University, Long Beach, and a Ph.D. degree in Psychology with an emphasis on Organizational Behavior from Claremont Graduate University. We believe that Dr. Rosenberg’s educational and operational experience in managing the human resource and organizational development functions of a number of banking organizations and a real estate investment firm provides insight regarding the Company’s human resource functions, including compensation considerations that impact the growth and expansion of the Company.
Jacob Sonenshine, J.D., CFA. Mr. Sonenshine has served as a director of FFI since 2007. Mr. Sonenshine is, and since 2012, has served as co-chief executive officer of Prell Restaurant Group, an operator of fast casual restaurants. From 2006 until 2012, Mr. Sonenshine served as the President and Chief Operating Officer of Professional Retirement Strategy, a retirement planning and entity risk management firm. From 1999 to 2005, Mr. Sonenshine was President and co-founder of RSM EquiCo, an investment bank specializing in mergers and acquisitions of privately-held middle market companies. Mr. Sonenshine currently serves on the Board of
82
Table of Contents
New Momentum, LLC, a software firm focusing on brand protection, anti-counterfeiting and channel integrity. Mr. Sonenshine earned a Bachelor of Science degree in economics and a Bachelor of Administration degree in International Relations from the University of Pennsylvania, and a J.D. degree and a MBA degree from the University of Southern California. We believe Mr. Sonenshine’s experience as CEO of a retirement planning firm is valuable to the Board in overseeing FFA’s wealth management and investment advisory business.
Executive Officers
John Michel. Mr. Michel is, and since September 2007 has been, the Executive Vice President and CFO of the Company and FFB. Since January 2009, he has also served as the CFO of FFA. Mr. Michel served as the Chief Financial Officer of Sunwest Bank from February 2005 to October 2006 and of Fidelity Federal Bank from September 1998 to December 2001. Mr. Michel earned a Bachelor of Business Administration Accounting degree from the University of Notre Dame.
Dave Rahn. Mr. Rahn is, and since September 2007 has been, the President of FFB. From September 2007 to August 2012, Mr. Rahn also served as Chief Operating Officer of FFB. From 2004 to 2007, Mr. Rahn served as the Senior Vice President, Southern California Regional Manager for Wealth Management at Bank of the West, from 2000 to 2004 he served as California Market Manager of Private Banking for Comerica Bank, and from 1988 to 2000, Mr. Rahn served as Chief Operating Officer of First American Trust. Mr. Rahn earned a Bachelor of Science degree from California State Polytechnic University, Pomona and a MBA degree from the University of Redlands.
Corporate Governance Principles and Board Matters
We are committed to having sound corporate governance principles, which are essential to running our business efficiently and maintaining our integrity in the marketplace. We recently adopted a revised Code of Business and Ethical Conduct relating to the conduct of our business by all of our employees, officers and directors, as well as a Code of Business and Ethical Conduct for Chief Executive Officer and Other Senior Financial Officers specifically for our Chief Executive Officer and senior financial officers, both of which will be posted on our website upon completion of the offering. We expect that any amendments to the Code of Business and Ethical Conduct or the Code of Business and Ethical Conduct for Chief Executive Officer and Other Senior Financial Officers, or any waivers of the requirements of either, will be disclosed on our website, as well as any other means required by the NASDAQ Stock Market rules.
Director Qualifications
We believe that our directors should have the highest professional and personal ethics and values, consistent with our longstanding values and standards. They should have broad experience at the policy-making level in business, government or banking. They should be committed to enhancing shareholder value and should have sufficient time to carry out their duties and to provide insight and practical wisdom based on experience. Their service on boards of other companies should be limited to a number that permits them, given their individual circumstances, to perform responsibly all director duties. Each director must represent the interests of all shareholders. When considering potential director candidates, our Board of Directors also considers the candidate’s character, judgment, diversity, age, skills, including financial literacy, and experience in the context of our needs and those of the Board of Directors.
Director Independence
Under the rules of the NASDAQ Stock Market, independent directors must comprise a majority of our Board of Directors within a specified period of time following this offering. The rules of the NASDAQ Stock Market, as well as those of the SEC, also impose several other requirements with respect to the independence of our directors. Our Board of Directors has evaluated the independence of its members based upon the rules of the
83
Table of Contents
NASDAQ Stock Market and the SEC. Applying these standards, our Board of Directors has affirmatively determined that, with the exception of Mr. Kavanaugh, Mr. Keller, Mr. Hakopian and Dr. Collins, each of our current directors is an independent director, as defined under the applicable rules.
Family Relationships
There is no family relationship between any director, executive officer or person nominated to become a director or executive director.
Board of Directors
Election of Directors
Our bylaws provide that our directors shall be elected at each annual meeting of shareholders but, if any such annual meeting is not held or the directors are not elected thereat, the directors may be elected at any special meeting of shareholders held for that purpose. All directors shall hold office until their respective successors are elected, subject to the CGCL and the provisions of these bylaws with respect to vacancies on the Board. A vacancy in the Board of Directors shall be deemed to exist in case of the (i) death, (ii) resignation or removal of any director with or without cause, (iii) pursuant to Section 302 of the CGCL if a director has been declared of unsound mind by order of court or convicted of a felony, and (iv) if the authorized number of directors be increased, or if the shareholders fail, at any annual or special meeting of shareholders at which any director or directors are elected, to elect the full authorized number of directors to be voted for at that meeting.
Vacancies on the Board of Directors, except for a vacancy created by the removal of a director, may be filled by a majority of the remaining directors, though less than a quorum, or by a sole remaining director, and each director so elected shall hold office until his successor is elected at an annual or a special meeting of the shareholders. A vacancy on the Board of Directors created by the removal of a director may only be filled by the vote of a majority of the shares entitled to vote represented at a duly held meeting at which a quorum is present, or by the written consent of the holders of a majority of the outstanding shares.
Appointment of Executive Officers
Our current and future executive officers and significant employees serve at the discretion of our Board of Directors, subject to any employment agreements under which any such officers may be employed.
Board Leadership Structure
The Chairman of our Board of Directors is Rick Keller who is a member of senior management. However, the Board of Directors has decided to separate the positions of Chairman and Chief Executive Officer because the board believes that doing so provides the appropriate leadership structure for us at this time, particularly since the separation of those two positions enables our Chief Executive Officer to focus on our day-to-day management of our business, while the Chairman leads the board of directors in the performance of its responsibilities.
The Board’s Role in Risk Oversight
The Board’s responsibilities in overseeing the Company’s management and business include oversight of the Company’s key risks and management processes and controls to manage them appropriately. Management, in turn, is responsible for the day-to-day management of risk and implementation of appropriate risk management controls and procedures.
84
Table of Contents
The risk of incurring losses on the loans we make is an inherent feature of the banking business and, if not effectively managed, such risks can materially affect our results of operations. Accordingly, the Board, as a whole, exercises oversight responsibility over the processes that our management employs to manage those risks. The Board fulfills that oversight responsibility by:
| • | monitoring trends in the Company’s loan portfolio and the Company’s allowance for loan losses; |
| • | establishing internal limits related to the Company’s lending exposure and reviewing and determining whether or not to approve loans in amounts exceeding certain specified limits; |
| • | reviewing and discussing, at least quarterly and more frequently, if the Board deems necessary, reports from the FFB’s chief credit officer relating to such matters as (i) risks in the Company’s loan portfolio, (ii) economic conditions or trends that could reasonably be expected to affect (positively or negatively) the performance of the loan portfolio or require increases in the ALLL and (iii) specific loans that have been classified as “special mention,” “substandard” or “doubtful” and, therefore, require increased attention from management; |
| • | reviewing, at least quarterly, management’s determinations with respect to the adequacy of, and any provisions required to be made to replenish or increase, the ALLL; |
| • | reviewing management reports regarding collection efforts with respect to nonperforming loans; and |
| • | authorizing the retention of, and reviewing the reports of, external loan review consultants with respect to the risks in and the quality of the loan portfolio. |
Although risk oversight permeates many elements of the work of the full Board and its committees, the audit committee has direct and systematic responsibility for overseeing other significant risk management processes.
Committees of our Board of Directors
Our Board of Directors has three standing committees: an audit committee, a compensation committee, and a nominating and governance committee. The Board of Directors has adopted a written charter for each of those committees, and copies of those charters will be available on our website upon the completion of this offering. In addition, from time to time, special committees may be established under the direction of our Board of Directors when necessary to address specific issues.
Audit Committee. We have an audit committee the members of which are Mr. Briggs, Mr. Fix and Mr. Larsen. Mr. Fix serves as chairman. The Board of Directors has determined that all of the members of the audit committee are independent within the meaning of the Listing Rules of the NASDAQ Stock Market and the enhanced independence requirements for audit committee members contained in Rule 10A-3 under the Exchange Act. Our Board of Directors also has determined that Mr. Fix and Mr. Briggs meet the definition of “audit committee financial expert” adopted by the SEC. The audit committee’s responsibilities include:
| • | Selecting and appointing the independent auditors, following the committee’s evaluation of their qualifications, and determining the compensation of the independent auditors; |
| • | overseeing the work of and monitoring and evaluating the independent auditors’ performance and independence and making all decisions with respect to the termination of the independent auditors; |
| • | reviewing all audit and non-audit services to be performed by the independent auditors, taking into consideration whether the provision of any non-audit services to us by the independent auditors is compatible with maintaining their independence; |
| • | reviewing and discussing with management and the independent auditors the annual and quarterly financial statements prior to their release; |
85
Table of Contents
| • | reviewing and discussing with management and our independent auditors the adequacy and effectiveness of our accounting and financial reporting processes and internal controls and the audits of our financial statements; |
| • | establishing and overseeing procedures for the receipt, retention and treatment of complaints received by us regarding accounting, internal accounting controls or auditing matters, including procedures for the confidential, anonymous submission by our employees of questions or concerns regarding accounting or auditing matters; |
| • | investigating any matter brought to the audit committee’s attention within the scope of its duties and engaging independent counsel and other advisors as the audit committee deems necessary; |
| • | reviewing reports to management prepared by the internal audit function, as well as management’s responses; |
| • | reviewing and assessing the adequacy of the committee’s formal written charter on an annual basis; |
| • | reviewing and approving related party transactions for potential conflict of interest situations; and |
| • | overseeing such other matters that may be specifically delegated to the audit committee by our Board of Directors. |
Compensation Committee. We have a compensation committee the members of which are Mr. Brakke, Mr. Larsen and Mr. Rosenberg. Mr. Rosenberg serves as chairman. The Board of Directors has determined that all of the members of the compensation committee are independent under the applicable Listing Rules of the NASDAQ Stock Market. The compensation responsibilities include:
| • | developing, reviewing, and approving our management compensation programs, and regularly reporting to the full Board of Directors regarding the adoption and effectiveness of such programs; |
| • | developing, reviewing and approving our cash and equity incentive plans, including approving individual grants or awards thereunder, and regularly reporting to the full Board of Directors regarding the terms of such plans and individual grants or awards; |
| • | reviewing and approving individual and Company performance goals and objectives that may be relevant to the compensation of executive officers and other key management employees; |
| • | reviewing and approving the terms of any employment agreement, severance or change in control arrangements, or other compensatory arrangement with any executive officers or other key management employees; |
| • | reviewing and discussing with management the narrative discussion to be included in the annual proxy statements with respect to executive officer and director compensation; |
| • | reviewing and assessing, on an annual basis, the adequacy of its formal written charter; and |
| • | overseeing any other matters that may be specifically delegated to the compensation committee by our Board of Directors. |
Nominating and Governance Committee. We have a nominating and governance committee, the members of which are Mr. Briggs, Mr. Rosenberg and Mr. Sonenshine. Mr. Rosenberg serves as chairman. The Board of Directors has determined that all of the members of the nominating and governance committee are independent under the Listing Rules of the NASDAQ Stock Market applicable to such committees. The nominating and governance committee’s responsibilities include:
| • | identifying and recommending nominees for election to the Board of Directors; |
| • | making recommendations to the Board of Directors regarding the directors to be appointed to each of its standing committees; |
| • | developing and recommending corporate governance guidelines for adoption by the Board of Directors; and |
86
Table of Contents
| • | overseeing annual self-assessments by the directors of the performance of the Board and its committees. |
Compensation Committee Interlocks and Insider Participation
Upon completion of the offering, none of the members of our compensation committee will be or will have been an officer or employee of the Company or any of our subsidiaries. In addition, none of our executive officers serves or has served as a member of the board of directors or compensation committee (or other board committee performing equivalent functions) of any entity that has one or more executive officers serving as one of our directors or as one of the members of our compensation committee.
Codes of Business and Ethical Conduct
We have adopted a Code of Business and Ethical Conduct for our officers and employees and a Code of Conduct which contains specific ethical policies and principles that apply to our Chief Executive Officer, Chief Financial Officer, FFB Chief Operating Officer and other key accounting and financial personnel. Upon completion of this offering, a copy of our Code of Business and Ethical Conduct will be accessible at the Investor Relations section of our website at www.ff-inc.com. We intend to disclose, at that same location on our website, any amendments to and any waivers of the requirements of the Code of Business and Ethical Conduct that may be granted to our Chief Executive Officer or Chief Financial Officer.
Director Compensation
Only non-employee directors are entitled to receive compensation for service on the Board and its Committees. The following table sets forth the compensation received by each of our non-employee directors for their service, during 2013, as members of our Board of Directors and its committees and as members of the Board of Directors of FFB:
| Fees Earned or Paid in Cash |
Stock Option Awards |
All Other Compensation |
Total | |||||||||||||
| James Brakke |
$ | 60,000 | $ | - | $ | - | $ | 60,000 | ||||||||
| Max Briggs |
60,000 | - | - | 60,000 | ||||||||||||
| Victoria Collins |
60,000 | - | - | 60,000 | ||||||||||||
| Michael Criste(2) |
60,000 | - | - | 60,000 | ||||||||||||
| Warren D. Fix |
60,000 | - | - | 60,000 | ||||||||||||
| Gerald Larsen(1) |
60,000 | - | - | 60,000 | ||||||||||||
| Mitchell M. Rosenberg |
60,000 | - | - | 60,000 | ||||||||||||
| Jacob Sonenshine |
60,000 | - | - | 60,000 | ||||||||||||
| Henri Tchen(2) |
60,000 | - | - | 60,000 | ||||||||||||
| (1) | Mr. Larsen was appointed as a director of FFI in October 2013. He has served as a member of the Board of Directors of FFB since 2008. |
| (2) | Mr. Criste and Mr. Tchen resigned from the Board of Directors effective as of March 31, 2014. |
Outstanding Equity Awards.
Our non-employee directors also are eligible to receive stock options and restricted stock grants under the Equity Plans (as defined in the section entitled “Executive Compensation—Equity Incentive Plans”). No stock options or shares of restricted stock were granted to non-employee directors in 2013. Stock options and shares of restricted stock granted to our non-employee directors generally vest over three years at the rate of 33 1⁄3% of the options or of the restricted shares as of each anniversary of the date of grant, provided that the director is still in the service of the Company or any of its subsidiaries on the vesting date.
87
Table of Contents
The following table sets forth information regarding outstanding stock options held by each non-employee director as of December 31, 2013, including the number of unexercised vested and unvested stock options. The vesting schedule for each option is shown following this table.
| Option Awards(1) | ||||||||||||||||
| Name / Grant Date |
Exercisable | Unexercisable | Exercise Price(2) |
Expiration Date(3) |
||||||||||||
| James Brakke |
||||||||||||||||
| 9/17/2007 |
15,000 | - | $ | 10.00 | 9/16/2017 | |||||||||||
| 1/27/2009 |
1,500 | - | 15.00 | 1/26/2019 | ||||||||||||
| Max Briggs |
||||||||||||||||
| 8/28/2012 |
5,000 | 10,000 | $ | 15.00 | 8/27/2022 | |||||||||||
| Victoria Collins |
||||||||||||||||
| 9/17/2007 |
40,500 | - | $ | 10.00 | 9/16/2017 | |||||||||||
| 1/27/2009 |
5,000 | - | 15.00 | 1/26/2019 | ||||||||||||
| Michael Criste(4) |
||||||||||||||||
| 8/28/2012 |
5,000 | 10,000 | $ | 15.00 | 8/27/2022 | |||||||||||
| Warren D. Fix |
||||||||||||||||
| 9/17/2007 |
15,000 | - | $ | 10.00 | 9/16/2017 | |||||||||||
| 1/27/2009 |
1,500 | - | 15.00 | 1/26/2019 | ||||||||||||
| Gerald L. Larsen |
||||||||||||||||
| 7/22/2008 |
10,000 | - | $ | 15.00 | 7/21/2018 | |||||||||||
| 1/27/2009 |
1,000 | - | 15.00 | 1/26/2019 | ||||||||||||
| Mitchell M. Rosenberg |
||||||||||||||||
| 9/17/2007 |
15,000 | - | $ | 10.00 | 9/16/2017 | |||||||||||
| 1/27/2009 |
1,500 | - | 15.00 | 1/26/2019 | ||||||||||||
| Jacob Sonenshine |
||||||||||||||||
| 9/17/2007 |
15,000 | - | $ | 10.00 | 9/16/2017 | |||||||||||
| 1/27/2009 |
1,500 | - | 15.00 | 1/26/2019 | ||||||||||||
| Henri Tchen(4) |
||||||||||||||||
| 9/17/2007 |
10,000 | - | $ | 10.00 | 9/16/2017 | |||||||||||
| 7/22/2008 |
5,000 | - | 15.00 | 7/21/2018 | ||||||||||||
| 1/27/2009 |
1,500 | - | 15.00 | 1/26/2019 | ||||||||||||
| 1/27/2011 |
6,000 | - | 15.00 | 1/26/2021 | ||||||||||||
| (1) | Stock options granted to the directors generally vest over three years at the rate of 33 1⁄3% of the options as of each anniversary of the date of grant, provided that the Director is still in the service of the Company or any of its subsidiaries on that anniversary date. |
| (2) | In accordance with the Company’s Stock Incentive Plans, the exercise prices of these options were equal to 100% of the fair market values of the Company’s shares as of the respective grant dates. Since no active market existed for the Company’s shares at each grant date above, in each instance the fair market value was determined by the Board of Directors based primarily on the prices at which the Company had most recently sold shares to investors who were not affiliated with any of the Company’s directors or executive officers. |
| (3) | The expiration date of each option award is 10 years from the date of its grant, subject to earlier termination on a cessation of service with the Company. |
| (4) | Mr. Criste and Mr. Tchen resigned from the Board of Directors effective as of March 31, 2014. |
88
Table of Contents
Named Executive Officers
Our “named executive officers” include our principal executive officer and our two other most highly compensated executive officers. For 2013, our named executive officers were:
| • | Ulrich E. Keller, Jr., who currently serves as our Executive Chairman, as well as a member of the Board of Directors. |
| • | Scott F. Kavanaugh, who currently serves as our Chief Executive Officer, as well as Vice Chairman and a member of the Board of Directors. Mr. Kavanaugh is our Principal Executive Officer. |
| • | John Hakopian, who currently serves as President of FFA, as well as a member of the Board of Directors. |
Summary Compensation Table
The following table sets forth, for our named executive officers, the compensation earned in the years ended December 31:
| Name and Position |
Year | Salary(1) | Bonus(2) | Stock Option Awards |
Total | |||||||||||||||
| Ulrich E. Keller, Jr., |
|
2013 |
|
$ |
450,000 |
|
$ |
180,000 |
|
$ |
- |
|
$ |
630,000 |
| |||||
| Executive Chairman of FFI and FFA |
2012 | 450,000 | 137,700 | - | 587,700 | |||||||||||||||
| Scott F. Kavanaugh, |
|
2013 |
|
|
456,000 |
(3) |
|
337,500 |
|
|
- |
|
|
793,500 |
| |||||
| Chief Executive Officer of FFI and FFB, Vice Chairman of FFI |
2012 | 456,000 | (3) | 286,900 | - | 742,900 | ||||||||||||||
| John Hakopian |
2013 | 365,000 | 146,000 | - | 511,000 | |||||||||||||||
| President of FFA |
2012 | 365,000 | 124,100 | - | 489,100 | |||||||||||||||
| (1) | Although Messrs. Keller, Kavanaugh and Hakopian are directors of the Company, they do not receive any fees or other compensation for their service as directors. |
| (2) | In 2013 and 2012, the Board of Directors established target bonus awards for each of the named executive officers, the payment of which was made contingent on FFI generating earnings, before taxes and bonuses, of $11.3 million in 2013 and $9.7 million in 2012. In 2013, and in 2012, Messrs. Kavanaugh and Hakopian each received 100% of their target bonus awards, the respective amounts of which are set forth in this column. |
| (3) | Mr. Kavanaugh’s salary includes a $6,000 per year automobile allowance for use of his personal automobile on Company business. |
In addition to the compensation set forth in the table above, each executive officer receives group health and life insurance benefits. Incidental job related benefits, including employer contributions under the Company’s 401k plan, totaled less than $10,000 for each of the named executive officers in 2013.
Employment Agreements
Each of our named executive officers is employed under an employment agreement for a term ending on December 31, 2016. Set forth below are summaries of the terms of those employment agreements. These summaries are not intended to be complete and are qualified in their entirety by reference to the employment agreements themselves.
89
Table of Contents
Material Terms of the Employment Agreements
Salaries. Each employment agreement provides for the payment of a base annual salary as follows: Mr. Keller: $500,000; Mr. Kavanaugh: $550,000; and Mr. Hakopian: $425,000. Those salaries are subject to review and may be increased, but not reduced, by the Board of Directors in its discretion.
Participation in Incentive Compensation and Employee Benefit Plans. Each of the employment agreements provides that the named executive officer will be entitled to participate in any management bonus or incentive compensation plans adopted by the Board or its Compensation Committee and in any qualified or any other retirement plans, stock option or equity incentive plans, life, medical and disability insurance plans and other benefit plans which FFI and its subsidiaries may have in effect, from time to time, for all or most of its senior executives.
Termination and Severance Provisions. Each employment agreement provides that the named executive officer’s employment may be terminated by the Company with or without cause or due to his death or disability or by the named executive officer with or without good reason. In the event of a termination of the named executive officer’s employment by the Company without cause or by the named executive officer for good reason, the Company will become obligated to pay severance compensation to the named executive officer in an amount equal to 12 months of his annual base salary or the aggregate annual base salary that would have been paid to the named executive officer for the remainder of the term of his employment agreement if such remaining term is shorter than 12 months (the “Termination Benefits Period”). In addition, during the Termination Benefits Period or until the named executive officer obtains employment with another employer that offers comparable health insurance benefits, whichever period is shorter, the Company will be obligated to continue to provide any group health plan benefits to the extent authorized by and consistent with 29 U.S.C. § 1161 et seq. (commonly known as “COBRA”), subject to payment of premiums by the named executive officer at the active employee’s rate then in effect.
Change of Control Agreements
The Company has entered into Change of Control Severance Agreements with each of its named executive officers. Each of those agreements provides that if the Company undergoes a Change of Control (as defined in such Agreements) while the named executive officer is still in the employ of the Company or one of its subsidiaries and, within the succeeding 12 months, the named executive officer terminates his employment due to the occurrence of any one of four “Good Reason Events” then the named executive officer will become entitled to receive the following severance compensation: (a) two times the sum of (i) his annual base salary as then in effect and (ii) the maximum bonus compensation that the named executive officer could have earned under any bonus or incentive compensation plan in which he was then participating, if any; (b) acceleration of the vesting of any then unvested stock options or restricted stock held by the named executive officer, and (c) continuation of health insurance benefits for a period that is the shorter of two years or until the named executive officer obtains employment with another employer that offers comparable health insurance benefits. However, each Change of Control Agreement provides that the severance compensation to which any named executive officer would otherwise receive under his agreement may not, in the aggregate, equal or exceed the amount which would result in the imposition of an excise tax pursuant to Section 280G of the Internal Revenue Code of 1986, as amended (the “Code”). Each of these Change of Control Agreements also provides that the payment of severance compensation to a named executive officer under such agreement will be in lieu of any severance compensation that the named executive officer would otherwise have been entitled to receive under his employment agreement. Each Agreement also provides that the payment of severance compensation must comply with the applicable requirements of Section 409A of the Code.
The Good Reason Events consist of the following: (i) a reduction or adverse change of the named executive officer’s authority; (ii) a material reduction in the named executive officer’s salary; (iii) a relocation of the named executive officer’s principal place of employment of more than 30 miles; or (iv) a material breach by
90
Table of Contents
the Company of its obligations under the named executive officer’s employment agreement. However, each Change of Control Agreement provides that in order for a named executive officer to become entitled to receive his severance compensation, he must give the Company written notice of his election to terminate his employment for Good Reason within 45 days of the date he is notified of the occurrence of the Good Reason Event. If the named executive officer fails to provide such a notice within that 45-day period or if the Company rescinds the action taken that constituted the Good Reason Event following receipt of that notice, the named executive officer will not become entitled and the Company will not be obligated to pay any severance compensation by reason of the occurrence of the Good Reason Event.
A Change of Control Agreement will terminate in the event the named executive officer’s employment is terminated by the Company for cause or due to his death or disability, or by the named executive officer without Good Reason, irrespective of whether such termination occurs prior to or after the consummation of a Change of Control of the Company.
Outstanding Equity Awards at Fiscal Year End
The following table sets forth information regarding outstanding stock options held by each of our named executive officers as of December 31, 2013, including the number of unexercised vested and unvested stock options. The vesting schedule for each option is shown following this table. None of our named executive officers has been granted any restricted stock.
Outstanding Equity Awards at 2013 Fiscal Year End
| Option Awards(1) | ||||||||||||||||
| Name / Grant Date |
Exercisable | Unexercisable | Exercise Price(2) |
Expiration Date(3) |
||||||||||||
| Ulrich E. Keller, Jr. |
||||||||||||||||
| 9/17/2007 |
40,500 | - | $ | 11.00 | 9/16/2017 | |||||||||||
| 1/27/2009 |
15,000 | - | 16.50 | 1/26/2019 | ||||||||||||
| 10/25/2011 |
26,666 | 13,334 | 16.50 | 10/24/2021 | ||||||||||||
| Scott F. Kavanaugh |
||||||||||||||||
| 9/17/2007 |
160,000 | - | 10.00 | 9/16/2017 | ||||||||||||
| 1/27/2009 |
20,000 | - | 15.00 | 1/26/2019 | ||||||||||||
| 10/25/2011 |
53,334 | 26,666 | 15.00 | 10/24/2021 | ||||||||||||
| John Hakopian |
||||||||||||||||
| 9/17/2007 |
40,500 | - | 10.00 | 9/16/2017 | ||||||||||||
| 1/27/2009 |
10,000 | - | 15.00 | 1/26/2019 | ||||||||||||
| 10/25/2011 |
26,666 | 13,334 | 15.00 | 10/24/2021 | ||||||||||||
| (1) | Stock options granted to the named executive officers generally vest over three years at the rate of 33 1⁄3% of the options as of each anniversary of the date of grant, provided that the executive is still employed by the Company on that anniversary date. |
| (2) | In accordance with the Company’s Equity Plans, the exercise prices were equal to or greater than 100% of the fair market values of the Company’s shares as of the respective grant dates. The exercise prices of incentive options granted to Mr. Keller were equal to 110% of the fair market value of a share of common stock on the date of grant because Mr. Keller owns more than 10% of the outstanding common stock of the Company. Since no active market existed for the Company’s shares at each grant date above, in each instance the fair market value was determined by the Board of Directors based primarily on the prices at which the Company had most recently sold shares to investors who were not affiliated with any of the Company’s directors or executive officers. |
| (3) | The expiration date of each option award is 10 years from the date of its grant, subject to earlier termination on a cessation of service with the Company. |
91
Table of Contents
Equity Incentive Plans
Overview. The Board of Directors of FFI adopted and the FFI shareholders approved two equity incentive plans in 2007: the 2007 Equity Incentive Plan and the 2007 Management Stock Incentive (the “Equity Plans”). The following description of each of our stock incentive plans is qualified by reference to the full text of those plans, which will be filed as exhibits to the registration statement of which this prospectus is a part. The Equity Plans authorize, in the issuance of up to 1,880,282 shares of common stock, in the aggregate, for the grant of stock options and restricted shares to officers, key employees, and non-employee directors of and consultants to FFI or any of its subsidiaries (“Plan Participants”). The purposes of the Equity Plans are (i) to enhance our ability to attract and retain the services of persons upon whose judgment, initiative and efforts the successful conduct and development of our business largely depends, (ii) to provide additional incentives to such persons to devote their utmost effort and skill to the advancement and betterment of FFI, by providing them an opportunity to participate in the ownership of FFI; and (iii) to better align the interests of management and key employees with those of the shareholders by giving Plan Participants an equity interest in the success and increased value of FFI.
Administration of the Equity Plans. The Equity Plans are administered by the Board of Directors or a Committee of the Board designated by it. The Equity Plans are currently administered by the Board of Directors. Following completion of this offering, the Equity Plans will be administered by our Compensation Committee.
Stock Options. The Equity Plans provide for the grant of incentive stock options (“ISOs”) under Section 422 of the Code, which can result in potentially favorable tax treatment to the optionee, and non-qualified stock options. The exercise price per share subject to an option may not be less than 100% of the fair market value of a share of FFI stock on the date of grant; except that with respect to any optionee who owns stock representing more than 10% of the voting power of all classes of stock of FFI, the exercise price per share subject to an ISO may not be less than 110% of the fair market value of a share of common stock on the date of grant. For purposes of the Equity Plans, the term “fair market value” means: (i) if FFI’s shares are listed on a stock exchange which reports closing sale prices, the closing sale price of its shares as reported by the principal exchange on which such shares are admitted or traded on the date as of which such value is being determined or, if there is no closing sale price for such date, on the next succeeding date for which a closing sale price is reported, (ii) if FFI’s shares are not listed on a stock exchange which reports closing sale prices, the average of the closing bid and ask prices for such a share of common stock in the over-the-counter market, or (iii) if the “fair market value” cannot be determined by either of these foregoing methods, then the “fair market value” shall be the value determined by the Board of Directors, on a good faith basis, using any reasonable method of valuation.
Restricted Stock. The Equity Plans provide for outright grants of shares of our common stock, that are subject to possible forfeiture if the Participant does not remain in the service of FFI or any of its subsidiaries for specified periods of time or if FFI or the Participant does not achieve specified financial or other performance goals established by the Board of Directors at the time such shares of restricted stock are granted. At the time these shares (“Restricted Shares”) are granted, the administrator of the Equity Plans determines the purchase price or other consideration, if any, that will be payable by the Participant for the Restricted Shares; the vesting requirements that, if not satisfied, will result in forfeiture of some or all of the Restricted Shares back to FFI, and the restrictions that will be imposed on those Restricted Shares or the rights of the holder with respect to those Shares prior to the time they cease to be subject to the risk of forfeiture (that is, become “vested”). A holder of Restricted Shares will have the rights of a shareholder with respect to the Restricted Shares only to the extent and subject to the restrictions established by the Board of Directors at the time of grant, as set forth in a restricted stock agreement pursuant to which the shares of restricted stock are granted to the Participant. Unless those restrictions provide otherwise, a holder of Restricted Shares will not be entitled to exercise voting rights with respect to such Restricted Shares or to receive any dividends that may be paid on the FFI’s outstanding shares of common stock. Subject to certain limited exceptions, Restricted Shares are not be transferable by the holder unless and until they become vested.
92
Table of Contents
As of March 31, 2014, the number of shares reserved for issuance, number of shares issued, number of shares underlying outstanding stock options and number of shares remaining available for future issuance under each of the Equity Plans is set forth in the table.
| Description |
Number of Shares Reserved for Issuance |
Number of Shares Issued |
Number of Shares Underlying Outstanding Options |
Number of Shares Remaining Available for Future Issuance |
||||||||||||
| 2007 Equity Incentive Plan |
1,100,113 | - | 890,937 | 209,176 | ||||||||||||
| 2007 Management Stock Incentive Plan |
780,169 | - | 693,000 | 87,169 | ||||||||||||
|
|
|
|
|
|
|
|
|
|||||||||
| Total |
1,880,282 | - | 1,583,937 | 296,345 | ||||||||||||
|
|
|
|
|
|
|
|
|
|||||||||
Compensation Risk Assessment
We believe that, although a portion of the compensation provided to our executives and other employees is subject to the achievement of specified financial performance criteria, our executive compensation program does not encourage excessive or unnecessary risk-taking. We do not believe that our compensation programs are reasonably likely to have a material adverse effect on us.
93
Table of Contents
CERTAIN RELATIONSHIPS AND RELATED PARTY TRANSACTIONS
In addition to the compensation arrangements with directors and executive officers described in “Executive Compensation” above, the following is a description of each transaction since January 1, 2011, and any proposed transaction in which:
| • | we have been or are to be a participant; |
| • | the amount involved exceeded or exceeds $120,000; and |
| • | any of our directors, executive officers or beneficial holders of more than 5% of our capital stock, or any immediate family member of or person sharing the same household with any of these individuals (other than tenants or employees), had or will have a direct or indirect material interest. |
Private Placement Transactions
In December 2013 we sold a total of 318,987 shares of our common stock, at a price of $18.00 per share, in a private placement to a total of 32 investors, (the “2013 Private Placement”). Between August 1, 2012 and March 31, 2013, we sold a total of 413,172 shares of our common stock, at a price of $15.00 per share, in a private placement to a total of 45 investors (the “2012 Private Placement”). Mr. Kavanaugh, our Chief Executive Officer, purchased 19,500 shares in the 2013 Private Placement, for which he paid $18.00 per share, for a total purchase price of $351,000. In the 2012 Private Placement, Mr. Kavanaugh purchased 13,334 shares, for which he paid $15.00 per share, for a total purchase price of $200,010; Roy Kavanaugh, a brother of Scott Kavanaugh, purchased 42,000 shares, for which they paid $15.00 per share, for a total purchase price of $630,000; and Emily Keller, a sister of Ulrich Keller, Jr., and her husband purchased 10,000 shares, for which they paid $15.00 per share, for a total purchase price of $150,000.
Directed Share Program. At our request, the underwriters have reserved for sale, at the initial public offering price, up to approximately 5.0% of the shares of our common stock being offered for sale by this prospectus to certain executive officers and members of our board of directors and certain business associates, friends and family of our executive officers and Board of Directors through a reserved share program. See “Underwriting—Directed Share Program”.
Ordinary Banking Relationships
FFB has had, and in the future may have, banking transactions in the ordinary course of its business with directors, principal shareholders and their associates, including the making of loans to directors and their associates. Such loans and other banking transactions were, and in the future will be, made on the same terms, including interest rates and collateral securing the loans, as those prevailing at the time for comparable transactions with persons of comparable creditworthiness who have no affiliation with the Company, FFB or any other subsidiaries of the Company and will be made only if they do not involve more than the normal risk of collectability and do not present any other unfavorable features at the times the loans are made.
Indemnification Agreements with our Directors and Officers
We are incorporated under the laws of the State of California. Section 317 of the CGCL provides that a California corporation may indemnify any persons who are, or are threatened to be made, parties to any threatened, pending or completed action, suit or proceeding, whether civil, criminal, administrative or investigative (other than an action by or in the right of such corporation), by reason of the fact that such person was an officer, director, employee or agent of such corporation, or is or was serving at the request of such corporation as an officer, director, employee or agent of another corporation or enterprise. The indemnity may include expenses (including attorneys’ fees), judgments, fines and amounts paid in settlement actually and reasonably incurred by such person in connection with such action, suit or proceeding, provided that such person acted in good faith and in a manner he or she reasonably believed to be in or not opposed to the corporation’s best interests and, with respect to any criminal action or proceeding, had no reasonable cause to believe that his or her conduct was illegal. Section 317 of the CGCL further authorizes a corporation to purchase and maintain
94
Table of Contents
insurance on behalf of any indemnified person against any liability asserted against and incurred by such person in any indemnified capacity, or arising out of such person’s status as such, regardless of whether the corporation would otherwise have the power to indemnify such person under the CGCL.
Section 204(a)(10) of the CGCL permits a corporation to provide in its articles of incorporation that a director of the corporation shall not be personally liable to the corporation or its shareholders for monetary damages for breach of fiduciary duties as a director, except for certain liabilities including liability for any:
| • | breach of a director’s duty of loyalty to the corporation or its shareholders; |
| • | act or omission not in good faith or that involves intentional misconduct or a knowing violation of law; |
| • | unlawful payment of dividends or redemption of shares; or |
| • | transaction from which the director derives an improper personal benefit. |
Our articles of incorporation authorize us to, and our amended and restated bylaws provide that we must, indemnify our directors and officers to the fullest extent authorized by the CGCL and also pay expenses incurred in defending any such proceeding in advance of its final disposition upon delivery of an undertaking, by or on behalf of an indemnified person, to repay all amounts so advanced if it should be determined ultimately that such person is not entitled to be indemnified under this section or otherwise.
As permitted by the CGCL, we have entered into indemnification agreements with each of our directors and certain of our officers. These agreements require us to indemnify these individuals to the fullest extent permitted under California law against liabilities that may arise by reason of their service to us, and to advance expenses incurred as a result of any proceeding against them as to which they could be indemnified.
We have an insurance policy covering our officers and directors with respect to certain liabilities, including liabilities arising under the Securities Act of 1933.
Insofar as indemnification for liabilities arising under the Securities Act may be permitted to directors, officers or persons controlling the registrant pursuant to the foregoing provisions, the registrant has been informed that in the opinion of the SEC such indemnification is against public policy as expressed in the Securities Act and is therefore unenforceable.
Procedures for Approval of Related Party Transactions
Transactions by FFI or FFB with related parties are subject to regulatory requirements and restrictions. These requirements and restrictions include Sections 23A and 23B of the Federal Reserve Act (which govern certain transactions by a bank with its affiliates) and the Federal Reserve Board’s Regulation O (which governs certain loans by FFB to its executive officers, directors, and principal shareholders). We have adopted policies to comply with these regulatory requirements and restrictions.
In addition, our Board has adopted written policy governing the approval of related party transactions that complies with all applicable SEC requirements and NASDAQ Listing Rules. FFI’s related parties include directors (including any nominee for election as a director), executive officers, 5% shareholders and the immediate family members of these persons. Our Chief Financial Officer, in consultation with other members of management and outside counsel, as appropriate, will review potential related party transactions to determine if they are subject to the policy. If so, the transaction will be referred to the Board of Directors for approval. In determining whether to approve a related party transaction, the Board of Directors will consider, among other factors, the fairness of the proposed transaction, the direct or indirect nature of the related party’s interest in the transaction, the appearance of an improper conflict of interests for any director or executive officer, taking into account the size of the transaction and the financial position of the related party, whether the transaction would impair an outside director’s independence, the acceptability of the transaction to our regulators and any possible violations of other of our corporate policies. Upon completion of the offering, our Related Party Transactions Policy will be available on our website at www.ff-inc.com.
95
Table of Contents
The following description summarizes the material terms and provisions of our articles of incorporation, as amended, and our amended and restated bylaws affecting the rights of holders of our capital stock. Because it is only a summary, it does not contain all the information that may be important to you. For a complete description, you should refer to our articles of incorporation and our amended and restated bylaws, each of which is included as an exhibit to the registration statement of which this prospectus is a part.
We are a California corporation and our authorized capital stock consists of and, upon the closing of this offering will continue to be, 20,000,000 shares of common stock, $0.001 par value, and 5,000,000 shares of preferred stock, $0.001 par value. As of December 31, 2013, a total of 7,733,514 shares of our common stock were issued and outstanding which were held of record by 903 shareholders. No shares of preferred stock had been issued or were outstanding and we do not have any current plans to sell or issue any shares of preferred stock.
Common Stock
Voting Rights. Holders of our common stock are entitled to one vote per share on all matters to be voted upon by shareholders, except that if any shareholder in attendance at a meeting of shareholders at which directors are to be elected announces, prior to the voting, an intention to cumulate votes in the election of directors, then all shareholders will be entitled to cumulate votes in that election. In an election of directors held by cumulative voting, each shareholder is entitled to cast a number of votes that is equal to the number of directors to be elected at the meeting, multiplied by the number of shares that the shareholder is entitled to vote at the meeting, and to cast all of those votes for a single nominee or to distribute those votes among any number or all of the nominees in such proportions as the shareholder may choose.
Dividend Rights. Subject to applicable law and any preferences that may be applicable to the holders of shares of preferred stock that may be outstanding, if any, the holders of common stock are entitled to receive such lawful dividends if, as and when declared by the board of directors.
Legal Restrictions on the Payment of Cash Dividends. California law imposes restrictions on the payment of cash dividends by California corporations. In addition, as a bank holding company, we are required to be a source of financial strength for our bank subsidiary and, therefore, we will not be permitted to pay dividends if, in the view of the FRB, doing so would weaken our financial condition or capital resources. Furthermore, cash dividends from FFB and FFA will constitute the principal sources of cash available to us to pay dividends to shareholders in the future. However, there also are statutory and regulatory restrictions on their ability to pay cash dividends to us. Therefore, dividend payment restrictions on FFB and FFA may limit the amount of cash that we will have to pay dividends to shareholders. For additional information regarding restrictions on our ability to pay dividends, see the section entitled “Dividend Policy.”
Rights upon Dissolution. In the event of the liquidation, dissolution or winding up of the Company, subject to the rights of the holders of any then outstanding shares of preferred stock, the holders of our common stock will be entitled to receive all of our assets remaining after satisfaction of all our liabilities and the payment of any liquidation preference of any outstanding preferred stock. There are no redemption or sinking fund provisions applicable to our common stock.
Other than the rights described above, the holders of common stock have no preemptive, subscription, redemption, sinking fund or conversion rights and are not subject to further calls or assessments. The rights of holders of common stock will be subject to, and may be adversely affected by, the rights of any series of preferred stock which we may issue in the future.
96
Table of Contents
Preferred Stock
Our Board of Directors has the authority, without further action by the shareholders, to issue up to an aggregate of 5,000,000 shares of preferred stock in one or more series, and to fix the rights, preferences and privileges of such shares, including voting rights, terms of redemption, redemption prices, liquidation preference and number of shares constituting and the designation of any series of preferred stock. The availability of shares of preferred stock for future issuance by action of the Board of Directors is intended to provide us with the flexibility to take advantage of opportunities to raise additional capital through the issuance of shares that address competitive conditions in the securities markets. The rights of the holders of our common stock will be subject to, and may be adversely affected by, the rights of the holders of any preferred stock that we may issue in the future. Although we presently have no plans to do so, the Board of Directors, without shareholder approval, may issue preferred stock with voting or conversion rights which could adversely affect the voting power of the holders of our common stock. This provision may be deemed to have a potential anti-takeover effect, because the issuance of such preferred stock may delay or prevent a change of control of the Company. Furthermore, shares of preferred stock, if any are issued, may have other rights, including economic rights, senior to our common stock, and, as a result, the issuance of preferred stock could reduce the market prices of the common stock.
Options and Restricted Stock
As of December 31, 2013, options to purchase a total of 1,430,967 shares of common stock were outstanding, and 7,666 shares of restricted stock grants were not yet vested. As of that same date, 362,470 shares of our common stock remained available for future issuance under our Equity Incentive Plans.
Desert Commercial Bank Acquisition
The merger agreement with DCB provides that if, as of the second anniversary of the consummation of the DCB Acquisition, actual losses on those assets total less than $4.5 million, we will issue to the former DCB shareholders a number of additional shares of our common stock determined by dividing the price per share of $15.00 into 90% of the amount, if any, by which $4.5 million exceeds the losses incurred on those assets (or a maximum of 270,000 shares of our common stock). Based on the performance of those assets through March 31, 2014, we believed, as of that date, that it was unlikely that any of these shares would become issuable. However, since the final determination will be based on the performance of those assets through August 15, 2014, some of these shares may ultimately become issuable to the former shareholders of DCB.
Antitakeover Provisions of California Law
We are subject to the provisions of Section 1203 of the CGCL, which contains provisions that may have the effect of deterring hostile takeovers or delaying or preventing changes in control in which our shareholders could receive a premium for their shares or other changes in our management. First, if an “interested person” makes an offer to purchase the shares of some or all of our existing shareholders, we must obtain an affirmative opinion in writing as to the fairness of the offering price prior to completing the transaction. California law considers a person to be an “interested person” if the person directly or indirectly controls our company, if the person is directly or indirectly controlled by one of our officers or directors, or if the person is an entity in which one of our officers or directors holds a material financial interest. If, after receiving an offer from such an “interested person”, we receive a subsequent offer from a neutral third party, then we must notify our shareholders of this offer and afford each of them the opportunity to withdraw their consent to the “interested person” offer.
We are also subject to other provisions of the CGCL, which include voting requirements that may also have the effect of deterring hostile takeovers, disposing of our assets or delaying or preventing changes in control or our management. Under Section 1101 of the CGCL, if a single entity or constituent corporation owns more than 50% but less than 90% of the outstanding shares of any class of our capital stock and attempts to merge our Company into itself or other constituent corporation, the Company’s non-redeemable securities may only be exchanged for non-redeemable securities of the surviving entity, unless all of our shareholders consent to the
97
Table of Contents
transaction or the terms of the transaction are approved and determined to be fair by the California Department of Business Oversight (or DBO). Section 1001(d) of the CGCL provides that any proposed sale or disposition of all or substantially all of our assets to any other corporation that we are controlled by or under common control with must be consented to by our shareholders holding at least 90% of the outstanding shares of our capital stock or approved and determined fair by the DBO. Sections 1101 and 1001 of the CGCL could make it significantly more difficult for a third-party to acquire control of our Company by preventing a possible acquirer from cashing out minority shareholders or selling substantially all of our assets to a related party and therefore could discourage a hostile bid, or delay, prevent or deter entirely a merger, acquisition or tender offer in which our shareholders could receive a premium for their shares, or effect a proxy contest for control of us or other changes in our management.
Antitakeover Provisions of our Articles of Incorporation and Amended and Restated Bylaws
Certain provisions of our articles of incorporation, as amended, and amended and restated bylaws highlighted below may have anti-takeover effects and may delay, prevent or make more difficult unsolicited tender offers or takeover attempts that a shareholder may consider to be in his or her best interest, including those attempts that might result in a premium over the market price for the shares held by shareholders. These provisions may also have the effect of making it more difficult for third parties to cause the replacement of our current management. Among other things, our articles of incorporation and amended and restated bylaws:
| • | enable our Board of Directors to issue “blank check” preferred stock up to the authorized amount, with such preferences, limitations and relative rights, including voting rights, as may be determined from time to time by the Board; |
| • | enable our Board of Directors to fill vacant directorships except for vacancies created by the removal of a director; |
| • | enable our Board of Directors to amend our bylaws without shareholder approval subject to certain exceptions; and |
| • | establish an advance notice procedure with regard to business to be brought before an annual or special meeting of shareholders and with regard to the nomination of candidates for election as directors. |
In addition, the corporate laws and regulations applicable to us enable our Board of Directors to issue, from time to time and at its discretion, but subject to applicable listing rules of the NASDAQ Stock Market, any authorized but unissued shares of our common stock or preferred stock. The ability of our Board of Directors to issue authorized but unissued shares of our common stock or preferred stock at its sole discretion may enable our Board to sell shares to individuals or groups who the Board perceives as friendly with management, which may make more difficult unsolicited attempts to obtain control of our organization. In addition, the ability of our Board of Directors to issue authorized but unissued shares of our capital stock at its sole discretion could deprive the shareholders of opportunities to sell their shares of common stock or preferred stock for prices higher than prevailing market prices.
Transfer Agent and Registrar
The transfer agent and registrar for our common stock is Computershare Trust Company, N.A. Its address is 250 Royall Street, Canton, Massachusetts 02021 and its telephone number is (732) 512-3172.
NASDAQ Global Market Listing
We have applied to list our common stock on the NASDAQ Global Market under the symbol “FFWM.”
98
Table of Contents
The following table sets forth certain information with respect to the beneficial ownership of our common stock, as of April 30, 2014 and immediately after the closing of this offering, for:
| • | each of our named executive officers; |
| • | each of our directors; |
| • | all our executive officers and directors as a group; and |
| • | each person, or group of affiliated persons, known by us to be the beneficial owner of more than 5% of our outstanding shares of our common stock. |
For purposes of the table below, the percentage ownership calculations for purposes of determining the beneficial ownership of our directors and executive officers prior to this offering are based on 7,733,514 shares of our common stock outstanding as of April 30, 2014. The table below assumes that there will be 9,955,736 shares of our common stock outstanding immediately following the closing of this offering.
Under the rules and regulations of the SEC, a person is deemed to be the beneficial owner of (i) shares with respect to which that person has, either alone or with others, the power to vote or dispose of those shares; and (ii) shares which that person may acquire on exercise of options or other rights to purchase shares of our common stock at any time during a 60 day period which, for purposes of this table, will end on June 29, 2014. The number of shares subject to options that are exercisable or may become exercisable during that 60 day period are deemed outstanding for purposes of computing the number of shares beneficially owned by, and the percentage ownership of, the person holding such options, but not for computing the percentage ownership of any other shareholder named in this table. Except as otherwise noted below, we believe that the persons named in the table have sole voting and dispositive power with respect to all shares shown as beneficially owned by them, subject to community property laws where applicable.
The business address for each director and named executive officer listed is 18101 Von Karman Avenue, Suite 700, Irvine, California 92612.
| As of April 30, 2014(1) | After this Offering(1) | |||||||||||||||
| Name and Title |
Number of Shares Beneficially Owned(2) |
Percent of Class |
Number of Shares Beneficially Owned(2) |
Percent of Class(3) |
||||||||||||
| Ulrich Keller, Jr., Executive Chairman |
1,382,751 | (4) | 17.7 | % | 1,382,751 | 13.8 | % | |||||||||
| Scott Kavanaugh, Vice Chairman and CEO |
599,501 | 7.5 | % | 599,501 | 5.9 | % | ||||||||||
| James Brakke, Director |
55,117 | * | 55,117 | * | ||||||||||||
| Max Briggs, Director |
19,474 | (5) | * | 19,474 | * | |||||||||||
| Victoria Collins, Director |
432,709 | (6) | 5.6 | % | 432,709 | 4.3 | % | |||||||||
| Warren Fix, Director |
51,167 | (7) | * | 51,167 | * | |||||||||||
| John Hakopian, Director and President of FFA |
464,846 | 6.0 | % | 464,846 | 4.6 | % | ||||||||||
| Gerald Larsen, Director |
20,700 | * | 20,700 | * | ||||||||||||
| Mitchell M. Rosenberg, Director |
39,500 | * | 39,500 | * | ||||||||||||
| Jacob Sonenshine, Director |
39,500 | * | 39,500 | * | ||||||||||||
| All Directors and Executive Officers as a Group (12 persons) |
3,374,597 | 39.8 | % | 3,374,597 | 31.5 | % | ||||||||||
| * | Represents less than one (1%) percent of the shares outstanding as of April 30, 2014 and to be outstanding after the offering. |
99
Table of Contents
| (1) | This table is based upon information supplied to us by our officers, directors and principal shareholders. Except as otherwise noted, we believe that each of the shareholders named in the table has sole voting and investment power with respect to all shares of common stock shown as to which he or she is shown to be the beneficial owner, subject to applicable community property laws. The percentage ownership interest of each individual or group is based upon the total number of shares of the Company’s common stock outstanding plus the shares which the respective individual or group has the right to acquire within 60 days after April 30, 2014 through the exercise of stock options. |
| (2) | Includes shares that may be acquired within 60 days of April 30, 2014 pursuant to the exercise of stock options. Shares subject to options are as follows: Mr. Keller—82,166 shares; Mr. Kavanaugh—233,334 shares; Messrs. Brakke, Fix, Sonenshine and Dr. Rosenberg,—16,500 shares each; Dr. Collins—45,500 shares; Mr. Hakopian—77,166 shares; Mr. Briggs—5,000 shares; Mr. Larsen—11,000 shares; and Directors and Executive Officers as a Group—754,498 shares. |
| (3) | Assumes no exercise of the underwriters’ option to purchase additional shares. See section entitled “Underwriting.” |
| (4) | Includes 100,000 shares beneficially owned by Mr. Keller’s wife, as to which he disclaims beneficial ownership. |
| (5) | Includes 3,000 shares beneficially owned by Mr. Briggs wife, as to which he disclaims beneficial ownership. |
| (6) | Includes 10,000 shares beneficially owned by Dr. Collins husband, as to which she disclaims beneficial ownership. |
| (7) | Includes 5,000 shares beneficially owned by Mr. Fix’s wife, as to which he disclaims beneficial ownership. |
100
Table of Contents
SHARES ELIGIBLE FOR FUTURE SALE
Future sales of substantial numbers of our shares of common stock in the public market, or the perception that substantial sales could occur, may adversely affect the market prices of our shares prevailing from time to time and could impair our ability to raise capital through sales of our equity securities in the future. Upon completion of this offering 9,955,736 shares of our common stock will be outstanding (or 10,289,069 shares if the underwriters’ exercise their overallotment option in full). Of those shares:
| • | approximately 6,979,286 shares, comprised of 4,757,064 currently outstanding shares and the 2,222,222 shares to be sold in this offering (or 2,555,555 shares if the underwriters’ exercise their overallotment option in full), will be freely tradable without restriction under the Securities Act beginning immediately on the date of this prospectus; and |
| • | a total of 2,904,036 shares, including the shares owned by our directors and executive officers which, as a general matter, will be subject to resale restrictions under, and will be saleable only in compliance with, SEC Rule 144, which is described below. |
Additionally a total 2,692,513 of our outstanding shares of common stock (which includes the 2,620,099 shares owned by our directors and executive officers) will be subject to the lock-up agreements described below which, subject to certain limited exceptions, prohibit sales or other dispositions of those shares during the six months commencing on the date of this prospectus (the “Lock-up Period”). Moreover, if any of our directors or executive officers purchase any shares in this offering, those shares also will be subject to the six-month lock-up agreements, as well as to the resale restrictions in Rule 144.
However, as a result of those lock-up agreements, the perception may arise that sales in the public market of substantial numbers of the shares owned by our directors and officers will occur once the six-month Lock-up Period expires. This perception also may adversely affect the prevailing market prices of our shares and our ability to raise equity capital in the future.
The foregoing discussion assumes that there will be an active market for our shares following this completion of this offering and we have applied to have our common stock approved for listing on The NASDAQ Global Market under the symbol “FFWM”. However we cannot assure you that an active public market will develop or will be sustained for our common stock following this offering.
Lock-up Agreements
In connection with this offering, each of our executive officers and directors has entered into a lock-up agreement with the underwriters for this offering that restricts the sale of shares of our common stock by them during the six-month Lock-up Period that commences on the date of this prospectus. Sandler O’Neill + Partners, L.P., on behalf of the underwriters, may, in its sole discretion and without notice, choose to release any or all of the shares of our common stock subject to these lock-up agreements at any time prior to the expiration of that six-month Lock-up Period. For additional information, see the section in this prospectus entitled “Underwriting.”
Rule 144
We registered our shares with the SEC under the Exchange Act effective December 16, 2013 and, as of March 16, 2014, we will have been subject to the reporting requirements of the Exchange Act for 90 days. As a result, pursuant to Rule 144, a shareholder who purchased shares of our common stock subject to the resale restrictions of Rule 144, will be entitled to sell those of such shares which he or she had fully paid for and owned for at least six months, provided that the shareholder is not, and during the preceding three months had not been, one of our affiliates. For purposes of Rule 144, an “affiliate” includes our directors and executive officers and any other person who may own beneficially 10% or more of our outstanding shares of common stock.
101
Table of Contents
Under Rule 144, a person who is one of our affiliates, or was one of our affiliates at any time during the three months preceding a sale by the affiliate of any of his or her shares of common stock and has beneficially owned those shares for at least six months, will be entitled (subject to any lock-up restrictions in effect at that time) to sell, within any three-month period, a number of shares of our common stock that does not exceed the greater of:
| • | One percent of the number of shares of our common stock outstanding at the time of the sale, which will equal approximately 99,557 shares following this offering; and |
| • | The average weekly trading volume in our common stock on the NASDAQ Global Market during the four calendar weeks preceding the date a Notice of Proposed Sale of Securities Pursuant to Rule 144 is filed with the SEC with respect to the sale. |
Sales by affiliates under Rule 144 are also subject to manner of sale requirements and to a requirement that information about us is available on a current basis.
Stock Options and Form S-8 Registration Statement
On January 30, 2014, we filed a registration statement on Form S-8 under the Securities Act to register all of the shares of our common stock underlying outstanding options and other equity awards issuable pursuant to our equity incentive plans. As a result, all of those shares will be freely tradable in the open market subject to any vesting requirements applicable to these options or other equity awards (and, in the case of our affiliates, subject to their lock-up agreements and to the volume limitations and manner of sale requirements of Rule 144). See “Executive Compensation—Equity Incentive Plans” for additional information regarding these equity incentive plans.
102
Table of Contents
Both federal and state laws extensively regulate bank holding companies and banks. Such regulation is intended primarily for the protection of depositors and the FDIC’s deposit insurance fund and is not for the benefit of shareholders. Set forth below are summary descriptions of the material laws and regulations that affect or bear on our operations. Those summaries are not intended, and do not purport, to be complete and are qualified in their entirety by reference to the laws and regulations that are summarized below.
First Foundation Inc.
General. First Foundation Inc. is a registered bank holding company subject to regulation under the Bank Holding Company Act of 1956, as amended (the “Holding Company Act”). Pursuant to that Act, we are subject to supervision and periodic examination by, and are required to file periodic reports with the FRB.
As a bank holding company, we are allowed to engage, directly or indirectly, only in banking and other activities that the FRB has determined, or in the future may deem, to be so closely related to banking or managing or controlling banks as to be a proper incident thereto. Business activities designated by the FRB to be closely related to banking include the provision of investment advisory, securities brokerage, insurance agency and data processing services, among others.
As a bank holding company, we also are required to obtain the prior approval of the FRB for the acquisition of more than 5% of the outstanding shares of any class of voting securities, or of substantially all of the assets, by merger or purchase, of (i) any bank or other bank holding company and (ii) any other entities engaged in banking-related businesses or that provide banking-related services.
Under FRB regulations, a bank holding company is required to serve as a source of financial and managerial strength to its subsidiary banks and may not conduct its operations in an unsafe or unsound manner. In addition, it is the FRB’s policy that a bank holding company, in serving as a source of strength to its subsidiary banks, should stand ready to use available resources to provide adequate capital funds to its subsidiary banks during periods of financial stress or adversity and should maintain the financial flexibility and capital-raising capacity to obtain additional resources for assisting its subsidiary banks. For that reason, among others, the FRB requires all bank holding companies to maintain capital at or above certain prescribed levels. A bank holding company’s failure to meet these requirements will generally be considered by the FRB to be an unsafe and unsound banking practice or a violation of the FRB’s regulations or both, which could lead to the imposition of restrictions on the offending bank holding company, including restrictions on its further growth.
Additionally, among its powers, the FRB may require any bank holding company to terminate an activity or terminate control of, or liquidate or divest itself of, any subsidiary or affiliated company that the FRB determines constitutes a significant risk to the financial safety, soundness or stability of the bank holding company or any of its banking subsidiaries. The FRB also has the authority to regulate provisions of a bank holding company’s debt, including authority to impose interest ceilings and reserve requirements on such debt. Subject to certain exceptions, bank holding companies also are required to file written notice and obtain approval from the FRB prior to purchasing or redeeming their common stock or other equity securities. A bank holding company and its non-banking subsidiaries also are prohibited from implementing so-called tying arrangements whereby clients may be required to use or purchase services or products from the bank holding company or any of its non-bank subsidiaries in order to obtain a loan or other services from any of the holding company’s subsidiary banks.
Because FFB is a California state chartered bank, the Company also is a bank holding company within the meaning of Section 3700 of the California Financial Code. As such, we are subject to examination by, and may be required to file reports with, the DBO.
103
Table of Contents
Financial Services Modernization Act. The Financial Services Modernization Act, which also is known as the Gramm-Leach-Bliley Act, was enacted into law in 1999. The principal objectives of that Act were to establish a comprehensive framework to permit affiliations among commercial banks, insurance companies, securities and investment banking firms, and other financial service providers. Accordingly, the Act revised and expanded the Bank Holding Company Act to permit a bank holding company system meeting certain specified qualifications to engage in a broader range of financial activities to foster greater competition among financial services companies both domestically and internationally.
The Financial Services Modernization Act also contains provisions that expressly preempt and make unenforceable any state law restricting the establishment of financial affiliations, primarily related to insurance. That Act also:
| • | broadened the activities that may be conducted by national banks, bank subsidiaries of bank holding companies, and their financial subsidiaries; |
| • | provided an enhanced framework for protecting the privacy of consumer information; |
| • | adopted a number of provisions related to the capitalization, membership, corporate governance, and other measures designed to modernize the Federal Home Loan Bank system; |
| • | modified the laws governing the implementation of the Community Reinvestment Act (“CRA”), which is described in greater detail below; and |
| • | addressed a variety of other legal and regulatory issues affecting both day-to-day operations and long-term activities of banking institutions. |
According to current FRB regulations, activities that are financial in nature and may be engaged in by financial holding companies, through their non-bank subsidiaries, include
| • | securities underwriting, dealing and market making; |
| • | sponsoring mutual funds and investment companies; |
| • | engaging in insurance underwriting; and |
| • | engaging in merchant banking activities. |
Before a bank holding company may engage in any of the financial activities authorized by the Financial Services Modernization Act, it must file an application with its Federal Reserve Bank that confirms that it meets certain qualitative eligibility requirements established by the FRB. A bank holding company that meets those qualifications and files such an application will be designated as a “financial holding company,” in which event it will become entitled to affiliate with securities firms and insurance companies and engage in other activities, primarily through non-banking subsidiaries, that are financial in nature or are incidental or complementary to activities that are financial in nature.
A bank holding company that does not qualify as a financial holding company may not engage in such financial activities. Instead, as discussed above, it is limited to engaging in banking and such other activities that have been determined by the FRB to be closely related to banking.
Privacy Provisions of the Financial Services Modernization Act. As required by the Financial Services Modernization Act, federal banking regulators have adopted rules that limit the ability of banks and other financial institutions to disclose nonpublic information about consumers to nonaffiliated third parties. Pursuant to the rules, financial institutions must provide:
| • | initial notices to clients about their privacy policies, describing the conditions under which banks and other financial institutions may disclose non-public personal information about their clients to non-affiliated third parties and affiliates; |
104
Table of Contents
| • | annual notices of their privacy policies to current clients; and |
| • | a reasonable method for clients to “opt out” of disclosures to nonaffiliated third parties. |
Acquisitions of Control of Banks. The Holding Company Act and the Change in Bank Control Act of 1978, as amended, together with regulations of the FRB, require FRB approval before any person or company may acquire “control” of a bank holding company, subject to exemptions for some transactions. Control is conclusively presumed to exist if an individual or company (i) acquires 25% or more of any class of voting securities of a bank holding company or (ii) has the direct or indirect power to direct or cause the direction of the management and policies of a bank holding company, whether through ownership of voting securities, by contract or otherwise; provided that no individual will be deemed to control a bank holding company solely on account of being a director, officer or employee of the bank holding company. Control is presumed to exist if a person acquires 10% or more but less than 25% of any class of voting securities of a bank holding company with securities registered under Section 12 of the Exchange Act or if no other person will own a greater percentage of that class of voting securities immediately after the transaction.
However, as a bank holding company, we must obtain the prior approval of the FRB to acquire more than five percent of the outstanding shares of voting securities of a bank or another bank holding company.
Dividends. It is the policy of FRB that bank holding companies should generally pay dividends on common stock only out of income available over the past year, and only if prospective earnings retention is consistent with the holding company’s expected future needs for capital and liquidity and to maintain its financial condition. It is also an FRB policy that bank holding companies should not maintain dividend levels that undermine their ability to be a source of financial strength for their banking subsidiaries. Additionally, due to the current financial and economic environment, the FRB has indicated that bank holding companies should carefully review their dividend policies and has discouraged dividend payment ratios that are at maximum allowable levels unless both asset quality and capital are very strong.
Recent Legislation and Governmental Actions. From time to time, federal and state legislation is enacted which can affect our operations and our operating results by materially increasing the costs of doing business, limiting or expanding the activities in which banks and other financial institutions may engage, or altering the competitive balance between banks and other financial services providers.
The recent economic recession and credit crisis that, among other measures, required the federal government to provide substantial financial support to the largest of the banks and other financial service organizations in the United States, led the U.S. Congress to adopt a number of new laws, and the U.S. Treasury Department and the federal banking regulators, including the FRB and the FDIC, to take broad actions, to address systemic risks and volatility in the U.S. banking system. Set forth below are summaries of such recently adopted laws and regulatory actions, which are not intended to be complete and which are qualified in their entirety by reference to those laws and regulations.
The Dodd-Frank Act: On July 21, 2010, the Dodd-Frank was signed into law. The Dodd-Frank Act significantly changes federal banking regulation. Among other things, the Dodd-Frank Act created a new Financial Stability Oversight Council to identify systemic risks in the banking and financial system and gives federal regulators new authority to take control of and liquidate banking institutions and other financial firms facing the prospect of imminent failure that would create systemic risks to the U.S. financial system. The Dodd-Frank Act also created the Consumer Financial Protection Bureau (“CFPB”), which is a new independent federal regulator with broad powers and authority to administer and regulate federal consumer protection laws.
105
Table of Contents
Set forth below is a summary description of some of the key provisions of the Dodd-Frank Act that may affect us. The description does not purport to be complete and is qualified in its entirety by reference to the Dodd-Frank Act itself.
Imposition of New Capital Standards on Bank Holding Companies. The Dodd-Frank Act required the FRB to apply consolidated capital requirements to bank holding companies that are no less stringent than those currently applied to depository institutions, such as FFB. The FRB implemented this requirement by its adoption of the new Basel III capital rules in June 2013. See “—First Foundation Bank—New Basel III Capital Rules” below.
Increase in Deposit Insurance and Changes Affecting the FDIC Insurance Fund. The Dodd-Frank Act permanently increased the maximum deposit insurance amount for banks, savings institutions and credit unions to $250,000 per depositor. Additionally, the Dodd-Frank Act eliminates the federal statutory prohibition against the payment of interest on business checking accounts, which is likely to increase the competition for and interest that banks pay on such accounts. The Dodd-Frank Act also broadens the base for FDIC insurance assessments, which will now be based on the average consolidated total assets, less tangible equity capital, of an insured financial institution and which may result in increases in FDIC insurance assessments for many FDIC insured banks. The Dodd-Frank Act requires the FDIC to increase the reserve ratio of the Deposit Insurance Fund from 1.15% to 1.35% of insured deposits by 2020 and eliminates the requirement that the FDIC pay dividends to insured depository institutions when the reserve ratio exceeds certain thresholds.
Executive Compensation Provisions. The Dodd-Frank Act directs federal banking regulators to promulgate rules prohibiting the payment of excessive compensation to executives of depository institutions and their holding companies with assets in excess of $1.0 billion.
Limitations on Conversion of Bank Charters. The Dodd-Frank Act prohibits a bank or other depository institution from converting from a state to federal charter or vice versa while it is subject to a cease and desist order or other formal enforcement action or a memorandum of understanding with respect to a significant supervisory matter, unless the appropriate federal banking agency gives notice of the conversion to the federal or state regulatory agency that issued the enforcement action and that agency does not object within 30 days.
Interstate Banking. The Dodd-Frank Act authorizes national and state banks to establish branches in other states to the same extent as a bank chartered by that state would be permitted to branch. Previously, banks could only establish branches in other states if the host state expressly permitted out-of-state banks to establish branches in that state. Accordingly, banks will be able to enter new markets more freely.
Extension of Limitations on Banking Transactions by Banks with their Affiliates. The Dodd-Frank Act applies Section 23A and Section 22(h) of the Federal Reserve Act (governing transactions with insiders of banks and other depository institutions) to derivative transactions, repurchase agreements and securities lending and borrowing transactions that create credit exposure to an affiliate or an insider of a bank. Any such transactions with any affiliates must be fully secured. In addition, the exemption from Section 23A for transactions with financial subsidiaries has been eliminated. The Dodd-Frank Act also expands the definition of affiliate for purposes of quantitative and qualitative limitations of Section 23A of the Federal Reserve Act to include mutual funds advised by a depository institution or any of its affiliates.
Debit Card Fees. The Dodd-Frank Act provides that the amount of any interchange fee charged by a debit card issuer with respect to a debit card transaction must be reasonable and proportional to the cost incurred by the card issuer and requires the FRB to establish standards for reasonable and proportional fees which may take into account the costs of preventing fraud. As a result, the FRB adopted a rule, effective October 1, 2011, which limits interchange fees on debit card transactions to a maximum of 21 cents per transaction plus 5 basis points of the transaction amount. A debit card issuer may recover an additional one cent per transaction for fraud prevention purposes if the issuer complies with certain fraud-related requirements prescribed by the FRB.
106
Table of Contents
Although, as a technical matter, this new limitation applies only to institutions with assets of more than $10 billion, it is expected that many smaller institutions will reduce their interchange fees in order to remain competitive with the larger institutions that are required to comply with this new limitation.
Consumer Protection Provisions of the Dodd-Frank Act. The Dodd-Frank Act created a new, independent federal agency, called the Consumer Financial Protection Bureau (“CFPB”), which has been granted broad rulemaking, supervisory and enforcement powers under various federal consumer financial protection laws, including the Equal Credit Opportunity Act, Truth in Lending Act, Real Estate Settlement Procedures Act, Fair Credit Reporting Act, Fair Debt Collection Act, the Consumer Financial Privacy provisions of the Gramm-Leach-Bliley Act and certain other statutes. The CFPB has examination and primary enforcement authority with respect to the compliance by depository institutions with $10 billion or more in assets with federal consumer protection laws and regulations. Smaller institutions are subject to rules promulgated by the CFPB, but continue to be examined and supervised by federal banking regulators for consumer compliance purposes. The CFPB has authority to prevent unfair, deceptive or abusive practices in connection with the offering of consumer financial products. The Dodd-Frank Act also (i) authorizes the CFPB to establish certain minimum standards for the origination of residential mortgages, including a determination of the borrower’s ability to repay, and (ii) will allow borrowers to raise certain defenses to foreclosure if they receive any loan other than a “qualified mortgage” as defined by the CFPB. The Dodd-Frank Act permits states to adopt consumer protection laws and standards that are more stringent than those adopted at the federal level and, in certain circumstances, permits state attorneys general to enforce compliance with both the state and federal financial consumer protection laws and regulations.
In January 2013, the CFPB approved certain mortgage lending reform regulations impacting the Truth in Lending Act (the “TILA”) and the Real Estate Settlement Procedures Act (“RESPA”). Among other things, those reforms:
| • | expand the population of loans that are subject to higher cost loan regulations and additional disclosures; |
| • | prohibit the payment of compensation to mortgage brokers based on certain fees or premiums, such as yield spread premiums, payable by or charged to home borrowers; |
| • | increase the regulation of mortgage servicing activities, including with respect to error resolution, forced-placement insurance and loss mitigation and collection activities; |
| • | require financial institutions to make a reasonable and good faith determination that the borrower has the ability to repay the residential mortgage loan before it is approved for funding and provides that the failure of a financial institution to make such a determination will entitle the borrower to assert that failure as a defense to any foreclosure action on the mortgage loan; and |
| • | impose appraisal requirements for high cost loans and loans secured by first mortgage liens on residential real estate. |
The CFPB issued final rules for residential mortgage lending, which became effective January 10, 2014, including definitions for “qualified mortgages” and detailed standards by which leaders must satisfy themselves of the borrower’s ability to repay the loan and revised forms of disclosure under the TILA and RESPA.
First Foundation Bank
General. FFB is subject to primary supervision, periodic examination and regulation by (i) the FDIC, which is its primary federal banking regulator, and (ii) the DBO, because FFB is a California state chartered bank.
Various requirements and restrictions under Federal and California banking laws affect the operations of FFB. These laws and the implementing regulations, which are promulgated by federal and state bank regulatory
107
Table of Contents
agencies, can determine the extent of supervisory control to which a bank will be subject by its federal and state bank regulators. These laws and regulations cover most aspects of a bank’s operations, including:
| • | the reserves a bank must maintain against deposits and for possible loan losses and other contingencies; |
| • | the types of deposits it obtains and the interest it is permitted to pay on different types of deposit accounts; |
| • | the types of and limits on loans and investments that a bank may make; |
| • | the borrowings that a bank may incur; |
| • | the number and location of wealth banking offices that a bank may establish; |
| • | the rate at which it may grow its assets; |
| • | the acquisition and merger activities of a bank; |
| • | the amount of dividends that a bank may pay; and |
| • | the capital requirements that a bank must satisfy. |
If, as a result of an examination of a federally regulated bank, a bank’s primary federal bank regulatory agency, such as the FDIC, were to determine that the financial condition, capital resources, asset quality, earnings prospects, management, liquidity, or other aspects of a bank’s operations had become unsatisfactory or that the bank or its management was in violation of any law or regulation, that agency has the authority to take a number of different remedial actions as it deems appropriate under the circumstances. These actions include the power:
| • | to enjoin “unsafe or unsound” banking practices; |
| • | to require that affirmative action be taken to correct any conditions resulting from any violation or practice; |
| • | to issue an administrative order that can be judicially enforced; |
| • | to require the bank to increase its capital; |
| • | to restrict the bank’s growth; |
| • | to assess civil monetary penalties against the bank or its officers or directors; |
| • | to remove officers and directors of the bank; and |
| • | if the federal agency concludes that such conditions cannot be corrected or there is an imminent risk of loss to depositors, to terminate a bank’s deposit insurance, which in the case of a California state chartered bank would result in revocation of its charter and require it to cease its banking operations. |
Additionally, under California law the DBO has many of these same remedial powers with respect to FFB.
Permissible Activities and Subsidiaries. California law permits state chartered commercial banks to engage in any activity permissible for national banks. Those permissible activities include conducting many so-called “closely related to banking” or “nonbanking” activities either directly or through their operating subsidiaries.
Federal Home Loan Bank System. FFB is a member of the FHLB. Among other benefits, each regional Federal Home Loan Bank serves as a reserve or central bank for its members within its assigned region and makes available loans or advances to its member banks. Each regional Federal Home Loan Bank is financed
108
Table of Contents
primarily from the sale of consolidated obligations of the overall Federal Home Loan Bank system. As an FHLB member, FFB is required to own a certain amount of capital stock in the FHLB. At December 31, 2012, FFB was in compliance with the FHLB’s stock ownership requirement. Historically, the FHLB has paid dividends on its capital stock to its members.
Federal Reserve Board Deposit Reserve Requirements. The FRB requires all federally-insured depository institutions to maintain reserves at specified levels against their transaction accounts. At December 31, 2012, FFB was in compliance with these requirements.
Dividends and Other Transfers of Funds. Cash dividends from FFB are one of the principal sources of cash (in addition to any cash dividends that might be paid to us by FFA) that is available to the Company for its operations and to fund any cash dividends that our board of directors might declare in the future. We are a legal entity separate and distinct from FFB and FFB is subject to various statutory and regulatory restrictions on its ability to pay cash dividends to us. Those restrictions would prohibit FFB, subject to certain limited exceptions, from paying cash dividends in amounts that would cause FFB to become undercapitalized. Additionally, the FDIC and the DBO have the authority to prohibit FFB from paying cash dividends, if either of those agencies deems the payment of dividends by FFB to be an unsafe or unsound practice.
The FDIC also has established guidelines with respect to the maintenance of appropriate levels of capital by banks under its jurisdiction. Compliance with the standards set forth in those guidelines and the restrictions that are or may be imposed under the prompt corrective action provisions of federal law could limit the amount of dividends which FFB may pay. Also, until September 2014, we are required to obtain the prior approval of the FDIC before FFB may pay any dividends.
Single Borrower Loan Limitations. With certain limited exceptions, the maximum amount of obligations, secured or unsecured, that any borrower (including certain related entities) may owe to a California state bank at any one time may not exceed 25% of the sum of the shareholders’ equity, allowance for loan losses, capital notes and debentures of the bank. Unsecured obligations may not exceed 15% of the sum of the shareholders’ equity, allowance for loan losses, capital notes and debentures of the bank.
Restrictions on Transactions between FFB and the Company and its other Affiliates. FFB is subject to Federal Reserve Act Sections 23A and 23B and FRB Regulation W, which impose restrictions on any extensions of credit to, or the issuance of a guarantee or letter of credit on behalf of, the Company or any of its other subsidiaries; the purchase of, or investments in, Company stock or other Company securities, the taking of such securities as collateral for loans; and the purchase of assets from the Company or any of its other subsidiaries. These restrictions prevent the Company and any of its subsidiaries from borrowing from FFB unless the borrowings are secured by marketable obligations in designated amounts, and such secured loans and investments by FFB in the Company or any of its subsidiaries are limited, individually, to 10% of FFB’s capital and surplus (as defined by federal regulations) and, in the aggregate, for all loans made to and investments made in the Company and its other subsidiaries, to 20% of FFB’s capital and surplus. California law also imposes restrictions with respect to transactions involving the Company and any other persons that may be deemed under that law to control FFB.
Safety and Soundness Standards. Banking institutions may be subject to potential enforcement actions by the federal regulators for unsafe or unsound practices or for violating any law, rule, regulation, or any condition imposed in writing by its primary federal banking regulatory agency or any written agreement with that agency. The federal banking agencies have adopted guidelines designed to identify and address potential safety and soundness concerns that could, if not corrected, lead to deterioration in the quality of a bank’s assets, liquidity or capital. Those guidelines set forth operational and managerial standards relating to such matters as:
| • | internal controls, information systems and internal audit systems; |
| • | risk management; |
109
Table of Contents
| • | loan documentation; |
| • | credit underwriting; |
| • | asset growth; |
| • | earnings; and |
| • | compensation, fees and benefits. |
In addition, federal banking agencies have adopted safety and soundness guidelines with respect to asset quality. These guidelines provide six standards for establishing and maintaining a system to identify problem assets and prevent those assets from deteriorating. Under these standards, an FDIC-insured depository institution is expected to:
| • | conduct periodic asset quality reviews to identify problem assets, estimate the inherent losses in problem assets and establish reserves that are sufficient to absorb those estimated losses; |
| • | compare problem asset totals to capital; |
| • | take appropriate corrective action to resolve problem assets; |
| • | consider the size and potential risks of material asset concentrations; and |
| • | provide periodic asset quality reports with adequate information for the bank’s management and the board of directors to assess the level of asset risk. |
These guidelines also establish standards for evaluating and monitoring earnings and for ensuring that earnings are sufficient for the maintenance of adequate capital and reserves.
Capital Standards and Prompt Corrective Action. The Federal Deposit Insurance Act (“FDIA”) provides a framework for regulation of federally insured depository institutions, including banks, and their parent holding companies and other affiliates, by their federal banking regulators. Among other things, the FDIA requires the relevant federal banking regulator to take “prompt corrective action” with respect to a depository institution if that institution does not meet certain capital adequacy standards, including requiring the prompt submission of an acceptable capital restoration plan if the depository institution’s bank regulator has concluded that it needs additional capital.
Supervisory actions by a bank’s federal regulator under the prompt corrective action rules generally depend upon an institution’s classification within one of five capital categories, which is determined on the basis of a bank’s Tier 1 leverage ratio, Tier 1 capital ratio and total capital ratio. Tier 1 capital consists principally of common stock and nonredeemable preferred stock and retained earnings.
Under current regulations a depository institution’s capital category under the prompt corrective action regulations will depend upon how its capital levels compare with various relevant capital measures and the other factors established by the relevant federal banking regulations. Those regulations, which will change effective January 1, 2015 due to the adoption of new Basel III capital rules (discussed below), provide that a bank will be:
| • | “well capitalized” if it has a Tier 1 leverage ratio of 5.0% or greater, a Tier 1 risk-based capital ratio of 6.0% or greater and a total risk-based capital ratio of 10.0% or greater, and is not subject to any order or written directive by any such regulatory agency to meet and maintain a specific capital level for any capital measure; |
| • | “adequately capitalized” if it has a total risk-based capital ratio of 8.0% or greater, a Tier 1 risk-based capital ratio of 4.0% or greater, and a leverage ratio of 4.0% or greater and is not “well capitalized”; |
| • | “undercapitalized” if it has a total risk-based capital ratio that is less than 8.0%, a Tier 1 risk-based capital ratio of less than 4.0% or a leverage ratio of less than 4.0%; |
110
Table of Contents
| • | “significantly undercapitalized” if it has a total risk-based capital ratio of less than 6.0%, a Tier 1 risk-based capital ratio of less than 3.0% or a leverage ratio of less than 3.0%; and |
| • | “critically undercapitalized” if its tangible equity is equal to or less than 2.0% of average quarterly tangible assets. |
If a bank that is classified as a well-capitalized institution is determined (after notice and opportunity for hearing), by its federal regulatory agency to be in an unsafe or unsound condition or to be engaging in an unsafe or unsound practice, that agency may, under certain circumstances, reclassify the bank as adequately capitalized. If a bank has been classified as adequately capitalized or undercapitalized, its federal regulatory agency may nevertheless require it to comply with bank supervisory provisions and restrictions that would apply to a bank in the next lower capital classification, if that regulatory agency has obtained supervisory information regarding the bank (other than with respect to its capital levels) that raises safety or soundness concerns. However, a significantly undercapitalized bank may not be treated by its regulatory agency as critically undercapitalized.
The FDIA generally prohibits a bank from making any capital distributions (including payments of dividends) or paying any management fee to its parent holding company if the bank would thereafter be “undercapitalized.” “Undercapitalized” banks are subject to growth limitations and are required to submit a capital restoration plan. The federal regulatory agency for such a bank may not accept the bank’s capital restoration plan unless the agency determines, among other things, that the plan is based on realistic assumptions and is likely to succeed in restoring the bank’s capital. In addition, for a capital restoration plan to be acceptable, the bank’s parent holding company must guarantee that the bank will comply with its capital restoration plan. The bank holding company also is required to provide appropriate assurances of performance. Under such a guarantee and assurance of performance, if the bank fails to comply with its capital restoration plan, the parent holding company may become subject to liability for such failure in an amount up to the lesser of (i) 5.0% of its bank subsidiary’s total assets at the time it became undercapitalized, and (ii) the amount which is necessary (or would have been necessary) to bring the bank into compliance with all applicable capital standards as of the time it failed to comply with the plan.
If an undercapitalized bank fails to submit an acceptable capital restoration plan, it will be treated as if it is “significantly undercapitalized.” In that event, the bank’s federal regulatory agency may impose a number of additional requirements and restrictions on the bank, including orders or requirements (i) to sell sufficient voting stock to become “adequately capitalized,” (ii) to reduce its total assets, and (iii) cease the receipt of deposits from correspondent banks. “Critically undercapitalized” institutions are subject to the appointment of a receiver or conservator.
New Basel III Capital Rules. The current risk-based capital rules applicable to domestic banks and bank holding companies are based on the 1988 capital accord of the International Basel Committee on Banking Supervision (the “Basel Committee”), which is comprised of central banks and bank supervisors and regulators from the major industrialized countries. The Basel Committee develops broad policy guidelines for use by each country’s banking regulators in determining the banking supervisory policies and rules they apply. In December 2010, the Basel Committee issued a new set of international guidelines for determining regulatory capital, known as “Basel III”. In June 2012, the FRB issued, for public comment, three notices of proposed rulemaking which, if adopted, would have made significant changes to the regulatory risk-based capital and leverage requirements for banks and bank holding companies (“banking organizations”) in the United States consistent with the Basel III guidelines.
In July 2013, the FRB adopted final rules (the “New Capital Rules”) establishing a new comprehensive capital framework for U.S. banking organizations, and the FDIC has adopted substantially identical rules. The rules implement the Basel Committee’s December 2010 framework for strengthening international capital standards as well as certain provisions of the Dodd-Frank Act. The New Capital Rules substantially revise the risk-based capital requirements applicable to U.S. banking organizations, including the Company and FFB, from
111
Table of Contents
the current U.S. risk-based capital rules, define the components of capital and address other issues affecting the capital ratios applicable to banking organizations. The New Capital Rules also replace the existing approach used in risk-weighting of a banking organization’s assets with a more risk-sensitive approach. The New Capital Rules will become effective for the Company and FFB on January 1, 2015 (subject in the case of certain of those Rules to phase-in periods).
Among other things, the New Capital Rules (i) introduce a new capital measure called “Common Equity Tier 1” (“CET-1”), (ii) specify that Tier 1 capital consists of CET-1 and “Additional Tier 1 capital” instruments meeting specified requirements, (iii) apply most deductions and adjustments to regulatory capital measures to CET-1 and not to the other components of capital, thus potentially requiring banking organizations to achieve and maintain higher levels of CET-1 in order to meet minimum capital ratios, and (iv) expand the scope of the deductions and adjustments from capital as compared to existing capital rules.
Under the New Capital Rules, as of January 1, 2015 the minimum capital ratios will be:
| CET-1 to risk-weighted assets |
4.5 | % | ||
| Tier 1 capital (i.e., CET-1 plus Additional Tier 1) to risk-weighted assets |
6.0 | % | ||
| Total capital (i.e., Tier 1 plus Tier 2) to risk-weighted assets |
8.0 | % | ||
| Tier 1 capital-to-average consolidated assets as reported on consolidated financial statements(1) |
4.0 | % |
| (1) | Commonly referred to as a banking institution’s “leverage ratio”. |
When fully phased in on January 1, 2019, the New Capital Rules also will require the Company and FFB, as well as most other bank holding companies and banks, to maintain a 2.5% “capital conservation buffer,” composed entirely of CET-1, on top of the minimum risk-weighted asset ratios set forth in the above table. This capital conservation buffer will have the effect of increasing (i) the CET-1-to-risk-weighted asset ratio to 7.0%, (ii) the Tier 1 capital-to-risk-weighted asset ratio to 8.5%, and (iii) the Total capital-to-risk weighted asset ratio to 10.5%.
The capital conservation buffer is designed to absorb losses during periods of economic stress. Banking organizations with a ratio of CET-1 to risk-weighted assets above the minimum, but below the capital conservation buffer, will face constraints on dividends, equity repurchases and executive compensation based on the amount of the shortfall. The implementation of the capital conservation buffer will begin on January 1, 2016 at 0.625%, and will increase by 0.625% on each subsequent January 1, until it reaches 2.5% on January 1, 2019.
The New Capital Rules provide for a number of deductions from and adjustments to CET-1. These include, for example, the requirement that mortgage servicing rights, deferred tax assets dependent upon future taxable income, and significant investments in common equity issued by nonconsolidated financial entities be deducted from CET-1 to the extent that any one such category exceeds 10% of CET-1 or all such categories, in the aggregate, exceed 15% of CET-1. The deductions and other adjustments to CET-1 will be phased in incrementally between January 1, 2015 and January 1, 2018. Additionally, the impact may be mitigated prior to or during the phase-in period by the determination of other than temporary impairments (“OTTI”) and additional accumulation of retained earnings. Under current capital standards, the effects of certain items of Accumulated Other Comprehensive Income (“AOCI”) included in capital are excluded for purposes of determining regulatory capital ratios. By contrast, under the New Capital Rules, the effects of certain items of AOCI will not be excluded. However, most banking organizations, including the Company and FFB, may make a one-time permanent election, not later than January 1, 2014, to continue to exclude these items from capital. We have not yet determined whether to make this election.
The New Capital Rules require that trust preferred securities be phased out from Tier 1 capital by January 1, 2016, except in the case of banking organizations with total consolidated assets of less than $15 billion, which will be permitted to include trust preferred securities issued prior to May 19, 2010 in Tier 2 capital, without any limitations.
112
Table of Contents
In the case of FFB, the New Capital Rules also revise the “prompt corrective action” regulations under the Federal Deposit Insurance Act, by (i) introducing a CET-1 ratio requirement at each capital quality level (other than critically undercapitalized), with a minimum ratio of 6.5% for a bank to qualify for well-capitalized status; (ii) increasing the minimum Tier 1 capital ratio for each category, with the minimum Tier 1 capital ratio for well-capitalized status being 8% (as compared to the current 6%); and (iii) requiring a leverage ratio of 4% to be adequately capitalized (as compared to the current 3% leverage ratio for a bank with a composite supervisory rating of 1) and a leverage ratio of 5% to be well-capitalized. The New Capital Rules do not, however, change the total risk-based capital requirement for any “prompt corrective action” category.
The New Capital Rules prescribe a standardized approach for calculating risk-weighted assets that expand the risk-weighting categories from the current four Basel I-derived categories (0%, 20%, 50% and 100%) to a larger and more risk-sensitive number of categories, depending on the nature of the assets, generally ranging from 0% for U.S. Government and agency securities, to 600% for certain equity exposures, and resulting in higher risk weights for a variety of asset categories. In addition, the New Capital Rules also provide more advantageous risk weights for derivatives and repurchase-style transactions cleared through a qualifying central counterparty and increase the scope of eligible guarantors and eligible collateral for purposes of credit risk mitigation.
FDIC Deposit Insurance. In addition to supervising and regulating state chartered non-member banks, the FDIC insures deposits, up to prescribed statutory limits, of all federally insured banks and savings institutions in order to safeguard the safety and soundness of the banking and savings industries. The FDIC insures client deposits through the Deposit Insurance Fund (the “DIF”) up to prescribed limits for each depositor. The Dodd-Frank Act increased the maximum deposit insurance amount from $100,000 to $250,000. The DIF is funded primarily by FDIC assessments paid by each DIF member institution. The amount of each DIF member’s assessment is based on its relative risk of default as measured by regulatory capital ratios and other supervisory factors. Pursuant to the Federal Deposit Insurance Reform Act of 2005, the FDIC is authorized to set the reserve ratio for the DIF annually at between 1.15% and 1.50% of estimated insured deposits. The FDIC may increase or decrease the assessment rate schedule on a semi-annual basis. The Dodd-Frank Act increased the minimum reserve ratio from 1.15% of estimated deposits to 1.35% of estimated deposits (or a comparable percentage of the asset-based assessment base described above). The Dodd-Frank Act requires the FDIC to offset the effect of the increase in the minimum reserve ratio when setting assessments for insured depository institutions with less than $10 billion in total consolidated assets, such as FFB. The FDIC has until September 30, 2020 to achieve the new minimum reserve ratio of 1.35%.
Additionally, all FDIC-insured institutions are required to pay assessments to the FDIC to fund interest payments on bonds issued by the Financing Corporation (“FICO”), an agency of the Federal government established to recapitalize the predecessor to the DIF. The FICO assessment rates, which are determined quarterly, averaged 0.066% of insured deposits in fiscal 2012. These assessments will continue until the FICO bonds mature in 2017.
The FDIC may terminate a depository institution’s deposit insurance upon a finding that the institution’s financial condition is unsafe or unsound or that the institution has engaged in unsafe or unsound practices that pose a risk to the DIF or that may prejudice the interest of the bank’s depositors. Pursuant to California law, the termination of a California state chartered bank’s FDIC deposit insurance would result in the revocation of the bank’s charter, forcing it to cease conducting banking operations.
Community Reinvestment Act and Fair Lending Developments. Like all other federally regulated banks, FFB is subject to fair lending requirements and the evaluation of its small business operations under the CRA. The CRA generally requires the federal banking agencies to evaluate the record of a bank in meeting the credit needs of its local communities, including those of low and moderate income neighborhoods in its service area. A bank’s compliance with its CRA obligations is based on a performance-based evaluation system which determines the bank’s CRA ratings on the basis of its community lending and community development
113
Table of Contents
performance. A bank may have substantial penalties imposed on it and generally will be required to take corrective measures in the event it violates its obligations under the CRA. Federal banking agencies also may take compliance with the CRA and other fair lending laws into account when regulating and supervising other activities of a bank or its bank holding company. Moreover, when a bank holding company files an application for approval to acquire a bank or another bank holding company, the FRB will review the CRA assessment of each of the subsidiary banks of the applicant bank holding company, and a low CRA rating may be the basis for denying the application.
USA Patriot Act of 2001 and Bank Secrecy Act. In October 2001, the Uniting and Strengthening America by Providing Appropriate Tools Required to Intercept and Obstruct Terrorism of 2001 (USA Patriot Act) was enacted into law in response to the September 11, 2001 terrorist attacks. The USA Patriot Act was adopted to strengthen the ability of U.S. law enforcement and intelligence agencies to work cohesively to combat terrorism on a variety of fronts. Of particular relevance to banks and other federally insured depository institutions are the USA Patriot Act’s sweeping anti-money laundering and financial transparency provisions and various related implementing regulations that:
| • | establish due diligence requirements for financial institutions that administer, maintain, or manage private bank accounts and foreign correspondent accounts; |
| • | prohibit U.S. institutions from providing correspondent accounts to foreign shell banks; |
| • | establish standards for verifying client identification at account opening; and |
| • | set rules to promote cooperation among financial institutions, regulatory agencies and law enforcement entities in identifying parties that may be involved in terrorism or money laundering. |
Under implementing regulations issued by the U.S. Treasury Department, banking institutions are required to incorporate a client identification program into their written money laundering plans that includes procedures for:
| • | verifying the identity of any person seeking to open an account, to the extent reasonable and practicable; |
| • | maintaining records of the information used to verify the person’s identity; and |
| • | determining whether the person appears on any list of known or suspected terrorists or terrorist organizations. |
The Company and FFB also are subject to the federal Bank Secrecy Act of 1970, as amended, or the Bank Secrecy Act, which establishes requirements for recordkeeping and reporting by banks and other financial institutions designed to help identify the source, volume and movement of currency and monetary instruments into and out of the United States to help detect and prevent money laundering and other illegal activities. The Bank Secrecy Act requires financial institutions to develop and maintain a program reasonably designed to ensure and monitor compliance with its requirements, to train employees to comply with and to test the effectiveness of the program. Any failure to meet the requirements of the Bank Secrecy Act can involve substantial penalties and result in adverse regulatory action. FFI and FFB have each adopted policies and procedures to comply with the Bank Secrecy Act.
Consumer Laws and Regulations. The Company and FFB are subject to a broad range of federal and state consumer protection laws and regulations prohibiting unfair or fraudulent business practices, untrue or misleading advertising and unfair competition. Those laws and regulations include:
| • | The Home Ownership and Equity Protection Act of 1994, or HOEPA, which requires additional disclosures and consumer protections to borrowers designed to protect them against certain lending practices, such as practices deemed to constitute “predatory lending.” |
| • | The Fair Credit Reporting Act, as amended by the Fair and Accurate Credit Transactions Act, or the FACT Act, which requires banking institutions and financial services businesses to adopt practices |
114
Table of Contents
| and procedures designed to help deter identity theft, including developing appropriate fraud response programs, and provides consumers with greater control of their credit data. |
| • | The Truth in Lending Act, or TILA, which requires that credit terms be disclosed in a meaningful and consistent way so that consumers may compare credit terms more readily and knowledgeably. |
| • | The Equal Credit Opportunity Act, or ECOA, which generally prohibits, in connection with any consumer or business credit transactions, discrimination on the basis of race, color, religion, national origin, sex, marital status, age (except in limited circumstances), or the fact that a borrower is receiving income from public assistance programs. |
| • | The Fair Housing Act, which regulates many lending practices, including making it unlawful for any lender to discriminate in its housing-related lending activities against any person because of race, color, religion, national origin, sex, handicap or familial status. |
| • | The Home Mortgage Disclosure Act, or HMDA, which includes a “fair lending” aspect that requires the collection and disclosure of data about applicant and borrower characteristics as a way of identifying possible discriminatory lending patterns and enforcing anti-discrimination statutes. |
| • | The Real Estate Settlement Procedures Act, or RESPA, which requires lenders to provide borrowers with disclosures regarding the nature and cost of real estate settlements and prohibits certain abusive practices, such as kickbacks. |
| • | The National Flood Insurance Act, or NFIA, which requires homes in flood-prone areas with mortgages from a federally regulated lender to have flood insurance. |
| • | The Secure and Fair Enforcement for Mortgage Licensing Act of 2008, or SAFE Act, which requires mortgage loan originator employees of federally insured institutions to register with the Nationwide Mortgage Licensing System and Registry, a database created by the states to support the licensing of mortgage loan originators, prior to originating residential mortgage loans. |
Regulation W. The FRB has adopted Regulation W to comprehensively implement Sections 23A and 23B of the Federal Reserve Act. Sections 23A and 23B and Regulation W limit transactions between a bank and its affiliates and limit a bank’s ability to transfer to its affiliates the benefits arising from the bank’s access to insured deposits, the payment system and the discount window and other benefits of the Federal Reserve System. The statute and regulation impose quantitative and qualitative limits on the ability of a bank to extend credit to, or engage in certain other transactions with, an affiliate (and a non-affiliate if an affiliate benefits from the transaction). However, certain transactions that generally do not expose a bank to undue risk or abuse the safety net are exempted from coverage under Regulation W.
Historically, a subsidiary of a bank was not considered an affiliate for purposes of Sections 23A and 23B, since their activities were limited to activities permissible for the bank itself. However, the Gramm-Leach-Bliley Act authorized “financial subsidiaries” that may engage in activities not permissible for a bank. These financial subsidiaries are now considered affiliates that are subject to Sections 23A and 23B. Certain transactions between a financial subsidiary and another affiliate of a bank are also covered by Sections 23A and 23B and under Regulation W.
First Foundation Advisors
Registered Investment Adviser Regulation. FFA is a registered investment adviser under the Investment Advisers Act of 1940, and the SEC’s regulations promulgated thereunder. The Investment Advisers Act imposes numerous obligations on registered investment advisers, including fiduciary, recordkeeping, operational, and disclosure obligations. FFA is also subject to regulation under the securities laws and fiduciary laws of certain states and to ERISA, and to regulations promulgated thereunder, insofar as it is a “fiduciary” under ERISA with respect to certain of its clients. ERISA and the applicable provisions of the Code, impose certain duties on
115
Table of Contents
persons who are fiduciaries under ERISA, and prohibit certain transactions by the fiduciaries (and certain other related parties) to such plans. The foregoing laws and regulations generally grant supervisory agencies broad administrative powers, including the power to limit or restrict FFA from conducting its business in the event that it fails to comply with such laws and regulations. Possible sanctions that may be imposed in the event of such noncompliance include the suspension of individual employees, limitations on the business activities for specified periods of time, revocation of registration as an investment adviser and/or other registrations, and other censures and fines. Changes in these laws or regulations could have a material adverse impact on the profitability and mode of operations of FFI and its subsidiaries.
Future Legislation
Congress may enact legislation from time to time that affects the regulation of the financial services industry, and state legislatures may enact legislation from time to time affecting the regulation of financial institutions chartered by or operating in those states. Federal and state regulatory agencies also periodically propose and adopt changes to their regulations or change the manner in which existing regulations are applied. The substance or impact of pending or future legislation or regulation, or the application thereof, cannot be predicted, although enactment of the proposed legislation could impact the regulatory structure under which we operate and may significantly increase our costs, impede the efficiency of our internal business processes, require us to increase our regulatory capital and modify our business strategy, and limit our ability to pursue business opportunities in an efficient manner.
116
Table of Contents
CERTAIN MATERIAL U.S. FEDERAL INCOME TAX CONSEQUENCES
FOR NON-U.S. HOLDERS OF COMMON STOCK
The following is a summary of certain material United States federal income tax consequences relevant to non-U.S. holders, as defined below, of the purchase, ownership and disposition of our common stock. The following summary is based on current provisions of the Internal Revenue Code of 1986, as amended, or the Code, Treasury regulations and judicial and administrative authority, all of which are subject to change, possibly with retroactive effect. This section does not consider state, local, estate or foreign tax consequences, nor does it address tax consequences to special classes of investors including, but not limited to, tax-exempt organizations, insurance companies, banks or other financial institutions, partnerships or other entities classified as partnerships for United States federal income tax purposes, dealers in securities, persons liable for the alternative minimum tax, traders in securities that elect to use a mark-to-market method of accounting for their securities holdings, persons who have acquired our common stock as compensation or otherwise in connection with the performance of services, or persons that will hold our common stock as a position in a hedging transaction, “straddle,” “conversion transaction” or other risk reduction transaction. Tax consequences may vary depending upon the particular status of an investor. The summary is limited to non-U.S. holders who will hold our common stock as “capital assets” (generally, property held for investment). Investors should consult their tax advisors concerning the U.S. federal income tax consequences in light of their own specific situation, as well as consequences arising under other federal tax laws (such as the federal estate, gift or Medicare tax laws) and the laws of any other taxing jurisdiction.
As used herein, a “U.S. holder” is:
| • | an individual citizen or resident of the United States; |
| • | a corporation (or any other entity treated as a corporation) created or organized in or under the laws of the United States, any state thereof or the District of Columbia; |
| • | an estate the income of which is subject to U.S. federal income taxation regardless of its source; or |
| • | a trust, if it (i) is subject to the primary supervision of a court within the United States and one or more U.S. persons have the authority to control all substantial decisions of the trust, or (ii) has a valid election in effect under applicable U.S. Treasury regulations to be treated as a U.S. person. |
A “non-U.S. holder” is an individual, corporation, estate or trust that is not a U.S. holder. Special rules may apply to certain non-U.S. holders such as controlled foreign corporations, passive foreign investment companies, expatriated entities subject to Section 7874 of the Code, and, in certain circumstances, individuals who are U.S. expatriates. Consequently, non-U.S. holders should consult their tax advisors to determine the U.S. federal, state, local, non-U.S. and other tax consequences that may be relevant to them in light of their particular circumstances.
If an entity or arrangement treated as a partnership for United States federal income tax purposes holds our common stock, the tax treatment of a partner in the partnership will generally depend upon the status of the partner and the activities of the partnership. If you are treated as a partner in such an entity holding our common stock, you should consult your tax advisor as to the United States federal income tax consequences applicable to you.
Distributions
Distributions with respect to our common stock will be treated as dividends when paid to the extent of our current or accumulated earnings and profits as determined for United States federal income tax purposes. Except as described below, if you are a non-U.S. holder of our shares, dividends paid to you are subject to withholding of United States federal income tax at a 30% rate or at a lower rate if you are eligible for the benefits of an income tax treaty that provides for a lower rate. Even if you are eligible for a lower treaty rate, we and other
117
Table of Contents
payors will generally be required to withhold at a 30% rate (rather than the lower treaty rate) on dividends paid to you, unless you have furnished to us or another payor:
| • | A valid Internal Revenue Service Form W-8BEN or an acceptable substitute form upon which you certify, under penalties of perjury, your status as a non-United States person and your entitlement to the lower treaty rate with respect to such payments, or |
| • | In the case of payments made outside the United States to an offshore account (generally, an account maintained by you at an office or branch of a bank or other financial institution at any location outside the United States), other documentary evidence establishing your entitlement to the lower treaty rate in accordance with United States Treasury regulations. |
If you are eligible for a reduced rate of U.S. withholding tax under a tax treaty, you may obtain a refund of any amounts withheld in excess of that rate by timely filing a refund claim with the Internal Revenue Service.
If dividends paid to you are “effectively connected” with your conduct of a trade or business within the United States, or, if required by a tax treaty, the dividends are attributable to a permanent establishment that you maintain in the United States, we and other payors generally are not required to withhold tax from the dividends, provided that you have furnished to us or another payor a valid Internal Revenue Service Form W-8ECI or an acceptable substitute form upon which you represent, under penalties of perjury, that:
| • | You are a non-United States person, and |
| • | The dividends are effectively connected with your conduct of a trade or business within the United States and are includible in your gross income. |
“Effectively connected” dividends are taxed at rates applicable to United States citizens, resident aliens and domestic United States corporations. If you are a corporate non-U.S. holder, “effectively connected” dividends that you receive may, under certain circumstances, be subject to an additional “branch profits tax” at a 30% rate or at a lower rate if you are eligible for the benefits of an income tax treaty that provides for a lower rate.
Sale or Redemption
If you are a non-U.S. holder, you generally will not be subject to United States federal income or withholding tax on gain realized on the sale, exchange or other disposition of our common stock unless the gain is “effectively connected” with your conduct of a trade or business in the United States or the gain is attributable to a permanent establishment that you maintain in the United States, if that is required by an applicable income tax treaty as a condition to subjecting you to United States taxation on a net income basis. In certain circumstances, redemption of our stock will be characterized as a dividend for United States income tax purposes and will be taxed under the rules described in the preceding section.
Information Reporting and Backup Withholding
Payment of dividends, and the tax withheld on those payments, are subject to information reporting requirements. These information reporting requirements apply regardless of whether withholding was reduced or eliminated by an applicable income tax treaty. Under the provisions of an applicable income tax treaty or agreement, copies of the information returns reporting such dividends and withholding may also be made available to the tax authorities in the country in which the non-U.S. holder resides. U.S. backup withholding will generally apply on payment of dividends to non-U.S. holders unless such non-U.S. holders furnish to the payor a Form W-8BEN (or other applicable form), or otherwise establish an exemption and the payor does not have actual knowledge or reason to know that the holder is a U.S. person, as defined under the Code, that is not an exempt recipient.
118
Table of Contents
Payment of the proceeds of a sale of our common stock within the United States or conducted through certain U.S.-related financial intermediaries is subject to information reporting and, depending on the circumstances, backup withholding, unless the non-U.S. holder, or beneficial owner thereof, as applicable, certifies that it is a non-U.S. holder on Form W-8BEN (or other applicable form), or otherwise establishes an exemption and the payor does not have actual knowledge or reason to know the holder is a U.S. person, as defined under the Code, that is not an exempt recipient.
Any amount withheld under the backup withholding rules from a payment to a non-U.S. holder is allowable as a credit against the non-U.S. holder’s United States federal income tax, which may entitle the non-U.S. holder to a refund, provided that the non-U.S. holder timely provides the required information to the Internal Revenue Service. Moreover, certain penalties may be imposed by the Internal Revenue Service on a non-U.S. holder who is required to furnish information but does not do so in the proper manner. Non-U.S. holders should consult with their tax advisors regarding the application of backup withholding in their particular circumstances and the availability of and procedure for obtaining an exemption from backup withholding under current Treasury regulations.
Recent Legislation Relating to Foreign Accounts
Recently enacted legislation (commonly referred to as “FATCA”) generally imposes a withholding tax of 30% on dividends paid on, and the gross proceeds of a disposition of, stock in a United States corporation paid to (i) a foreign financial institution, or FFI, whether as a beneficial owner or intermediary, unless such institution enters into an agreement with the U.S. government to collect and provide to the U.S. tax authorities substantial information regarding U.S. account holders of such institution (which would include certain equity and debt holders of such institution, as well as certain account holders that are foreign entities with U.S. owners), or qualifies for an exemption from these rules, and (ii) a foreign entity that is not a financial institution (whether as a beneficial owner or intermediary for another foreign entity that is not a financial institution) unless such entity provides the withholding agent with a certification identifying the substantial U.S. owners of the entity, which generally includes any U.S. person who directly or indirectly owns more than 10% of the entity, or qualifies for an exemption from these rules. A person that receives payments through one or more FFIs may receive reduced payments as a result of FATCA withholding taxes if (i) any such FFI does not enter into such an agreement with the U.S. government and does not otherwise establish an exemption, or (ii) such person is (a) a “recalcitrant account holder” or (b) itself an FFI that fails to enter into such an agreement or establish an exemption. Foreign governments may enter into an agreement with the IRS to implement FATCA in a different manner.
The final U.S. Treasury regulations and recent administrative guidance provide that the FATCA withholding rules will apply to payments of dividends made on or after July 1, 2014 and to payments of gross proceeds from a sale or other disposition of stock on or after January 1, 2017.
Non-U.S. Holders are encouraged to consult with their tax advisors regarding the possible implications of the legislation on their investment in our common stock.
119
Table of Contents
We and the underwriters named below have entered into an underwriting agreement with respect to the shares of common stock being offered. Subject to the terms and conditions contained in the underwriting agreement, each underwriter has agreed to purchase from us the respective number of shares of common stock set forth opposite its name below. The underwriters’ obligations are several, which means that each underwriter is required to purchase a specific number of shares, but it is not responsible for the commitment of any other underwriter to purchase shares. Sandler O’Neill & Partners, L.P. is acting as the representative of the underwriters.
| Name |
Number of Shares | |
| Sandler O’Neill & Partners, L.P. |
||
| Keefe, Bruyette & Woods, Inc. |
||
| Sterne, Agee & Leach, Inc. |
||
|
| ||
| Total |
||
|
|
The underwriters are committed to purchase and pay for all such shares of common stock if any are purchased.
We have granted to the underwriters an option, exercisable no later than 30 days after the date of this prospectus, to purchase up to 333,333 additional shares of common stock at the public offering price less the underwriting discount set forth on the cover page of this prospectus. The underwriters may exercise this option only to cover over-allotments, if any, made in connection with this offering. To the extent the option is exercised and the conditions of the underwriting agreement are satisfied, we will be obligated to sell to the underwriters, and the underwriters will be obligated to purchase, these additional shares of common stock in proportion to their respective initial purchase amounts.
The underwriters propose to offer the shares of common stock directly to the public at the offering price set forth on the cover page of this prospectus and to certain securities dealers at the public offering price less a concession not in excess of $[ ] per share. The underwriters may allow, and these dealers may re-allow, a concession not in excess of $[ ] per share on sales to other dealers. After the public offering of the common stock, the underwriters may change the offering price and other selling terms.
The following table shows the per share and total underwriting discount that we will pay to the underwriters and the proceeds we will receive before expenses. These amounts are shown assuming both no exercise and full exercise of the underwriters’ over-allotment option to purchase additional shares.
| Per Share | Total Without Over-Allotment |
Total With Over-Allotment | ||||
| Price to public |
||||||
| Underwriting discount |
||||||
| Proceeds to us, before expenses |
We estimate that the total expenses of the offering, excluding the underwriting discount, will be approximately $0.7 million and are payable by us. We have agreed to reimburse the underwriters for their actual out-of-pocket expenses incurred in connection with the offering, excluding certain fees and disbursements of underwriters’ counsel if the offering is consummated. The out-of-pocket expenses to be reimbursed by us to the underwriters on completion of the offering, will not exceed $150,000.
The shares of common stock are being offered by the several underwriters, subject to prior sale, when, as and if issued to and accepted by them, subject to approval of certain legal matters by counsel for the underwriters
120
Table of Contents
and other conditions specified in the underwriting agreement. The underwriters reserve the right to withdraw, cancel or modify this offer and to reject orders in whole or in part.
The underwriting agreement provides that the obligations of the underwriters are conditional and may be terminated at their discretion based on their assessment of the state of the financial markets. The obligations of the underwriters may also be terminated upon the occurrence of the events specified in the underwriting agreement. The underwriting agreement provides that the underwriters are obligated to purchase all the shares of common stock in this offering if any are purchased, other than those shares covered by the over-allotment option described above.
Lock-up Agreement. We, and each of our executive officers and directors, have agreed, subject to certain exceptions for a period of 180 days after the date of this prospectus, not to sell, offer, agree to sell, contract to sell, hypothecate, pledge, grant any option to sell, make any short sale, or otherwise dispose of or hedge, directly or indirectly, any shares of our common stock or securities convertible into, exchangeable or exercisable for any shares of our common stock or warrants or other rights to purchase shares of our common stock or other similar securities without, in each case, the prior written consent of Sandler O’Neill & Partners, L.P. These restrictions are expressly agreed to preclude us, and our executive officers and directors, from engaging in any hedging or other transaction or arrangement that is designed to, or which reasonably could be expected to, lead to or result in a sale, disposition or transfer, in whole or in part, of any of the economic consequences of ownership of our common stock, whether such transaction would be settled by delivery of common stock or other securities, in cash or otherwise.
Indemnity. We have agreed to indemnify the underwriters, and persons who control the underwriters, against certain liabilities, including liabilities under the Securities Act, and to contribute to payments that the underwriters may be required to make in respect of these liabilities.
Stabilization. In connection with this offering, the underwriters may engage in stabilizing transactions, over-allotment transactions, syndicate covering transactions and penalty bids.
| • | Stabilizing transactions permit bids to purchase shares of common stock so long as the stabilizing bids do not exceed a specified maximum, and are engaged in for the purpose of preventing or retarding a decline in the market price of the common stock while the offering is in progress. |
| • | Over-allotment transactions involve sales by the underwriters of shares of common stock in excess of the number of shares the underwriters are obligated to purchase. This creates a syndicate short position which may be either a covered short position or a naked short position. In a covered short position, the number of shares of common stock over-allotted by the underwriters is not greater than the number of shares that they may purchase in the over-allotment option. In a naked short position, the number of shares involved is greater than the number of shares in the over-allotment option. The underwriters may close out any short position by exercising their over-allotment option and/or purchasing shares in the open market. |
| • | Syndicate covering transactions involve purchases of common stock in the open market after the distribution has been completed in order to cover syndicate short positions. In determining the source of shares to close out the short position, the underwriters will consider, among other things, the price of shares available for purchase in the open market as compared with the price at which they may purchase shares through exercise of the over-allotment option. If the underwriters sell more shares than could be covered by exercise of the over-allotment option and, therefore, have a naked short position, the position can be closed out only by buying shares in the open market. A naked short position is more likely to be created if the underwriters are concerned that after pricing there could be downward pressure on the price of the shares in the open market that could adversely affect investors who purchase in the offering. |
| • | Penalty bids permit the representative to reclaim a selling concession from a syndicate member when the common stock originally sold by that syndicate member is purchased in stabilizing or syndicate covering transactions to cover syndicate short positions. |
121
Table of Contents
These stabilizing transactions, syndicate covering transactions and penalty bids may have the effect of raising or maintaining the market price of our common stock or preventing or retarding a decline in the market price of our common stock. As a result, the price of our common stock in the open market may be higher than it would otherwise be in the absence of these transactions. Neither we nor the underwriters make any representation or prediction as to the effect that the transactions described above may have on the price of our common stock. These transactions may be effected on the Nasdaq National Market, in the over-the-counter market or otherwise and, if commenced, may be discontinued at any time.
NASDAQ Global Market Listing. We expect the shares to be approved for listing on the NASDAQ Global Market, subject to notice of issuance, under the symbol “FFWM.”
Offering Price Determination. Before this offering, there has been no public market for our common stock. The initial public offering price will be determined through negotiations between us and the representative of the underwriters. In addition to prevailing market conditions, the factors to be considered in determining the initial public offering price are:
| • | the valuation multiples of publicly traded companies that the representative believes to be comparable to us; |
| • | our financial information; |
| • | the history of, and the prospects for, our company and the industry in which we compete; |
| • | an assessment of our management, its past and present operations, and the prospects for, and timing of, our future revenues; |
| • | our book value; and |
| • | the above factors in relation to market values and various valuation measures of other companies engaged in activities similar to ours. |
An active trading market for the shares may not develop. It is also possible that after the offering the shares will not trade in the public market at or above the initial public offering price.
From time to time, some of the underwriters and their respective affiliates have provided, and may continue to provide, investment banking services to us in the ordinary course of their respective businesses, and may receive compensation for such services. The underwriters and their respective affiliates may also make investment recommendations and/or publish or express independent research views in respect of those securities or instruments and may at any time hold, or recommend to clients that they acquire, long and/or short positions in those securities and instruments.
Electronic Distribution. A prospectus in electronic format may be made available by e-mail or on the websites or through online services maintained by one or more of the underwriters of their affiliates. In those cases, prospective investors may view offering terms online and may be allowed to place orders online. The underwriters may agree with us to allocate a specific number of shares for sale to online brokerage account holders. Any such allocation for online distributions will be made by the underwriters on the same basis as other allocations. Other than the prospectus in electronic format, the information on the underwriters’ websites and any information contained on any other website maintained by any of the underwriters is not part of this prospectus, has not been approved and/or endorsed by the underwriters or us and should not be relied upon by investors.
Directed Share Program. At our request, the underwriters have reserved for sale, at the initial public offering price, up to approximately 5.0% of the shares of our common stock being offered for sale by this prospectus to certain executive officers and members of our Board of Directors and certain business associates, friends and family of our executive officers and Board of Directors through a reserved share program. We will offer these shares to the extent permitted under applicable regulations in the United States and applicable
122
Table of Contents
jurisdictions. If these persons purchase reserved shares it will reduce the number of shares available for sale to the general public. Any reserved shares that are not so purchased will be offered by the underwriters to the general public on the same terms as the other shares offered by this prospectus. Shares purchased in the reserved share program will be subject to the 180 day lock-up restrictions described above. Other than the underwriting discount described on the front cover of this prospectus, the underwriters will not be entitled to any additional commission with respect to shares of common stock sold pursuant to the reserved share program.
Selling Restrictions. Other than in the United States, no action has been taken by us or the underwriters that would permit a public offering of the securities offered by this prospectus in any jurisdiction where action for that purpose is required. The securities offered by this prospectus may not be offered or sold, directly or indirectly, nor may this prospectus or any other offering material or advertisements in connection with the offer and sale of any such securities be distributed or published in any jurisdiction, except under circumstances that will result in compliance with the applicable rules and regulations of that jurisdiction. Persons into whose possession this prospectus comes are advised to inform themselves about and to observe any restrictions relating to the offering and the distribution of this prospectus. This prospectus does not constitute an offer to sell or a solicitation of an offer to buy any securities offered by this prospectus in any jurisdiction in which such an offer or a solicitation is unlawful.
123
Table of Contents
The validity of the shares of our common stock offered pursuant to this prospectus will be passed upon for us by Stradling Yocca Carlson & Rauth, a Professional Corporation, Newport Beach, California. Shareholders of the firm own a total of 8,500 shares of the Company’s common stock. Certain legal matters relating to this offering will be passed upon for the underwriters by Manatt, Phelps & Phillips, LLP, San Francisco, California.
Our financial statements as of December 31, 2013 and 2012, and for each of the two years in the period ended December 31, 2013, appearing in this prospectus and the registration statement of which this prospectus is a part have been audited by Vavrinek, Trine, Day & Co., LLP, independent registered public accounting firm, as set forth in their report thereon appearing elsewhere herein, and are included in reliance upon such report given on authority of such firm as experts in accounting and auditing.
WHERE YOU CAN FIND ADDITIONAL INFORMATION
We have filed with the SEC a registration statement on Form S-1, which includes exhibits, schedules and amendments, under the Securities Act with respect to this offering of our securities. Although this prospectus, which forms a part of the registration statement, contains all material information included in the registration statement, parts of the registration statement have been omitted as permitted by rules and regulations of the SEC. We refer you to the registration statement and its exhibits for further information about us, our securities and this offering. The registration statement and its exhibits, as well as any other documents that we have filed with the SEC, may be inspected and copied at the SEC’s public reference room at 100 F Street, N.E., Washington, D.C. 20549-1004. The public may obtain information about the operation of the public reference room by calling the SEC at 1-800-SEC-0330. In addition, the SEC maintains a website at http://www.sec.gov that contains registration statements, reports, proxy and information statements, and other information regarding issuers like us that file electronically with the SEC.
We maintain an Internet site at http://www.ff-inc.com. Information on, or accessible through, our website is not part of this prospectus.
After we have completed this offering, and so long as we remain a reporting company under the Exchange Act, we will continue to file annual, quarterly and current reports, proxy statements and other information with the SEC. We intend to make these filings available on our website once the offering is completed. You may read and copy any reports, statements or other information on file at the public reference rooms. You can also request copies of these documents, for a copying fee, by writing to the SEC.
124
Table of Contents
FIRST FOUNDATION INC.
INDEX TO CONSOLIDATED 2013 FINANCIAL STATEMENTS
| Report of Independent Registered Public Accounting Firm on the Consolidated Financial Statements |
F-2 | |||
| Consolidated Balance Sheets: December 31, 2013 and December 31, 2012 |
F-3 | |||
| Consolidated Income Statements: Years Ended December 31, 2013 and December 31, 2012 |
F-4 | |||
| Consolidated Statements of Comprehensive Income: Years Ended December 31, 2013 and December 31, 2012 |
F-5 | |||
| Consolidated Statements of Changes in Shareholders’ Equity: Years Ended December 31, 2013 and December 31, 2012 |
F-6 | |||
| Consolidated Statements of Cash Flows: Years Ended December 31, 2013 and December 31, 2012 |
F-7 | |||
| F-8 | ||||
INDEX TO CONSOLIDATED MARCH 2014 FINANCIAL STATEMENTS
| Consolidated Balance Sheets: March 31, 2014 (unaudited) and December 31, 2013 |
F-45 | |||
| Consolidated Income Statements (unaudited): Quarters Ended March 31, 2014 and March 31, 2013 |
F-46 | |||
| Consolidated Statements of Comprehensive Income (unaudited): Quarters Ended March 31, 2014 and March 31, 2013 |
F-47 | |||
| Consolidated Statements of Changes in Shareholder’s Equity (unaudited): Quarters Ended March 31, 2014 and March 31, 2013 |
F-48 | |||
| Consolidated Statements of Cash Flows (unaudited): Quarters Ended March 31, 2014 and March 31, 2013 |
F-49 | |||
| F-50 | ||||
F-1
Table of Contents

REPORT OF INDEPENDENT REGISTERED PUBLIC ACCOUNTING FIRM
To the Board of Directors and Shareholders
First Foundation Inc. and Subsidiaries
Irvine, California
We have audited the accompanying consolidated balance sheets of First Foundation Inc. and Subsidiaries as of December 31, 2013 and 2012 and the related consolidated statements of income and comprehensive income, changes in shareholders’ equity and cash flows for the years then ended. These consolidated financial statements are the responsibility of the Company’s management. Our responsibility is to express an opinion on these consolidated financial statements based on our audits.
We conducted our audits in accordance with the standards of the Public Company Accounting Oversight Board (United States). Those standards require that we plan and perform the audit to obtain reasonable assurance about whether the consolidated financial statements are free of material misstatement. The Company is not required to have, nor were we engaged to perform, an audit of its internal control over financial reporting. Our audit included consideration of internal control over financial reporting as a basis for designing audit procedures that are appropriate in the circumstances, but not for the purpose of expressing an opinion on the effectiveness of the Company_s internal control over financial reporting. Accordingly, we express no such opinion. An audit includes examining, on a test basis, evidence supporting the amounts and disclosures in the consolidated financial statements. An audit also includes assessing the accounting principles used and significant estimates made by management, as well as evaluating the overall financial statement presentation. We believe that our audits provide a reasonable basis for our opinion.
In our opinion, the consolidated financial statements referred to above present fairly, in all material respects, the financial position of First Foundation Inc. and Subsidiaries as of December 31, 2013 and 2012, and the results of its operations and its cash flows for the years then ended in conformity with accounting principles generally accepted in the United States of America.

Laguna Hills, California
March 17, 2014

F-2
Table of Contents
FIRST FOUNDATION INC.
(In thousands, except share and per share amounts)
| December 31, | ||||||||||
| 2013 | 2012 | |||||||||
| ASSETS | ||||||||||
| Cash and cash equivalents |
$ 56,954 | $ | 63,108 | |||||||
| Securities available-for-sale (“AFS”) |
59,111 | 5,813 | ||||||||
|
|
|
|
| |||||||
| Loans, net of deferred fees |
903,645 | 743,627 | ||||||||
| Allowance for loan and lease losses (“ALLL”) |
(9,915) | (8,340 | ) | |||||||
|
|
|
|
| |||||||
| Net loans |
893,730 | 735,287 | ||||||||
|
|
|
|
| |||||||
| Premises and equipment, net |
3,249 | 2,384 | ||||||||
| Investment in FHLB stock |
6,721 | 8,500 | ||||||||
| Deferred taxes |
12,052 | 10,055 | ||||||||
| Real estate owned (“REO”) |
375 | 650 | ||||||||
| Other assets |
5,168 | 4,712 | ||||||||
|
|
|
|
| |||||||
| Total Assets |
$ 1,037,360 | $ | 830,509 | |||||||
|
|
|
|
| |||||||
| LIABILITIES AND SHAREHOLDERS’ EQUITY | ||||||||||
| Liabilities: |
||||||||||
| Deposits |
$ 802,037 | $ | 649,741 | |||||||
| Borrowings |
141,063 | 100,000 | ||||||||
| Accounts payable and other liabilities |
7,498 | 7,188 | ||||||||
|
|
|
|
| |||||||
| Total Liabilities |
950,598 | 756,929 | ||||||||
|
|
|
|
| |||||||
| Commitments and contingencies |
- | - | ||||||||
| Shareholders’ Equity |
||||||||||
| Common Stock, par value $.001: 20,000,000 shares authorized; 7,733,514 and 7,366,126 shares issued and outstanding at December 31, 2013 and December 31, 2012, respectively |
8 | 7 | ||||||||
| Additional paid-in-capital |
76,334 | 69,434 | ||||||||
| Retained earnings |
11,990 | 4,139 | ||||||||
| Accumulated other comprehensive income (loss), net of tax |
(1,570) | - | ||||||||
|
|
|
|
| |||||||
| Total Shareholders’ Equity |
86,762 | 73,580 | ||||||||
|
|
|
|
| |||||||
| Total Liabilities and Shareholders’ Equity |
$ 1,037,360 | $ | 830,509 | |||||||
|
|
|
|
| |||||||
(See accompanying notes to the consolidated financial statements)
F-3
Table of Contents
FIRST FOUNDATION INC.
CONSOLIDATED INCOME STATEMENTS
(In thousands, except share and per share amounts)
| For the Year Ended December 31, | ||||||||||||
| 2013 | 2012 | |||||||||||
| Interest income: |
||||||||||||
| Loans |
$ | 37,918 | $ | 30,552 | ||||||||
| Securities |
864 | 193 | ||||||||||
| Fed funds sold and interest-bearing deposits |
399 | 129 | ||||||||||
|
|
|
|
| |||||||||
| Total interest income |
39,181 | 30,874 | ||||||||||
|
|
|
|
| |||||||||
| Interest expense: |
||||||||||||
| Deposits |
3,167 | 2,918 | ||||||||||
| Borrowings |
340 | 227 | ||||||||||
|
|
|
|
| |||||||||
| Total interest expense |
3,507 | 3,145 | ||||||||||
|
|
|
|
| |||||||||
| Net interest income |
35,674 | 27,729 | ||||||||||
| Provision for loan losses |
2,395 | 2,065 | ||||||||||
|
|
|
|
| |||||||||
| Net interest income after provision for loan losses |
33,279 | 25,664 | ||||||||||
|
|
|
|
| |||||||||
| Noninterest income: |
||||||||||||
| Asset management, consulting and other fees |
18,240 | 15,326 | ||||||||||
| Other income |
1,584 | 1,294 | ||||||||||
|
|
|
|
| |||||||||
| Total noninterest income |
19,824 | 16,620 | ||||||||||
|
|
|
|
| |||||||||
| Noninterest expense: |
||||||||||||
| Compensation and benefits |
28,760 | 23,267 | ||||||||||
| Occupancy and depreciation |
6,556 | 5,068 | ||||||||||
| Professional services and marketing costs |
4,003 | 2,720 | ||||||||||
| Other expenses |
4,303 | 3,421 | ||||||||||
|
|
|
|
| |||||||||
| Total noninterest expense |
43,622 | 34,476 | ||||||||||
|
|
|
|
| |||||||||
| Income before taxes on income |
9,481 | 7,808 | ||||||||||
| Taxes on income |
1,630 | 2,007 | ||||||||||
|
|
|
|
| |||||||||
| Net income |
$ | 7,851 | $ | 5,801 | ||||||||
|
|
|
|
| |||||||||
| Net income per share: |
||||||||||||
| Basic |
$ | 1.06 | $ | 0.88 | ||||||||
| Diluted |
$ | 1.01 | $ | 0.85 | ||||||||
| Shares used in computation: |
||||||||||||
| Basic |
7,424,210 | 6,603,533 | ||||||||||
| Diluted |
7,742,215 | 6,831,955 | ||||||||||
(See accompanying notes to the consolidated financial statements)
F-4
Table of Contents
FIRST FOUNDATION INC.
CONSOLIDATED STATEMENTS OF COMPREHENSIVE INCOME
(In thousands)
| For the Year Ended December 31, | ||||||||||||
| 2013 | 2012 | |||||||||||
| Net income |
$ | 7,851 | $ | 5,801 | ||||||||
|
|
|
|
| |||||||||
| Other comprehensive income (loss): |
||||||||||||
| Unrealized holding gains (losses) on securities arising during the period |
(2,668 | ) | 14 | |||||||||
|
|
|
|
| |||||||||
| Other comprehensive income (loss) before tax |
(2,668 | ) | 14 | |||||||||
| Income tax (expense) benefit related to items of other |
1,098 | - | ||||||||||
|
|
|
|
| |||||||||
| Other comprehensive income (loss) |
(1,570 | ) | 14 | |||||||||
|
|
|
|
| |||||||||
| Total comprehensive income |
$ | 6,281 | $ | 5,815 | ||||||||
|
|
|
|
| |||||||||
(See accompanying notes to the consolidated financial statements)
F-5
Table of Contents
FIRST FOUNDATION INC.
CONSOLIDATED STATEMENTS OF CHANGES
IN SHAREHOLDERS’ EQUITY
(In thousands, except share and per share amounts)
| Common Stock | Additional Paid-in-Capital |
Retained Earnings (Deficit) |
Accumulated Other Comprehensive Income (Loss) |
Total | ||||||||||||||||||||
| Number of Shares |
Amount | |||||||||||||||||||||||
| Balance: December 31, 2011 |
6,166,574 | $ 6 | $ 50,867 | $ (1,662) | $ (14) | $ 49,197 | ||||||||||||||||||
| Net income |
- | - | - | 5,801 | - | 5,801 | ||||||||||||||||||
| Other comprehensive income |
- | - | - | - | 14 | 14 | ||||||||||||||||||
| Issuance of restricted stock |
9,667 | - | - | - | - | - | ||||||||||||||||||
| Issuance of common stock |
||||||||||||||||||||||||
| Under merger agreement |
815,447 | 1 | 12,230 | - | - | 12,231 | ||||||||||||||||||
| Capital raise |
374,438 | - | 5,617 | - | - | 5,617 | ||||||||||||||||||
| Stock-based compensation |
- | - | 720 | - | - | 720 | ||||||||||||||||||
|
|
|
|
|
|
|
|
|
|
|
|
|
|||||||||||||
| Balance: December 31, 2012 |
7,366,126 | 7 | 69,434 | 4,139 | - | 73,580 | ||||||||||||||||||
| Net income |
- | - | - | 7,851 | - | 7,851 | ||||||||||||||||||
| Other comprehensive (loss) |
- | - | - | - | (1,570) | (1,570) | ||||||||||||||||||
| Issuance of restricted stock |
9,667 | - | - | - | - | - | ||||||||||||||||||
| Issuance of common stock |
357,721 | 1 | 6,321 | - | - | 6,322 | ||||||||||||||||||
| Stock-based compensation |
- | - | 579 | - | - | 579 | ||||||||||||||||||
|
|
|
|
|
|
|
|
|
|
|
|
|
|||||||||||||
| Balance: December 31, 2013 |
7,733,514 | $ 8 | $ 76,334 | $ 11,990 | $ (1,570) | $ 86,762 | ||||||||||||||||||
|
|
|
|
|
|
|
|
|
|
|
|
|
|||||||||||||
(See accompanying notes to the consolidated financial statements)
F-6
Table of Contents
FIRST FOUNDATION INC.
CONSOLIDATED STATEMENTS OF CASH FLOWS
(In thousands)
| For the Year Ended December 31, | ||||||||
| 2013 | 2012 | |||||||
| Cash Flows from Operating Activities: |
||||||||
| Net income |
$ | 7,851 | $ | 5,801 | ||||
| Adjustments to reconcile net income to net cash provided by operating activities: |
||||||||
| Provision for loan losses |
2,395 | 2,065 | ||||||
| Depreciation and amortization |
1,040 | 591 | ||||||
| Stock–based compensation expense |
579 | 720 | ||||||
| Deferred tax benefit |
(1,267 | ) | (2,051 | ) | ||||
| Provision for REO losses |
250 | - | ||||||
| Increase in other assets |
(366 | ) | (1,078 | ) | ||||
| Increase in accounts payable and other liabilities |
703 | 2,378 | ||||||
|
|
|
|
|
|||||
| Net cash provided by operating activities |
11,185 | 8,426 | ||||||
|
|
|
|
|
|||||
| Cash Flows from Investing Activities: |
||||||||
| Net increase in loans |
(160,838 | ) | (129,899 | ) | ||||
| Purchase of AFS securities |
(62,664 | ) | (19,100 | ) | ||||
| Maturity / sale of AFS securities |
6,608 | 32,486 | ||||||
| Cash from acquisition |
- | 34,891 | ||||||
| Sale (purchase) of FHLB stock, net |
1,779 | (3,029 | ) | |||||
| Purchase of premises and equipment |
(1,905 | ) | (1,370 | ) | ||||
|
|
|
|
|
|||||
| Net cash used in investing activities |
(217,020 | ) | (86,021 | ) | ||||
|
|
|
|
|
|||||
| Cash Flows from Financing Activities: |
||||||||
| Increase in deposits |
152,296 | 115,988 | ||||||
| Net increase in borrowings |
41,063 | 9,000 | ||||||
| Proceeds from the sale of stock, net |
6,322 | 5,617 | ||||||
|
|
|
|
|
|||||
| Net cash provided by financing activities |
199,681 | 130,605 | ||||||
|
|
|
|
|
|||||
| Increase (decrease) in cash and cash equivalents |
(6,154 | ) | 53,010 | |||||
| Cash and cash equivalents at beginning of year |
63,108 | 10,098 | ||||||
|
|
|
|
|
|||||
| Cash and cash equivalents at end of year |
$ | 56,954 | $ | 63,108 | ||||
|
|
|
|
|
|||||
| Supplemental disclosures of cash flow information: |
||||||||
| Cash paid during the period for: |
||||||||
| Interest |
$ | 3,506 | $ | 3,032 | ||||
| Income taxes |
$ | 3,490 | $ | 2,475 | ||||
| Noncash transactions: |
||||||||
| Chargeoffs against allowance for loans losses |
$ | 820 | $ | 275 | ||||
| Transfer from loans to REO |
$ | - | $ | 225 | ||||
(See accompanying notes to the consolidated financial statements)
F-7
Table of Contents
FIRST FOUNDATION INC.
NOTES TO THE CONSOLIDATED FINANCIAL STATEMENTS
Years Ended December 31, 2013 and 2012
NOTE 1: SUMMARY OF SIGNIFICANT ACCOUNTING POLICIES
Business
First Foundation Inc. (“FFI”) is a financial holding company whose operations are conducted through its wholly owned subsidiaries: First Foundation Advisors (“FFA”) and First Foundation Bank (“FFB” or the “Bank”), and First Foundation Insurance Services (“FFIS”), a wholly owned subsidiary of FFB (collectively the “Company”). FFI also has two inactive wholly owned subsidiaries, First Foundation Consulting (“FFC”) and First Foundation Advisors, LLC (“FFA LLC”). In addition, FFA has set up a limited liability company, which is not included in these consolidated financial statements, as a private investment fund to provide an investment vehicle for its clients. The corporate headquarters for all of the companies is located in Irvine, California. The Company has wealth management offices in California in Newport Beach, Palm Desert, Pasadena, El Centro, West Los Angeles and San Diego and in Las Vegas, Nevada.
FFA, established in 1985 and incorporated in the State of California, began operating in 1990 as a fee based registered investment advisor. FFA provides (i) investment management and financial planning services for high net-worth individuals, retirement plans, charitable institutions and private foundations; (ii) provides financial, investment and economic advisory and related services to high net-worth individuals and their families, family-owned businesses, and other related organizations; and (iii) provides support services involving the processing and transmission of financial and economic data for charitable organizations. At the end of 2013, these services were provided to approximately 1,300 clients, primarily located in Southern California, with an aggregate of $2.6 billion of assets under management.
The Bank commenced operations in 2007 and currently operates primarily in Southern California and in Nevada. The Bank offers a wide range of deposit instruments including personal and business checking and savings accounts, including interest-bearing negotiable order of withdrawal (“NOW”) accounts, money market accounts, and time certificates of deposit (“CD”) accounts. As a lender, the Bank originates, and retains for its portfolio, loans secured by real estate and commercial loans. Over 90% of the Bank’s loans are to clients located in California. The Bank also offers a wide range of specialized services including trust services, on-line banking, remote deposit capture, merchant credit card services, ATM cards, Visa debit cards, business sweep accounts, and through FFIS, insurance brokerage services. Effective in the second quarter of 2012, the Bank changed its charter to a state non-member bank and it is now subject to continued examination by the California Department of Business Oversight and Federal Deposit Insurance Corporation.
On August 15, 2012, the Company completed the acquisition of Desert Commercial Bank (“DCB”). As a result of this acquisition (the “Merger”), the assets, liabilities and operations of DCB were transferred to FFB. In addition, DCB ceased to exist as a separate legal entity.
At December 31, 2013, the Company employed 187.5 full-time equivalent employees.
Subsequent Events
The Company has evaluated subsequent events for recognition and disclosure through March 17, 2014, which is the date the financial statements were available to be issued.
F-8
Table of Contents
FIRST FOUNDATION INC.
NOTES TO THE CONSOLIDATED FINANCIAL STATEMENTS
Years Ended December 31, 2013 and 2012
Basis of Presentation
The consolidated financial statements include the accounts of the Company and its wholly owned subsidiaries. All inter-company balances and transactions have been eliminated in consolidation. The consolidated financial statements have been prepared in conformity with accounting principles generally accepted in the United States of America and prevailing practices within the banking industry. In preparing the consolidated financial statements, management is required to make estimates and assumptions that affect the reported amounts of assets and liabilities as of the date of the balance sheet and revenues and expenses for the period. Actual results could differ significantly from those estimates.
Reclassifications
Certain amounts in the 2012 consolidated financial statements have been reclassified to conform to the 2013 presentation.
Cash and Cash Equivalents
For purposes of reporting cash flows, cash and cash equivalents include cash, due from banks, certificates of deposits with maturities of less than ninety days, investment securities with original maturities of less than ninety days, money market mutual funds and Federal funds sold. At times, the Bank maintains cash at major financial institutions in excess of Federal Deposit Insurance Corporation (“FDIC”) insured limits. However, as the Bank places these deposits with major well-capitalized financial institutions and monitors the financial condition of these institutions, management believes the risk of loss to be minimal. The Bank maintains most of its excess cash at the Federal Reserve Bank, with well-capitalized correspondent banks or with other depository institutions at amounts less than the FDIC insured limits. At December 31, 2013, included in cash and cash equivalents were $44.1 million in funds held at the Federal Reserve Bank.
Banking regulations require that banks maintain a percentage of their deposits as reserves in cash or on deposit with the Federal Reserve Bank. The Bank was in compliance with its reserve requirements as of December 31, 2013.
Certificates of Deposit
From time to time, the Company may invest funds with other financial institutions through certificates of deposit. Certificates of deposit with maturities of less than ninety days are included as cash and cash equivalents. Certificates of deposit are carried at cost.
Investment Securities
Investment securities for which the Company has the positive intent and ability to hold to maturity are reported at cost, adjusted for premiums and discounts that are recognized in interest income using the interest method over the period to maturity. Investments not classified as trading securities nor as held-to-maturity securities are classified as available-for-sale securities and recorded at fair value. Unrealized gains or losses on available-for-sale securities are excluded from net income and reported as an amount net of taxes as a separate component of other comprehensive income included in shareholders’ equity. Premiums or discounts on held-to-maturity and available-for-sale securities are amortized or accreted into income using the interest method.
F-9
Table of Contents
FIRST FOUNDATION INC.
NOTES TO THE CONSOLIDATED FINANCIAL STATEMENTS
Years Ended December 31, 2013 and 2012
Realized gains or losses on sales of held-to-maturity or available-for-sale securities are recorded using the specific identification method. Declines in the fair value of individual held-to-maturity and available-for-sale securities below their cost that are considered other-than-temporary impairment (“OTTI”) result in write-downs of the individual securities to their fair value. The credit component of any OTTI related write-downs is charged against earnings.
Management evaluates securities for OTTI at least on a quarterly basis, and more frequently when economic or market conditions warrant such an evaluation. For securities in an unrealized loss position, management considers the extent and duration of the unrealized loss, and the financial condition and near-term prospects of the issuer. Management also assesses whether it intends to sell, or it is more likely than not that it will be required to sell, a security in an unrealized loss position before recovery of its amortized cost basis. If either of the criteria regarding intent or requirement to sell is met, the entire difference between amortized cost and fair value is recognized as impairment through earnings. For debt securities that do not meet the aforementioned criteria, the amount of impairment is split into two components as follows; OTTI related to credit loss, which must be recognized in the income statement and; OTTI related to other factors, which is recognized in other comprehensive income. The credit loss is defined as the difference between the present value of the cash flows expected to be collected and the amortized cost basis. For equity securities, the entire amount of impairment is recognized through earnings.
Loan Origination Fees and Costs
Net loan origination fees and direct costs associated with lending are deferred and amortized to interest income as an adjustment to yield over the respective lives of the loans using the interest method. The amortization of deferred fees and costs is discontinued on loans that are placed on nonaccrual status. When a loan is paid off, any unamortized net loan origination fees are recognized in interest income.
Allowance for Loan Losses
The allowance for loan losses is a valuation allowance for probable incurred credit losses. Provisions for loan losses are charged to operations based on management’s evaluation of the estimated losses in its loan portfolio. The major factors considered in evaluating losses are historical charge-off experience, delinquency rates, local and national economic conditions, the borrower’s ability to repay the loan and timing of repayments, and the value of any related collateral. Management’s estimate of fair value of the collateral considers current and anticipated future real estate market conditions, thereby causing these estimates to be particularly susceptible to changes that could result in a material adjustment to results of operations in the future. Recovery of the carrying value of such loans and related real estate is dependent, to a great extent, on economic, operating and other conditions that may be beyond the Bank’s control.
The Bank’s primary regulatory agencies periodically review the allowance for loan losses and such agencies may require the Bank to recognize additions to the allowance based on information and factors available to them at the time of their examinations. Accordingly, no assurance can be given that the Bank will not recognize additional provisions for loan losses with respect to its loan portfolio.
The allowance consists of specific and general reserves. Specific reserves relate to loans that are individually classified as impaired. Loan losses are charged against the allowance when management believes a loan balance is uncollectible. Subsequent recoveries, if any, are credited to the allowance. Allocations of the allowance may be made for specific loans, but the entire allowance is available for any loan that, in management’s judgment, should be charged off.
F-10
Table of Contents
FIRST FOUNDATION INC.
NOTES TO THE CONSOLIDATED FINANCIAL STATEMENTS
Years Ended December 31, 2013 and 2012
The Bank considers a loan to be impaired when, based upon current information and events, it believes it is probable that the Bank will be unable to collect all amounts due according to the contractual terms of the loan agreement. The Bank bases the measurement of loan impairment using either the present value of the expected future cash flows discounted at the loan’s effective interest rate, or the fair value of the loan’s collateral properties. Impairment losses are included in the allowance for loan losses through a charge to provision for loan losses. Adjustments to impairment losses due to changes in the fair value of impaired loans’ collateral properties are included in the provision for loan losses. The Bank’s impaired loans include nonaccrual loans (excluding those collectively reviewed for impairment), certain restructured loans and certain performing loans less than ninety days delinquent (“other impaired loans”) that the Bank believes will likely not be collected in accordance with contractual terms of the loans. Loans, for which the terms have been modified resulting in a concession, and for which the borrower is experiencing financial difficulties, are generally considered troubled debt restructurings and classified as impaired.
Commercial loans and loans secured by multifamily and commercial real estate are individually evaluated for impairment. If a loan is impaired, a portion of the allowance is allocated so that the loan is reported, net, at the present value of estimated future cash flows using the loan’s existing rate or at the fair value of collateral if repayment is expected solely from the collateral. Large groups of smaller balance homogeneous loans, such as consumer and residential real estate loans, are collectively evaluated for impairment, and accordingly, they are not separately identified for impairment disclosures.
Troubled debt restructurings are separately identified for impairment disclosures and are measured at the present value of estimated future cash flows using the loan’s effective rate at inception. If a troubled debt restructuring is considered to be a collateral dependent loan, the loan is reported, net, at the fair value of the collateral. For troubled debt restructurings that subsequently default, the Bank determines the amount of reserve in accordance with the accounting policy for the allowance for loan losses.
General reserves cover non-impaired loans and are based on historical loss rates for each portfolio segment, adjusted for the effects of qualitative or environmental factors that are likely to cause estimated credit losses as of the evaluation date to differ from the portfolio segment’s historical loss experience. Because the Bank is relatively new and has not experienced any meaningful amount of losses in any of its current portfolio segments, the Bank calculates the historical loss rates on industry data, specifically loss rates published by the FDIC. Qualitative factors include consideration of the following: changes in lending policies and procedures; changes in economic conditions, changes in the nature and volume of the portfolio; changes in the experience, ability and depth of lending management and other relevant staff; changes in the volume and severity of past due, nonaccrual and other adversely graded loans; changes in the loan review system; changes in the value of the underlying collateral for collateral-dependent loans; concentrations of credit and the effect of other external factors such as competition and legal and regulatory requirements.
Portfolio segments identified by the Bank include loans secured by residential real estate, including multifamily and single family properties, loans secured by commercial real estate, commercial and industrial loans and consumer loans. Relevant risk characteristics for these portfolio segments generally include debt service coverage, loan-to-value ratios and financial performance on non-consumer loans and debt-to income, collateral type and loan-to-value ratios for consumer loans.
Financial Instruments
In the ordinary course of business, the Bank has entered into off-balance sheet financial instruments consisting of commitments to extend credit, commercial letters of credit, and standby letters of credit. Such financial instruments are recorded in the financial statements when they are funded or related fees are incurred or received.
F-11
Table of Contents
FIRST FOUNDATION INC.
NOTES TO THE CONSOLIDATED FINANCIAL STATEMENTS
Years Ended December 31, 2013 and 2012
Real Estate Owned
Real estate owned (REO) represents the collateral acquired through foreclosure in full or partial satisfaction of the related loan. REO is recorded at the fair value less estimated selling costs at the date of foreclosure. Any write-down at the date of transfer is charged to the allowance for loan losses. The recognition of gains or losses on sales of REO is dependent upon various factors relating to the nature of the property being sold and the terms of sale. REO values are reviewed on an ongoing basis and any decline in value is recognized as foreclosed asset expense in the current period. The net operating results from these assets are included in the current period in noninterest expense as foreclosed asset expense (income).
Premises and Equipment
Premises and equipment are stated at cost, less accumulated depreciation and amortization, which is charged to expense on a straight-line basis over the estimated useful lives of 3 to 10 years. Premises under leasehold improvements are amortized on a straight-line basis over the term of the lease or the estimated useful life of the improvements, whichever is shorter. Expenditures for major renewals and betterments of premises and equipment are capitalized and those for maintenance and repairs are charged to expense as incurred. A valuation allowance is established for any impaired long-lived assets. The Company did not have impaired long-lived assets as of December 31, 2013 or 2012.
Federal Home Loan Bank Stock
As a member of the Federal Home Loan Bank (“FHLB”), the Bank is required to purchase FHLB stock in accordance with its advances, securities and deposit agreement. This stock, which is carried at cost, may be redeemed at par value. However, there are substantial restrictions regarding redemption and the Bank can only receive a full redemption in connection with the Bank surrendering its FHLB membership. At December 31, 2013, the Bank held $6.7 million of FHLB stock. The Company does not believe that this stock is currently impaired and no adjustments to its carrying value have been recorded.
Revenue Recognition
Interest on Loans: Loans on which the accrual of interest has been discontinued are designated as nonaccrual loans. Accrual of interest on loans is discontinued when reasonable doubt exists as to the full, timely collection of interest or principal and, generally, when a loan becomes contractually past due for ninety days or more with respect to principal or interest. The accrual of interest may be continued on a well-secured loan contractually past due ninety days or more with respect to principal or interest if the loan is in the process of collection or collection of the principal and interest is deemed probable.
When a loan is placed on nonaccrual status, all interest previously accrued but not collected is reversed against current period income. Interest on such loans is then recognized only to the extent that cash is received and where the future collection of principal is probable. Accrual of interest is resumed on loans only when, in the judgment of management, the loan is estimated to be fully collectible. The Bank continues to accrue interest on restructured loans since full payment of principal and interest is expected and such loans are performing or less than ninety days delinquent and, therefore, do not meet the criteria for nonaccrual status. Restructured loans that have been placed on nonaccrual status are returned to accrual status when the remaining loan balance, net of any charge-offs related to the restructure, is estimated to be fully collectible by management and performing in accordance with the applicable loan terms.
F-12
Table of Contents
FIRST FOUNDATION INC.
NOTES TO THE CONSOLIDATED FINANCIAL STATEMENTS
Years Ended December 31, 2013 and 2012
Other Fees: Asset management fees are billed on a monthly or quarterly basis based on the amount of assets under management and the applicable contractual fee percentage. Asset management fees are recognized as revenue in the period in which they are billed and earned. Financial planning fees are due and billed at the completion of the planning project and are recognized as revenue at that time.
Stock-Based Compensation
The Company recognizes the cost of employee services received in exchange for awards of stock options, or other equity instruments, based on the grant-date fair value of those awards. This cost is recognized over the period, which an employee is required to provide services in exchange for the award, generally the vesting period. A Black-Scholes model is utilized to estimate the fair value of stock options, while the market price of the Company’s common stock at the date of grant is used for stock awards.
Marketing Costs
The Company expenses marketing costs, including advertising, in the period incurred.
Income Taxes
The Company accounts for income taxes using the asset and liability method. Under the asset and liability method, deferred tax assets and liabilities are recognized for the future tax consequences attributable to differences between the financial statement carrying amounts of existing assets and liabilities and their respective tax bases. A valuation allowance is established if it is “more likely than not” that all or a portion of the deferred tax asset will not be realized.
The tax effects from an uncertain tax position can be recognized in the financial statements only if, based on its merits, the position is more likely than not to be sustained on audit by the taxing authorities. Interest and penalties related to uncertain tax positions are recorded as part of income tax expense.
Comprehensive Income
Comprehensive income consists of net income and other comprehensive income. Changes in unrealized gains and losses on available-for-sale securities and the related tax costs or benefits are the only components of other comprehensive income for the Company.
Earnings Per Share (“EPS”)
Basic earnings per share represents income available to common shareholders divided by the weighted-average number of common shares outstanding during the period. Diluted earnings per share reflect additional common shares that would have been outstanding if dilutive potential common shares had been issued, as well as any adjustment to income that would result from the assumed issuance. Potential common shares that may be issued by the Company relate to outstanding stock options and restricted stock, and are determined using the treasury stock method.
F-13
Table of Contents
FIRST FOUNDATION INC.
NOTES TO THE CONSOLIDATED FINANCIAL STATEMENTS
Years Ended December 31, 2013 and 2012
Fair Value Measurement
Fair values of financial instruments are estimated using relevant market information and other assumptions, as more fully disclosed in a separate note. Fair value estimates involve uncertainties and matters of significant judgment regarding interest rates, credit risk, prepayments, and other factors, especially in the absence of broad markets for particular items. Changes in assumptions or in market conditions could significantly affect these estimates.
New Accounting Pronouncements
In December 2011, the FASB issued ASU 2011-11, Balance Sheet (“Topic 210”)—Disclosures about Offsetting Assets and Liabilities (“ASU 11-11”). This ASU amends Topic 210, “Balance Sheet,” to require an entity to disclose both gross and net information about financial instruments, such as sales and repurchase agreements and reverse sale and repurchase agreements and securities borrowing/lending arrangements, and derivative instruments that are eligible for offset in the statement of financial position and/or subject to a master netting arrangement or similar agreement. ASU 11-11 is effective for annual and interim periods beginning on January 1, 2013. The adoption of this ASU did not have a significant impact on the Company’s financial position, results of operations, or cash flows.
In February 2013, the FASB issued ASU 2013-02, Comprehensive Income (“Topic 220”)—Reporting of Amounts Reclassified Out of Accumulated Other Comprehensive Income (“ASU 13-02”). This ASU requires an entity to provide information about the amounts reclassified out of accumulated other comprehensive income by component. In addition, an entity is required to present, either on the face of the statement where net income is presented or in the notes, significant amounts reclassified out of accumulated other comprehensive income by the respective line items of net income but only if the amount reclassified is required under GAAP to be reclassified to net income in its entirety in the same reporting period. For other amounts that are not required under GAAP to be reclassified in their entirety to net income, an entity is required to cross-reference to other disclosures required under GAAP that provide additional detail about those amounts. ASU 13-02 is effective prospectively for annual and interim periods beginning after December 15, 2012. The adoption of this ASU did not have a material impact on the Company’s financial position, results of operations, or cash flows.
NOTE 2: ACQUISITIONS
On August 15, 2012, the Company acquired all the assets and assumed all the liabilities of DCB in exchange for stock and a minimal amount of cash for fractional shares. The Company issued 815,447 shares of its common stock with a fair value of $15.00 per share and paid $3,000 in cash. In addition, prior to the acquisition, the Company had acquired shares of DCB at a cost of $241,000. The primary reasons for acquiring DCB were to expand into the Coachella Valley and to increase the size of our operations. The Company contributed all of the assets, assumed liabilities and operations of DCB to the Bank. As a result, the Bank acquired branches in Palm Desert and El Centro, California from DCB, and consolidated its existing branch in La Quinta, California into the Palm Desert branch.
The Merger is accounted for under the acquisition method of accounting. The acquired assets, assumed liabilities and identifiable intangible assets are recorded at their respective acquisition date fair values. No goodwill was recognized in this Merger.
F-14
Table of Contents
FIRST FOUNDATION INC.
NOTES TO THE CONSOLIDATED FINANCIAL STATEMENTS
Years Ended December 31, 2013 and 2012
The following table represents the assets acquired and liabilities assumed of DCB as of August 15, 2012 and the fair value adjustments and amounts recorded by the Bank in 2012 under the acquisition method of accounting:
| DCB Book Value |
Fair Value Adjustments |
Fair Value | ||||||||||
| (dollars in thousands) | ||||||||||||
| Assets Acquired: |
||||||||||||
| Cash and cash equivalents |
$ | 34,894 | $ | - | $ | 34,894 | ||||||
| Securities AFS |
9,020 | (11) | 9,009 | |||||||||
| Loans, net of deferred fees |
96,192 | (6,067) | 90,125 | |||||||||
| Allowance for loan losses |
(2,054) | 2,054 | - | |||||||||
| Premises and equipment, net |
978 | (604) | 374 | |||||||||
| Investment in FHLB stock |
588 | - | 588 | |||||||||
| Deferred taxes |
- | 3,617 | 3,617 | |||||||||
| REO |
700 | (275) | 425 | |||||||||
| Other assets |
518 | 370 | 888 | |||||||||
|
|
|
|
|
|
|
|||||||
| Total assets acquired |
$ | 140,836 | $ | (916) | $ | 139,920 | ||||||
|
|
|
|
|
|
|
|||||||
| Liabilities Assumed: |
||||||||||||
| Deposits |
$ | 126,724 | $ | 204 | $ | 126,928 | ||||||
| Accounts payable and other liabilities |
600 | (83) | 517 | |||||||||
|
|
|
|
|
|
|
|||||||
| Total liabilities assumed |
127,324 | 121 | 127,445 | |||||||||
| Excess of assets acquired over liabilities assumed |
13,512 | (1,037) | 12,475 | |||||||||
|
|
|
|
|
|
|
|||||||
| Total |
$ | 140,836 | $ | (916) | $ | 139,920 | ||||||
|
|
|
|
|
|
|
|||||||
| Consideration: |
||||||||||||
| Stock issued |
$ | 12,231 | ||||||||||
| Basis in DCB stock purchased, cash paid |
244 | |||||||||||
|
|
|
|||||||||||
| Total |
$ | 12,475 | ||||||||||
|
|
|
|||||||||||
In many cases, the fair values of assets acquired and liabilities assumed were determined by estimating the cash flows expected to result from those assets and liabilities and discounting them at appropriate market rates. The most significant category of assets for which this procedure was used was that of acquired loans. The excess of expected cash flows above the fair value of the majority of loans will be accreted to interest income over the remaining lives of the loans in accordance with Financial Accounting Standards Board (“FASB”) Accounting Standards Codification (“ASC”) 310-20 (formerly SFAS No. 91).
Certain loans, for which specific credit-related deterioration since origination was identified, are recorded at fair value reflecting the present value of the amounts expected to be collected. Income recognition on these “purchased credit impaired” loans is based on a reasonable expectation about the timing and amount of cash flows to be collected. Acquired loans deemed impaired and considered collateral dependent, with the timing of the sale of loan collateral indeterminate, remain on nonaccrual status and have no accretable yield. All purchased credit impaired loans were classified as accruing loans as of and subsequent to the acquisition date.
F-15
Table of Contents
FIRST FOUNDATION INC.
NOTES TO THE CONSOLIDATED FINANCIAL STATEMENTS
Years Ended December 31, 2013 and 2012
For loans acquired from DCB, the contractual amounts due, expected cash flows to be collected and fair value as of the respective acquisition dates were as follows:
| Purchased Credit Impaired |
All Other Acquired Loans |
|||||||
| (dollars in thousands) | ||||||||
| Contractual amounts due |
$ | 19,751 | $ | 105,154 | ||||
| Cash flows not expected to be collected |
6,462 | 1,851 | ||||||
|
|
|
|
|
|||||
| Expected cash flows |
13,289 | 103,303 | ||||||
| Interest component of expected cash flows |
1,871 | 24,596 | ||||||
|
|
|
|
|
|||||
| Fair value of acquired loans |
$ | 11,418 | $ | 78,707 | ||||
|
|
|
|
|
|||||
In accordance with generally accepted accounting principles there was no carryover of the allowance for loan losses that had been previously recorded by DCB.
The Company recorded a deferred income tax asset of $3.6 million related to DCB’s operating loss carry-forward and other tax attributes of DCB, along with the effects of fair value adjustments resulting from applying the acquisition method of accounting.
The fair value of savings and transaction deposit accounts acquired from DCB were assumed to approximate their carrying value as these accounts have no stated maturity and are payable on demand. Certificates of deposit accounts were valued by comparing the contractual cost of the portfolio to an identical portfolio bearing current market rates. The portfolio was segregated into pools based on remaining maturity. For each pool, the projected cash flows from maturing certificates were then calculated based on contractual rates and prevailing market rates. The valuation adjustment for each pool is equal to the present value of the difference of these two cash flows, discounted at the assumed market rate for a certificate with a corresponding maturity. This valuation adjustment will be accreted to reduce interest expense over the remaining maturities of the respective pools. The Company also recorded a core deposit intangible, which represents the value of the deposit relationships acquired in the Merger, of $0.4 million. The core deposit intangible will be amortized over a period of 7 years.
The Merger agreement provided for contingent consideration to be paid to the shareholders of DCB, in the form of additional shares of common stock of FFI, if the actual losses (as defined in the agreement) on a pool of loans and REO was less than $4.5 million, as measured on the second anniversary of the date of the Merger. The actual and expected losses on this pool of loans and REO, as set forth in the Merger Agreement, which is reflected in the fair values assigned to these loans and REO, was greater than $4.5 million at the date of the merger and as of December 31, 2013. Therefore, no contingent consideration has been provided for in the consolidated financial statements.
Pro Forma Information (unaudited)
The following table presents unaudited pro forma information as if the DCB acquisition had occurred on January 1, 2012 after giving effect to certain adjustments. The unaudited pro forma information for the year ended December 31, 2012 includes adjustments for interest income on loans acquired, amortization of intangibles arising from the transaction, adjustments for interest expense on deposits acquired, and the related income tax effects of all these items. The net effect of these pro forma adjustments was a $0.1 million decrease in net income for the
F-16
Table of Contents
FIRST FOUNDATION INC.
NOTES TO THE CONSOLIDATED FINANCIAL STATEMENTS
Years Ended December 31, 2013 and 2012
year ended December 31, 2012. The unaudited pro forma financial information is not necessarily indicative of the results of operations that would have occurred had the transaction been effected on the assumed date.
| Pro Forma Summarized Income Statement Data (Unaudited) | ||||
| Pro Forma Year Ended December 31, 2012 |
||||
| (dollars in thousands) | ||||
| Net interest income |
$ | 31,293 | ||
| Provision for loan losses |
2,670 | |||
| Noninterest income |
16,800 | |||
| Noninterest expenses |
38,801 | |||
|
|
|
|||
| Income before taxes |
6,622 | |||
| Taxes on income |
1,967 | |||
|
|
|
|||
| Net income |
$ | 4,655 | ||
|
|
|
|||
| Net income per share: |
||||
| Basic |
$ | 0.65 | ||
| Diluted |
$ | 0.63 | ||
The amount of revenues (net interest income and noninterest income) for the period from August 16, 2012 to December 31, 2012 related to the loans, deposits and operations acquired from DCB and included in the results of operations for the year ended December 31, 2012 was approximately $2.3 million. The earnings for the period from August 16, 2012 to December 31, 2012 related to the operations acquired from DCB and included in the results of operations for the year ended December 31, 2012 was approximately $0.5 million.
NOTE 3: FAIR VALUE
Fair value is the exchange price that would be received for an asset or paid to transfer a liability in the principal or most advantageous market for the asset or liability in an orderly transaction between market participants on the measurement date. Current accounting guidance establishes a fair value hierarchy, which requires an entity to maximize the use of observable inputs and minimize the use of unobservable inputs when measuring fair value. The guidance describes three levels of inputs that may be used to measure fair value:
Level 1: Quoted prices (unadjusted) for identical assets or liabilities in active markets that the entity has the ability to access as of the measurement date.
Level 2: Significant other observable inputs other than Level 1 prices such as quoted prices for similar assets or liabilities; quoted prices in markets that are not active; or other inputs that are observable or can be corroborated by observable market data.
Level 3: Significant unobservable inputs that reflect an entity’s own assumptions about the assumptions that market participants would use in pricing an asset or liability.
In certain cases, the inputs used to measure fair value may fall into different levels of the fair value hierarchy. In such cases, the level in the fair value hierarchy within which the fair value measurement in its entirety falls has been determined based on the lowest level input that is significant to the fair value measurement in its entirety. The Company’s assessment of the significance of a particular input to the fair value measurement in its entirety requires judgment, and considers factors specific to the asset or liability.
F-17
Table of Contents
FIRST FOUNDATION INC.
NOTES TO THE CONSOLIDATED FINANCIAL STATEMENTS
Years Ended December 31, 2013 and 2012
The carrying amounts and estimated fair values of financial instruments are as follows at December 31:
| Carrying Value |
Fair Value Measurement Level | |||||||||||||||||||
| (dollars in thousands) | 1 | 2 | 3 | Total | ||||||||||||||||
| 2013: |
||||||||||||||||||||
| Assets: |
||||||||||||||||||||
| Cash and cash equivalents |
$ | 56,954 | $ | 56,954 | $ | - | $ | - | $ | 56,954 | ||||||||||
| Securities AFS |
59,111 | - | 59,111 | - | 59,111 | |||||||||||||||
| Loans |
893,730 | - | - | 933,695 | 933,695 | |||||||||||||||
| Investment in FHLB stock |
6,721 | - | - | 6,721 | 6,721 | |||||||||||||||
| Liabilities: |
||||||||||||||||||||
| Deposits |
802,037 | 556,171 | 245,920 | - | 802,091 | |||||||||||||||
| Borrowings |
141,063 | - | 134,000 | 7,063 | 141,063 | |||||||||||||||
| 2012: |
||||||||||||||||||||
| Assets: |
||||||||||||||||||||
| Cash and cash equivalents |
$ | 63,108 | $ | 63,108 | $ | - | $ | - | $ | 63,108 | ||||||||||
| Securities AFS |
5,813 | - | 5,813 | - | 5,813 | |||||||||||||||
| Loans |
735,287 | - | - | 769,235 | 769,235 | |||||||||||||||
| Investment in FHLB stock |
8,500 | - | - | 8,500 | 8,500 | |||||||||||||||
| Liabilities: |
||||||||||||||||||||
| Deposits |
649,741 | 319,621 | 330,256 | - | 649,877 | |||||||||||||||
| Borrowings |
100,000 | - | 100,000 | - | 100,000 | |||||||||||||||
These estimates do not reflect any premium or discount that could result from offering the Company’s entire holdings of a particular financial instrument for sale at one time, nor do they attempt to estimate the value of anticipated future business related to the instruments. In addition, the tax ramifications related to the realization of unrealized gains and losses can have a significant effect on fair value estimates and have not been considered in any of these estimates.
The following methods and assumptions were used by management to estimate the fair value of its financial instruments:
Cash and Cash Equivalents: The carrying amounts of cash and short-term instruments approximate fair values and are classified as Level 1.
Securities Available-for-Sale: Fair values for securities available for sale are generally determined by matrix pricing, which is a mathematical technique widely used in the industry to value debt securities without relying exclusively on quoted prices for the specific securities but rather by relying on the securities’ relationship to other benchmark quoted securities (Level 2).
Loans: Fair values of loans, excluding loans held for sale, are estimated using discounted cash flow analyses, using interest rates currently being offered for loans with similar terms to borrowers of similar credit quality resulting in a Level 3 classification. The methods utilized to estimate the fair value of loans do not necessarily represent an exit price.
F-18
Table of Contents
FIRST FOUNDATION INC.
NOTES TO THE CONSOLIDATED FINANCIAL STATEMENTS
Years Ended December 31, 2013 and 2012
Investment in FHLB Stock: The carrying amount approximates fair value, as the stock may be sold back to the FHLB at carrying value and no other market exists for the sale of this stock (Level 3).
Deposits: The fair values disclosed for demand deposits, including interest and non-interest demand accounts, savings, and certain types of money market accounts are, by definition, equal to the carrying amount at the reporting date resulting in a Level 1 classification. Fair values for fixed rate certificates of deposit are estimated using a discounted cash flow calculation that applies interest rates currently being offered on certificates to a schedule of aggregated expected monthly maturities on time deposits resulting in a Level 2 classification.
Borrowings: The carrying value of overnight FHLB advances approximates fair values because of the short-term maturity of this instrument, resulting in a Level 2 classification. The $7.1 million term loan is a variable rate loan for which the rate adjusts quarterly, and as such, its fair value is based on its carrying value resulting in a Level 3 classification.
Because no market exists for a significant portion of the Company’s financial instruments, fair value estimates are based on judgments regarding current economic conditions, risk characteristics of various financial instruments and other factors. Those estimates that are subjective in nature and involve uncertainties and matters of significant judgment and therefore cannot be determined with precision are included in Level 3. Changes in assumptions could significantly affect the fair values presented.
The following table provides quantitative information about the Company’s nonrecurring Level 3 fair value measurements of its REO as of December 31:
| (dollars in thousands) | Valuation Technique |
Unobservable |
Estimate Used |
Fair Value | ||||||||
| 2013: |
||||||||||||
| Undeveloped land |
Third Party Appraisal | Selling costs | 9.0 | % | $ | 375 | ||||||
|
|
|
|||||||||||
| 2012: |
||||||||||||
| Single family residence |
Third party appraisal less senior liens |
Selling costs | 9.0 | % | $ | 225 | ||||||
| Undeveloped land |
Third party appraisal | Selling costs | 9.0 | % | 425 | |||||||
|
|
|
|||||||||||
| Total |
$ | 650 | ||||||||||
|
|
|
|||||||||||
Appraisals are performed by certified general appraisers (for commercial properties) or certified residential appraisers (for residential properties) whose qualifications and licenses have been reviewed and verified by the Company. Once received, a member of the Appraisal Department reviews the assumptions and approaches utilized in the appraisal as well as the overall resulting fair value in comparison with independent data sources such as recent market data or industry-wide statistics. Adjustments are routinely made in the appraisal process by the independent appraisers to adjust for differences between the comparable sales and income data available.
In certain cases we use discounted cash flow or similar internal modeling techniques to determine the fair value of our Level 3 assets and liabilities. Use of these techniques requires determination of relevant inputs and assumptions, some of which represent significant unobservable inputs. Accordingly, changes in these
F-19
Table of Contents
FIRST FOUNDATION INC.
NOTES TO THE CONSOLIDATED FINANCIAL STATEMENTS
Years Ended December 31, 2013 and 2012
unobservable inputs may have a significant impact on fair value. Certain of these unobservable inputs will (in isolation) have a directionally consistent impact on the fair value of the instrument for a given change in that input. Alternatively, the fair value of the instrument may move in an opposite direction for a given change in another input. Where multiple inputs are used within the valuation technique of an asset or liability, a change in one input in a certain direction may be offset by an opposite change in another input having a potentially muted impact to the overall fair value of that particular instrument. Additionally, a change in one unobservable input may result in a change to another unobservable input (that is, changes in certain inputs are interrelated to one another), which may counteract or magnify the fair value impact.
NOTE 4: SECURITIES
The following table provides a summary of the Company’s AFS securities portfolio at December 31:
| Amortized Cost |
Gross Unrealized | Estimated Fair Value |
||||||||||||||
| (dollars in thousands) | Gains | Losses | ||||||||||||||
| 2013: |
||||||||||||||||
| US Treasury securities |
$ | 300 | $ | - | $ | - | $ | 300 | ||||||||
| FNMA and FHLB Agency notes |
10,496 | - | (716) | 9,780 | ||||||||||||
| Agency mortgage-backed securities |
50,983 | - | (1,952) | 49,031 | ||||||||||||
|
|
|
|
|
|
|
|
|
|||||||||
| Total |
$ | 61,779 | $ | - | $ | (2,668) | $ | 59,111 | ||||||||
|
|
|
|
|
|
|
|
|
|||||||||
| 2012: |
||||||||||||||||
| US Treasury securities |
$ | 300 | $ | - | $ | - | $ | 300 | ||||||||
| FHLB Agency Note |
5,513 | - | - | 5,513 | ||||||||||||
|
|
|
|
|
|
|
|
|
|||||||||
| Total |
$ | 5,813 | $ | - | $ | - | $ | 5,813 | ||||||||
|
|
|
|
|
|
|
|
|
|||||||||
The US Treasury Securities are pledged as collateral to the State of California to meet regulatory requirements related to the Bank’s trust operations.
All unrealized losses had been in a continuous loss position less than 12 months as of December 31, 2013. Unrealized losses on FNMA and FHLB agency notes and agency mortgage-backed securities have not been recognized into income because the issuer bonds are of high credit quality, management does not intend to sell and it is not more likely than not that management would be required to sell the securities prior to their anticipated recovery, and the decline in fair value is largely due to changes in interest rates. The fair value is expected to recover as the bonds approach maturity.
F-20
Table of Contents
FIRST FOUNDATION INC.
NOTES TO THE CONSOLIDATED FINANCIAL STATEMENTS
Years Ended December 31, 2013 and 2012
The scheduled maturities of securities AFS, other than agency mortgage backed securities, and the related weighted average yield is as follows as of December 31, 2013:
| (dollars in thousands) | Less than 1 Year |
1 Through 5 years |
5 Through 10 Years |
After 10 Years |
Total | |||||||||||||||
| Amortized Cost: |
||||||||||||||||||||
| US Treasury securities |
$ | 300 | $ | - | $ | - | $ | - | $ | 300 | ||||||||||
| FNMA and FHLB Agency notes |
- | - | 10,496 | - | 10,496 | |||||||||||||||
|
|
|
|
|
|
|
|
|
|
|
|||||||||||
| Total |
$ | 300 | $ | - | $ | 10,496 | $ | - | $ | 10,796 | ||||||||||
|
|
|
|
|
|
|
|
|
|
|
|||||||||||
| Weighted average yield |
0.21% | 0.00% | 1.78% | 0.00% | 1.74% | |||||||||||||||
|
|
|
|
|
|
|
|
|
|
|
|||||||||||
| Estimated Fair Value: |
||||||||||||||||||||
| US Treasury securities |
$ | 300 | $ | - | $ | - | $ | - | $ | 300 | ||||||||||
| FNMA and FHLB Agency notes |
- | - | 9,780 | - | 9,780 | |||||||||||||||
|
|
|
|
|
|
|
|
|
|
|
|||||||||||
| Total |
$ | 300 | $ | - | $ | 9,780 | $ | - | $ | 10,080 | ||||||||||
|
|
|
|
|
|
|
|
|
|
|
|||||||||||
Agency mortgage backed securities are excluded from the above table because such securities are not due at a single maturity date. The weighted average yield of the agency mortgage backed securities as of December 31, 2013 was 2.63%.
NOTE 5: LOANS
The following is a summary of our loans as of December 31:
| (dollars in thousands) | 2013 | 2012 | ||||||
| Outstanding principal balance: |
||||||||
| Loans secured by real estate: |
||||||||
| Residential properties: |
||||||||
| Multifamily |
$ | 405,984 | $ | 367,412 | ||||
| Single family |
227,096 | 155,864 | ||||||
|
|
|
|
|
|||||
| Total real estate loans secured by residential properties |
633,080 | 523,276 | ||||||
| Commercial properties |
154,982 | 132,217 | ||||||
| Land |
3,794 | 7,575 | ||||||
|
|
|
|
|
|||||
| Total real estate loans |
791,856 | 663,068 | ||||||
| Commercial and industrial loans |
93,255 | 67,920 | ||||||
| Consumer loans |
18,484 | 12,585 | ||||||
|
|
|
|
|
|||||
| Total loans |
903,595 | 743,573 | ||||||
| Premiums, discounts and deferred fees and expenses |
50 | 54 | ||||||
|
|
|
|
|
|||||
| Total |
$ | 903,645 | $ | 743,627 | ||||
|
|
|
|
|
|||||
F-21
Table of Contents
FIRST FOUNDATION INC.
NOTES TO THE CONSOLIDATED FINANCIAL STATEMENTS
Years Ended December 31, 2013 and 2012
As of December 31, 2013 and 2012, the principal balances shown above are net of unaccreted discount related to loans acquired in an acquisition of $3.1 million and $6.3 million, respectively.
In 2012, the Company purchased loans, for which there was, at acquisition, evidence of deterioration of credit quality since origination and it was probable, at acquisition, that all contractually required payments would not be collected. The carrying amount of these purchased credit impaired loans is as follows at December 31:
| (dollars in thousands) | 2013 | 2012 | ||||||
| Outstanding principal balance: |
||||||||
| Loans secured by real estate: |
||||||||
| Residential properties |
$ | - | $ | 2,574 | ||||
| Commercial properties |
5,543 | 5,567 | ||||||
| Land |
2,331 | 6,137 | ||||||
|
|
|
|
|
|||||
| Total real estate loans |
7,874 | 14,278 | ||||||
| Commercial and industrial loans |
2,489 | 2,621 | ||||||
| Consumer loans |
260 | 276 | ||||||
|
|
|
|
|
|||||
| Total loans |
10,623 | 17,175 | ||||||
| Unaccreted discount on purchased credit impaired loans |
(2,945) | (5,782) | ||||||
|
|
|
|
|
|||||
| Total |
$ | 7,678 | $ | 11,393 | ||||
|
|
|
|
|
|||||
Accretable yield, or income expected to be collected on purchased credit impaired loans, is as follows at December 31:
| (dollars in thousands) | 2013 | 2012 | ||||||
| Beginning balance |
$ | 1,531 | $ | - | ||||
| New loans purchased |
- | 1,871 | ||||||
| Accretion of income |
(730) | (340) | ||||||
| Reclassifications from nonaccretable difference |
1,879 | - | ||||||
| Disposals |
(331) | - | ||||||
|
|
|
|
|
|||||
| Ending balance |
$ | 2,349 | $ | 1,531 | ||||
|
|
|
|
|
|||||
During 2013, the unaccreted discount related to certain purchased credit impaired loans was increased by $72,000 and recorded as a charge to the ALLL to account for changes in the projected cash flows of these loans. There were no increases or reversals of the ALLL during 2012 related to purchased credit impaired loans.
F-22
Table of Contents
FIRST FOUNDATION INC.
NOTES TO THE CONSOLIDATED FINANCIAL STATEMENTS
Years Ended December 31, 2013 and 2012
The following table summarizes our delinquent and nonaccrual loans as of December 31:
| Past Due and Still Accruing | Nonaccrual | Total Past Due and Nonaccrual |
Current | Total | ||||||||||||||||||||||||
| (dollars in thousands) | 30–59 Days | 60-89 Days | 90 Days or More |
|||||||||||||||||||||||||
| 2013: |
||||||||||||||||||||||||||||
| Real estate loans: |
||||||||||||||||||||||||||||
| Residential properties |
$ | - | $ | - | $ | - | $ | 1,820 | $ | 1,820 | $ | 631,260 | $ | 633,080 | ||||||||||||||
| Commercial properties |
- | - | 417 | 598 | 1,015 | 153,967 | 154,982 | |||||||||||||||||||||
| Land |
- | - | 1,480 | - | 1,480 | 2,314 | 3,794 | |||||||||||||||||||||
| Commercial and industrial loans |
- | 2,744 | 1,315 | 344 | 4,403 | 88,852 | 93,255 | |||||||||||||||||||||
| Consumer loans |
- | - | - | 132 | 132 | 18,352 | 18,484 | |||||||||||||||||||||
|
|
|
|
|
|
|
|
|
|
|
|
|
|
|
|||||||||||||||
| Total |
$ | - | $ | 2,744 | $ | 3,212 | $ | 2,894 | $ | 8,850 | $ | 894,745 | $ | 903,595 | ||||||||||||||
|
|
|
|
|
|
|
|
|
|
|
|
|
|
|
|||||||||||||||
| Percentage of total loans |
0.00% | 0.30% | 0.36% | 0.32% | 0.98% | |||||||||||||||||||||||
| 2012: |
||||||||||||||||||||||||||||
| Real estate loans: |
||||||||||||||||||||||||||||
| Residential properties |
$ | - | $ | - | $ | - | $ | 146 | $ | 146 | $ | 523,130 | $ | 523,276 | ||||||||||||||
| Commercial properties |
2,012 | - | - | - | 2,012 | 130,205 | 132,217 | |||||||||||||||||||||
| Land |
- | - | 3,169 | 524 | 3,693 | 3,882 | 7,575 | |||||||||||||||||||||
| Commercial and industrial loans |
1,188 | 1,113 | 11 | 97 | 2,409 | 65,511 | 67,920 | |||||||||||||||||||||
| Consumer loans |
- | 147 | - | - | 147 | 12,438 | 12,585 | |||||||||||||||||||||
|
|
|
|
|
|
|
|
|
|
|
|
|
|
|
|||||||||||||||
| Total |
$ | 3,200 | $ | 1,260 | $ | 3,180 | $ | 767 | $ | 8,407 | $ | 735,166 | $ | 743,573 | ||||||||||||||
|
|
|
|
|
|
|
|
|
|
|
|
|
|
|
|||||||||||||||
| Percentage of total loans |
0.43% | 0.17% | 0.43% | 0.10% | 1.13% | |||||||||||||||||||||||
The level of delinquent loans and nonaccrual loans have been adversely impacted by the loans acquired in an acquisition. As of December 31, 2013, of the $6.1 million in loans over 90 days past due, including loans on nonaccrual, $3.1 million, or 51% were loans acquired in an acquisition.
Accrual of interest on loans is discontinued when reasonable doubt exists as to the full, timely collection of interest or principal and, generally, when a loan becomes contractually past due for ninety days or more with respect to principal or interest. The accrual of interest may be continued on a well-secured loan contractually past due ninety days or more with respect to principal or interest if the loan is in the process of collection or collection of the principal and interest is deemed probable. The Bank considers a loan to be impaired when, based upon current information and events, it believes it is probable that the Bank will be unable to collect all amounts due according to the contractual terms of the loan agreement. The determination of past due, nonaccrual or impairment status of loans acquired in an acquisition, other than loans deemed purchased impaired, is the same as loans we originate.
As of December 31, 2013, the Company had one loan with a balance of $0.1 million classified as a troubled debt restructurings (“TDR”) which is included as nonaccrual in the table above. This loan was classified as a TDR as a result of a reduction in required principal payments and an extension of the maturity date of the loan. The Company did not have any loans classified as a TDR as of December 31, 2012.
F-23
Table of Contents
FIRST FOUNDATION INC.
NOTES TO THE CONSOLIDATED FINANCIAL STATEMENTS
Years Ended December 31, 2013 and 2012
NOTE 6: ALLOWANCE FOR LOAN LOSSES
The following is a rollforward of the Bank’s allowance for loan losses for the years ended December 31:
| (dollars in thousands) | Beginning Balance |
Provision for Loan Losses |
Charge-offs | Recoveries | Ending Balance |
|||||||||||||||
| 2013: |
||||||||||||||||||||
| Real estate loans: |
||||||||||||||||||||
| Residential properties |
$ | 4,355 | $ | 1,802 | $ | - | $ | - | $ | 6,157 | ||||||||||
| Commercial properties |
936 | 561 | (57) | - | 1,440 | |||||||||||||||
| Commercial and industrial loans |
2,841 | 71 | (763) | - | 2,149 | |||||||||||||||
| Consumer loans |
208 | (39) | - | - | 169 | |||||||||||||||
|
|
|
|
|
|
|
|
|
|
|
|||||||||||
| Total |
$ | 8,340 | $ | 2,395 | $ | (820) | $ | - | $ | 9,915 | ||||||||||
|
|
|
|
|
|
|
|
|
|
|
|||||||||||
| 2012: |
||||||||||||||||||||
| Real estate loans: |
||||||||||||||||||||
| Residential properties |
$ | 3,984 | $ | 646 | $ | (275) | $ | - | $ | 4,355 | ||||||||||
| Commercial properties |
1,218 | (282) | - | - | 936 | |||||||||||||||
| Commercial and industrial loans |
1,104 | 1,737 | - | - | 2,841 | |||||||||||||||
| Consumer loans |
244 | (36) | - | - | 208 | |||||||||||||||
|
|
|
|
|
|
|
|
|
|
|
|||||||||||
| Total |
$ | 6,550 | $ | 2,065 | $ | (275) | $ | - | $ | 8,340 | ||||||||||
|
|
|
|
|
|
|
|
|
|
|
|||||||||||
F-24
Table of Contents
FIRST FOUNDATION INC.
NOTES TO THE CONSOLIDATED FINANCIAL STATEMENTS
Years Ended December 31, 2013 and 2012
The following table presents the balance in the allowance for loan losses and the recorded investment in loans by impairment method as of December 31:
| (dollars in thousands) | Allowance for Loan Losses | Unaccreted Credit Component Other Loans |
||||||||||||||||||
| Evaluated for Impairment | Purchased Impaired |
Total | ||||||||||||||||||
| Individually | Collectively | |||||||||||||||||||
| 2013: |
||||||||||||||||||||
| Allowance for loan losses: |
||||||||||||||||||||
| Real estate loans: |
||||||||||||||||||||
| Residential properties |
$ | - | $ | 6,157 | $ | - | $ | 6,157 | $ | 36 | ||||||||||
| Commercial properties |
190 | 1,250 | - | 1,440 | 290 | |||||||||||||||
| Land |
- | - | - | - | 26 | |||||||||||||||
| Commercial and industrial loans |
925 | 1,224 | - | 2,149 | 126 | |||||||||||||||
| Consumer loans |
- | 169 | - | 169 | 11 | |||||||||||||||
|
|
|
|
|
|
|
|
|
|
|
|||||||||||
| Total |
$ | 1,115 | $ | 8,800 | $ | - | $ | 9,915 | $ | 489 | ||||||||||
|
|
|
|
|
|
|
|
|
|
|
|||||||||||
| Loans: |
||||||||||||||||||||
| Real estate loans: |
||||||||||||||||||||
| Residential properties |
$ | 2,248 | $ | 630,832 | $ | - | $ | 633,080 | $ | 3,449 | ||||||||||
| Commercial properties |
821 | 150,053 | 4,108 | 154,982 | 23,968 | |||||||||||||||
| Land |
- | 2,314 | 1,480 | 3,794 | 1,939 | |||||||||||||||
| Commercial and industrial loans |
2,999 | 88,209 | 2,047 | 93,255 | 10,354 | |||||||||||||||
| Consumer loans |
- | 18,441 | 43 | 18,484 | 160 | |||||||||||||||
|
|
|
|
|
|
|
|
|
|
|
|||||||||||
| Total |
$ | 6,068 | $ | 889,849 | $ | 7,678 | $ | 903,595 | $ | 39,870 | ||||||||||
|
|
|
|
|
|
|
|
|
|
|
|||||||||||
| 2012: |
||||||||||||||||||||
| Allowance for loan losses: |
||||||||||||||||||||
| Real estate loans: |
||||||||||||||||||||
| Residential properties |
$ | - | $ | 4,355 | $ | - | $ | 4,355 | $ | 62 | ||||||||||
| Commercial properties |
- | 936 | - | 936 | 617 | |||||||||||||||
| Land |
- | - | - | - | 129 | |||||||||||||||
| Commercial and industrial loans |
1,536 | 1,305 | - | 2,841 | 302 | |||||||||||||||
| Consumer loans |
- | 208 | - | 208 | 19 | |||||||||||||||
|
|
|
|
|
|
|
|
|
|
|
|||||||||||
| Total |
$ | 1,536 | $ | 6,804 | $ | - | $ | 8,340 | $ | 1,129 | ||||||||||
|
|
|
|
|
|
|
|
|
|
|
|||||||||||
| Loans: |
||||||||||||||||||||
| Real estate loans: |
||||||||||||||||||||
| Residential properties |
$ | 2,257 | $ | 519,288 | $ | 1,731 | $ | 523,276 | $ | 5,121 | ||||||||||
| Commercial properties |
- | 128,035 | 4,182 | 132,217 | 39,862 | |||||||||||||||
| Land |
543 | 3,818 | 3,214 | 7,575 | 4,521 | |||||||||||||||
| Commercial and industrial loans |
2,736 | 62,989 | 2,195 | 67,920 | 16,512 | |||||||||||||||
| Consumer loans |
- | 12,514 | 71 | 12,585 | 324 | |||||||||||||||
|
|
|
|
|
|
|
|
|
|
|
|||||||||||
| Total |
$ | 5,536 | $ | 726,644 | $ | 11,393 | $ | 743,573 | $ | 66,340 | ||||||||||
|
|
|
|
|
|
|
|
|
|
|
|||||||||||
F-25
Table of Contents
FIRST FOUNDATION INC.
NOTES TO THE CONSOLIDATED FINANCIAL STATEMENTS
Years Ended December 31, 2013 and 2012
The column labeled “Unaccreted Credit Component Other Loans” represents the amount of unaccreted credit component discount for the other loans acquired in the Merger, and the stated principal balance of the related loans. The discount is equal to 1.23% and 1.70% of the stated principal balance of these loans as of December 31, 2013 and 2012, respectively.
The Bank categorizes loans into risk categories based on relevant information about the ability of borrowers to service their debt such as current financial information, historical payment experience, collateral adequacy, credit documentation, and current economic trends, among other factors. The Bank analyzes loans individually by classifying the loans as to credit risk. This analysis typically includes larger, non-homogeneous loans such as loans secured by multifamily or commercial real estate and commercial and industrial loans. This analysis is performed on an ongoing basis as new information is obtained. The Bank uses the following definitions for risk ratings:
Pass: Loans classified as pass are strong credits with no existing or known potential weaknesses deserving of management’s close attention.
Special Mention: Loans classified as special mention have a potential weakness that deserves management’s close attention. If left uncorrected, these potential weaknesses may result in deterioration of the repayment prospects for the loan or of the institution’s credit position at some future date.
Substandard: Loans classified as substandard are inadequately protected by the current net worth and paying capacity of the obligor or of the collateral pledged, if any. Loans so classified have a well-defined weakness or weaknesses that jeopardize the liquidation of the debt. They are characterized by the distinct possibility that the institution will sustain some loss if the deficiencies are not corrected.
Impaired: A loan is considered impaired, when, based on current information and events, it is probable that the Bank will be unable to collect all amounts due according to the contractual terms of the loan agreement.
Additionally, all loans classified as troubled debt restructurings (“TDRs”) are considered impaired. Purchased credit impaired loans are not considered impaired loans for these purposes.
Loans listed as pass include larger non-homogeneous loans not meeting the risk rating definitions above and smaller, homogeneous loans not assessed on an individual basis.
F-26
Table of Contents
FIRST FOUNDATION INC.
NOTES TO THE CONSOLIDATED FINANCIAL STATEMENTS
Years Ended December 31, 2013 and 2012
Based on the most recent analysis performed, the risk category of loans by class of loans is as follows as of December 31:
| (dollars in thousands) | Pass | Special Mention |
Substandard | Impaired | Total | |||||||||||||||
| 2013: |
||||||||||||||||||||
| Real estate loans: |
||||||||||||||||||||
| Residential properties |
$ | 630,832 | $ | - | $ | - | $ | 2,248 | $ | 633,080 | ||||||||||
| Commercial properties |
150,053 | - | 4,108 | 821 | 154,982 | |||||||||||||||
| Land |
2,314 | - | 1,480 | - | 3,794 | |||||||||||||||
| Commercial and industrial loans |
88,166 | 43 | 2,047 | 2,999 | 93,255 | |||||||||||||||
| Consumer loans |
18,309 | - | 175 | - | 18,484 | |||||||||||||||
|
|
|
|
|
|
|
|
|
|
|
|||||||||||
| Total |
$ | 889,674 | $ | 43 | $ | 7,810 | $ | 6,068 | $ | 903,595 | ||||||||||
|
|
|
|
|
|
|
|
|
|
|
|||||||||||
| 2012: |
||||||||||||||||||||
| Real estate loans: |
||||||||||||||||||||
| Residential properties |
$ | 519,288 | $ | - | $ | 1,731 | $ | 2,257 | $ | 523,276 | ||||||||||
| Commercial properties |
127,803 | - | 4,414 | - | 132,217 | |||||||||||||||
| Land |
3,818 | - | 3,214 | 543 | 7,575 | |||||||||||||||
| Commercial and industrial loans |
62,000 | 889 | 2,295 | 2,736 | 67,920 | |||||||||||||||
| Consumer loans |
12,387 | 127 | 71 | - | 12,585 | |||||||||||||||
|
|
|
|
|
|
|
|
|
|
|
|||||||||||
| Total |
$ | 725,296 | $ | 1,016 | $ | 11,725 | $ | 5,536 | $ | 743,573 | ||||||||||
|
|
|
|
|
|
|
|
|
|
|
|||||||||||
F-27
Table of Contents
FIRST FOUNDATION INC.
NOTES TO THE CONSOLIDATED FINANCIAL STATEMENTS
Years Ended December 31, 2013 and 2012
Impaired loans evaluated individually and any related allowance is as follows as of December 31:
| With No Allowance Recorded | With an Allowance Recorded | |||||||||||||||||||
| (dollars in thousands) | Unpaid Principal Balance |
Recorded Investment |
Unpaid Principal Balance |
Recorded Investment |
Related Allowance |
|||||||||||||||
| 2013: |
||||||||||||||||||||
| Real estate loans: |
||||||||||||||||||||
| Residential properties |
$ | 2,248 | $ | 2,248 | $ | - | $ | - | $ | - | ||||||||||
| Commercial properties |
223 | 223 | 598 | 598 | 190 | |||||||||||||||
| Land |
- | - | - | - | - | |||||||||||||||
| Commercial and industrial loans |
- | - | 2,999 | 2,999 | 925 | |||||||||||||||
| Consumer loans |
- | - | - | - | - | |||||||||||||||
|
|
|
|
|
|
|
|
|
|
|
|||||||||||
| Total |
$ | 2,471 | $ | 2,471 | $ | 3,597 | $ | 3,597 | $ | 1,115 | ||||||||||
|
|
|
|
|
|
|
|
|
|
|
|||||||||||
| 2012: |
||||||||||||||||||||
| Real estate loans: |
||||||||||||||||||||
| Residential properties |
$ | 2,257 | $ | 2,257 | $ | - | $ | - | $ | - | ||||||||||
| Commercial properties |
- | - | - | - | - | |||||||||||||||
| Land |
543 | 543 | - | - | - | |||||||||||||||
| Commercial and industrial loans |
- | - | 2,736 | 2,736 | 1,536 | |||||||||||||||
| Consumer loans |
- | - | - | - | - | |||||||||||||||
|
|
|
|
|
|
|
|
|
|
|
|||||||||||
| Total |
$ | 2,800 | $ | 2,800 | $ | 2,736 | $ | 2,736 | $ | 1,536 | ||||||||||
|
|
|
|
|
|
|
|
|
|
|
|||||||||||
The weighted average annualized average balance of the recorded investment for impaired loans, beginning from when the loan became impaired, and any interest income recorded on impaired loans after they became impaired is as follows for the years ending December 31:
| 2013 | 2012 | |||||||||||||||
| (dollars in thousands) | Average Recorded Investment |
Interest Income after Impairment |
Average Recorded Investment |
Interest Income after Impairment |
||||||||||||
| Real estate loans: |
||||||||||||||||
| Residential properties |
$ | 2,250 | $ | 32 | $ | 2,023 | $ | 98 | ||||||||
| Commercial properties |
323 | 22 | - | - | ||||||||||||
| Land |
- | - | 45 | - | ||||||||||||
| Commercial and industrial loans |
2,690 | 168 | 225 | 14 | ||||||||||||
| Consumer loans |
- | - | - | - | ||||||||||||
|
|
|
|
|
|
|
|
|
|||||||||
| Total |
$ | 5,263 | $ | 222 | $ | 2,293 | $ | 112 | ||||||||
|
|
|
|
|
|
|
|
|
|||||||||
There was no interest income recognized on a cash basis in either 2013 or 2012 on impaired loans.
F-28
Table of Contents
FIRST FOUNDATION INC.
NOTES TO THE CONSOLIDATED FINANCIAL STATEMENTS
Years Ended December 31, 2013 and 2012
NOTE 7: PREMISES AND EQUIPMENT
A summary of premises and equipment is as follows at December 31:
| (dollars in thousands) | 2013 | 2012 | ||||||
| Leasehold improvements and artwork |
$ | 1,339 | $ | 991 | ||||
| Information technology equipment |
3,131 | 2,240 | ||||||
| Furniture and fixtures |
1,638 | 972 | ||||||
|
|
|
|
|
|||||
| Total |
6,108 | 4,203 | ||||||
| Accumulated depreciation and amortization |
(2,859) | (1,819) | ||||||
|
|
|
|
|
|||||
| Net |
$ | 3,249 | $ | 2,384 | ||||
|
|
|
|
|
|||||
NOTE 8: REAL ESTATE OWNED
The activity in our portfolio of REO is as follows during the periods ending December 31:
| (dollars in thousands) | 2013 | 2012 | ||||||
| Beginning balance |
$ | 650 | $ | - | ||||
| Loans transferred to REO |
- | 225 | ||||||
| REO acquired in Merger |
- | 425 | ||||||
| REO chargeoffs |
275 | - | ||||||
| Dispositions of REO |
- | - | ||||||
|
|
|
|
|
|||||
| Ending balance |
$ | 375 | $ | 650 | ||||
|
|
|
|
|
|||||
NOTE 9: DEPOSITS
The following table summarizes the outstanding balance of deposits and average rates paid thereon at December 31:
| 2013 | 2012 | |||||||||||||||
| (dollars in thousands) | Amount | Weighted Average Rate |
Amount | Weighted Average Rate |
||||||||||||
| Demand deposits: |
||||||||||||||||
| Noninterest-bearing |
$ | 217,782 | - | $ | 131,827 | - | ||||||||||
| Interest-bearing |
217,129 | 0.504% | 103,085 | 0.558% | ||||||||||||
| Money market and savings |
121,260 | 0.499% | 91,278 | 0.488% | ||||||||||||
| Certificates of deposits |
245,866 | 0.606% | 323,551 | 0.732% | ||||||||||||
|
|
|
|
|
|||||||||||||
| Total |
$ | 802,037 | 0.398% | $ | 649,741 | 0.522% | ||||||||||
|
|
|
|
|
|||||||||||||
At December 31, 2013, of the $229.9 million of certificates of deposits of $100,000 or more, $207.7 million mature within one year and $22.2 million mature after one year. Of the $15.9 million of certificates of deposit of less than $100,000, $13.6 million mature within one year and $2.3 million mature after one year. At December 31, 2012, of the $303.6 million of certificates of deposits of $100,000 or more, $271.4 million mature
F-29
Table of Contents
FIRST FOUNDATION INC.
NOTES TO THE CONSOLIDATED FINANCIAL STATEMENTS
Years Ended December 31, 2013 and 2012
within one year and $32.2 million mature after one year. Of the $20.0 million of certificates of deposit of less than $100,000, $16.3 million mature within one year and $3.7 million mature after one year.
NOTE 10: BORROWINGS
Borrowings: At December 31, 2013, our borrowings consisted of $134.0 million of overnight FHLB advances and a $7.1 million note payable by FFI. At December 31, 2012, the $100.0 million of borrowings consisted solely of FHLB advances. These FHLB advances were paid in full in the early part of January 2014 and 2013, respectively, and bore interest rates of 0.06% and 0.28%, respectively. Because the Bank utilizes overnight borrowings, the balance of outstanding borrowings fluctuates on a daily basis.
FHLB advances are collateralized by loans secured by multifamily and commercial real estate properties with a carrying value of $477.5 million as of December 31, 2013. As a matter of practice, the Bank provides substantially all of its qualifying loans as collateral to the FHLB. The Bank’s total borrowing capacity from the FHLB at December 31, 2013 was $335.2 million. In addition to the $134.0 million borrowing, the Bank had in place $46.0 million of letters of credit from the FHLB which are used to meet collateral requirements for borrowings from the State of California and local agencies.
The Bank also has $2.0 million available unsecured fed funds lines each with Pacific Coast Banker’s Bank and Wells Fargo Bank, and a $15.0 million available unsecured fed funds line at Zions Bank. None of these lines had outstanding borrowings as of December 31, 2013. Combined, the Bank’s unused lines of credit as of December 31, 2013 were $174.2 million. The average daily balance of borrowings outstanding during 2013 and 2012 was $84.4 million and $99.3 million, respectively.
In the second quarter of 2013, FFI entered into a term loan note agreement to borrow $7.5 million. This note bears interest at a rate of ninety day Libor plus 4.0% per annum. The term of the loan is five years. The loan agreement requires us to make monthly payments of principal and interest, the amounts of which are determined on the basis of a 10 year amortization schedule, with a final payment of the unpaid principal balance, in the amount of approximately $3.8 million, plus accrued but unpaid interest, at the maturity date of the loan in May 2018. We have the right, in our discretion, to prepay the loan at any time in whole or, from time to time, in part, without any penalties or premium. As security for our repayment of the loan, we pledged all of the common stock of the Bank to the lender. We are required to meet certain financial covenants during the term of the loan, including limits on classified assets and nonperforming assets, the maintenance of required leverage ratios, fixed charge coverage ratios and capital ratios and the maintenance of required liquidity levels at FFI. As of December 31, 2013, the Company was in compliance with all of these covenants. The term loan note agreement also contains restrictions against disposal of assets, incurrence of debt and the payment of dividends without the prior written consent of the lender. The scheduled payments of principal under this term loan were as follows as of December 31, 2013:
| (dollars in thousands) | ||||
| Year Ending December 31, |
||||
| 2014 |
$ | 750 | ||
| 2015 |
750 | |||
| 2016 |
750 | |||
| 2017 |
750 | |||
| 2018 |
4,063 | |||
|
|
|
|||
| Total |
$ | 7,063 | ||
|
|
|
|||
F-30
Table of Contents
FIRST FOUNDATION INC.
NOTES TO THE CONSOLIDATED FINANCIAL STATEMENTS
Years Ended December 31, 2013 and 2012
NOTE 11: SHAREHOLDERS’ EQUITY
During the first four months of 2013, FFI sold 38,734 shares of its common stock under a supplemental private placement in exchange for $0.6 million. In December of 2013, FFI sold an additional 318,987 shares of its common stock under a supplemental private placement in exchange for $5.7 million.
As part of the Merger, the Company issued 815,447 shares of its common stock to the shareholders of DCB. During 2012, 374,438 shares of common stock were sold by FFI under a supplemental private placement in exchange for $5.6 million.
FFI is a holding company and does not have any direct operating activities. Any future cash flow needs of FFI are expected to be met by its existing cash and cash equivalents and dividends from its subsidiaries. The Bank is subject to various laws and regulations that limit the amount of dividends that a bank can pay without obtaining prior approval from bank regulators. As a de novo institution, the Bank is restricted from paying any dividends to FFI without the prior approval from its bank regulators. As of December 31, 2013, FFI’s cash and cash equivalents totaled $5.3 million.
NOTE 12: EARNINGS PER SHARE
The following table sets forth the Company’s earnings per share calculations for the years ended December 31:
| 2013 | 2012 | |||||||||||||||
| (dollars in thousands, except per share amounts) |
Basic | Diluted | Basic | Diluted | ||||||||||||
| Net income |
$ 7,851 | $ 7,851 | $ 5,801 | $ 5,801 | ||||||||||||
|
|
|
|
|
|
|
|
|
|||||||||
| Basic common shares outstanding |
7,424,210 | 7,424,210 | 6,603,533 | 6,603,533 | ||||||||||||
|
|
|
|
|
|||||||||||||
| Effect of options and restricted stock |
318,005 | 228,422 | ||||||||||||||
|
|
|
|
|
|||||||||||||
| Diluted common shares outstanding |
7,742,215 | 6,831,955 | ||||||||||||||
|
|
|
|
|
|||||||||||||
| Earnings per share |
$ 1.06 | $ 1.01 | $ 0.88 | $ 0.85 | ||||||||||||
|
|
|
|
|
|
|
|
|
|||||||||
Based on a weighted average basis, options to purchase 154,814 and 582,472 shares of common stock were excluded for 2013 and 2012, respectively, because their effect would have been anti-dilutive.
NOTE 13: STOCK BASED COMPENSATION
In 2007, the Board of Directors of FFI approved two stock option plans (“the Plans”) that provide for future grants of options to employees and directors of the Company for the purchase of up to 1,300,282 shares of the FFI’s common stock. In 2010, the Shareholders approved an increase of 580,000 in the number of shares available for issuance under one of these plans. The options, when granted, have an exercise price not less than the current market value of the common stock and expire after ten years if not exercised. If applicable, vesting periods are set at the date of grant and the Plans provide for accelerated vesting should a change in control occur. The Company recognized stock-based compensation expense of $0.6 million in 2013 and $0.7 million in 2012. The total income tax benefit recorded was $0.2 million in each of 2013 and 2012. Included in these amounts are $0.1 million of expense related to restricted stock grants in 2012.
F-31
Table of Contents
FIRST FOUNDATION INC.
NOTES TO THE CONSOLIDATED FINANCIAL STATEMENTS
Years Ended December 31, 2013 and 2012
The fair value of the each option granted in 2013 and 2012 was estimated on the date of the grant using the Black-Scholes option pricing model with the following assumptions:
| Expected Volatility |
20 | % | ||
| Expected Term |
6.5 years | |||
| Expected Dividends |
None | |||
| Weighted Average Risk Free Rate: |
||||
| Second quarter 2013 grants |
1.320 | % | ||
| First quarter 2013 grants |
1.130 | % | ||
| Third quarter 2012 grants |
1.089 | % | ||
| Weighted-Average Grant Fair Value: |
||||
| Second quarter 2013 grants |
$ | 4.67 | ||
| First quarter 2013 grants |
$ | 3.46 | ||
| Third quarter 2012 grants |
$ | 3.46 |
Since the Company does not have any historical stock activity, the expected volatility is based on the historical volatility of similar companies that have a longer trading history. The expected term represents the estimated average period of time that the options remain outstanding. Since the Company does not have sufficient historical data on the exercise of stock options, the expected term is based on the “simplified” method that measures the expected term as the average of the vesting period and the contractual term. The risk free rate of return reflects the grant date interest rate offered for zero coupon U.S. Treasury bonds over the expected term of the options.
The following table summarizes the activities in the Plans during 2013:
| (dollars in thousands except per share amounts) |
Options Granted | Weighted Average Exercise Price per Share |
Weighted Average |
Aggregate Intrinsic Value |
||||||||||||
| Balance: December 31, 2012 |
1,423,965 | $ 12.36 | ||||||||||||||
| Options granted: |
||||||||||||||||
| First quarter |
19,000 | 15.00 | ||||||||||||||
| Second quarter |
7,000 | 17.14 | ||||||||||||||
| Options exercised |
- | - | ||||||||||||||
| Options forfeited |
(18,998) | 15.53 | ||||||||||||||
|
|
|
|||||||||||||||
| Balance: December 31, 2013 |
1,430,967 | 12.37 | 5.25 Years | $ 8,051 | ||||||||||||
|
|
|
|
|
|
|
|
|
|||||||||
| Options exercisable |
1,249,960 | $ 11.98 | 4.83 Years | $ 7,527 | ||||||||||||
|
|
|
|
|
|
|
|
|
|||||||||
As of December 31, 2013, The Company had $0.5 million of unrecognized compensation costs related to outstanding stock options which will be recognized through March 2016, subject to the vesting requirements for these stock options.
F-32
Table of Contents
FIRST FOUNDATION INC.
NOTES TO THE CONSOLIDATED FINANCIAL STATEMENTS
Years Ended December 31, 2013 and 2012
The following table summarizes the activities in the Plans during 2012:
| (dollars in thousands except per share amounts) |
Options Granted | Weighted Average Exercise Price per Share |
Weighted Average |
Aggregate Intrinsic Value |
||||||||||||
| Balance: December 31, 2011 |
1,364,467 | $ 12.23 | ||||||||||||||
| Options granted: |
||||||||||||||||
| Third quarter |
70,000 | 15.00 | ||||||||||||||
| Options exercised |
- | - | ||||||||||||||
| Options forfeited |
(10,502) | 13.57 | ||||||||||||||
|
|
|
|||||||||||||||
| Balance: December 31, 2012 |
1,423,965 | 12.36 | 6.21 Years | $ 3,845 | ||||||||||||
|
|
|
|
|
|
|
|
|
|||||||||
| Options exercisable |
1,102,072 | $ 11.55 | 5.44 Years | $ 3,845 | ||||||||||||
|
|
|
|
|
|
|
|
|
|||||||||
In 2011, the Company entered into agreements with five of its independent directors which provided for the issuance of 3,000 shares of restricted common stock of FFI to each of these directors. For each director, 1,000 shares vested in 2011 and the remaining shares vested over a two year period subject to continued service as a director. In 2011, the Company entered into an agreement with an officer which provided for the issuance of 3,000 shares of restricted common stock of FFI and in 2010, the Company entered into an agreement with an officer which provided for the issuance of 11,000 shares of restricted common stock of FFI. These shares vest over a three year period subject to continued employment.
The following table provides a summary of the non-vested restricted stock grants issued by the Company under the Plans for the periods ended December 31:
| 2013 | 2012 | |||||||||||||||
| Shares | Weighted Average Grant Date Fair Value |
Shares | Weighted Average Grant Date Fair Value |
|||||||||||||
| Balance: January 1 |
10,667 | $ | 15.00 | 20,334 | $ | 15.00 | ||||||||||
| New stock grants |
6,666 | 18.00 | - | - | ||||||||||||
| Shares vested and issued |
(9,667 | ) | 15.00 | (9,667 | ) | 15.00 | ||||||||||
| Shares forfeited |
- | - | - | - | ||||||||||||
|
|
|
|
|
|||||||||||||
| Balance December 31 |
7,666 | 17.61 | 10,667 | 15.00 | ||||||||||||
|
|
|
|
|
|||||||||||||
The fair value of the shares vested and issued was $0.1 million in each of 2013 and 2012.
NOTE 14: 401(k) PROFIT SHARING PLAN
The Company’s employees participate in the Company’s 401(k) profit sharing plan (the “401k Plan”) that covers all employees eighteen years of age or older who have completed three months of employment. Each employee eligible to participate in the 401k Plan may contribute up to 100% of his or her compensation, subject to certain statutory limitations. In 2013 and 2012, the Company matched 50% of the participant’s contribution up to 5% of employee compensation, which is subject to the plan’s vesting schedule. The Company contributions of $396,000 and $330,000 were included in Compensation and Benefits for 2013 and 2012, respectively. The Company may also make an additional profit sharing contribution on behalf of eligible employees. No profit sharing contributions were made in 2013 or 2012.
F-33
Table of Contents
FIRST FOUNDATION INC.
NOTES TO THE CONSOLIDATED FINANCIAL STATEMENTS
Years Ended December 31, 2013 and 2012
NOTE 15: INCOME TAXES
The Company is subject to federal income tax and California franchise tax. Income tax expense (benefit) was as follows for the years ended December 31:
| (dollars in thousands) | 2013 | 2012 | ||||||
| Current expense: |
||||||||
| Federal |
$ | 2,505 | $ | 3,302 | ||||
| State |
392 | 756 | ||||||
| Deferred expense (benefit): |
||||||||
| Federal |
992 | (554) | ||||||
| State |
354 | (210) | ||||||
| Benefit of net operating loss carryforwards |
(172) | (282) | ||||||
| Change in valuation allowance |
(2,441) | (1,005) | ||||||
|
|
|
|||||||
| Total |
$ | 1,630 | $ | 2,007 | ||||
|
|
|
|||||||
The following is a comparison of the federal statutory income tax rates to the Company’s effective income tax rate for the years ended December 31:
| 2013 | 2012 | |||||||||||||||
| (dollars in thousands) | Amount | Rate | Amount | Rate | ||||||||||||
| Income before taxes |
$ | 9,481 | $ | 7,808 | ||||||||||||
|
|
|
|
|
|||||||||||||
| Federal tax statutory rate |
$ | 3,224 | 34.00 % | $ | 2,655 | 34.00 % | ||||||||||
| State tax, net of Federal benefit |
664 | 7.00 % | 526 | 6.73 % | ||||||||||||
| Change in valuation allowance |
(2,441) | (25.74)% | (1,005) | (12.87)% | ||||||||||||
| Other items, net |
183 | 1.93 % | (169) | (2.16)% | ||||||||||||
|
|
|
|
|
|
|
|
|
|||||||||
| Effective tax rate |
$ | 1,630 | 17.19 % | $ | 2,007 | 25.70 % | ||||||||||
|
|
|
|
|
|
|
|
|
|||||||||
F-34
Table of Contents
FIRST FOUNDATION INC.
NOTES TO THE CONSOLIDATED FINANCIAL STATEMENTS
Years Ended December 31, 2013 and 2012
Deferred taxes are a result of differences between income tax accounting and generally accepted accounting principles with respect to income tax recognition. The following is a summary of the components of the net deferred tax assets recognized in the accompanying consolidated balances sheet at December 31:
| (dollars in thousands) | 2013 | 2012 | ||||||
| Deferred tax assets (liabilities) |
||||||||
| Allowance for loan and REO losses |
$ | 4,197 | $ | 3,326 | ||||
| Operating loss carryforwards |
2,948 | 3,085 | ||||||
| Market valuation: Loans and REO from Merger |
1,799 | 3,305 | ||||||
| Stock-based compensation |
1,402 | 1,729 | ||||||
| Accumulated other comprehensive income |
1,098 | - | ||||||
| Organizational expenses |
367 | 411 | ||||||
| Depreciation |
(713) | (365) | ||||||
| Prepaid expenses |
(329) | (141) | ||||||
| Other |
1,283 | 1,318 | ||||||
|
|
|
|||||||
| Total |
12,052 | 12,668 | ||||||
| Valuation allowance |
- | (2,613) | ||||||
|
|
|
|||||||
| Net deferred tax assets |
$ | 12,052 | $ | 10,055 | ||||
|
|
|
|||||||
As part of the merger with DCB, the Company acquired operating loss carryforwards of approximately $14.0 million. These operating loss carryforwards are subject to limitation under Section 382 of the Internal Revenue Service Code and expire in 2032. As a result, the Company will only be able to utilize operating loss carryforwards of $7.7 million, ratably over a period of 20 years. Due to the uncertainty in realizing future earnings over an extended period of 20 years, at December 31, 2012, a valuation allowance of $2.6 million was established against the operating loss carryforward benefits not realizable until after 12/31/15. At December 31, 2013, based on our continued strong earnings results and updated projections of earnings in future years, the valuation allowance was eliminated.
The Company has no other operating loss carryforwards. The Company is subject to federal income tax and franchise tax of the state of California. Income tax returns for the periods 2010 through 2013 are open to audit by federal authorities and for the period 2009 through 2013 by California state authorities.
F-35
Table of Contents
FIRST FOUNDATION INC.
NOTES TO THE CONSOLIDATED FINANCIAL STATEMENTS
Years Ended December 31, 2013 and 2012
NOTE 16: COMMITMENTS AND CONTINGENCIES
Leases
The Company leases certain facilities for its corporate offices and branch operations under non-cancelable operating leases that expire through 2020. Lease expense for 2013 and 2012 was $2.7 million and $1.8 million, respectively. Future minimum lease commitments under all non-cancelable operating leases at December 31, 2013 are as follows:
| (dollars in thousands) | ||||
| Year Ending December 31, |
||||
| 2014 |
$ | 2,950 | ||
| 2015 |
2,895 | |||
| 2016 |
2,708 | |||
| 2017 |
2,629 | |||
| 2018 and after |
3,680 | |||
|
|
|
|||
| Total |
$ | 14,862 | ||
|
|
|
|||
Financial Instruments with Off-Balance Sheet Risk
In the normal course of business, the Bank is a party to financial instruments with off-balance sheet risk to meet the financing needs of customers and to reduce exposure to fluctuations in interest rates. These financial instruments may include commitments to extend credit and standby and commercial letters of credit. Commitments to extend credit are agreements to lend to a customer as long as there is no violation of any condition established in the contract. Standby and commercial letters of credit and financial guarantees are conditional commitments issued by the Bank to guaranty the performance of a customer to a third party. Commitments generally have fixed expiration dates or other termination clauses and may require payment of a fee. The following table provides the off-balance sheet arrangements of the Bank as of December 31, 2013:
| (dollars in thousands) | ||||
| Commitments to fund new loans |
$ | 3,580 | ||
| Commitments to fund under existing loans, lines of credit |
88,292 | |||
| Commitments under standby letters of credit |
1,527 | |||
Since many of the commitments are expected to expire without being drawn upon, the total commitment amounts do not necessarily represent future cash requirements. The credit risk involved in issuing letters of credit is essentially the same as that involved in extending loan facilities to customers. The Bank evaluates each customer’s creditworthiness on a case-by-case basis. The amount of collateral obtained, if deemed necessary by the Bank upon extension of credit, is based on management’s credit evaluation of the counter-party. Collateral held varies but may include deposits, marketable securities, accounts receivable, inventory, property, plant and equipment, motor vehicles and real estate.
Litigation
From time to time, the Company may become party to various lawsuits, which have arisen in the course of business. While it is not possible to predict with certainty the outcome of such litigation, it is the opinion of management, based in part upon opinions of counsel, that the liability, if any, arising from such lawsuits would not have a material adverse effect on the Company’s financial position or results of operations.
F-36
Table of Contents
FIRST FOUNDATION INC.
NOTES TO THE CONSOLIDATED FINANCIAL STATEMENTS
Years Ended December 31, 2013 and 2012
NOTE 17: RELATED-PARTY TRANSACTIONS
Loans to related parties, including directors and executive officers of the Company and their affiliates, were as follows for the periods presented:
| (dollars in thousands) | 2013 | 2012 | ||||||
| Balance, January 1 |
$ | 1,359 | $ | 1,375 | ||||
| New loans and advances |
- | - | ||||||
| Principal payments received |
(33) | (16) | ||||||
|
|
|
|||||||
| Balance, December 31 |
$ | 1,326 | $ | 1,359 | ||||
|
|
|
|||||||
Interest earned from the loans was $0.1 million in each of 2013 and 2012.
The Bank held $2.1 million and $2.4 million of deposits from related parties, including directors and executive officers of the Company and their affiliates, as of December 31, 2013 and December 31, 2012, respectively. Interest paid on these deposit accounts was $5,000 in 2013 and $7,000 in 2012.
During 2013 and 2012, an entity in which one of the directors of the Company had an ownership interest, provided insurance brokerage services to the Company. Broker fees earned by this entity for the services it provided to the Company were $0.1 million in each of 2013 and 2012.
NOTE 18: REGULATORY MATTERS
FFI and the Bank are subject to various regulatory capital requirements administered by the federal banking agencies. Failure to meet minimum capital requirements can initiate certain mandatory, and possible additional discretionary, actions by regulators that, if undertaken, could have a direct material effect on FFI and the Bank’s financial condition. Under capital adequacy guidelines and the regulatory framework for prompt corrective action, the Company and the Bank must meet specific capital guidelines that involve quantitative measures of FFI and the Bank’s assets, liabilities, and certain off-balance sheet items as calculated under regulatory accounting practices. FFI’s and the Bank’s capital amounts and classification are also subject to qualitative judgments by the regulators about components, risk weightings, and other factors. Quantitative measures established by the regulators to ensure capital adequacy require FFI and the Bank to maintain minimum amounts and ratios (set forth in the table below) of total and Tier 1 capital (as defined in the regulations) to risk-weighted assets (as defined), and of Tier 1 capital (as defined) to assets (as defined). Management believes, as of
F-37
Table of Contents
FIRST FOUNDATION INC.
NOTES TO THE CONSOLIDATED FINANCIAL STATEMENTS
Years Ended December 31, 2013 and 2012
December 31, 2013 that FFI and the Bank met all capital adequacy requirements. The following table presents the regulatory standards for well-capitalized institutions and the capital ratios for FFI and the Bank as of:
| Actual | For Capital Adequacy Purposes |
To Be Well-Capitalized Under Prompt Corrective Action Provisions |
||||||||||||||||||||||
| (dollars in thousands) | Amount | Ratio | Amount | Ratio | Amount | Ratio | ||||||||||||||||||
| FFI | ||||||||||||||||||||||||
| December 31, 2013 |
||||||||||||||||||||||||
| Tier 1 leverage ratio |
$ | 85,268 | 8.67% | $ | 39,321 | 4.00% | ||||||||||||||||||
| Tier 1 risk-based capital ratio |
85,268 | 13.04% | 26,150 | 4.00% | ||||||||||||||||||||
| Total risk-based capital ratio |
93,465 | 14.30% | 52,300 | 8.00% | ||||||||||||||||||||
| December 31, 2012 |
||||||||||||||||||||||||
| Tier 1 leverage ratio |
$ | 72,909 | 9.19% | $ | 31,730 | 4.00% | ||||||||||||||||||
| Tier 1 risk-based capital ratio |
72,909 | 13.60% | 21,446 | 4.00% | ||||||||||||||||||||
| Total risk-based capital ratio |
79,636 | 14.85% | 42,891 | 8.00% | ||||||||||||||||||||
| BANK | ||||||||||||||||||||||||
| December 31, 2013 |
||||||||||||||||||||||||
| Tier 1 leverage ratio |
$ | 84,243 | 8.61% | $ | 39,115 | 4.00% | $ | 48,894 | 5.00% | |||||||||||||||
| Tier 1 risk-based capital ratio |
84,243 | 12.95% | 26,017 | 4.00% | 39,025 | 6.00% | ||||||||||||||||||
| Total risk-based capital ratio |
92,399 | 14.21% | 52,034 | 8.00% | 65,042 | 10.00% | ||||||||||||||||||
| December 31, 2012 |
||||||||||||||||||||||||
| Tier 1 (core) capital ratio |
$ | 67,515 | 8.56% | $ | 31,563 | 4.00% | $ | 39,454 | 5.00% | |||||||||||||||
| Tier 1 risk-based capital ratio |
67,515 | 12.68% | 21,292 | 4.00% | 31,939 | 6.00% | ||||||||||||||||||
| Total risk-based capital ratio |
74,194 | 13.94% | 42,585 | 8.00% | 53,231 | 10.00% | ||||||||||||||||||
As of December 31, 2013, the Bank is categorized as well-capitalized under these regulatory standards. There are no conditions or events that have occurred since December 31, 2013 that management believes have changed the Bank’s category. As a condition of approval of the acquisition of DCB, FFI contributed $5.0 million to the Bank, and the Bank will be required to maintain a Tier 1 Leverage Ratio of 8.5% through August 15, 2014.
NOTE 19: OTHER EXPENSES
The following items are included in the consolidated income statements as other expenses for the years ended December 31:
| (dollars in thousands) | 2013 | 2012 | ||||||
| Regulatory assessments |
$ | 650 | $ | 694 | ||||
| Directors’ compensation expenses |
604 | 600 | ||||||
F-38
Table of Contents
FIRST FOUNDATION INC.
NOTES TO THE CONSOLIDATED FINANCIAL STATEMENTS
Years Ended December 31, 2013 and 2012
NOTE 20: SEGMENT REPORTING
In 2013 and 2012, the Company had two reportable business segments: Banking (FFB) and Wealth Management (FFA). The results of FFI and any elimination entries are included in the column labeled Other. The following tables show key operating results for each of our business segments used to arrive at our consolidated totals for the years ended December 31:
| (dollars in thousands) | Banking | Wealth Management |
Other | Total | ||||||||||||
| 2013: |
||||||||||||||||
| Interest income |
$ | 39,181 | $ | - | $ | - | $ | 39,181 | ||||||||
| Interest expense |
3,288 | - | 219 | 3,507 | ||||||||||||
|
|
|
|
|
|
|
|
|
|||||||||
| Net interest income |
35,893 | - | (219 | ) | 35,674 | |||||||||||
| Provision for loan losses |
2,395 | - | - | 2,395 | ||||||||||||
| Noninterest income |
3,514 | 16,715 | (405 | ) | 19,824 | |||||||||||
| Noninterest expense |
24,302 | 17,400 | 1,920 | 43,622 | ||||||||||||
|
|
|
|
|
|
|
|
|
|||||||||
| Income (loss) before taxes on income |
$ | 12,710 | $ | (685 | ) | (2,544 | ) | $ | 9,481 | |||||||
|
|
|
|
|
|
|
|
|
|||||||||
| 2012: |
||||||||||||||||
| Interest income |
$ | 30,874 | $ | - | $ | - | $ | 30,874 | ||||||||
| Interest expense |
3,145 | - | - | 3,145 | ||||||||||||
|
|
|
|
|
|
|
|
|
|||||||||
| Net interest income |
27,729 | - | - | 27,729 | ||||||||||||
| Provision for loan losses |
2,065 | - | - | 2,065 | ||||||||||||
| Noninterest income |
2,599 | 14,250 | (229 | ) | 16,620 | |||||||||||
| Noninterest expense |
18,280 | 14,896 | 1,300 | 34,476 | ||||||||||||
|
|
|
|
|
|
|
|
|
|||||||||
| Income (loss) before taxes on income |
$ | 9,983 | $ | (646 | ) | $ | (1,529 | ) | $ | 7,808 | ||||||
|
|
|
|
|
|
|
|
|
|||||||||
F-39
Table of Contents
FIRST FOUNDATION INC.
NOTES TO THE CONSOLIDATED FINANCIAL STATEMENTS
Years Ended December 31, 2013 and 2012
The following tables show the financial position for each of our business segments, and of FFI which is included in the column labeled Other, and the eliminating entries used to arrive at our consolidated totals at December 31:
| (dollars in thousands) | Banking | Wealth Management |
Other | Eliminations | Total | |||||||||||||||
| 2013: |
||||||||||||||||||||
| Cash and cash equivalents |
$ | 56,795 | $ | 2,134 | $ | 5,294 | $ | (7,269) | $ | 56,954 | ||||||||||
| Securities AFS |
59,111 | - | - | - | 59,111 | |||||||||||||||
| Loans, net |
893,364 | 366 | - | - | 893,730 | |||||||||||||||
| Premises and equipment |
2,286 | 863 | 100 | - | 3,249 | |||||||||||||||
| FHLB Stock |
6,721 | - | - | - | 6,721 | |||||||||||||||
| Deferred taxes |
11,426 | 865 | (239) | - | 12,052 | |||||||||||||||
| REO |
375 | - | - | - | 375 | |||||||||||||||
| Other assets |
3,840 | 717 | 88,455 | (87,844) | 5,168 | |||||||||||||||
|
|
|
|
|
|
|
|
|
|
|
|||||||||||
| Total assets |
$ | 1,033,918 | $ | 4,945 | $ | 93,610 | $ | (95,113) | $ | 1,037,360 | ||||||||||
|
|
|
|
|
|
|
|
|
|
|
|||||||||||
| Deposits |
$ | 809,306 | $ | - | $ | - | $ | (7,269) | $ | 802,037 | ||||||||||
| Borrowings |
134,000 | - | 7,063 | - | 141,063 | |||||||||||||||
| Intercompany balances |
857 | 248 | (1,105) | - | - | |||||||||||||||
| Other liabilities |
4,018 | 2,590 | 890 | - | 7,498 | |||||||||||||||
| Shareholders’ equity |
85,737 | 2,107 | 86,762 | (87,844) | 86,762 | |||||||||||||||
|
|
|
|
|
|
|
|
|
|
|
|||||||||||
| Total liabilities and equity |
$ | 1,033,918 | $ | 4,945 | $ | 93,610 | $ | (95,113) | $ | 1,037,360 | ||||||||||
|
|
|
|
|
|
|
|
|
|
|
|||||||||||
| 2012: |
||||||||||||||||||||
| Cash and cash equivalents |
$ | 62,965 | $ | 1,895 | $ | 2,178 | $ | (3,930) | $ | 63,108 | ||||||||||
| Securities AFS |
5,813 | - | - | - | 5,813 | |||||||||||||||
| Loans, net |
734,778 | 509 | - | - | 735,287 | |||||||||||||||
| Premises and equipment |
1,661 | 657 | 66 | - | 2,384 | |||||||||||||||
| FHLB Stock |
8,500 | - | - | - | 8,500 | |||||||||||||||
| Deferred taxes |
8,734 | 981 | 340 | - | 10,055 | |||||||||||||||
| REO |
650 | - | - | - | 650 | |||||||||||||||
| Other assets |
3,509 | 638 | 71,058 | (70,493) | 4,712 | |||||||||||||||
|
|
|
|
|
|
|
|
|
|
|
|||||||||||
| Total assets |
$ | 826,610 | $ | 4,680 | $ | 73,642 | $ | (74,423) | $ | 830,509 | ||||||||||
|
|
|
|
|
|
|
|
|
|
|
|||||||||||
| Deposits |
$ | 653,671 | $ | - | $ | - | $ | (3,930) | $ | 649,741 | ||||||||||
| Borrowings |
100,000 | - | - | - | 100,000 | |||||||||||||||
| Intercompany balances |
1,451 | 205 | (1,656) | - | - | |||||||||||||||
| Other liabilities |
3,302 | 2,168 | 1,718 | - | 7,188 | |||||||||||||||
| Shareholders’ equity |
68,186 | 2,307 | 73,580 | (70,493) | 73,580 | |||||||||||||||
|
|
|
|
|
|
|
|
|
|
|
|||||||||||
| Total liabilities and equity |
$ | 826,610 | $ | 4,680 | $ | 73,642 | $ | (74,423) | $ | 830,509 | ||||||||||
|
|
|
|
|
|
|
|
|
|
|
|||||||||||
F-40
Table of Contents
FIRST FOUNDATION INC.
NOTES TO THE CONSOLIDATED FINANCIAL STATEMENTS
Years Ended December 31, 2013 and 2012
NOTE 21: QUARTERLY FINANCIAL INFORMATION (Unaudited)
| (dollars in thousands, except per share amounts) |
First Quarter |
Second Quarter |
Third Quarter |
Fourth Quarter |
Full Year | |||||||||||||||
| Year Ended December 31, 2013: |
||||||||||||||||||||
| Interest income |
$ | 9,004 | $ | 10,350 | $ | 9,524 | $ | 10,303 | $ | 39,181 | ||||||||||
| Interest expense |
812 | 862 | 886 | 947 | 3,507 | |||||||||||||||
|
|
|
|
|
|
|
|
|
|
|
|||||||||||
| Net interest income |
8,192 | 9,488 | 8,638 | 9,356 | 35,674 | |||||||||||||||
| Provision for loan losses |
622 | 686 | 445 | 642 | 2,395 | |||||||||||||||
| Noninterest income |
4,533 | 5,210 | 5,088 | 4,993 | 19,824 | |||||||||||||||
| Noninterest expense |
10,396 | 11,025 | 10,938 | 11,263 | 43,622 | |||||||||||||||
|
|
|
|
|
|
|
|
|
|
|
|||||||||||
| Income before taxes on income |
1,707 | 2,987 | 2,343 | 2,444 | 9,481 | |||||||||||||||
| Taxes on income |
649 | 1,135 | 890 | (1,044) | 1,630 | |||||||||||||||
|
|
|
|
|
|
|
|
|
|
|
|||||||||||
| Net income |
$ | 1,058 | $ | 1,852 | $ | 1,453 | $ | 3,488 | $ | 7,851 | ||||||||||
|
|
|
|
|
|
|
|
|
|
|
|||||||||||
| Income per share |
||||||||||||||||||||
| Basic |
$ | 0.14 | $ | 0.25 | $ | 0.20 | $ | 0.47 | $ | 1.06 | ||||||||||
|
|
|
|
|
|
|
|
|
|
|
|||||||||||
| Diluted |
$ | 0.14 | $ | 0.24 | $ | 0.19 | $ | 0.44 | $ | 1.01 | ||||||||||
|
|
|
|
|
|
|
|
|
|
|
|||||||||||
| Year Ended December 31, 2012: |
||||||||||||||||||||
| Interest income |
$ | 6,663 | $ | 7,054 | $ | 7,972 | $ | 9,185 | $ | 30,874 | ||||||||||
| Interest expense |
725 | 740 | 835 | 845 | 3,145 | |||||||||||||||
|
|
|
|
|
|
|
|
|
|
|
|||||||||||
| Net interest income |
5,938 | 6,314 | 7,137 | 8,340 | 27,729 | |||||||||||||||
| Provision for loan losses |
330 | 745 | 693 | 297 | 2,065 | |||||||||||||||
| Noninterest income |
3,771 | 4,074 | 4,010 | 4,765 | 16,620 | |||||||||||||||
| Noninterest expense |
7,670 | 8,054 | 8,886 | 9,866 | 34,476 | |||||||||||||||
|
|
|
|
|
|
|
|
|
|
|
|||||||||||
| Income before taxes on income |
1,709 | 1,589 | 1,568 | 2,942 | 7,808 | |||||||||||||||
| Taxes on income |
632 | 588 | 580 | 207 | 2,007 | |||||||||||||||
|
|
|
|
|
|
|
|
|
|
|
|||||||||||
| Net income |
$ | 1,077 | $ | 1,001 | $ | 988 | $ | 2,735 | $ | 5,801 | ||||||||||
|
|
|
|
|
|
|
|
|
|
|
|||||||||||
| Income per share |
||||||||||||||||||||
| Basic |
$ | 0.17 | $ | 0.16 | $ | 0.15 | $ | 0.37 | $ | 0.88 | ||||||||||
|
|
|
|
|
|
|
|
|
|
|
|||||||||||
| Diluted |
$ | 0.17 | $ | 0.16 | $ | 0.14 | $ | 0.36 | $ | 0.85 | ||||||||||
|
|
|
|
|
|
|
|
|
|
|
|||||||||||
F-41
Table of Contents
FIRST FOUNDATION INC.
NOTES TO THE CONSOLIDATED FINANCIAL STATEMENTS
Years Ended December 31, 2013 and 2012
NOTE 22: PARENT ONLY FINANCIAL STATEMENTS
BALANCE SHEETS
| (dollars in thousands) | December 31, | |||||||
| 2013 | 2012 | |||||||
| ASSETS | ||||||||
| Cash and cash equivalents |
$ | 5,294 | $ | 2,178 | ||||
| Premises and equipment, net |
100 | 66 | ||||||
| Deferred taxes |
(239) | 340 | ||||||
| Investment in subsidiaries |
87,844 | 70,493 | ||||||
| Intercompany receivable |
1,105 | 1,656 | ||||||
| Other assets |
611 | 565 | ||||||
|
|
|
|
|
|||||
| Total Assets |
$ | 94,715 | $ | 75,298 | ||||
|
|
|
|
|
|||||
| LIABILITIES AND SHAREHOLDERS’ EQUITY | ||||||||
| Liabilities: |
||||||||
| Borrowings |
$ | 7,063 | $ | - | ||||
| Accounts payable and other liabilities |
890 | 1,718 | ||||||
|
|
|
|
|
|||||
| Total Liabilities |
7,953 | 1,718 | ||||||
|
|
|
|
|
|||||
| Shareholders’ Equity |
||||||||
| Common Stock |
8 | 7 | ||||||
| Additional paid-in-capital |
76,334 | 69,434 | ||||||
| Retained earnings |
11,990 | 4,139 | ||||||
| Accumulated other comprehensive income (loss), net of tax |
(1,570) | - | ||||||
|
|
|
|
|
|||||
| Total Shareholders’ Equity |
86,762 | 73,580 | ||||||
|
|
|
|
|
|||||
| Total Liabilities and Shareholders’ Equity |
$ | 94,715 | $ | 75,298 | ||||
|
|
|
|
|
|||||
F-42
Table of Contents
FIRST FOUNDATION INC.
NOTES TO THE CONSOLIDATED FINANCIAL STATEMENTS
Years Ended December 31, 2013 and 2012
INCOME STATEMENTS
| (dollars in thousands) | For the Year Ended December 31, | |||||||
| 2013 | 2012 | |||||||
| Interest expense - borrowings |
$ | 219 | $ | - | ||||
|
|
|
|
|
|||||
| Noninterest income – earnings from investment in subsidiaries |
9,883 | 5,701 | ||||||
|
|
|
|
|
|||||
| Noninterest expense: |
||||||||
| Compensation and benefits |
613 | 386 | ||||||
| Occupancy and depreciation |
66 | 19 | ||||||
| Professional services and marketing costs |
1,120 | 770 | ||||||
| Other expenses |
526 | 354 | ||||||
|
|
|
|
|
|||||
| Total noninterest expense |
2,325 | 1,529 | ||||||
|
|
|
|
|
|||||
| Income before taxes on income |
7,339 | 4,172 | ||||||
| Taxes on income |
(512) | (1,629) | ||||||
|
|
|
|
|
|||||
| Net income |
$ | 7,851 | $ | 5,801 | ||||
|
|
|
|
|
|||||
STATEMENTS OF COMPREHENSIVE INCOME
| (dollars in thousands) | For the Year Ended December 31, | |||||||
| 2013 | 2012 | |||||||
| Net income |
$ | 7,851 | $ | 5,801 | ||||
|
|
|
|
|
|||||
| Other comprehensive income (loss): |
||||||||
| Unrealized holding gains (losses) on securities arising during the period |
(2,668) | 14 | ||||||
|
|
|
|
|
|||||
| Other comprehensive income (loss) before tax |
(2,668) | 14 | ||||||
| Income tax (expense) benefit related to items of other comprehensive income |
1,098 | - | ||||||
|
|
|
|
|
|||||
| Other comprehensive income (loss) |
(1,570) | 14 | ||||||
|
|
|
|
|
|||||
| Total comprehensive income |
$ | 6,281 | $ | 5,815 | ||||
|
|
|
|
|
|||||
F-43
Table of Contents
FIRST FOUNDATION INC.
NOTES TO THE CONSOLIDATED FINANCIAL STATEMENTS
Years Ended December 31, 2013 and 2012
STATEMENTS OF CASH FLOWS
| (dollars in thousands) | For the Year Ended December 31, | |||||||
| 2013 | 2012 | |||||||
| Cash Flows from Operating Activities: |
||||||||
| Net income |
$ | 7,851 | $ | 5,801 | ||||
| Adjustments to reconcile net income to net cash provided by (used in) operating activities: |
||||||||
| Earnings from investment in subsidiaries |
(9,883) | (5,701) | ||||||
| Stock–based compensation expense |
41 | 60 | ||||||
| Deferred tax liability (benefit) |
579 | (865) | ||||||
| Increase in other assets |
(46) | (120) | ||||||
| (Increase) decrease in accounts payable and other liabilities |
(828) | 1,230 | ||||||
|
|
|
|
|
|||||
| Net cash provided by (used in) operating activities |
(2,286) | 405 | ||||||
|
|
|
|
|
|||||
| Cash Flows from Investing Activities: |
||||||||
| Investment in subsidiaries |
(8,500) | (5,494) | ||||||
| Purchase of premises and equipment |
(34) | (14) | ||||||
|
|
|
|
|
|||||
| Net cash used in investing activities |
(8,534) | (5,508) | ||||||
|
|
|
|
|
|||||
| Cash Flows from Financing Activities: |
||||||||
| Proceeds from borrowings |
7,500 | - | ||||||
| Paydowns of borrowings |
(437) | - | ||||||
| Proceeds from the sale of stock, net |
6,322 | 5,617 | ||||||
| Intercompany accounts, net decrease (increase) |
551 | (288) | ||||||
|
|
|
|
|
|||||
| Net cash provided by financing activities |
13,936 | 5,329 | ||||||
|
|
|
|
|
|||||
| Increase (decrease) in cash and cash equivalents |
3,116 | 226 | ||||||
| Cash and cash equivalents at beginning of year |
2,178 | 1,952 | ||||||
|
|
|
|
|
|||||
| Cash and cash equivalents at end of year |
$ | 5,294 | $ | 2,178 | ||||
|
|
|
|
|
|||||
F-44
Table of Contents
FIRST FOUNDATION INC.
(In thousands, except share and per share amounts)
| March 31, 2014 (unaudited) |
December 31, 2013 | |||||||
| ASSETS | ||||||||
| Cash and cash equivalents |
$ | 50,287 | $ | 56,954 | ||||
| Securities available-for-sale (“AFS”) |
73,257 | 59,111 | ||||||
|
|
|
|
|
|||||
| Loans, net of deferred fees |
948,844 | 903,645 | ||||||
| Allowance for loan and lease losses (“ALLL”) |
(10,150) | (9,915) | ||||||
|
|
|
|
|
|||||
| Net loans |
938,694 | 893,730 | ||||||
|
|
|
|
|
|||||
| Premises and equipment, net |
2,978 | 3,249 | ||||||
| Investment in FHLB stock |
6,580 | 6,721 | ||||||
| Deferred taxes |
11,200 | 12,052 | ||||||
| Real estate owned (“REO”) |
1,875 | 375 | ||||||
| Other assets |
5,477 | 5,168 | ||||||
|
|
|
|
|
|||||
| Total Assets |
$ | 1,090,348 | $ | 1,037,360 | ||||
|
|
|
|
|
|||||
| LIABILITIES AND SHAREHOLDERS’ EQUITY | ||||||||
| Liabilities: |
||||||||
| Deposits |
$ | 854,684 | $ | 802,037 | ||||
| Borrowings |
140,875 | 141,063 | ||||||
| Accounts payable and other liabilities |
5,948 | 7,498 | ||||||
|
|
|
|
|
|||||
| Total Liabilities |
1,001,507 | 950,598 | ||||||
|
|
|
|
|
|||||
| Commitments and contingencies |
- | - | ||||||
| Shareholders’ Equity |
||||||||
| Common Stock, par value $.001: 20,000,000 shares authorized; 7,733,514 shares issued and outstanding at March 31, 2014 and December 31, 2013, respectively |
8 | 8 | ||||||
| Additional paid-in-capital |
76,480 | 76,334 | ||||||
| Retained earnings |
13,452 | 11,990 | ||||||
| Accumulated other comprehensive income (loss), net of tax |
(1,099) | (1,570) | ||||||
|
|
|
|
|
|||||
| Total Shareholders’ Equity |
88,841 | 86,762 | ||||||
|
|
|
|
|
|||||
| Total Liabilities and Shareholders’ Equity |
$ | 1,090,348 | $ | 1,037,360 | ||||
|
|
|
|
|
|||||
(See accompanying notes to the consolidated financial statements)
F-45
Table of Contents
FIRST FOUNDATION INC.
CONSOLIDATED INCOME STATEMENTS - UNAUDITED
(In thousands, except share and per share amounts)
| For the Quarter Ended March 31, | ||||||||
| 2014 | 2013 | |||||||
| Interest income: |
||||||||
| Loans |
$ | 10,104 | $ | 8,919 | ||||
| Securities |
392 | 23 | ||||||
| Fed funds sold and interest-bearing deposits |
179 | 62 | ||||||
|
|
|
|
|
|||||
| Total interest income |
10,675 | 9,004 | ||||||
|
|
|
|
|
|||||
| Interest expense: |
||||||||
| Deposits |
804 | 782 | ||||||
| Borrowings |
121 | 30 | ||||||
|
|
|
|
|
|||||
| Total interest expense |
925 | 812 | ||||||
|
|
|
|
|
|||||
| Net interest income |
9,750 | 8,192 | ||||||
| Provision for loan losses |
235 | 622 | ||||||
|
|
|
|
|
|||||
| Net interest income after provision for loan losses |
9,515 | 7,570 | ||||||
|
|
|
|
|
|||||
| Noninterest income: |
||||||||
| Asset management, consulting and other fees |
5,039 | 4,286 | ||||||
| Other income |
512 | 247 | ||||||
|
|
|
|
|
|||||
| Total noninterest income |
5,551 | 4,533 | ||||||
|
|
|
|
|
|||||
| Noninterest expense: |
||||||||
| Compensation and benefits |
8,480 | 7,252 | ||||||
| Occupancy and depreciation |
1,828 | 1,323 | ||||||
| Professional services and marketing costs |
1,249 | 1,045 | ||||||
| Other expenses |
989 | 776 | ||||||
|
|
|
|
|
|||||
| Total noninterest expense |
12,546 | 10,396 | ||||||
|
|
|
|
|
|||||
| Income before taxes on income |
2,520 | 1,707 | ||||||
| Taxes on income |
1,058 | 649 | ||||||
|
|
|
|
|
|||||
| Net income |
$ | 1,462 | $ | 1,058 | ||||
|
|
|
|
|
|||||
| Net income per share: |
||||||||
| Basic |
$ | 0.19 | $ | 0.14 | ||||
| Diluted |
$ | 0.18 | $ | 0.14 | ||||
| Shares used in computation: |
||||||||
| Basic |
7,733,514 | 7,376,988 | ||||||
| Diluted |
8,093,777 | 7,613,234 | ||||||
(See accompanying notes to the consolidated financial statements)
F-46
Table of Contents
FIRST FOUNDATION INC.
COMPREHENSIVE INCOME - UNAUDITED
(In thousands)
| For the Quarter Ended March 31, | ||||||||||||
| 2014 | 2013 | |||||||||||
| Net income |
$ | 1,462 | $ | 1,058 | ||||||||
|
|
|
|
| |||||||||
| Other comprehensive income: |
||||||||||||
| Unrealized holding gains (losses) on securities arising during the period |
800 | 214 | ||||||||||
|
|
|
|
| |||||||||
| Other comprehensive income before tax |
800 | 214 | ||||||||||
| Income tax (expense) benefit related to items of other comprehensive income |
(329 | ) | (90 | ) | ||||||||
|
|
|
|
| |||||||||
| Other comprehensive income |
471 | 124 | ||||||||||
|
|
|
|
| |||||||||
| Total comprehensive income |
$ | 1,933 | $ | 1,182 | ||||||||
|
|
|
|
| |||||||||
(See accompanying notes to the consolidated financial statements)
F-47
Table of Contents
FIRST FOUNDATION INC.
CONSOLIDATED STATEMENTS OF CHANGES
IN SHAREHOLDERS’ EQUITY - UNAUDITED
(In thousands, except share amounts)
| Common Stock | Accumulated Other Comprehensive Income (Loss) |
|||||||||||||||||||||||
| Number of Shares |
Amount | Additional Paid-in-Capital |
Retained Earnings |
Total | ||||||||||||||||||||
| Balance: December 31, 2012 |
7,366,126 | $ | 7 | $ | 69,434 | $ | 4,139 | $ | - | $ | 73,580 | |||||||||||||
| Net income |
- | - | - | 1,058 | - | 1,058 | ||||||||||||||||||
| Other comprehensive income |
- | - | - | - | 124 | 124 | ||||||||||||||||||
| Issuance of restricted stock |
5,000 | - | - | - | - | - | ||||||||||||||||||
| Issuance of common stock |
38,734 | 1 | 580 | - | - | 581 | ||||||||||||||||||
| Stock-based compensation |
- | - | 156 | - | - | 156 | ||||||||||||||||||
|
|
|
|
|
|
|
|
|
|
|
|
|
|||||||||||||
| Balance: March 31, 2013 |
7,409,860 | $ | 8 | $ | 70,170 | $ | 5,197 | $ | 124 | $ | 75,499 | |||||||||||||
|
|
|
|
|
|
|
|
|
|
|
|
|
|||||||||||||
| Balance: December 31, 2013 |
7,733,514 | $ | 8 | $ | 76,334 | $ | 11,990 | $ | (1,570) | $ | 86,762 | |||||||||||||
| Net income |
- | - | - | 1,462 | - | 1,462 | ||||||||||||||||||
| Other comprehensive income |
- | - | - | - | 471 | 471 | ||||||||||||||||||
| Stock-based compensation |
- | - | 146 | - | - | 146 | ||||||||||||||||||
|
|
|
|
|
|
|
|
|
|
|
|
|
|||||||||||||
| Balance: March 31, 2014 |
7,733,514 | $ | 8 | $ | 76,480 | $ | 13,452 | $ | (1,099) | $ | 88,841 | |||||||||||||
|
|
|
|
|
|
|
|
|
|
|
|
|
|||||||||||||
(See accompanying notes to the consolidated financial statements)
F-48
Table of Contents
FIRST FOUNDATION INC.
CONSOLIDATED STATEMENTS OF CASH FLOWS - UNAUDITED
(In thousands)
| For the Quarter Ended March 31, | ||||||||
| 2014 | 2013 | |||||||
| Cash Flows from Operating Activities: |
||||||||
| Net income |
$ | 1,462 | $ | 1,058 | ||||
| Adjustments to reconcile net income to net cash provided by operating activities: |
||||||||
| Provision for loan losses |
235 | 622 | ||||||
| Stock–based compensation expense |
146 | 156 | ||||||
| Depreciation and amortization |
328 | 210 | ||||||
| Deferred tax provision |
523 | 532 | ||||||
| Increase (decrease) in other assets |
(277) | 261 | ||||||
| Increase in accounts payable and other liabilities |
(1,550) | (2,660) | ||||||
|
|
|
|
|
|||||
| Net cash provided by operating activities |
867 | 179 | ||||||
|
|
|
|
|
|||||
| Cash Flows from Investing Activities: |
||||||||
| Net increase in loans |
(46,699) | (42,885) | ||||||
| Purchase of securities AFS |
(13,983) | (24,897) | ||||||
| Maturity / sale / payments – securities AFS |
605 | 5,515 | ||||||
| Redemption of FHLB stock, net |
141 | 853 | ||||||
| Purchase of premises and equipment |
(57) | (98) | ||||||
|
|
|
|
|
|||||
| Net cash used in investing activities |
(59,993) | (61,512) | ||||||
|
|
|
|
|
|||||
| Cash Flows from Financing Activities: |
||||||||
| Increase in deposits |
52,647 | 55,087 | ||||||
| FHLB Advances – net change |
(15,000) | (15,000) | ||||||
| Proceeds – term note |
15,000 | - | ||||||
| Principal payments – term note |
(188) | - | ||||||
| Proceeds from sale of stock, net |
- | 581 | ||||||
|
|
|
|
|
|||||
| Net cash provided by financing activities |
52,459 | 40,668 | ||||||
|
|
|
|
|
|||||
| Increase (decrease) in cash and cash equivalents |
(6,667) | (20,665) | ||||||
| Cash and cash equivalents at beginning of year |
56,954 | 63,108 | ||||||
|
|
|
|
|
|||||
| Cash and cash equivalents at end of year |
$ | 50,287 | $ | 42,443 | ||||
|
|
|
|
|
|||||
| Supplemental disclosures of cash flow information: |
||||||||
| Cash paid during the period for: |
||||||||
| Interest |
$ | 855 | $ | 717 | ||||
| Income taxes |
$ | 100 | $ | 1,175 | ||||
| Noncash transactions: |
||||||||
| Chargeoffs against allowance for loans losses |
$ | - | $ | 752 | ||||
| Transfer of foreclosed loan to REO |
$ | 1,500 | $ | - | ||||
(See accompanying notes to the consolidated financial statements)
F-49
Table of Contents
FIRST FOUNDATION INC.
NOTES TO THE CONSOLIDATED FINANCIAL STATEMENTS
For the Quarter Ended March 31, 2014 - UNAUDITED
NOTE 1: BASIS OF PRESENTATION
The consolidated financial statements include First Foundation Inc. (“FFI”) and its wholly owned subsidiaries: First Foundation Advisors (“FFA”), First Foundation Bank (“FFB” or the “Bank”) and First Foundation Insurance Services (“FFIS”), a wholly owned subsidiary of FFB (collectively referred to as the “Company”). All inter-company balances and transactions have been eliminated in consolidation. The results of operations reflect any interim adjustments, all of which are of a normal recurring nature and which, in the opinion of management, are necessary for a fair presentation of the results for the interim period presented. The results for the 2014 interim periods are not necessarily indicative of the results expected for the full year.
The consolidated financial statements have been prepared in conformity with accounting principles generally accepted in the United States of America and prevailing practices within the banking industry. In preparing the consolidated financial statements, management is required to make estimates and assumptions that affect the reported amounts of assets and liabilities as of the date of the balance sheet and revenues and expenses for the period. Actual results could differ significantly from those estimates.
The accompanying unaudited consolidated financial statements include all information and footnotes required for interim financial statement presentation. The financial information provided herein is written with the presumption that the users of the interim financial statements have read, or have access to, the most recent Annual Report which contains the latest available audited consolidated financial statements and notes thereto, as of December 31, 2013.
Certain reclassifications have been made to the prior year consolidated financial statements to conform to the 2014 presentation.
NOTE 2: FAIR VALUE
Fair value is the exchange price that would be received for an asset or paid to transfer a liability in the principal or most advantageous market for the asset or liability in an orderly transaction between market participants on the measurement date. Current accounting guidance establishes a fair value hierarchy, which requires an entity to maximize the use of observable inputs and minimize the use of unobservable inputs when measuring fair value. The guidance describes three levels of inputs that may be used to measure fair value:
Level 1: Quoted prices (unadjusted) for identical assets or liabilities in active markets that the entity has the ability to access as of the measurement date.
Level 2: Significant other observable inputs other than Level 1 prices such as quoted prices for similar assets or liabilities; quoted prices in markets that are not active; or other inputs that are observable or can be corroborated by observable market data.
Level 3: Significant unobservable inputs that reflect an entity’s own assumptions about the assumptions that market participants would use in pricing an asset or liability.
In certain cases, the inputs used to measure fair value may fall into different levels of the fair value hierarchy. In such cases, the level in the fair value hierarchy within which the fair value measurement in its entirety falls has been determined based on the lowest level input that is significant to the fair value measurement in its entirety. The Company’s assessment of the significance of a particular input to the fair value measurement in its entirety requires judgment, and considers factors specific to the asset or liability.
F-50
Table of Contents
FIRST FOUNDATION INC.
NOTES TO THE CONSOLIDATED FINANCIAL STATEMENTS
For the Quarter Ended March 31, 2014 - UNAUDITED
The carrying amounts and estimated fair values of financial instruments are as follows as of:
| Carrying Value |
Fair Value Measurement Level | |||||||||||||||||||
| (dollars in thousands) | 1 | 2 | 3 | Total | ||||||||||||||||
| March 31, 2014: |
||||||||||||||||||||
| Assets: |
||||||||||||||||||||
| Cash and cash equivalents |
$ | 50,287 | $ | 50,287 | $ | — | $ | — | $ | 50,287 | ||||||||||
| Securities AFS |
73,257 | — | 73,257 | — | 73,257 | |||||||||||||||
| Loans |
938,694 | — | — | 985,195 | 985,195 | |||||||||||||||
| Investment in FHLB stock |
6,580 | — | — | 6,580 | 6,580 | |||||||||||||||
| Liabilities: |
||||||||||||||||||||
| Deposits |
854,684 | 579,932 | 274,745 | — | 854,677 | |||||||||||||||
| Borrowings |
140,875 | — | 119,000 | 21,875 | 140,875 | |||||||||||||||
| December 31, 2013: |
||||||||||||||||||||
| Assets: |
||||||||||||||||||||
| Cash and cash equivalents |
$ | 56,954 | $ | 56,954 | $ | — | $ | — | $ | 56,954 | ||||||||||
| Securities AFS |
59,111 | — | 59,111 | — | 59,111 | |||||||||||||||
| Loans |
893,730 | — | — | 933,695 | 933,695 | |||||||||||||||
| Investment in FHLB stock |
6,721 | — | — | 6,721 | 6,721 | |||||||||||||||
| Liabilities: |
||||||||||||||||||||
| Deposits |
802,037 | 556,171 | 245,920 | — | 802,091 | |||||||||||||||
| Borrowings |
141,063 | — | 134,000 | 7,063 | 141,063 | |||||||||||||||
These estimates do not reflect any premium or discount that could result from offering the Company’s entire holdings of a particular financial instrument for sale at one time, nor do they attempt to estimate the value of anticipated future business related to the instruments. In addition, the tax ramifications related to the realization of unrealized gains and losses can have a significant effect on fair value estimates and have not been considered in any of these estimates.
The following methods and assumptions were used by management to estimate the fair value of its financial instruments:
Cash and Cash Equivalents: The carrying amounts of cash and short-term instruments approximate fair values and are classified as Level 1.
Securities Available-for-Sale: Fair values for securities available for sale are generally determined by matrix pricing, which is a mathematical technique widely used in the industry to value debt securities without relying exclusively on quoted prices for the specific securities but rather by relying on the securities’ relationship to other benchmark quoted securities (Level 2).
Loans: Fair values of loans, excluding loans held for sale, are estimated using discounted cash flow analyses, using interest rates currently being offered for loans with similar terms to borrowers of similar credit quality resulting in a Level 3 classification. The methods utilized to estimate the fair value of loans do not necessarily represent an exit price.
F-51
Table of Contents
FIRST FOUNDATION INC.
NOTES TO THE CONSOLIDATED FINANCIAL STATEMENTS
For the Quarter Ended March 31, 2014 - UNAUDITED
Investment in FHLB Stock: The carrying amount approximates fair value, as the stock may be sold back to the FHLB at carrying value and no other market exists for the sale of this stock (Level 3).
Deposits: The fair values disclosed for demand deposits, including interest and non-interest demand accounts, savings, and certain types of money market accounts are, by definition, equal to the carrying amount at the reporting date resulting in a Level 1 classification. Fair values for fixed rate certificates of deposit are estimated using a discounted cash flow calculation that applies interest rates currently being offered on certificates to a schedule of aggregated expected monthly maturities on time deposits resulting in a Level 2 classification.
Borrowings: The carrying value of overnight FHLB advances approximates fair values because of the short-term maturity of this instrument, resulting in a Level 2 classification. The $7.1 million term loan is a variable rate loan for which the rate adjusts quarterly, and as such, its fair value is based on its carrying value resulting in a Level 3 classification.
Because no market exists for a significant portion of the Company’s financial instruments, fair value estimates are based on judgments regarding current economic conditions, risk characteristics of various financial instruments and other factors. Those estimates that are subjective in nature and involve uncertainties and matters of significant judgment and therefore cannot be determined with precision are included in Level 3. Changes in assumptions could significantly affect the fair values presented.
The following table provides quantitative information about the Company’s nonrecurring Level 3 fair value measurements of its REO as of:
| (dollars in thousands) | Valuation Technique | Unobservable Input |
Estimate Used |
Fair Value | ||||||||
| March 31, 2014: |
||||||||||||
| Undeveloped land |
Third Party Appraisal | Selling costs | 9.0 | % | $ | 1,875 | ||||||
|
|
|
|||||||||||
| December 31, 2013: |
||||||||||||
| Undeveloped land |
Third party appraisal | Selling costs | 9.0 | % | $ | 375 | ||||||
|
|
|
|||||||||||
Appraisals are performed by certified general appraisers (for commercial properties) or certified residential appraisers (for residential properties) whose qualifications and licenses have been reviewed and verified by the Company. Once received, a member of the Appraisal Department reviews the assumptions and approaches utilized in the appraisal as well as the overall resulting fair value in comparison with independent data sources such as recent market data or industry-wide statistics. Adjustments are routinely made in the appraisal process by the independent appraisers to adjust for differences between the comparable sales and income data available.
In certain cases we use discounted cash flow or similar internal modeling techniques to determine the fair value of our Level 3 assets and liabilities. Use of these techniques requires determination of relevant inputs and assumptions, some of which represent significant unobservable inputs. Accordingly, changes in these unobservable inputs may have a significant impact on fair value. Certain of these unobservable inputs will (in isolation) have a directionally consistent impact on the fair value of the instrument for a given change in that input. Alternatively, the fair value of the instrument may move in an opposite direction for a given change in another input. Where multiple inputs are used within the valuation technique of an asset or liability, a change in one input in a certain direction may be offset by an opposite change in another input having a potentially muted impact to the overall fair value of that particular instrument. Additionally, a change in one unobservable input may result in a change to another unobservable input (that is, changes in certain inputs are interrelated to one another), which may counteract or magnify the fair value impact.
F-52
Table of Contents
FIRST FOUNDATION INC.
NOTES TO THE CONSOLIDATED FINANCIAL STATEMENTS
For the Quarter Ended March 31, 2014 - UNAUDITED
NOTE 3: SECURITIES
The following table provides a summary of the Company’s securities AFS portfolio as of:
| Amortized Cost |
Gross Unrealized | Estimated Fair Value |
||||||||||||||
| (dollars in thousands) | Gains | Losses | ||||||||||||||
| March 31, 2014: |
||||||||||||||||
| US Treasury securities |
$ | 300 | $ | - | $ | $ | 300 | |||||||||
| FNMA and FHLB Agency notes |
10,496 | - | (528) | 9,968 | ||||||||||||
| Agency mortgage-backed securities |
64,329 | 108 | (1,448) | 62,989 | ||||||||||||
|
|
|
|
|
|
|
|
|
|||||||||
| Total |
$ | 75,125 | $ | 108 | $ | (1,976) | $ | 73,257 | ||||||||
|
|
|
|
|
|
|
|
|
|||||||||
| December 31, 2013: |
||||||||||||||||
| US Treasury securities |
$ | 300 | $ | - | $ | - | $ | 300 | ||||||||
| FNMA and FHLB Agency notes |
10,496 | - | (716) | 9,780 | ||||||||||||
| Agency mortgage-backed securities |
50,983 | - | (1,952) | 49,031 | ||||||||||||
|
|
|
|
|
|
|
|
|
|||||||||
| Total |
$ | 61,779 | $ | - | $ | (2,668) | $ | 59,111 | ||||||||
|
|
|
|
|
|
|
|
|
|||||||||
The US Treasury securities are pledged as collateral to the State of California to meet regulatory requirements related to the Bank’s trust operations.
All unrealized losses had been in a continuous loss position less than 12 months as of March 31, 2014. Unrealized losses on FNMA and FHLB agency notes and agency mortgage-backed securities have not been recognized into income because the issuer bonds are of high credit quality, management does not intend to sell and it is not more likely than not that management would be required to sell the securities prior to their anticipated recovery, and the decline in fair value is largely due to changes in interest rates. The fair value is expected to recover as the bonds approach maturity.
F-53
Table of Contents
FIRST FOUNDATION INC.
NOTES TO THE CONSOLIDATED FINANCIAL STATEMENTS
For the Quarter Ended March 31, 2014 - UNAUDITED
The scheduled maturity of securities AFS and the related weighted average yield is as follows as of March 31, 2014:
| (dollars in thousands) | Less than 1 Year |
1 Through 5 years |
5 Through 10 Years |
After 10 Years |
Total | |||||||||||||||
| Amortized Cost: |
||||||||||||||||||||
| US Treasury securities |
$ | 300 | $ | - | $ | - | $ | - | $ | 300 | ||||||||||
| FNMA and FHLB Agency notes |
- | - | 10,496 | - | 10,496 | |||||||||||||||
|
|
|
|
|
|
|
|
|
|
|
|||||||||||
| Total |
$ | 300 | $ | - | $ | 10,496 | $ | - | $ | 10,796 | ||||||||||
|
|
|
|
|
|
|
|
|
|
|
|||||||||||
| Weighted average yield |
0.21% | 0.00% | 1.78% | 0.00% | 1.74% | |||||||||||||||
|
|
|
|
|
|
|
|
|
|
|
|||||||||||
| Estimated Fair Value: |
||||||||||||||||||||
| US Treasury securities |
$ | 300 | $ | - | $ | - | $ | - | $ | 300 | ||||||||||
| FNMA and FHLB Agency notes |
- | - | 9,968 | - | 9,968 | |||||||||||||||
|
|
|
|
|
|
|
|
|
|
|
|||||||||||
| Total |
$ | 300 | $ | - | $ | 9,968 | $ | - | $ | 10,268 | ||||||||||
|
|
|
|
|
|
|
|
|
|
|
|||||||||||
Agency mortgage backed securities are excluded from the above table because such securities are not due at a single maturity date. The weighted average yield of the agency mortgage backed securities as of March 31, 2014 was 2.57%.
NOTE 4: LOANS
The following is a summary of our loans as of:
| (dollars in thousands) | March 31, 2014 |
December 31, 2013 |
||||||
| Outstanding principal balance: |
||||||||
| Loans secured by real estate: |
||||||||
| Residential properties: |
||||||||
| Multifamily |
$ | 401,877 | $ | 405,984 | ||||
| Single family |
263,922 | 227,096 | ||||||
|
|
|
|
|
|||||
| Total real estate loans secured by residential properties |
665,799 | 633,080 | ||||||
| Commercial properties |
166,290 | 154,982 | ||||||
| Land and construction |
2,345 | 3,794 | ||||||
|
|
|
|
|
|||||
| Total real estate loans |
834,434 | 791,856 | ||||||
| Commercial and industrial loans |
97,248 | 93,255 | ||||||
| Consumer loans |
17,201 | 18,484 | ||||||
|
|
|
|
|
|||||
| Total loans |
948,883 | 903,595 | ||||||
| Premiums, discounts and deferred fees and expenses |
(39) | 50 | ||||||
|
|
|
|
|
|||||
| Total |
$ | 948,844 | $ | 903,645 | ||||
|
|
|
|
|
|||||
As of March 31, 2014 and December 31, 2013, the principal balances shown above are net of unaccreted discount related to loans acquired in an acquisition of $2.1 million and $3.1 million, respectively.
F-54
Table of Contents
FIRST FOUNDATION INC.
NOTES TO THE CONSOLIDATED FINANCIAL STATEMENTS
For the Quarter Ended March 31, 2014 - UNAUDITED
In 2012, the Company purchased loans, for which there was, at acquisition, evidence of deterioration of credit quality since origination and it was probable, at acquisition, that all contractually required payments would not be collected. The carrying amount of these purchased credit impaired loans is as follows as of:
| (dollars in thousands) | March 31, 2014 |
|
December 31, 2012 |
|||||||
| Outstanding principal balance: |
||||||||||
| Loans secured by real estate: |
||||||||||
| Commercial properties |
$ | 5,007 | $ | 5,543 | ||||||
| Land |
- | 2,331 | ||||||||
|
|
|
|
|
|
||||||
| Total real estate loans |
5,007 | 7,874 | ||||||||
| Commercial and industrial loans |
2,467 | 2,489 | ||||||||
| Consumer loans |
257 | 260 | ||||||||
|
|
|
|
|
|
||||||
| Total loans |
7,731 | 10,623 | ||||||||
| Unaccreted discount on purchased credit impaired loans |
(1,921 | ) | (2,945 | ) | ||||||
|
|
|
|
|
|
||||||
| Total |
$ | 5,810 | $ | 7,678 | ||||||
|
|
|
|
|
|
||||||
Accretable yield, or income expected to be collected on purchased credit impaired loans, is as follows as of:
| (dollars in thousands) | March 31, 2014 |
|
December 31, 2012 |
|||||||
| Beginning balance |
$ | 2,349 | $ | 1,531 | ||||||
| Accretion of income |
(200 | ) | (730 | ) | ||||||
| Reclassifications from nonaccretable difference |
- | 1,879 | ||||||||
| Disposals |
- | (331 | ) | |||||||
|
|
|
|
|
|
||||||
| Ending balance |
$ | 2,149 | $ | 2,349 | ||||||
|
|
|
|
|
|
||||||
F-55
Table of Contents
FIRST FOUNDATION INC.
NOTES TO THE CONSOLIDATED FINANCIAL STATEMENTS
For the Quarter Ended March 31, 2014 - UNAUDITED
The following table summarizes our delinquent and nonaccrual loans as of:
| Past Due and Still Accruing | Total Past Due and Nonaccrual |
|||||||||||||||||||||||||||
| (dollars in thousands) | 30–59 Days | 60-89 Days | 90 Days or More |
Nonaccrual | Current | Total | ||||||||||||||||||||||
| March 31, 2014: |
||||||||||||||||||||||||||||
| Real estate loans: |
||||||||||||||||||||||||||||
| Residential properties |
$ | - | $ | - | $ | - | $ | 3,057 | $ | 3,057 | $ | 662,742 | $ | 665,799 | ||||||||||||||
| Commercial properties |
338 | - | - | 598 | 936 | 165,354 | 166,290 | |||||||||||||||||||||
| Land and construction |
- | - | - | - | - | 2,345 | 2,345 | |||||||||||||||||||||
| Commercial and industrial loans |
959 | - | 2,950 | 344 | 4,253 | 92,995 | 97,248 | |||||||||||||||||||||
| Consumer loans |
- | - | - | 130 | 130 | 17,071 | 17,201 | |||||||||||||||||||||
|
|
|
|
|
|
|
|
|
|
|
|
|
|
|
|||||||||||||||
| Total |
$ | 1,297 | $ | - | $ | 2,950 | $ | 4,129 | $ | 8,376 | $ | 940,507 | $ | 948,883 | ||||||||||||||
|
|
|
|
|
|
|
|
|
|
|
|
|
|
|
|||||||||||||||
| Percentage of total loans |
0.14% | 0.00% | 0.31% | 0.44% | 0.88% | |||||||||||||||||||||||
| December 31, 2013: |
||||||||||||||||||||||||||||
| Real estate loans: |
||||||||||||||||||||||||||||
| Residential properties |
$ | - | $ | - | $ | - | $ | 1,820 | $ | 1,820 | $ | 631,260 | $ | 633,080 | ||||||||||||||
| Commercial properties |
- | - | 417 | 598 | 1,015 | 153,967 | 154,982 | |||||||||||||||||||||
| Land and construction |
- | - | 1,480 | - | 1,480 | 2,314 | 3,794 | |||||||||||||||||||||
| Commercial and industrial loans |
- | 2,744 | 1,315 | 344 | 4,403 | 88,852 | 93,255 | |||||||||||||||||||||
| Consumer loans |
- | - | - | 132 | 132 | 18,352 | 18,484 | |||||||||||||||||||||
|
|
|
|
|
|
|
|
|
|
|
|
|
|
|
|||||||||||||||
| Total |
$ | - | $ | 2,744 | $ | 3,212 | $ | 2,894 | $ | 8,850 | $ | 894,745 | $ | 903,595 | ||||||||||||||
|
|
|
|
|
|
|
|
|
|
|
|
|
|
|
|||||||||||||||
| Percentage of total loans |
0.00% | 0.30% | 0.36% | 0.32% | 0.98% | |||||||||||||||||||||||
Accrual of interest on loans is discontinued when reasonable doubt exists as to the full, timely collection of interest or principal and, generally, when a loan becomes contractually past due for ninety days or more with respect to principal or interest. The accrual of interest may be continued on a well-secured loan contractually past due ninety days or more with respect to principal or interest if the loan is in the process of collection or collection of the principal and interest is deemed probable. The Bank considers a loan to be impaired when, based upon current information and events, it believes it is probable that the Bank will be unable to collect all amounts due according to the contractual terms of the loan agreement. The determination of past due, nonaccrual or impairment status of loans acquired in an acquisition, other than loans deemed purchased impaired, is the same as loans we originate.
As of March 31, 2014 and December 31, 2013, the Company had one loan with a balance of $0.1 million classified as a troubled debt restructurings (“TDR”) which is included as nonaccrual in the table above. This loan was classified as a TDR as a result of a reduction in required principal payments and an extension of the maturity date of the loan.
F-56
Table of Contents
FIRST FOUNDATION INC.
NOTES TO THE CONSOLIDATED FINANCIAL STATEMENTS
For the Quarter Ended March 31, 2014 - UNAUDITED
NOTE 5: ALLOWANCE FOR LOAN LOSSES
The following is a rollforward of the Bank’s allowance for loan losses for the quarters ended March 31:
| (dollars in thousands) | Beginning Balance |
Provision for Loan Losses |
Charge-offs | Recoveries | Ending Balance |
|||||||||||||||
| 2014: |
||||||||||||||||||||
| Real estate loans: |
||||||||||||||||||||
| Residential properties |
$ | 6,157 | $ | 98 | $ | - | $ | - | $ | 6,255 | ||||||||||
| Commercial properties |
1,440 | 153 | - | - | 1,593 | |||||||||||||||
| Commercial and industrial loans |
2,149 | 8 | - | - | 2,157 | |||||||||||||||
| Consumer loans |
169 | (24) | - | - | 145 | |||||||||||||||
|
|
|
|
|
|
|
|
|
|
|
|||||||||||
| Total |
$ | 9,915 | $ | 235 | $ | - | $ | - | $ | 10,150 | ||||||||||
|
|
|
|
|
|
|
|
|
|
|
|||||||||||
| 2013: |
||||||||||||||||||||
| Real estate loans: |
||||||||||||||||||||
| Residential properties |
$ | 4,355 | $ | 507 | $ | - | $ | - | $ | 4,862 | ||||||||||
| Commercial properties |
936 | (109) | - | - | 827 | |||||||||||||||
| Commercial and industrial loans |
2,841 | 311 | (752 | ) | - | 2,400 | ||||||||||||||
| Consumer loans |
208 | (87) | - | - | 121 | |||||||||||||||
|
|
|
|
|
|
|
|
|
|
|
|||||||||||
| Total |
$ | 8,340 | $ | 622 | $ | (752 | ) | $ | - | $ | 8,210 | |||||||||
|
|
|
|
|
|
|
|
|
|
|
|||||||||||
F-57
Table of Contents
FIRST FOUNDATION INC.
NOTES TO THE CONSOLIDATED FINANCIAL STATEMENTS
For the Quarter Ended March 31, 2014 - UNAUDITED
The following table presents the balance in the allowance for loan losses and the recorded investment in loans by impairment method as of:
| (dollars in thousands) | Allowance for Loan Losses | Unaccreted Credit Component Other Loans |
||||||||||||||||||
| Evaluated for Impairment | Purchased Impaired |
Total | ||||||||||||||||||
| Individually | Collectively | |||||||||||||||||||
| March 31, 2014: |
||||||||||||||||||||
| Allowance for loan losses: |
||||||||||||||||||||
| Real estate loans: |
||||||||||||||||||||
| Residential properties |
$ | - | $ | 6,255 | $ | - | $ | 6,255 | $ | 34 | ||||||||||
| Commercial properties |
190 | 1,403 | - | 1,593 | 269 | |||||||||||||||
| Land and construction |
- | - | - | - | 14 | |||||||||||||||
| Commercial and industrial loans |
895 | 1,262 | - | 2,157 | 117 | |||||||||||||||
| Consumer loans |
- | 145 | - | 145 | 11 | |||||||||||||||
|
|
|
|
|
|
|
|
|
|
|
|||||||||||
| Total |
$ | 1,085 | $ | 9,065 | $ | - | $ | 10,150 | $ | 445 | ||||||||||
|
|
|
|
|
|
|
|
|
|
|
|||||||||||
| Loans: |
||||||||||||||||||||
| Real estate loans: |
||||||||||||||||||||
| Residential properties |
$ | 3,484 | $ | 662,315 | $ | - | $ | 665,799 | $ | 3,428 | ||||||||||
| Commercial properties |
817 | 161,738 | 3,735 | 166,290 | 23,775 | |||||||||||||||
| Land and construction |
- | 2,345 | - | 2,345 | 1,784 | |||||||||||||||
| Commercial and industrial loans |
2,968 | 92,248 | 2,032 | 97,248 | 10,505 | |||||||||||||||
| Consumer loans |
- | 17,158 | 43 | 17,201 | 153 | |||||||||||||||
|
|
|
|
|
|
|
|
|
|
|
|||||||||||
| Total |
$ | 7,269 | $ | 935,804 | $ | 5,810 | $ | 948,883 | $ | 39,645 | ||||||||||
|
|
|
|
|
|
|
|
|
|
|
|||||||||||
| December 31, 2013: |
||||||||||||||||||||
| Allowance for loan losses: |
||||||||||||||||||||
| Real estate loans: |
||||||||||||||||||||
| Residential properties |
$ | - | $ | 6,157 | $ | - | $ | 6,157 | $ | 36 | ||||||||||
| Commercial properties |
190 | 1,250 | - | 1,440 | 290 | |||||||||||||||
| Land and construction |
- | - | - | - | 26 | |||||||||||||||
| Commercial and industrial loans |
925 | 1,224 | - | 2,149 | 126 | |||||||||||||||
| Consumer loans |
- | 169 | - | 169 | 11 | |||||||||||||||
|
|
|
|
|
|
|
|
|
|
|
|||||||||||
| Total |
$ | 1,115 | $ | 8,800 | $ | - | $ | 9,915 | $ | 489 | ||||||||||
|
|
|
|
|
|
|
|
|
|
|
|||||||||||
| Loans: |
||||||||||||||||||||
| Real estate loans: |
||||||||||||||||||||
| Residential properties |
$ | 2,248 | $ | 630,832 | $ | - | $ | 633,080 | $ | 3,449 | ||||||||||
| Commercial properties |
821 | 150,053 | 4,108 | 154,982 | 23,968 | |||||||||||||||
| Land and construction |
- | 2,314 | 1,480 | 3,794 | 1,939 | |||||||||||||||
| Commercial and industrial loans |
2,999 | 88,209 | 2,047 | 93,255 | 10,354 | |||||||||||||||
| Consumer loans |
- | 18,441 | 43 | 18,484 | 160 | |||||||||||||||
|
|
|
|
|
|
|
|
|
|
|
|||||||||||
| Total |
$ | 6,068 | $ | 889,849 | $ | 7,678 | $ | 903,595 | $ | 39,870 | ||||||||||
|
|
|
|
|
|
|
|
|
|
|
|||||||||||
The column labeled “Unaccreted Credit Component Other Loans” represents the amount of unaccreted credit component discount for loans acquired in the Merger that were not classified as purchased impaired or individually evaluated for impairment as of the dates indicated, and the stated principal balance of the related loans. The unaccreted credit component discount is equal to 1.12% and 1.23% of the stated principal balance of these loans as of March 31, 2014 and December 31, 2013, respectively. In addition to this unaccreted credit component discount, an additional $0.2 million of the ALLL has been provided for these loans as of March 31, 2014.
F-58
Table of Contents
FIRST FOUNDATION INC.
NOTES TO THE CONSOLIDATED FINANCIAL STATEMENTS
For the Quarter Ended March 31, 2014 - UNAUDITED
The Bank categorizes loans into risk categories based on relevant information about the ability of borrowers to service their debt such as current financial information, historical payment experience, collateral adequacy, credit documentation, and current economic trends, among other factors. The Bank analyzes loans individually by classifying the loans as to credit risk. This analysis typically includes larger, non-homogeneous loans such as loans secured by multifamily or commercial real estate and commercial and industrial loans. This analysis is performed on an ongoing basis as new information is obtained. The Bank uses the following definitions for risk ratings:
Pass: Loans classified as pass are strong credits with no existing or known potential weaknesses deserving of management’s close attention.
Special Mention: Loans classified as special mention have a potential weakness that deserves management’s close attention. If left uncorrected, these potential weaknesses may result in deterioration of the repayment prospects for the loan or of the institution’s credit position at some future date.
Substandard: Loans classified as substandard are inadequately protected by the current net worth and paying capacity of the obligor or of the collateral pledged, if any. Loans so classified have a well-defined weakness or weaknesses that jeopardize the liquidation of the debt. They are characterized by the distinct possibility that the institution will sustain some loss if the deficiencies are not corrected.
Impaired: A loan is considered impaired, when, based on current information and events, it is probable that the Bank will be unable to collect all amounts due according to the contractual terms of the loan agreement.
Additionally, all loans classified as troubled debt restructurings (“TDRs”) are considered impaired. Purchased credit impaired loans are not considered impaired loans for these purposes.
Loans listed as pass include larger non-homogeneous loans not meeting the risk rating definitions above and smaller, homogeneous loans not assessed on an individual basis.
F-59
Table of Contents
FIRST FOUNDATION INC.
NOTES TO THE CONSOLIDATED FINANCIAL STATEMENTS
For the Quarter Ended March 31, 2014 - UNAUDITED
Based on the most recent analysis performed, the risk category of loans by class of loans is as follows as of:
| (dollars in thousands) | Pass | Special Mention |
Substandard | Impaired | Total | |||||||||||||||
| March 31, 2014: |
||||||||||||||||||||
| Real estate loans: |
||||||||||||||||||||
| Residential properties |
$ | 662,315 | $ | - | $ | - | $ | 3,484 | $ | 665,799 | ||||||||||
| Commercial properties |
161,739 | - | 3,734 | 817 | 166,290 | |||||||||||||||
| Land and construction |
2,345 | - | - | - | 2,345 | |||||||||||||||
| Commercial and industrial loans |
92,213 | 35 | 2,032 | 2,968 | 97,248 | |||||||||||||||
| Consumer loans |
17,028 | - | 173 | - | 17,201 | |||||||||||||||
|
|
|
|
|
|
|
|
|
|
|
|||||||||||
| Total |
$ | 935,640 | $ | 35 | $ | 5,939 | $ | 7,269 | $ | 948,883 | ||||||||||
|
|
|
|
|
|
|
|
|
|
|
|||||||||||
| December 31, 2013: |
||||||||||||||||||||
| Real estate loans: |
||||||||||||||||||||
| Residential properties |
$ | 630,832 | $ | - | $ | - | $ | 2,248 | $ | 633,080 | ||||||||||
| Commercial properties |
150,053 | - | 4,108 | 821 | 154,982 | |||||||||||||||
| Land and construction |
2,314 | - | 1,480 | - | 3,794 | |||||||||||||||
| Commercial and industrial loans |
88,166 | 43 | 2,047 | 2,999 | 93,255 | |||||||||||||||
| Consumer loans |
18,309 | - | 175 | - | 18,484 | |||||||||||||||
|
|
|
|
|
|
|
|
|
|
|
|||||||||||
| Total |
$ | 889,674 | $ | 43 | $ | 7,810 | $ | 6,068 | $ | 903,595 | ||||||||||
|
|
|
|
|
|
|
|
|
|
|
|||||||||||
Impaired loans evaluated individually and any related allowance is as follows as of :
| With No Allowance Recorded |
With an Allowance Recorded | |||||||||||||||||||
| (dollars in thousands) | Unpaid Principal Balance |
Recorded Investment |
Unpaid Principal Balance |
Recorded Investment |
Related Allowance |
|||||||||||||||
| March 31, 2014: |
||||||||||||||||||||
| Real estate loans: |
||||||||||||||||||||
| Residential properties |
$ | 3,485 | $ | 3,485 | $ | - | $ | - | $ | - | ||||||||||
| Commercial properties |
219 | 219 | 598 | 598 | 190 | |||||||||||||||
| Land and construction |
- | - | - | - | - | |||||||||||||||
| Commercial and industrial loans |
- | - | 2,999 | 2,999 | 895 | |||||||||||||||
| Consumer loans |
- | - | - | - | - | |||||||||||||||
|
|
|
|
|
|
|
|
|
|
|
|||||||||||
| Total |
$ | 3,704 | $ | 3,704 | $ | 3,597 | $ | 3,597 | $ | 1,085 | ||||||||||
|
|
|
|
|
|
|
|
|
|
|
|||||||||||
| December 31, 2013: |
||||||||||||||||||||
| Real estate loans: |
||||||||||||||||||||
| Residential properties |
$ | 2,248 | $ | 2,248 | $ | - | $ | - | $ | - | ||||||||||
| Commercial properties |
223 | 223 | 598 | 598 | 190 | |||||||||||||||
| Land and construction |
- | - | - | - | - | |||||||||||||||
| Commercial and industrial loans |
- | - | 2,999 | 2,999 | 925 | |||||||||||||||
| Consumer loans |
- | - | - | - | - | |||||||||||||||
|
|
|
|
|
|
|
|
|
|
|
|||||||||||
| Total |
$ | 2,471 | $ | 2,471 | $ | 3,597 | $ | 3,597 | $ | 1,115 | ||||||||||
|
|
|
|
|
|
|
|
|
|
|
|||||||||||
F-60
Table of Contents
FIRST FOUNDATION INC.
NOTES TO THE CONSOLIDATED FINANCIAL STATEMENTS
For the Quarter Ended March 31, 2014 - UNAUDITED
The weighted average annualized average balance of the recorded investment for impaired loans, beginning from when the loan became impaired, and any interest income recorded on impaired loans after they became impaired is as follows for the:
| Quarter Ending March 31, 2014 |
Year Ending December 31, 2013 |
|||||||||||||||
| (dollars in thousands) | Average Recorded Investment |
Interest Income after Impairment |
Average Recorded Investment |
Interest Income after Impairment |
||||||||||||
| Real estate loans: |
||||||||||||||||
| Residential properties |
$ | 2,660 | $ | 8 | $ | 2,250 | $ | 32 | ||||||||
| Commercial properties |
819 | 5 | 323 | 22 | ||||||||||||
| Land and construction |
- | - | - | - | ||||||||||||
| Commercial and industrial loans |
3,009 | 40 | 2,69 | 168 | ||||||||||||
| Consumer loans |
- | - | - | - | ||||||||||||
|
|
|
|
|
|
|
|
|
|||||||||
| Total |
$ | 6,488 | $ | 53 | $ | 5,263 | $ | 222 | ||||||||
|
|
|
|
|
|
|
|
|
|||||||||
There was no interest income recognized on a cash basis in either 2014 or 2013 on impaired loans.
NOTE 6: DEPOSITS
The following table summarizes the outstanding balance of deposits and average rates paid thereon as of:
| March 31, 2014 | December 31, 2013 | |||||||||||||||
| (dollars in thousands) | Amount | Weighted Average Rate |
Amount | Weighted Average Rate |
||||||||||||
| Demand deposits: |
||||||||||||||||
| Noninterest-bearing |
$ | 225,473 | - | $ | 217,782 | - | ||||||||||
| Interest-bearing |
228,587 | 0.497% | 217,129 | 0.504% | ||||||||||||
| Money market and savings |
125,872 | 0.496% | 121,260 | 0.499% | ||||||||||||
| Certificates of deposits |
274,752 | 0.557% | 245,866 | 0.606% | ||||||||||||
|
|
|
|
|
|||||||||||||
| Total |
$ | 854,684 | 0.385% | $ | 802,037 | 0.398% | ||||||||||
|
|
|
|
|
|||||||||||||
At March 31, 2014, of the $258.9 million of certificates of deposits of $100,000 or more, $233.2 million mature within one year and $25.7 million mature after one year. Of the $15.9 million of certificates of deposit of less than $100,000, $13.7 million mature within one year and $2.2 million mature after one year. At December 31, 2013, of the $229.9 million of certificates of deposits of $100,000 or more, $207.7 million mature within one year and $22.2 million mature after one year. Of the $15.9 million of certificates of deposit of less than $100,000, $13.6 million mature within one year and $2.3 million mature after one year.
F-61
Table of Contents
FIRST FOUNDATION INC.
NOTES TO THE CONSOLIDATED FINANCIAL STATEMENTS
For the Quarter Ended March 31, 2014 - UNAUDITED
NOTE 7: BORROWINGS
At March 31, 2014, our borrowings consisted of $119.0 million of overnight FHLB advances and a $21.9 million note payable by FFI. At December 31, 2013, our borrowings consisted of $134.0 million of overnight FHLB advances and a $7.1 million note payable by FFI. The FHLB advances were paid in full in the early part of April 2014 and January 2014, respectively, and bore interest rates of 0.11% and 0.06%, respectively. Because the Bank utilizes overnight borrowings, the balance of outstanding borrowings fluctuates on a daily basis.
In the second quarter of 2013, FFI entered into a loan agreement to borrow $7.5 million for a term of five years. This note bears interest at a rate of ninety day Libor plus 4.0% per annum. In the first quarter of 2014, FFI entered into an amendment to this loan agreement pursuant to which we obtained an additional $15,000,000 of borrowings. As a result, as of March 31, 2014, the outstanding principal amount of the loan was $21,875,000. The First Amendment did not alter any of the terms of the Loan Agreement or the loan, other than the $15,000,000 increase in the principal amount of the loan and a corresponding increase in the amount of the monthly installments of principal and interest payable on the Loan. The amended loan agreement requires us to make monthly payments of principal of $0.2 million plus interest, with a final payment of the unpaid principal balance, in the amount of approximately $12.1 million, plus accrued but unpaid interest, at the maturity date of the loan in May 2018. We have the right, in our discretion, to prepay the loan at any time in whole or, from time to time, in part, without any penalties or premium. We are required to meet certain financial covenants during the term of the loan. As security for our repayment of the loan, we pledged all of the common stock of FFB to the lender.
NOTE 8: EARNINGS PER SHARE
Basic earnings per share excludes dilution and is computed by dividing net income or loss available to common stockholders by the weighted average number of common shares outstanding for the period. Diluted earnings per share reflects the potential dilution that could occur if contracts to issue common stock were exercised or converted into common stock that would then share in earnings. The following table sets forth the Company’s unaudited earnings per share calculations for the quarters ended March 31:
| 2014 | 2013 | |||||||||||||||
| (dollars in thousands, except per share amounts) |
Basic | Diluted | Basic | Diluted | ||||||||||||
| Net income |
$ 1,462 | $ 1,462 | $ 1,058 | $ 1,058 | ||||||||||||
|
|
|
|
|
|
|
|
|
|||||||||
| Basic common shares outstanding |
7,733,514 | 7,733,514 | 7,376,988 | 7,376,988 | ||||||||||||
|
|
|
|
|
|||||||||||||
| Effect of options and restricted stock |
360,263 | 236,246 | ||||||||||||||
|
|
|
|
|
|||||||||||||
| Diluted common shares outstanding |
8,093,777 | 7,613,234 | ||||||||||||||
|
|
|
|
|
|||||||||||||
| Earnings per share |
$ 0.19 | $ 0.18 | $ 0.14 | $ 0.14 | ||||||||||||
|
|
|
|
|
|
|
|
|
|||||||||
Based on a weighted average basis, options to purchase 66,125 and 627,857 shares of common stock were excluded for the quarters ended March 31, 2014 and 2013, respectively, because their effect would have been anti-dilutive.
F-62
Table of Contents
2,222,222 Shares

Common Stock
PROSPECTUS
[ ], 2014
| Sandler O’Neill + Partners, L.P. |
Keefe, Bruyette & Woods A Stifel Company | |||
| Sterne Agee | ||||
Until [ ], 2014 (25 days after the date of this prospectus), all dealers that effect transactions in our securities, whether or not participating in this offering, may be required to deliver a prospectus. This is in addition to the dealers’ obligations to deliver a prospectus when acting as underwriters and with respect to their unsold allotments or subscriptions.
Table of Contents
PART II
INFORMATION NOT REQUIRED IN PROSPECTUS
| Item 13. | Other Expenses of Issuance and Distribution. |
The following table sets forth an itemization of the various costs and expenses, other than the underwriting discount, payable by us in connection with the issuance and distribution of the securities being registered hereunder. All of the amounts shown are estimated except the SEC registration fee, the NASDAQ Global Market listing fee and the FINRA filing fee.
| SEC registration fee |
$ | 7,471 | ||
| NASDAQ Global Market listing fee |
125,000 | |||
| FINRA filing fee |
8,000 | |||
| Accounting fees and expenses |
30,000 | |||
| Printing and engraving expenses |
80,000 | |||
| Legal fees and expenses |
400,000 | |||
| Transfer Agent and Registrar fees |
2,500 | |||
| Miscellaneous expenses |
10,000 | |||
|
|
|
|||
| Total |
$ | 662,971 | ||
|
|
|
| Item 14. | Indemnification of Directors and Officers. |
We are incorporated under the laws of the State of California. Section 317 of the California General Corporation Law provides that a California corporation may indemnify any persons who are, or are threatened to be made, parties to any threatened, pending or completed action, suit or proceeding, whether civil, criminal, administrative or investigative (other than an action by or in the right of such corporation), by reason of the fact that such person was an officer, director, employee or agent of such corporation, or is or was serving at the request of such corporation as an officer, director, employee or agent of another corporation or enterprise. The indemnity may include expenses (including attorneys’ fees), judgments, fines and amounts paid in settlement actually and reasonably incurred by such person in connection with such action, suit or proceeding, provided that such person acted in good faith and in a manner he or she reasonably believed to be in or not opposed to the corporation’s best interests and, with respect to any criminal action or proceeding, had no reasonable cause to believe that his or her conduct was illegal. Section 317 of the California General Corporation Law further authorizes a corporation to purchase and maintain insurance on behalf of any indemnified person against any liability asserted against and incurred by such person in any indemnified capacity, or arising out of such person’s status as such, regardless of whether the corporation would otherwise have the power to indemnify such person under the California General Corporation Law.
Section 204(a)(10) of the California General Corporation Law permits a corporation to provide in its articles of incorporation that a director of the corporation shall not be personally liable to the corporation or its shareholders for monetary damages for breach of fiduciary duties as a director, except for liability for any:
| • | breach of a director’s duty of loyalty to the corporation or its shareholders; |
| • | act or omission not in good faith or that involves intentional misconduct or a knowing violation of law; |
| • | unlawful payment of dividends or redemption of shares; or |
| • | transaction from which the director derives an improper personal benefit. |
Table of Contents
Our articles of incorporation authorize us to, and our bylaws provide that we must, indemnify our directors and officers to the fullest extent authorized by the California General Corporation Law and also pay expenses incurred in defending any such proceeding in advance of its final disposition upon delivery of an undertaking, by or on behalf of an indemnified person, to repay all amounts so advanced if it should be determined ultimately that such person is not entitled to be indemnified under this section or otherwise.
As permitted by the California General Corporation Law, we have entered into indemnification agreements with each of our directors and certain of our officers. These agreements require us to indemnify these individuals to the fullest extent permitted under California law against liabilities that may arise by reason of their service to us, and to advance expenses incurred as a result of any proceeding against them as to which they could be indemnified.
We have an insurance policy covering our officers and directors with respect to certain liabilities, including liabilities arising under the Securities Act and otherwise.
The underwriting agreement to be filed as Exhibit 1.1 to this registration statement provides for indemnification by the underwriters of the Company and our officers and directors for certain liabilities arising under the Securities Act and otherwise.
| Item 15. | Recent Sales of Unregistered Securities. |
Since January 1, 2011, we have issued the following securities in transactions that were not registered under the Securities Act:
| (a) | Sales of Common Stock: |
| • | Between August 1, 2012 and March 31, 2013, we sold and issued an aggregate of 413,172 shares of our common stock to a total of 45 accredited investors at a price of $15.00 per share, generating gross proceeds to us of $6.2 million. |
| • | In December 2013, we sold and issued an aggregate of 318,987 shares of our common stock to a total of 32 accredited investors at a price of $18.00 per share, generating gross proceeds to us of $5.7 million. |
The sales of these shares were made in reliance on the exemptions from registration under Section 4(2) of, and Regulation D and Rule 506 promulgated under, the Securities Act. No underwriters were used in connection with any of the foregoing transactions and the sales were made solely to accredited investors exclusively by officers of FFI, for which they did not receive any compensation (other than reimbursement for out-of-pocket expenses in accordance with FFI’s expense reimbursement policies), and no general advertising or solicitations were employed in connection with the offer or sale of the shares. The purchasers of these shares represented their intention to acquire the shares for investment only, and not with a view to offer or sell any such shares in connection with any distribution of the shares, and appropriate restrictive legends were set forth in the stock purchase agreements entered into by the investors, and on the share certificates issued, in such transactions.
| (b) | Grants of Stock Options and Restricted Stock: |
| • | During 2011, we granted options to purchase up to 317,500 shares of our common stock at an exercise price of $15.00 per share, and up to 40,000 shares of our common stock at an exercise price of $16.50 per share, and we granted 18,000 shares of restricted stock. |
| • | During 2012, we granted options to purchase up to 70,000 shares of our common stock at an exercise price of $15.00 per share. |
| • | During 2013, we granted options to purchase up to 21,000 shares of our common stock at an exercise price of $15.00 per share, and up to 5,000 shares of our common stock at an exercise price of $18.00 per share and we granted 6,666 shares of restricted stock. |
II-2
Table of Contents
The issuance of shares on exercise of options and the issuances of restricted shares were deemed to be exempt from registration under the Securities Act in reliance on either Section 4(2) of the Securities Act, including in some cases, Regulation D and Rule 506 promulgated thereunder, or Rule 701 promulgated under Section 3(b) of the Securities Act, as transactions by an issuer not involving a public offering or transactions pursuant to compensatory benefit plans and contracts relating to compensation as provided under Rule 701. The purchasers of securities in each such transaction represented their intention to acquire the shares for investment only and not with a view to offer or sell any such shares in connection with any distribution of the securities, and appropriate legends were affixed to the share certificates and instruments issued in such transactions.
| (c) | Issuance of Shares in the DCB Acquisition: |
| • | On August 15, 2012, we completed the acquisition of Desert Commercial Bank (“DCB”), in which we issued a total of 815,447 shares of our common stock, valued at $15.00 per share, to the former DCB shareholders in exchange for their shares of DCB common stock. |
The terms of the DCB Acquisition, including the terms of the issuance of our shares in the DCB Acquisition, were determined to be fair by the California Commissioner of Corporations following a fairness hearing held before the Commissioner pursuant to Section 25142 of the California Corporate Securities Law of 1968, as amended, and, therefore, the shares issued in the DCB Acquisition constitute “exempt securities” under Section 3(a)(10) of the Securities Act. In the case of shares that we issued in the DCB Acquisition to affiliates of DCB, those affiliates entered into agreements with us to comply with Rule 145 under the Securities Act in connection with any sales they might make of those shares and appropriate legends to that effect were affixed to the stock certificates evidencing those shares.
| Item 16. | Exhibits and Financial Statement Schedules. |
| (a) | Exhibits |
See the Exhibit Index on the page immediately preceding the exhibits for a list of exhibits filed as part of this registration statement, which Exhibit Index is incorporated herein by reference.
| (b) | Financial Statement Schedules |
No financial statement schedules are provided because the information called for is not required or is shown either in the financial statements or the notes thereto.
| Item 17. | Undertakings. |
The undersigned registrant hereby undertakes to provide to the underwriter at the closing specified in the underwriting agreement, certificates in such denominations and registered in such names as required by the underwriter to permit prompt delivery to each purchaser.
Insofar as indemnification for liabilities arising under the Securities Act may be permitted to directors, officers and controlling persons of the registrant pursuant to the indemnification provisions described herein, or otherwise, the registrant has been advised that in the opinion of the SEC such indemnification is against public policy as expressed in the Securities Act and is, therefore, unenforceable. In the event that a claim for indemnification against such liabilities (other than the payment by the registrant of expenses incurred or paid by a director, officer or controlling person of the registrant in the successful defense of any action, suit or proceeding) is asserted by such director, officer or controlling person in connection with the securities being registered, the registrant will, unless in the opinion of its counsel the matter has been settled by controlling precedent, submit to a court of appropriate jurisdiction the question whether such indemnification by it is against public policy as expressed in the Securities Act and will be governed by the final adjudication of such issue.
II-3
Table of Contents
The undersigned registrant hereby undertakes that:
(1) For purposes of determining any liability under the Securities Act, the information omitted from the form of prospectus as filed as part of this registration statement in reliance upon Rule 430A and contained in a form of prospectus filed by the registrant pursuant to Rule 424(b)(1) or (4) or 497(h) under the Securities Act shall be deemed to be part of this registration statement as of the time it was declared effective.
(2) For the purpose of determining any liability under the Securities Act, each post-effective amendment that contains a form of prospectus shall be deemed to be a new registration statement relating to the securities offered therein, and the offering of such securities at that time shall be deemed to be the initial bona fide offering thereof.
II-4
Table of Contents
SIGNATURES
Pursuant to the requirements of the Securities Act of 1933, the Registrant has duly caused this registration statement to be signed on its behalf by the undersigned, thereunto duly authorized, in Irvine, California on May 9, 2014.
| First Foundation Inc. | ||
| By: | /S/ SCOTT KAVANAUGH | |
| Scott F. Kavanaugh Chief Executive Officer | ||
Pursuant to the requirements of the Securities Act of 1933, this registration statement has been signed by the following persons in the capacities and on the dates indicated.
| SIGNATURE |
TITLE |
DATE | ||
| /S/ SCOTT KAVANAUGH Scott F. Kavanaugh |
Chief Executive Officer and Director (Principal Executive Officer) | May 9, 2014 | ||
| /S/ JOHN MICHEL John Michel |
Chief Financial Officer (Principal Financial and Accounting Officer) | May 9, 2014 | ||
| * Ulrich E. Keller, Jr. |
Chairman and Director | |||
| * James Brakke |
Director | |||
| * Max Briggs |
Director | |||
| * Victoria Collins |
Director | |||
| * Warren D. Fix |
Director | |||
| * John Hakopian |
Director | |||
| * Gerald L. Larsen |
Director | |||
II-5
Table of Contents
| * Mitchell M. Rosenberg |
Director | |||
| * Jacob Sonenshine |
Director | |||
| * | Pursuant to the power of attorney previously filed as Exhibit 24.1 to the registrant’s Registration Statement on Form S-1 filed on April 18, 2014 |
| *By: /S/ JOHN MICHEL John Michel, Attorney in Fact |
May 9, 2014 | |||
II-6
Table of Contents
INDEX OF EXHIBITS
| Exhibit No. | Description | |
| 1.1* | Form of Underwriting Agreement. | |
| 3.1 | Articles of Incorporation of First Foundation Inc., as amended, as filed with the Secretary of State of California and as currently in effect. (Incorporated by reference to the same numbered Exhibit to the Company’s Registration Statement on Form 10 filed with the Commission on October 17, 2013) | |
| 3.2 | Amended and Restated Bylaws of First Foundation Inc., as currently in effect. (Incorporated by reference to the same numbered Exhibit to the Company’s Registration Statement on Form 10 filed with the Commission on October 17, 2013) | |
| 4.1 | Specimen Certificate for Common Stock. (Incorporated by reference to the same numbered Exhibit to the Company’s Registration Statement on Form 10 filed with the Commission on October 17, 2013) | |
| 5.1 | Opinion of Stradling Yocca Carlson & Rauth, P.C. | |
| 10.1 # | First Foundation Inc. 2007 Equity Incentive Plan. (Incorporated by reference to the same numbered Exhibit to the Company’s Registration Statement on Form 10 filed with the Commission on October 17, 2013) | |
| 10.2 # | First Foundation Inc. 2007 Management Stock Incentive Plan. (Incorporated by reference to the same numbered Exhibit to the Company’s Registration Statement on Form 10 filed with the Commission on October 17, 2013) | |
| 10.3 | Form of Director and Officer Indemnification Agreement. (Incorporated by reference to the same numbered Exhibit to the Company’s Registration Statement on Form 10 filed with the Commission on October 17, 2013) | |
| 10.4 # | Amended and Restated Employment Agreement, dated December 31, 2009, by and between First Foundation Inc., First Foundation Advisors and Ulrich E. Keller, Jr., together with First and Second Amendments thereto. (Incorporated by reference to the same numbered Exhibit to the Company’s Registration Statement on Form 10 filed with the Commission on October 17, 2013) | |
| 10.5 # | Amended and Restated Employment Agreement, dated December 31, 2009, by and between First Foundation Inc., First Foundation Bank and Scott F. Kavanaugh, together with First and Second Amendments thereto. (Incorporated by reference to the same numbered Exhibit to the Company’s Registration Statement on Form 10 filed with the Commission on October 17, 2013) | |
| 10.6 # | Amended and Restated Employment Agreement, dated December 31, 2009, by and between First Foundation Advisors and John Hakopian, together with First and Second Amendments thereto. (Incorporated by reference to the same numbered Exhibit to the Company’s Registration Statement on Form 10 filed with the Commission on October 17, 2013) | |
| 10.7 # | Change of Control Agreement, dated September 17, 2007, by and between First Foundation Inc. and Ulrich E. Keller, Jr. (Incorporated by reference to the same numbered Exhibit to the Company’s Registration Statement on Form 10 filed with the Commission on October 17, 2013) | |
| 10.8 # | Change of Control Agreement, dated September 17, 2007, by and between First Foundation Inc. and Scott F. Kavanaugh. (Incorporated by reference to the same numbered Exhibit to the Company’s Registration Statement on Form 10 filed with the Commission on October 17, 2013) | |
| 10.9 # | Change of Control Agreement, dated September 17, 2007, by and between First Foundation Inc. and John Hakopian. (Incorporated by reference to the same numbered Exhibit to the Company’s Registration Statement on Form 10 filed with the Commission on October 17, 2013) | |
| 10.10 | Agreement and Plan of Merger, as amended, by and among First Foundation Inc., First Foundation Bank and Desert Commercial Bank, dated June 29, 2011, together with First, Second and Third Amendments thereto. (Incorporated by reference to the same numbered Exhibit to the Company’s Registration Statement on Form 10 filed with the Commission on October 17, 2013) |
II-7
Table of Contents
| 10.11 | Earn-Out Agreement, dated August 15, 2012, entered into pursuant to the Agreement and Plan of Merger with Desert Commercial Bank, by and between First Foundation Inc. and Desert Commercial Bank. (Incorporated by reference to the same numbered Exhibit to the Company’s Registration Statement on Form 10 filed with the Commission on October 17, 2013) | |
| 10.12 |
Loan Agreement, dated April 19, 2013, by and between First Foundation Bank, as borrower, and NexBank SSB, as lender, together with First Foundation Inc.’s Promissory Note and a Security Agreement entered into by First Foundation Inc. pursuant to the Loan Agreement. (Incorporated by reference to the same numbered Exhibit to the Company’s Registration Statement on Form 10 filed with the Commission on October 17, 2013) | |
| 10.13# | Amended and Restated Employment Agreement, dated December 31, 2009, by and between First Foundation Bank and Dave Rahn, together with First and Second Amendments thereto. (Incorporated by reference to the same numbered Exhibit to the Company’s 2013 Annual Report on Form 10-K filed with the Commission on March 25, 2014.) | |
| 10.14# | Amended and Restated Employment Agreement, dated December 31, 2009, by and between First Foundation Inc., First Foundation Bank, First Foundation Advisors and John Michel, together with First and Second Amendments thereto. (Incorporated by reference to the same numbered Exhibit to the Company’s 2013 Annual Report on Form 10-K filed with the Commission on March 25, 2014.) | |
| 10.15# | Change of Control Agreement, dated September 17, 2007, by and between First Foundation Inc. and Dave Rahn. (Incorporated by reference to the same numbered Exhibit to the Company’s 2013 Annual Report on Form 10-K filed with the Commission on March 25, 2014.) | |
| 10.16# | Change of Control Agreement, dated September 17, 2007, by and between First Foundation Inc. and John Michel. (Incorporated by reference to the same numbered Exhibit to the Company’s 2013 Annual Report on Form 10-K filed with the Commission on March 25, 2014.) | |
| 10.17 | First Amendment to Loan Agreement with NexBank SSB. (Incorporated by reference to Exhibit 10.98 to the Company’s Current Report on Form 8-K dated March 25, 2014.) | |
| 10.18 | Amended & Restated Promissory Note issued by the Company to NexBank SSB pursuant to the First Amendment to Loan Agreement. (Incorporated by reference to Exhibit 10.99 to the Company’s Current Report on Form 8-K dated March 25, 2014.) | |
| 14.1 | Code of Conduct for the Chief Executive Officer and Other Senior Financial Officers. (Incorporated by reference to the same numbered Exhibit to the Company’s 2013 Annual Report on Form 10-K filed with the Commission on March 25, 2014.) | |
| 21.1 | Subsidiaries of the Registrant. | |
| 23.1 | Consent of Vavrinek, Trine, Day & Co., LLP, independent registered public accounting firm. | |
| 23.2 | Consent of Stradling Yocca Carlson & Rauth, P.C. (included in Exhibit 5.1). | |
| 24.1 | Power of Attorney (included in signature page). |
| # | Management contract or compensatory plan. |
| * | To be filed by amendment. |
II-8