Attached files
| file | filename |
|---|---|
| 8-K - CURRENT REPORT - Wendy's Co | d721299d8k.htm |
 First
Quarter 2014 Conference Call
May 8, 2014
Exhibit 99.1
©
2013 Oldemark LLC |
 DAVID
POPLAR Vice President
Investor Relations
2
©
2013 Oldemark LLC |
 Today’s Agenda
CEO Overview
Emil Brolick
Financial Update
Todd Penegor
Q&A
3 |
 This
presentation, and certain information that management may discuss in connection with this presentation,
contains certain statements that are not historical facts, including information
concerning possible or assumed
future
results
of
our
operations.
Those
statements
constitute
“forward-looking
statements”
within
the meaning of the Private Securities Litigation Reform Act of 1995 (The “Reform
Act”). For all forward-looking statements, we claim the protection of the
safe harbor for forward-looking statements contained in the Reform Act.
Many
important
factors
could
affect
our
future
results
and
could
cause
those
results
to
differ
materially
from
those expressed in or implied by our forward-looking statements. Such factors, all of
which are difficult or impossible to predict accurately, and many of which are
beyond our control, include but are not limited to those
identified
under
the
caption
“Forward-Looking
Statements”
in
our
news
release
issued
on
May
8,
2014
and
in
the
“Special
Note
Regarding
Forward-Looking
Statements
and
Projections”
and
“Risk
Factors”
sections of our most recent Form 10-K / Form 10-Qs.
In addition, this presentation and certain information management may discuss in
connection with this presentation reference non-GAAP financial measures, such
as adjusted earnings before interest, taxes, depreciation and amortization, or
adjusted EBITDA, and adjusted earnings per share. Adjusted EBITDA and adjusted
earnings per share exclude certain expenses, net of certain benefits. Reconciliations of non-GAAP
financial measures to the most directly comparable GAAP financial measures are provided
in the Appendix to this presentation, and are included in our news release issued
on May 8, 2014 and posted on www.aboutwendys.com.
4
Forward-Looking Statements and Non-GAAP Financial Measures
|
 EMIL
BROLICK President & CEO
5
©
2013 Oldemark LLC |
 IA
TRANSFORMING BRAND; PACE ACCELERATING
COMPLETED SALE OF 418
COMPANY RESTAURANTS
SOLID COMPANY-OPERATED
SRS OF 1.3%
BRAND MOMENTUM
CONTINUES IN FIRST QUARTER
6
STRONG ADJUSTED EBITDA
AND ADJUSTED EPS GROWTH
©
2013 Oldemark LLC |
 7
GROWTH…THE IMPERATIVE |
 KEYS TO
SUSTAINED GROWTH BRAND
RELEVANCE
ECONOMIC MODEL
RELEVANCE
8 |
 9
RECIPE TO WIN
PEOPLE
5-Star Talent
PRICE
New QSR Quality / QSR Price
PRODUCT
Playing a Different Game
PLACE
Brand Transformation
PERFORMANCE
Keeping Brand Promise
Tactically Brilliant
PROMOTION |
 10
% Traffic Share
Millennials and
Boomers Key to Growth
Period
ending
February
2014
/
Source:
The
NPD
Group
/
CREST
Total QSR
MILLENNIALS
25%
BOOMERS
33%
10%
10%
20%
20%
15%
15%
22%
22%
21%
21%
12%
12% |
 Messaging: "Engage Me; Don't Sell Me"
11 |
 Menu
Vision: Limited Time Offerings + Core 12
Asiago Ranch
Chicken Club
Ciabatta Bacon
Cheeseburger
BBQ Ranch
Chicken Salad
Asian Cashew
Chicken Salad |
 Technology: Engage Millennial Consumers
When, Where & How THEY Want To Be Engaged
13 |
 HOW WE
GROW BRAND RELEVANCE + ECONOMIC RELEVANCE = GROWTH
Shareholder
Value-Enhancing
Initiatives
Core Organic
Growth
Strategies
14
Financial Management
Global Growth
Restaurant Utilization &
Brand Access
Restaurant Ownership
Optimization
New Restaurant Growth
Image / Experience Activation
North America Same-Restaurant Sales Growth |
 RESTAURANT
OPTIMIZATION: GROWTH DRIVER SOLD 418 RESTAURANTS
15
GOALS
Net New Restaurant Growth
Assuring Brand Relevance
Efficiency and Effectiveness
Restaurant Ownership Optimization
•
Franchisee
Franchisee
•
Company
Franchisee |
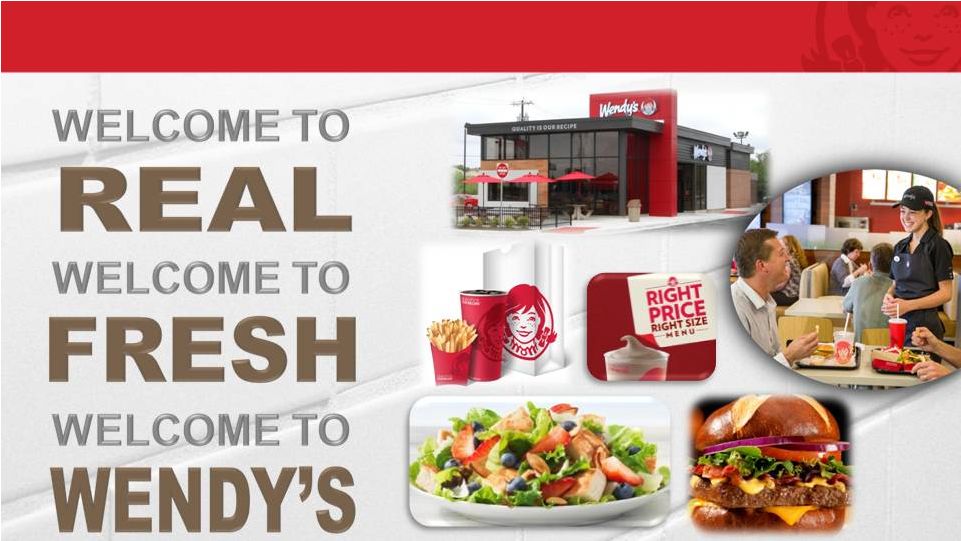 The
TOTAL
Experience Matters
16 |
 STRATEGIC
REASONS TO BELIEVE •
Strong Latent Brand Equity
•
Unique Brand Position…A Cut Above
•
Image Activation Contemporizing Brand Image
•
Economic Model Improving: Restaurant and
The Wendy’s Company
•
Exceptional Franchisee Base and Commitment
17 |
 TODD
PENEGOR Chief Financial Officer
18
©
2013 Oldemark LLC |
 Q1 2014
Highlights Q1 2014 NORTH AMERICA
Same-Restaurant Sales
Company
1.3%
Franchise
0.6%
N.A. COMPANY-OPERATED
RESTAURANT MARGIN + 30 bps
Q1 2014
13.1%
Q1 2013
12.8%
EARNINGS GROWTH
*Adjusted EBITDA
+13%
*Adjusted EPS
+133%
19
(Unaudited)
*See reconciliation of Adjusted EBITDA and Adjusted EPS in the appendix.
|
 Fundamentals of Business Continue to Improve
20
STRONG UNDERLYING
FUNDAMENTALS
Five Sequential Quarters
of Company SRS Growth
First
Half
Second
Half
Half
Improvement of
500+ bps vs.
first half
Q1
Q1 2014
Company
SRS
SRS
Q1
2014
Q4
2013
Q1
2013
Q2
2013
Q3
2013
1.0%
%
0.4%
%
3.2%
%
3.1%
1.3% |
 21
*See reconciliation of Adjusted EBITDA in the appendix.
SALES
$432.6
$530.7
-18.5%
FRANCHISE REVENUES
90.6
73.0
24.1%
TOTAL REVENUES
$523.2
$603.7
-13.3%
ADJUSTED EBITDA*
$87.3
$77.3
13%
Q1
2014
Q1
2013
%
Change
(Unaudited)
$ in millions
Q1 2014 Highlights |
 Q1 2014
Highlights G&A
$70.4
$65.3
$5.1
OPERATING PROFIT*
89.0
22.5
66.5
ADJUSTED EPS*
0.07
0.03
0.04
REPORTED EPS
0.12
0.01
0.11
Q1
Q1
2014
Q1
Q1
2013
$
$
Change
(Unaudited)
$ in millions, except per-share amounts
22
* First-quarter 2014 operating profit includes a $12.1 million gain on the sale of
assets and a $44.0 million net gain from the Company’s system optimization initiative.
Significant items affecting first-quarter 2013 operating profit include a $3.0
million facilities action charge. See reconciliation of Adjusted EPS in the appendix. |
 23
Cash Flow Highlights
CASH FLOW FROM OPERATIONS
$14.7
CAPITAL EXPENDITURES
53.1
BEGINNING CASH BALANCE
$580.2
CHANGE IN CASH
(195.5)
ENDING CASH BALANCE
$384.7
Q1
2014
(Unaudited)
$ in millions |
 24
Selected Balance Sheet Highlights
CASH
CASH
$385
$385
TOTAL DEBT
TOTAL DEBT
$1,462
$1,462
TTM Adjusted EBITDA
TTM Adjusted EBITDA
$377
$377
Total Debt/TTM Adjusted EBITDA
Total Debt/TTM Adjusted EBITDA
3.9
3.9
Net Debt/TTM Adjusted EBITDA
Net Debt/TTM Adjusted EBITDA
2.9
2.9
March 30, 2014
March 30, 2014
(Unaudited)
$ in millions |
 Image
Activation Franchise Adoption Accelerating 2011A
2012A
2013A
2014E
•
Solid Financial Returns
•
Financial Incentives
•
Joint Market and Capital Planning
•
Turn-Key Franchise Development Program
•
Construction Coaching Support
ULTRA-MODERN DESIGN WITH UPGRADES
25
236
59
10
410-460
TOTAL SYSTEM
REIMAGES AND NEW BUILDS
FRANCHISEES: KEY DRIVERS |
 Economic
Model And Brand Relevance To Accelerate Growth ECONOMIC MODEL
•
$2 million AUV Target
•
Hi-Lo Strategy: Build Check vs. Price
•
Image Activation Acceleration
•
Brand Relevance
•
Build Loyalty
•
People Activation / Customer Service
•
Leverage Technology
•
Mobile Pay, Mobile Order, CRM
•
Margin Activation
•
Fuel for Reinvestment
26
COMPANY AND FRANCHISEES
GROWTH DRIVERS |
 Reaffirming 2014 Adjusted EBITDA and EPS Outlook
Estimates based on Company’s current outlook.
27
Company-operated Same-Restaurant Sales growth of 2.5 to 3.5 percent
Reduction in interest expense of approximately $15 million
Capital expenditures of $280 to $290 million
Adjusted EBITDA of $390 to $400 million / Adjusted EPS of $0.34 to $0.36
Company-operated restaurant margin outlook of 16.3 to 16.8 percent
•
Higher-than-expected beef costs, primarily in 2Q and 3Q
Reaffirming:
Revising: |
 28
On Target For $30 Million In G&A Savings from System Optimization
HIGHER EQUITY COMPENSATION EXPENSE TO PARTIALLY OFFSET SAVINGS
2012 Actual
$288
2014 Estimate
$275
Estimated Savings
$ 13
Stock Comp. Increase
$ 17
Savings
Excl.
Stock
Comp.
$
30
$ in millions
2014 ESTIMATE vs. 2012 ACTUAL
2014 ESTIMATE vs. 2013 ACTUAL
2013 Actual
$294
2014 Estimate
$275
Estimated Savings
$ 19
Stock Comp. Increase
$ 11
Savings
Excl.
Stock
Comp.
$
30 |
 Reaffirming Long-Term Outlook
SAME-RESTAURANT
SALES
3%+
ADJUSTED
EBITDA
ADJUSTED
EPS
Growth Rate in
the High-Single to
Low-Double Digit Range
Growth Rate
in Mid-Teens
29
Estimates based on Company’s current outlook. |
 CASH
PRIORITIES Building Shareholder Value
Invest in our Business
Dividend Growth
Share Repurchases
30
Ended Q1
with $385M
of Cash
Offset dilutive impact of equity awards
Generally in line with EPS growth (subject to Board approval)
Image Activation: Increasing Scrape & Rebuilds |
 DAVID
POPLAR Vice President
Investor Relations
31
©
2013 Oldemark LLC |
 2014
Investor Relations Calendar MAY 13
Image Activation Tour –
Dublin, Ohio
Sponsored by Sanford Bernstein
MAY 21-22
Texas Road Show –
Dallas and Houston
Sponsored by Stifel, Nicolaus & Company
JUNE 3-4
West Coast Road Show –
San Fran. and L.A.
Sponsored by Key
32 |
 Q&A
33 |
 Appendix
34 |
 Reconciliation
of
Adjusted
EBITDA
to
Net
Income
35
2014
2013
Adjusted EBITDA
87,334
$
77,299
$
(Less) plus:
Depreciation and amortization
(42,021)
(51,797)
Facilities action (income) charges, net
44,033
(3,038)
Impairment of long-lived assets
(332)
-
Operating profit
89,014
22,464
Interest expense
(12,994)
(20,964)
Other income (expense), net
523
(2,271)
Income (loss) before income taxes
76,543
(771)
(Provision for) benefit from income taxes
(30,240)
2,904
Net income
46,303
$
2,133
$
(In Thousands)
Reconciliation of Adjusted EBITDA to Net Income
(Unaudited)
Three Months |
 36
Reconciliation of Adjusted Income and Adjusted Earnings Per Share
to Net Income and Earnings Per Share
Per share
Per share
Adjusted income and adjusted earnings per share
26,249
$
0.07
$
13,101
$
0.03
$
Plus (less):
Facilities action (income) charges, net
26,156
0.07
(1,900)
(0.00)
Depreciation of assets that will be replaced as part of the Image Activation
initiative (5,897)
(0.02)
(9,068)
(0.02)
Impairment of long-lived assets
(205)
(0.00)
-
-
Total adjustments
20,054
0.05
(10,968)
(0.02)
Net income
46,303
$
0.12
$
2,133
$
0.01
$
2014
2013
Reconciliation of Adjusted Income and Adjusted Earnings Per Share to
Net Income and Earnings Per Share
(In Thousands Except Per Share Amounts)
(Unaudited)
Three Months |
