Attached files
| file | filename |
|---|---|
| 8-K - 8-K - LOCAL Corp | d725801d8k.htm |
| EX-99.1 - EX-99.1 - LOCAL Corp | d725801dex991.htm |
| Exhibit 99.2
|

Quarterly Earnings Summary
Q1 2014
|
|
Forward looking statements
This Q1-2014 Quarterly Earnings Summary contains forward looking statements which are made pursuant to the Safe Harbor provisions of section 21-E of the Securities Exchange Act of 1934. Investors are cautioned that statements which are not strictly historical statements, including statements concerning future expected financial performance.
The forward looking statements include, but are not limited to, any statements containing the words “expect”, “anticipate”, “estimates”, “believes”, “should”, “could”, “may”, “possibly”, and similar expressions and the negatives thereof. These forward looking statements involve a number of risks and uncertainties that could cause actual results to differ materially from the forward looking statements. Those risks and uncertainties are detailed in the company’s filings from time to time with the Securities and Exchange Commission. The information contained in the forward looking statements is provided as of the date first set forth above and the company disclaims any obligation to update such statements.
This document includes the non-GAAP financial measure of “Adjusted EBITDA” . See page 12 for a note regarding the Company’s use of Non-GAAP financial measures and slide 10 for a reconciliation of GAAP to non-GAAP.
Quarterly Earnings Summary: Q1 2014
|
|
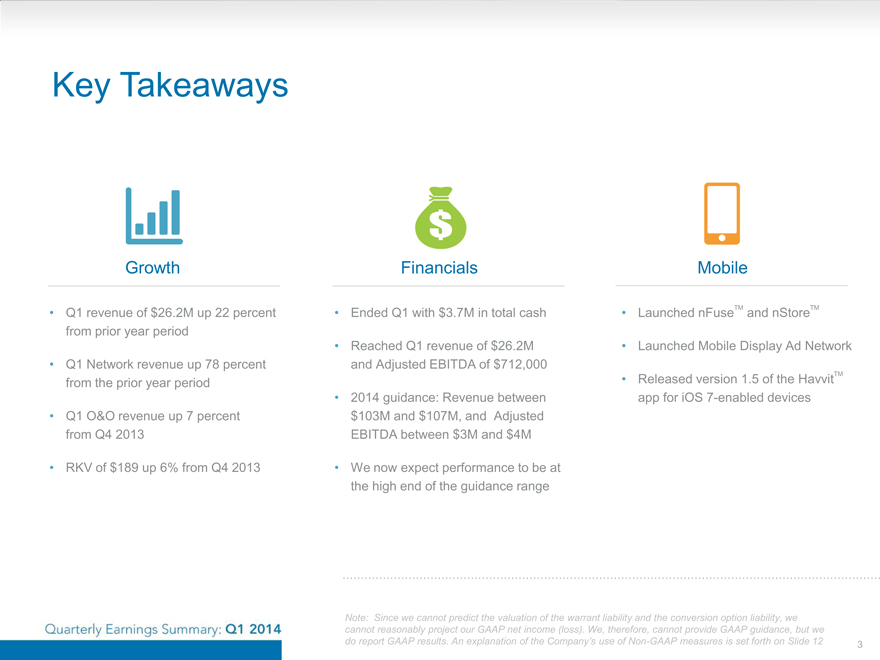
Key Takeaways
Growth
Financials
Mobile
Q1 revenue of $26.2M up 22 percent from prior year period
Q1 Network revenue up 78 percent from the prior year period
Q1 O&O revenue up 7 percent from Q4 2013
RKV of $189 up 6% from Q4 2013
Ended Q1 with $3.7M in total cash
Reached Q1 revenue of $26.2M and Adjusted EBITDA of $712,000
2014 guidance: Revenue between $103M and $107M, and Adjusted EBITDA between $3M and $4M
We now expect performance to be at the high end of the guidance range
Launched nFuseTM and nStoreTM
Launched Mobile Display Ad Network
Released version 1.5 of the HavvitTM app for iOS 7-enabled devices
Note: Since we cannot predict the valuation of the warrant liability and the conversion option liability, we cannot reasonably project our GAAP net income (loss). We, therefore, cannot provide GAAP guidance, but we do report GAAP results. An explanation of the Company’s use of Non-GAAP measures is set forth on Slide 12
3
Quarterly Earnings Summary: Q1 2014
|
|
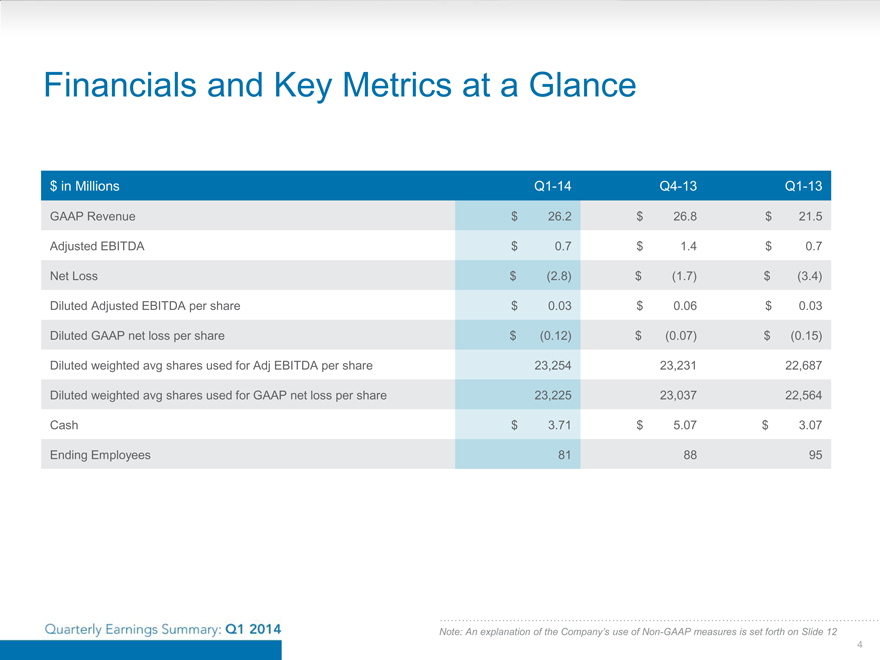
Financials and Key Metrics at a Glance
$ in Millions Q1-14 Q4-13 Q1-13
GAAP Revenue $ 26.2 $ 26.8 $ 21.5
Adjusted EBITDA $ 0.7 $ 1.4 $ 0.7
Net Loss $ (2.8) $ (1.7) $ (3.4)
Diluted Adjusted EBITDA per share $ 0.03 $ 0.06 $ 0.03
Diluted GAAP net loss per share $ (0.12) $ (0.07) $ (0.15)
Diluted weighted avg shares used for Adj EBITDA per share 23,254 23,231 22,687
Diluted weighted avg shares used for GAAP net loss per share 23,225 23,037 22,564
Cash $ 3.71 $ 5.07 $ 3.07
Ending Employees 81 88 95
Quarterly Earnings Summary: Q1 2014
Note: An explanation of the Company’s use of Non-GAAP measures is set forth on Slide 12
4
|
|
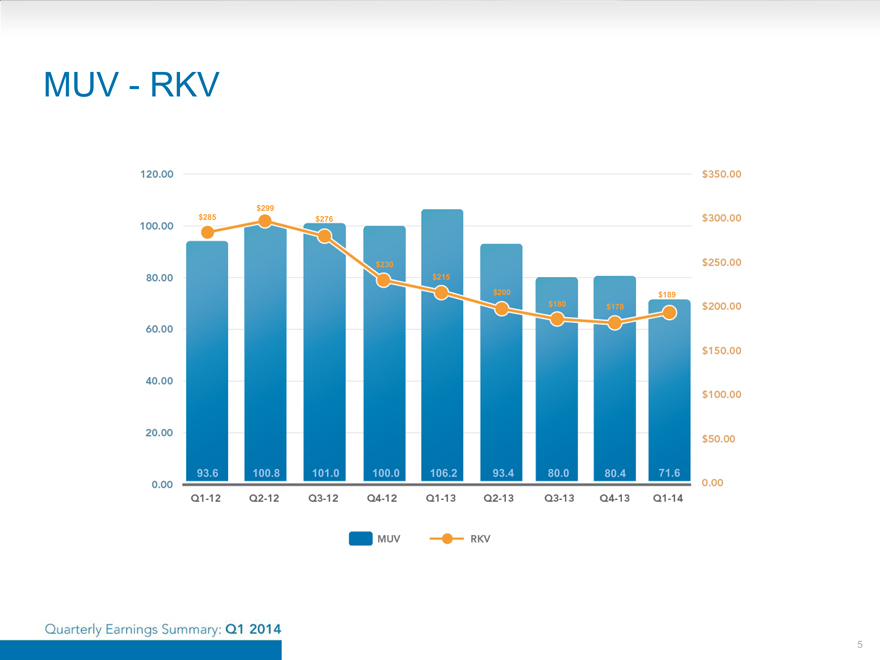
MUV - RKV
$299
$285 $276
$230
$215
$200 $189
$180 $178
93.6 100.8 101.0 100.0 106.2 93.4 80.0 80.4 71.6
Q1-12 Q2-12 Q3-12 Q4-12 Q1-13 Q2-13 Q3-13 Q4-13 Q1-14
120.00 100.00 80.00 60.00 40.00 20.00 0.00
$350.00 $300.00 $250.00 $200.00 $150.00 $100.00 $50.00 0.00
MUV RKV
Quarterly Earnings Summary: Q1 2014
5
|
|
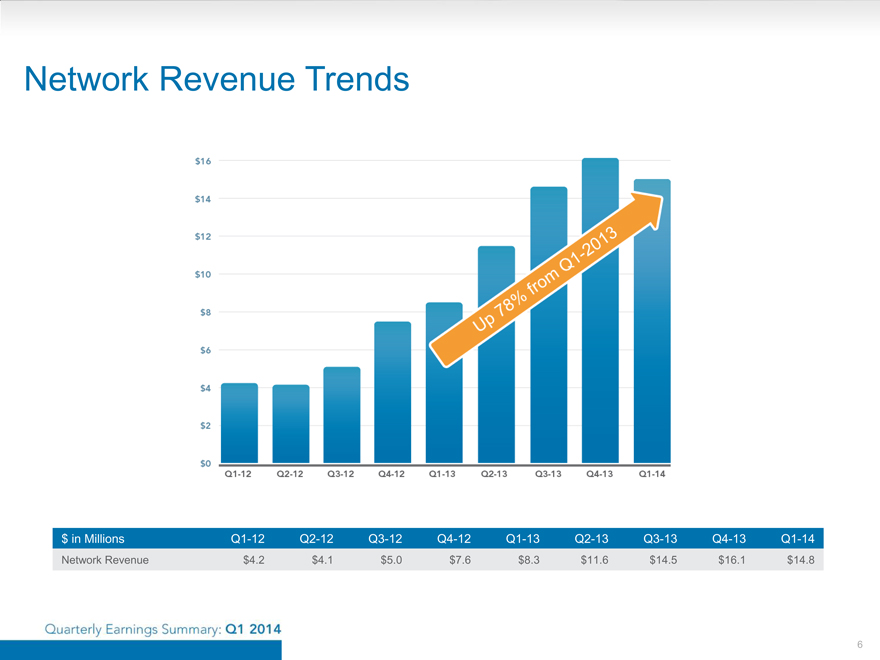
Network Revenue Trends
Up 78% from
$16 $14 $12 $10 $8 $6 $4 $2 $0
Q1-12 Q2-12 Q3-12 Q4-12 Q1-13 Q2-13 Q3-13 Q4-13 Q1-14
$ in Millions Q1-12 Q2-12 Q3-12 Q4-12 Q1-13 Q2-13 Q3-13 Q4-13 Q1-14
Network Revenue $4.2 $4.1 $5.0 $7.6 $8.3 $11.6 $14.5 $16.1 $14.8
Quarterly Earnings Summary: Q1 2014
6
|
|
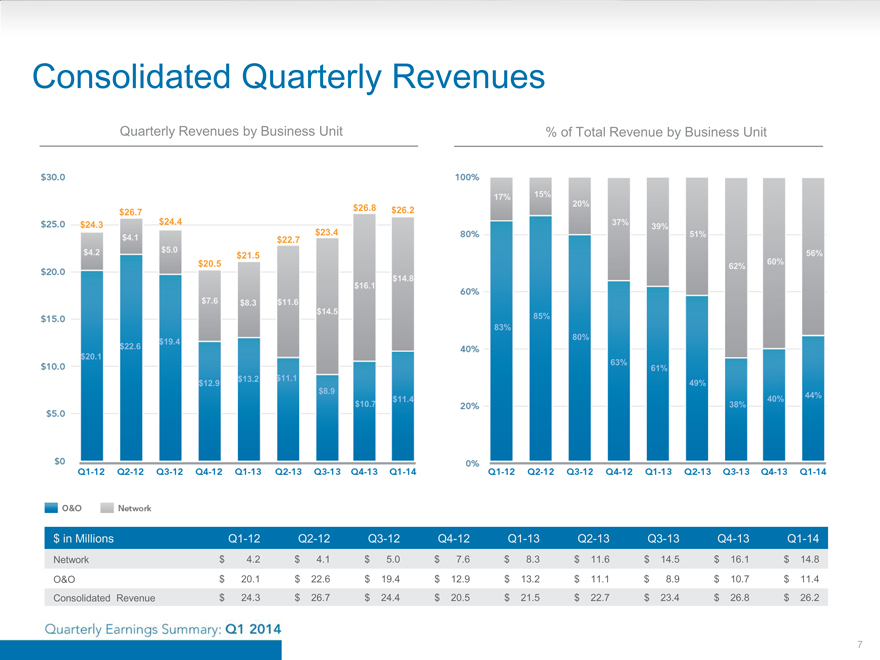
Consolidated Quarterly Revenues
Quarterly Revenues by Business Unit
% of Total Revenue by Business Unit
$30.0 $25.0 $20.0 $15.0 $10.0 $5.0 $0
Q1-12 Q2-12 Q3-12 Q4-12 Q1-13 Q2-13 Q3-13 Q4-13 Q1-14
$24.3 $4.2 $20.1
$26.7 $4.1 $22.6
$24.4 $5.0 $19.4
$20.5 $7.6 $12.9
$21.5 $8.3 $13.2
$22.7 $11.6 $11.1
$23.4 $14.5 $8.9
$26.8 $16.1 $10.7
$26.2 $14.8 $11.4
100% 80% 60% 40%20% 0%
17% 83%
15% 83%
20% 80%
37% 63%
39% 61%
51% 49%
62% 38%
60% 40%
56% 44%
Q1-12 Q2-12 Q3-12 Q4-12 Q1-13 Q2-13 Q3-13 Q4-13 Q1-14
O&O Network
$ in Millions Q1-12 Q2-12 Q3-12 Q4-12 Q1-13 Q2-13 Q3-13 Q4-13 Q1-14
Network $ 4.2 $ 4.1 $ 5.0 $ 7.6 $ 8.3 $ 11.6 $ 14.5 $ 16.1 $ 14.8
O&O $ 20.1 $ 22.6 $ 19.4 $ 12.9 $ 13.2 $ 11.1 $ 8.9 $ 10.7 $ 11.4
Consolidated Revenue $ 24.3 $ 26.7 $ 24.4 $ 20.5 $ 21.5 $ 22.7 $ 23.4 $ 26.8 $ 26.2
Quarterly Earnings Summary: Q1 2014
7
|
|
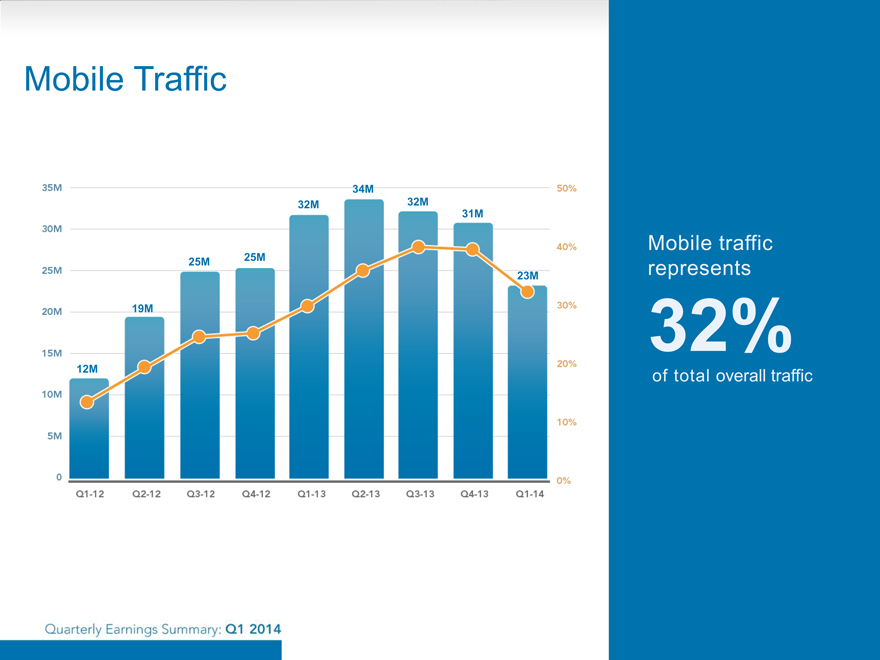
Mobile Traffic
35M 30M 25M 15M 10M 5M 0
Q1-12 Q2-12 Q3-12 Q4-12 Q1-13 Q2-13 Q3-13 Q4-13 Q1-14
50% 40% 30% 20% 10% 0%
12M 19M 25M 25M 32M 34M 32M31M 23M
Quarterly Earnings Summary: Q1 2014
|
|
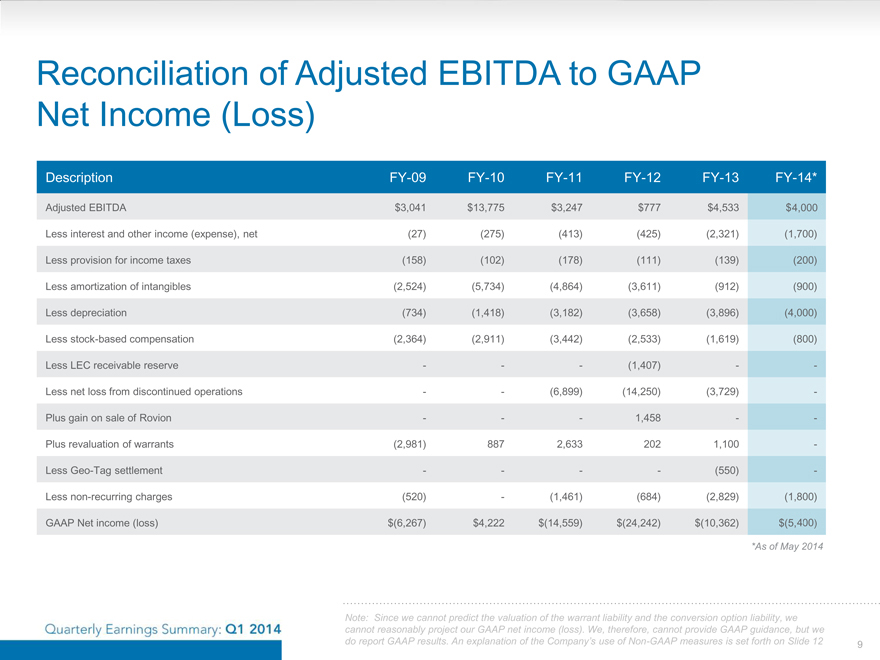
Reconciliation of Adjusted EBITDA to GAAP
Net Income (Loss)
Description FY-09 FY-10 FY-11 FY-12 FY-13 FY-14*
Adjusted EBITDA $3,041 $13,775 $3,247 $777 $4,533 $3,500
Less interest and other income (expense), net (27) (275) (413) (425) (2,321) (1,700)
Less provision for income taxes (158) (102) (178) (111) (139) (200)
Less amortization of intangibles (2,524) (5,734) (4,864) (3,611) (912) (900)
Less depreciation (734) (1,418) (3,182) (3,658) (3,896) (4,000)
Less stock-based compensation (2,364) (2,911) (3,442) (2,533) (1,619) (800)
Less LEC receivable reserve --- (1,407) - -
Less net loss from discontinued operations -- (6,899) (14,250) (3,729) -
Plus gain on sale of Rovion --- 1,458 - -
Plus revaluation of warrants (2,981) 887 2,633 202 1,100 -
Less Geo-Tag settlement ---- (550) -
Less non-recurring charges (520) - (1,461) (684) (2,829) (1,800)
GAAP Net income (loss) $(6,267) $4,222 $(14,559) $(24,242) $(10,362) $(5,300)
*As of May 2014
Note: Since we cannot predict the valuation of the warrant liability and the conversion option liability, we cannot reasonably project our GAAP net income (loss). We, therefore, cannot provide GAAP guidance, but we do report GAAP results. An explanation of the Company’s use of Non-GAAP measures is set forth on Slide 12
Quarterly Earnings Summary: Q1 2014
9
|
|
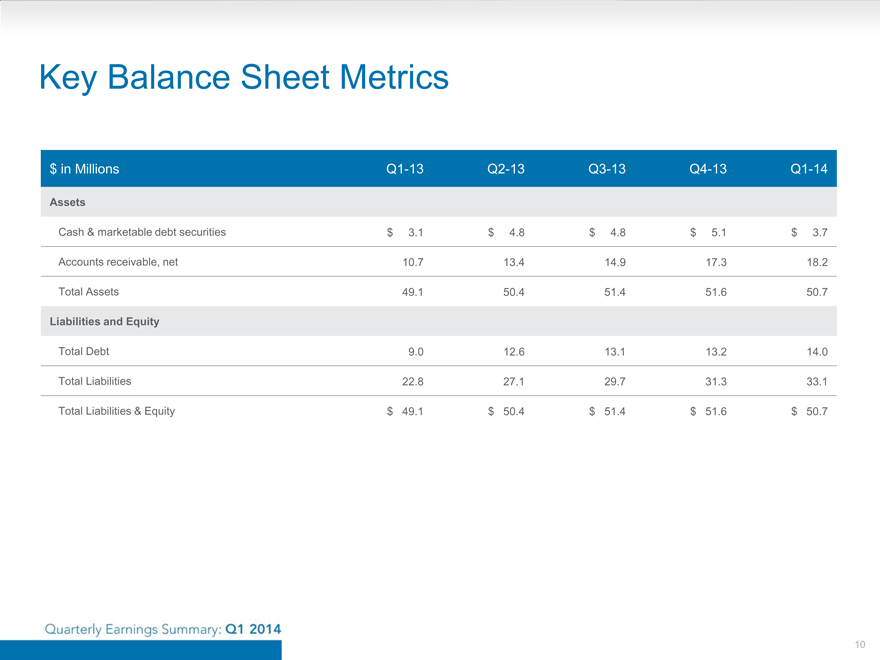
Key Balance Sheet Metrics
$ in Millions Q1-13 Q2-13 Q3-13 Q4-13 Q1-14
Assets
Cash & marketable debt securities $ 3.1 $ 4.8 $ 4.8 $ 5.1 $ 3.7
Accounts receivable, net 10.7 13.4 14.9 17.3 18.2
Total Assets 49.1 50.4 51.4 51.6 50.7
Liabilities and Equity
Total Debt 9.0 12.6 13.1 13.2 14.0
Total Liabilities 22.8 27.1 29.7 31.3 33.1
Total Liabilities & Equity $ 49.1 $ 50.4 $ 51.4 $ 51.6 $ 50.7
Quarterly Earnings Summary: Q1 2014
10
|
|
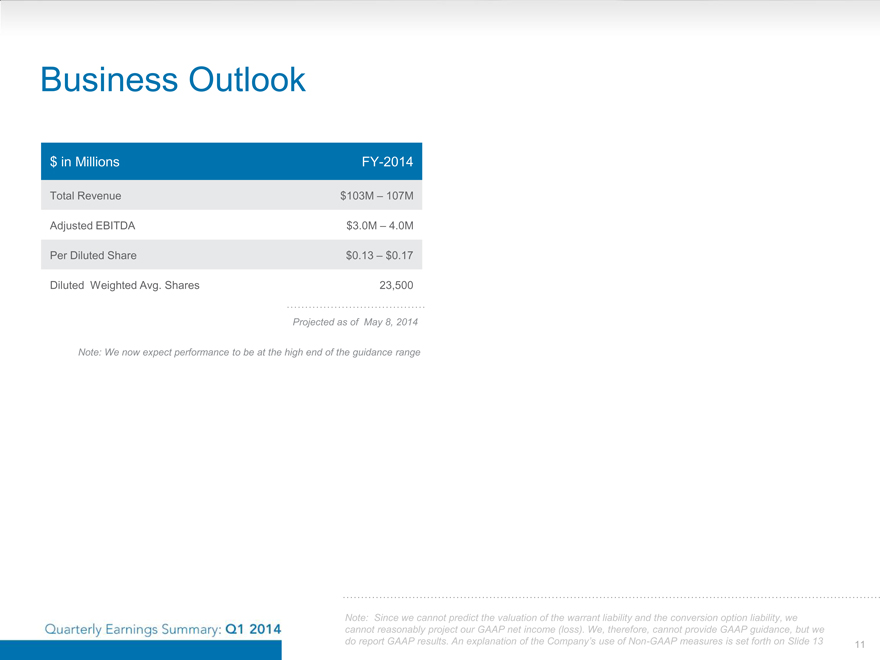
Business Outlook
$ in Millions FY-2014
Total Revenue $103M – 107M
Adjusted EBITDA $3.0M – 4.0M
Per Diluted Share $0.13 – $0.17
Diluted Weighted Avg. Shares 23,500
Projected as of May 8, 2014
Note: We now expect performance to be at the high end of the guidance range
Note: Since we cannot predict the valuation of the warrant liability and the conversion option liability, we cannot reasonably project our GAAP net income (loss). We, therefore, cannot provide GAAP guidance, but we do report GAAP results. An explanation of the Company’s use of Non-GAAP measures is set forth on Slide 13
Quarterly Earnings Summary: Q1 2014
11
|
|
Use of Non-GAAP Measures
This document includes the non-GAAP financial measure of “Adjusted EBITDA” which we define as net income (loss) excluding: provision for income taxes; interest and other income (expense), net; depreciation; amortization; stock based compensation charges; gain or loss on derivatives’ revaluation, net income (loss) from discontinued operations; gain on sale of Rovion; impairment charges; LEC receivables reserve; finance related charges; accrued lease liability/asset; and severance charges. Adjusted EBITDA, as defined above, is not a measurement under GAAP. Adjusted EBITDA is reconciled to net income (loss) which we believe is the most comparable GAAP measure. A reconciliation of net income (loss) to Adjusted EBITDA is set forth within this presentation.
Management believes that Adjusted EBITDA provides useful information to investors about the company’s performance because it eliminates the effects of period-to-period changes in income from interest on the company’s cash and marketable securities, expense from the company’s financing transactions and the costs associated with income tax expense, capital investments, stock-based compensation expense, LEC receivables reserve, warrant revaluation charges; finance related charges; accrued lease liability; and severance charges which are not directly attributable to the underlying performance of the company’s business operations. Management uses Adjusted EBITDA in evaluating the overall performance of the company’s business operations.
A limitation of non-GAAP Adjusted EBITDA is that it excludes items that often have a material effect on the company’s net income and earnings per common share calculated in accordance with GAAP. Therefore, management compensates for this limitation by using Adjusted EBITDA in conjunction with net income (loss) and net income (loss) per share measures. The company believes that Adjusted EBITDA provides investors with an additional tool for evaluating the company’s core performance, which management uses in its own evaluation of overall performance, and as a base-line for assessing the future earnings potential of the company. While the GAAP results are more complete, the company prefers to allow investors to have this supplemental metric since, with reconciliation to GAAP; it may provide greater insight into the company’s financial results. The non-GAAP measures should be viewed as a supplement to, and not as a substitute for, or superior to, GAAP net income (loss) or earnings (loss) per share.
Quarterly Earnings Summary: Q1 2014
12