Attached files
| file | filename |
|---|---|
| 8-K - 8-K - GOLUB CAPITAL BDC, Inc. | v377686_8k.htm |
Exhibit 99.1

www.golubcapitalbdc.com GBDC Golub Capital BDC, Inc. Investor Presentation Quarter Ended March 31, 2014

Disclaimer Some of the statements in this presentation constitute forward - looking statements, which relate to future events or our future performance or financial condition. The forward - looking statements contained in this presentation involve risks and uncertainties, including statements as to: our future operating results; our business prospects and the prospects of our portfolio companies; the effect of investments that we expect to make; our contractual arrangements and relationships with third parties; actual and potential conflicts of interest with GC Advisors LLC ("GC Advisors"), our investment adviser, and other affiliates of Golub Capital LLC (collectively, "Golub Capital"); the dependence of our future success on the general economy and its effect on the industries in which we invest; the ability of our portfolio companies to achieve their objectives; the use of borrowed money to finance a portion of our investments; the adequacy of our financing sources and working capital; the timing of cash flows, if any, from the operations of our portfolio companies; the ability of GC Advisors to locate suitable investments for us and to monitor and administer our investments; the ability of GC Advisors or its affiliates to attract and retain highly talented professionals; our ability to qualify and maintain our qualification as a regulated investment company and as a business development company; the impact on our business of the Dodd - Frank Wall Street Reform and Consumer Protection Act and the rules and regulations issued thereunder; and the effect of changes to tax legislation and our tax position. Such forward - looking statements may include statements preceded by, followed by or that otherwise include the words “may,” “might,” “will,” “intend,” “should,” “could,” “can,” “would,” “expect,” “believe,” “estimate,” “anticipate,” “predict,” “potential,” “plan” or similar words. We have based the forward - looking statements included in this presentation on information available to us on the date of this presentation, and we assume no obligation to update any such forward - looking statements. Actual results could differ materially from those anticipated in our forward - looking statements and future results could differ materially from historical performance. Although we undertake no obligation to revise or update any forward - looking statements, whether as a result of new information, future events or otherwise, you are advised to consult any additional disclosures that we may make directly to you or through reports that we have filed or in the future may file with the Securities and Exchange Commission (“SEC”), including annual reports on Form 10 - K, registration statements on Form N - 2, quarterly reports on Form 10 - Q and current reports on Form 8 - K. This presentation contains statistics and other data that have been obtained from or compiled from information made available by third - party service providers. We have not independently verified such statistics or data.

2 Summary of Quarterly Results Second Fiscal Quarter 2014 Highlights „X Net investment income for the quarter ended March 31, 2014 was $13.3 million, or $0.31 per share, as compared to $13.3 million, or $0.31 per share, for the quarter ended December 31, 2013. „X Net increase in net assets resulting from operations for the quarter ended March 31, 2014 was $14.1 million, or $0.32 per share, as compared to $14.8 million, or $0.34 per share, for the quarter ended December 31, 2013. „X Net realized and unrealized gains on investments and secured borrowings was $0.7 million for the quarter ended March 31, 2014 and primarily related to net unrealized appreciation on several middle-market debt and equity securities. „X Net asset value per share for the quarter ended March 31, 2014 was $15.41, as compared to $15.23 for the quarter ended December 31, 2013. The $0.18 accretion was primarily due to our March 18, 2014 stock offering completed at a premium to our net asset value. This is the seventh consecutive quarterly increase in our net asset value per share. „X New middle-market investment commitments totaled $173.5 million for the quarter ended March 31, 2014. Including the $9.0 million we invested in Senior Loan Fund LLC (¡§SLF¡¨), total new investment commitments were $182.5 million. Approximately 14% of the new investment commitments were senior secured loans, 80% were one stop loans, 1% was equity securities and 5% were investments in SLF. Overall, total investments in portfolio companies at fair value increased by approximately $73.7 million during the three months ended March 31, 2014.

Financial Highlights Q2 2014 Q1 2014 Q4 2013 Q3 2013 Q2 2013 Net investment income per share $ 0.31 $ 0.31 $ 0.31 $ 0.32 $ 0.32 Net realized/unrealized gain (loss) per share 0.01 0.03 0.00 0.02 0.06 Earnings per share 0.32 0.34 0.31 0.34 0.38 Net asset value per share 15.41 15.23 15.21 15.12 14.80 Distributions paid per share 0.32 0.32 0.32 0.32 0.32 Q2 2014 Q1 2014 Q4 2013 Q3 2013 Q2 2013 Total Fair Value of Investments (000s) $ 1,253,597 $ 1,179,919 $ 1,024,645 $ 967,792 $ 788,442 Number of Portfolio Investments 139 139 135 135 135 Average Investment Size (000s) $ 9,019 $ 8,488 $ 7,590 $ 7,169 $ 5,840 Fair Value as a Percentage of Principal (Loans) 99.0% 99.0% 98.9% 98.7% 98.7%

4 Summary of Portfolio Highlights Originations and Net Funds Growth ▪ New investment commitments totaled $182.5 million for the quarter ended March 31, 2014, including the $9.0 million we invested in SLF. ▪ Net growth in investments in securities, at fair value, for the quarter ended March 31, 2014 was $73.7 million, a 6.2% increase from December 31, 2013. Select Portfolio Funds Roll Data (in millions) Q2 2 014 Q1 2 014 Q4 2 013 Q3 2 013 Q2 2 013 New Investment Commitments $ 182.5 $ 286.7 $ 126.1 $ 288.4 $ 58.1 Exits (includes full & partial payoffs) of Investments 103.7 103.6 60.1 92.7 37.6 Net Funds Growth 1 78.8 155.3 56.9 179.4 20.1 Asset Mix of the Investment Portfolio Q2 2 014 Q1 2 014 Q4 2 013 Q3 2 013 Q2 2 013 Senior Secured 23% 25% 29% 33% 33% One Stop 61% 59% 54% 50% 49% Second Lien 9% 9% 11% 10% 10% Subordinated Debt 1% 1% 2% 4 % 5 % Investment in SLF 3% 3% 1% N/A N/A Equity 3% 3% 3% 3% 3% 1. Net funds growth includes the impact of new investments and exits of investments as noted in the table above, as well as othe r v ariables such as net fundings on revolvers, net change in unamortized fees, net change in unrealized gains (losses), etc.

5 Quarterly Statements of Financial Condition As of ( Dollar amounts in thousands , except per share data) March 31, 2014 (unaudited ) December 31, 2013 (unaudited ) September 30, 2013 (audited ) June 30, 2013 (unaudited ) March 31, 2013 (unaudited ) Assets Investments in securities, at fair value $ 1,253,597 $ 1,179,919 $ 1,024,645 $ 967,792 $ 788,442 Cash and cash equivalents 12,810 31,891 16,309 12,936 8,950 Restricted cash and cash equivalents 41,261 39,792 38,408 21,689 84,214 Other assets 13,976 13,225 12,294 13,340 11,572 Total Assets $ 1,321,644 $ 1,264,827 $ 1,091,656 $ 1,015,757 $ 893,178 Liabilities Debt $ 572,150 $ 577,200 $ 412,100 $ 403,800 $ 385,700 Secured borrowings, at fair value 18,222 14,366 8,809 – – Interest payable 1,691 3,159 1,277 2,426 1,304 Management and incentive fee payable 5,736 6,751 5,579 5,808 5,069 Payable open trades – 1,657 3,677 – – Other liabilities 1,915 1,713 1,978 2,225 1,452 Total Liabilities 599,714 604,846 433,420 414,259 393,525 Total Net Assets 721,930 659,981 658,236 601,498 499,653 Total Liabilities and Net Assets $ 1,321,644 $ 1,264,827 $ 1,091,656 $ 1,015,757 $ 893,178 Net Asset Value per Share $ 15.41 $ 15.23 $ 15.21 $ 15.12 $ 14.80 Debt to Equity 0.82x 0.90x 0.64x 0.67x 0.77x Asset Coverage 1 285.5% 266.9% 373.1% 349.9% 298.6% 1. On September 13, 2011, we received exemptive relief from the SEC to permit us to exclude the debt of our small business inves tme nt company (“SBIC”) subsidiaries from our 200% asset coverage test. As such , asset coverage excludes the SBA debentures of our SBICs.

6 Quarterly Operating Results For the three months ended (Dollar amounts in thousands, except share and per share data) March 31, 2014 (unaudited) December 31, 2013 (unaudited) September 30, 2013 (unaudited) June 30, 2013 (unaudited) March 31, 2013 (unaudited) Investment Income Interest income $ 24,977 $ 24,479 $ 21,727 $ 20,156 $ 17,997 Dividend income 262 16 370 1,081 479 Fee income 21 1,084 719 1,031 1,620 Total Investment Income 25,260 25,579 22,816 22,268 20,096 Expenses Interest and other debt financing expenses 4,540 4,092 3,174 2,967 3,292 Base management fee 4,185 3,824 3,480 3,114 2,686 Incentive fee 1,656 3,032 2,196 2,785 2,468 Other operating expenses 1,527 1,371 1,542 1,402 1,256 Total Expenses 11,908 12,319 10,392 10,268 9,702 Net Investment Income 13,352 13,260 12,424 12,000 10,394 Net Gain (Loss) on Investments and Secured Borrowings Net realized gain (loss) on investments 87 (4,994) (1,380) (77) – Net unrealized appreciation on investments and secured borrowings 662 6,571 1,250 734 1,857 Net Gain (Loss) on Investments and Secured Borrowings 737 1,577 (130) 657 1,857 Net Increase in Net Assets Resulting from Operations $ 14,089 $ 14,837 $ 12,294 $ 12,657 $ 12,251 Per Share Earnings Per Share $ 0.32 $ 0.34 $ 0.31 $ 0.34 $ 0.38 Net Investment Income $ 0.31 $ 0.31 $ 0.31 $ 0.32 $ 0.32 Distributions Paid $ 0.32 $ 0.32 $ 0.32 $ 0.32 $ 0.32 Weighted average common shares outstanding 43,754,776 43,285,250 40,269,680 37,118,379 32,532,794 Common shares outstanding at end of period 46,857,608 43,325,575 43,282,932 39,791,805 33,754,512

7 33% 33% 29% 25% 23% 49% 50% 54% 59% 61% 10% 10% 11% 9% 9% 5% 4% 2% 1% 3% 3% 3% 3% 3% 3% $- $200,000 $400,000 $600,000 $800,000 $1,000,000 $1,200,000 $1,400,000 Q2 2013 Q3 2013 Q4 2013 Q1 2014 Q2 2014 Senior Secured One Stop Second Lien Subordinated Debt Equity Investment in SLF Portfolio Highlights – Asset Mix New Investment Commitments End of Period Investments 35% 20% 20% 12% 14% 25% 62% 52% 71% 80% 16% 22% 7% 1% 1% 2% 9% 1% 5% $- $50,000 $100,000 $150,000 $200,000 $250,000 $300,000 $350,000 Q2 2013 Q3 2013 Q4 2013 Q1 2014 Q2 2014 Senior Secured One Stop Second Lien Subordinated Debt Equity Investment in SLF 39% $788,442 $967,792 $1,024,645 $1,253,597 $1,179,919 $126,007 $288,444 $58,115 $286,736 $182,482 4% 2% 1% 3% 1%

8 10.6% 9.9% 9.6% 9.3% 8.6% 9.5% 9.2% 8.9% 8.6% 8.0% 3.5% 2.9% 3.0% 3.1% 3.0% 7.1% 7.0% 6.6% 6.2% 5.6% 0.3% 0.3% 0.2% 0.2% 0.2% 0.0% 2.0% 4.0% 6.0% 8.0% 10.0% 12.0% Q2 2013 Q3 2013 Q4 2013 Q1 2014 Q2 2014 Investment Income Yield Income Yield Wtd. Avg. Debt Wtd. Avg. Investment Spread 3-Month London Interbank Offered Rate ("LIBOR") 1 3 2 4 Portfolio Highlights – Debt Investment Spread Analysis 1. Investment income yield is calculated as (a) the actual amount earned on such investments, including interest and fee income and amortization of capitalized fees and discounts, divided by (b) the daily average of total earning investments at fair value. 2. Income yield is calculated as (a) the actual amount earned on such investments, including interest and fee income but excluding amortization of capitalized fees and discounts, divided by (b) the daily average of total investments at fair value. 3. The weighted average cost of debt is calculated as (a) the actual amount incurred on such debt obligations divided by (b) the da ily average of total debt obligations. 4. The weighted average investment spread is calculated as (a) the investment income yield less (b) the weighted average cost of debt.

9 Portfolio Highlights – Selected Information Portfolio Rotation – Debt Investments Q2 2 014 Q1 2 014 Q4 2 013 Q3 2 013 Q2 2 013 Weighted average interest rate of new investments 1 7.5% 7.2% 8.1% 8.0% 8.8% Weighted average interest rate on investments that were sold or paid - off 8.8% 9.6% 8.9% 8.9% 10.2% Weighted average spread over LIBOR of new floating rate investments 6.4% 6.1% 6.6% 6.6% 6.2% Weighted average interest rate of new fixed rate investments N/A N/A 15.0% N/A 16.0% Weighted average fees on new investments 1.3% 1.2% 1.2% 1.3% 1.1% Portfolio Composition – Floating vs. Fixed Investments Q2 2 014 Q1 2 014 Q4 2 013 Q3 2 013 Q2 2 013 Percentage of fixed rate investments 0.3% 0.5% 2.9% 3.6% 7.1% Percentage of floating rate investments 96.1% 95.9% 93.7% 93.2% 89.7% Percentage of equity investments 3.6% 3.6% 3.4% 3.2% 3.2% Non - Accrual – Debt Investments Q2 2 014 Q1 2 014 Q4 2 013 Q3 2 013 Q2 2 013 Non - accrual investments at amortized cost (000s) $2,577 $2,577 $ 6,011 $ 6,616 $ 8,428 Non - accrual investments / Total portfolio at amortized cost 0.2% 0.2% 0.6% 0.7% 1 .1% Non - accrual investments at fair value (000s) $ 5 $ 5 $ 665 $ 841 $ 2,392 Non - accrual investments / Total portfolio at fair value 0.0% 0.0% 0.1% 0.1% 0.3% 1. Weighted average interest rate on new investments is based on the contractual interest rate at the time of funding. For varia ble rate loans, the contractual rate is calculated using current LIBOR, the spread over LIBOR and the impact of any LIBOR floor. For f ixe d rate loans, the contract rate is the stated fixed rate. 2. Represents an amount less than 0.1%. 2 2

10 Portfolio Highlights - Credit Quality Credit Quality – Investment Portfolio ▪ Fundamental credit quality remains strong with non - accrual investments representing less than 0.1% of the total investments at fair value as of March 31, 2014. ▪ Internal Performance Ratings 1 on the investment portfolio have remained relatively stable for the past several quarters and over 90.0% of the investments in our portfolio had an Internal Performance Rating of 4 or higher as of March 31, 2014. ▪ The fair value of debt investments as a percentage of principal amount remained stable at 99.0% for the period ended March 31, 2014. 1. Please see Internal Performance Ratings Definitions on the following page.

11 Portfolio Highlights – Portfolio Ratings Rating Definition 5 Borrower is performing above expectations and the trends and risk factors are generally favorable 4 Borrower is generally performing as expected and the risk factors are neutral to favorable 3 Borrower may be out of compliance with debt covenants; however, loan payments are generally not past due 2 Borrower is performing materially below expectations and the loan’s risk has increased materially since origination 1 Borrower is p erforming substantially below expectations and the loan’s risk has substantially increased since origination March 31, 2014 December 31, 2013 September 30, 2013 Internal Performance Rating Investments at Fair Value (in thousands) % of Total Portfolio Investments at Fair Value (in thousands) % of Total Portfolio Investments at Fair Value (in thousands) % of Total Portfolio 5 $ 251,829 20.1% $ 161,868 13.7% $ 178,993 17.5% 4 $ 937,477 74.8% $ 946,309 80.2% $ 750,611 73.3% 3 $ 61,918 4.9% $ 68,726 5.8% $ 88,458 8.6% 2 $ 1,857 0.2% $ 2,414 0.2% $ 6,521 0.6% 1 $ 516 0.0% $ 602 0.1% $ 62 0.0% Total $ 1,253,597 1 00.0% $ 1,179,919 1 00.0% $ 1,024,645 1 00.0% Strong Portfolio Risk Ratings Internal Performance Rating Definition * * * Represents an amount less than 0.1%.
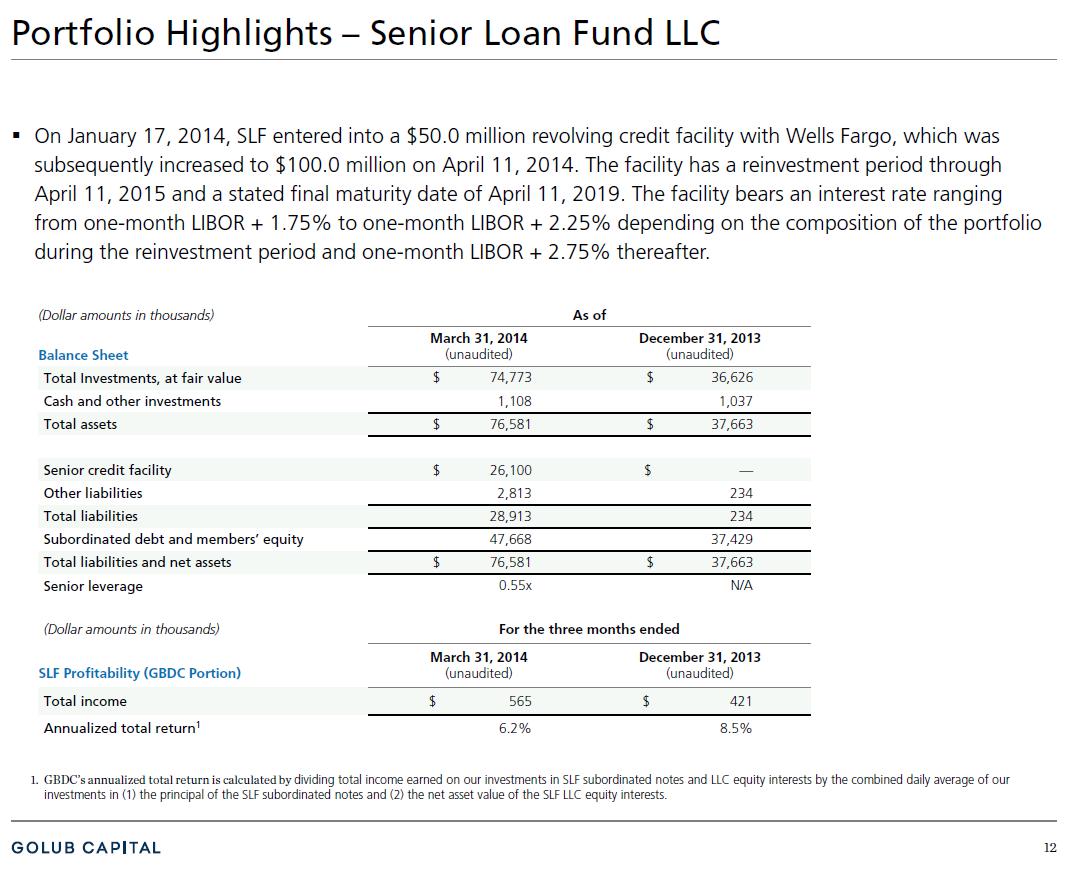
12 Portfolio Highlights ¡V Senior Loan Fund LLC „X On January 17, 2014, SLF entered into a $50.0 million revolving credit facility with Wells Fargo, which was subsequently increased to $100.0 million on April 11, 2014. The facility has a reinvestment period through April 11, 2015 and a stated final maturity date of April 11, 2019. The facility bears an interest rate ranging from one-month LIBOR + 1.75% to one-month LIBOR + 2.25% depending on the composition of the portfolio during the reinvestment period and one-month LIBOR + 2.75% thereafter. (Dollar amounts in thousands) As of Balance Sheet March 31, 2014 (unaudited) December 31, 2013 (unaudited) Total Investments, at fair value $ 74,773 $ 36,626 Cash and other investments 1,108 1,037 Total assets $ 76,581 $ 37,663 Senior credit facility $ 26,100 $ ¡X Other liabilities 2,813 234 Total liabilities 28,913 234 Subordinated debt and members¡¦ equity 47,668 37,429 Total liabilities and net assets $ 76,581 $ 37,663 Senior leverage 0.55x N/A (Dollar amounts in thousands) For the three months ended SLF Profitability (GBDC Portion) March 31, 2014 (unaudited) December 31, 2013 (unaudited) Total income $ 565 $ 421 Annualized total return1 6.2% 8.5% 1. GBDC¡¦s annualized total return is calculated by dividing total income earned on our investments in SLF subordinated notes and LLC equity interests by the combined daily average of our investments in (1) the principal of the SLF subordinated notes and (2) the net asset value of the SLF LLC equity interests.

13 Common Stock and Distribution Information Common Stock Data Distribution Data Date Declared Record Date Payment Date Amount Per Share Total Amount (in thousands) May 1 , 2 01 2 June 1 5, 2 01 2 June 29, 2 01 2 $0.32 $8,205 August 2, 2 01 2 September 1 3, 2 01 2 September 27, 2 01 2 $0.32 $8,212 November 27, 2012 December 14, 2012 December 28, 2012 $0.32 $9,146 February 5, 2013 March 14, 2013 March 28, 2013 $0.32 $10,793 May 1, 2013 June 13, 2013 June 27, 2013 $0.32 $12,722 August 6, 2013 September 13, 2013 September 27, 2013 $0.32 $12,733 November 26, 2013 December 17, 2013 December 27, 2013 $0.32 $13,851 February 4, 2014 March 17, 2014 March 28, 2014 $0.32 $13,864 May 6, 2014 June 16, 2014 June 27, 2014 $0.32 $15,048 Fiscal Year Ended September 30, 2 013 High Low End of Period First Quarter $1 6.32 $1 4 .75 $15.98 Second Quarter $16 .66 $15 .82 $16.51 Third Quarter $17.98 $16.02 $17 .50 Fourth Quarter $18.50 $16.76 $17.33 Fiscal Year Ended September 30, 2 014 First Quarter $19.11 $16.74 $19.11 Second Quarter $19.26 $17.64 $17.84

14 Liquidity and Investment Capacity Cash and Cash Equivalents ▪ Unrestricted cash and cash equivalents totaled $12.8 million as of March 31, 2014. ▪ Restricted cash and cash equivalents totaled $41.3 million as of March 31, 2014. Restricted cash was held in our securitization vehicle, SBIC subsidiaries and our revolving credit facility and is available for new investments that qualify for acquisition by these entities. Debt Facilities ▪ Revolving Credit Facilities – As of March 31, 2014, subject to leverage and borrowing base restrictions, we had approximately $96.0 million of remaining commitments and $74.3 million of availability on our $250.0 million revolving credit facility with Wells Fargo. As of March 31, 2014, subject to leverage and borrowing base restrictions, we had approximately $ 14.2 million of remaining commitments and $0.2 million of availability on our $15.0 million revolving credit facility with Private Bank. ▪ SBIC Debt – As of March 31, 2014, we had $22.7 million of additional debentures available through our SBIC subsidiaries, subject to customary U.S. Small Business Administration regulatory requirements. Public Offerings ▪ On March 18, 2014, we priced a public offering of 3.5 million shares of our common stock at a public offering price of $18.05 per share, raising $61.3 million in net proceeds after underwriting costs. On April 23, 2014, we sold an additional 166,855 shares pursuant to the underwriters’ partial exercise of the option we granted in connection with the public offering and we received net proceeds after underwriting costs of $2.9 million.