Attached files
| file | filename |
|---|---|
| 8-K - 8-K - CMS ENERGY CORP | a14-12138_18k.htm |
Exhibit 99.1
|
|
Investor Meetings May 8 - 14, 2014 Cross Winds® Energy Park Jackson Gas Plant Consumers Smart Energy Program |

|
|
This presentation is made as of the date hereof and contains “forward-looking statements” as defined in Rule 3b-6 of the Securities Exchange Act of 1934, Rule 175 of the Securities Act of 1933, and relevant legal decisions. The forward-looking statements are subject to risks and uncertainties. All forward-looking statements should be considered in the context of the risk and other factors detailed from time to time in CMS Energy’s and Consumers Energy’s Securities and Exchange Commission filings. Forward-looking statements should be read in conjunction with “FORWARD-LOOKING STATEMENTS AND INFORMATION” and “RISK FACTORS” sections of CMS Energy’s and Consumers Energy’s Form 10-K for the year ended December 31, 2013 and as updated in subsequent 10-Qs. CMS Energy’s and Consumers Energy’s “FORWARD-LOOKING STATEMENTS AND INFORMATION” and “RISK FACTORS” sections are incorporated herein by reference and discuss important factors that could cause CMS Energy’s and Consumers Energy’s results to differ materially from those anticipated in such statements. CMS Energy and Consumers Energy undertake no obligation to update any of the information presented herein to reflect facts, events or circumstances after the date hereof. The presentation also includes non-GAAP measures when describing CMS Energy’s results of operations and financial performance. A reconciliation of each of these measures to the most directly comparable GAAP measure is included in the appendix and posted on our website at www.cmsenergy.com. CMS Energy provides historical financial results on both a reported (Generally Accepted Accounting Principles) and adjusted (non-GAAP) basis and provides forward-looking guidance on an adjusted basis. Management views adjusted earnings as a key measure of the company’s present operating financial performance, unaffected by discontinued operations, asset sales, impairments, regulatory items from prior years, or other items. These items have the potential to impact, favorably or unfavorably, the company's reported earnings in future periods. Because the company is not able to estimate the impact of these matters, the company is not providing a reconciliation to the comparable future period reported earnings. 1 |
|
|
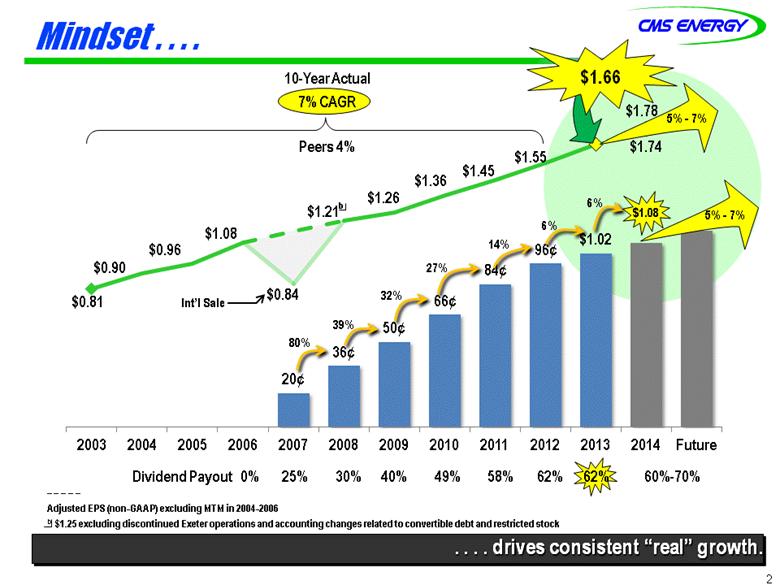
Mindset . . . . 2 . . . . drives consistent “real” EPS growth. $0.81 _ _ _ _ _ Adjusted EPS (non-GAAP) excluding MTM in 2004-2006 a $1.25 excluding discontinued Exeter operations and accounting changes related to convertible debt and restricted stock Int’l Sale a 10-Year Actual 7% CAGR Dividend Payout 0% 25% 30% 40% 49% 58% 62% 62% 60%-70% 32% 27% 14% 39% 80% Peers 4% $1.66 6% 5% - 7% 5% - 7% |
|
|
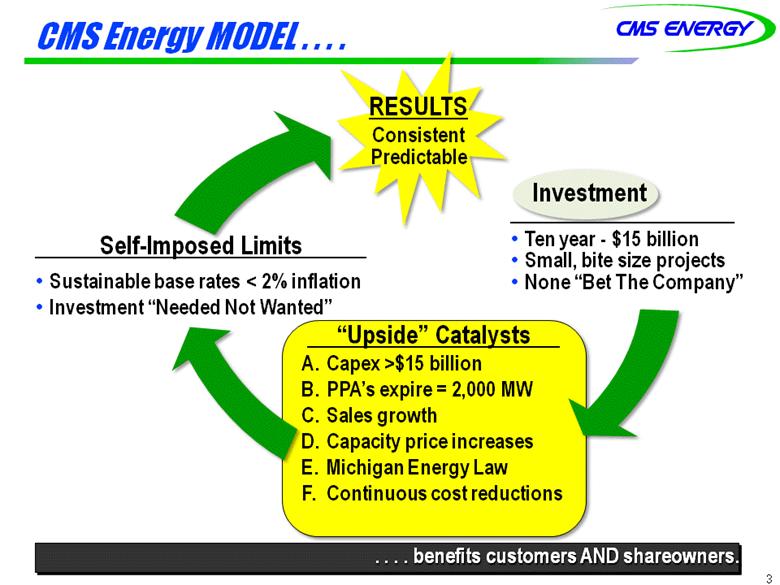
CMS Energy MODEL . . . . 3 Investment Ten year - $15 billion Small, bite size projects None “Bet The Company” “Upside” Catalysts A. Capex >$15 billion B. PPA’s expire = 2,000 MW C. Sales growth D. Capacity price increases E. Michigan Energy Law F. Continuous cost reductions Self-Imposed Limits Sustainable base rates < 2% inflation Investment “Needed Not Wanted” RESULTS Consistent Predictable . . . . benefits customers AND shareowners. |
|
|
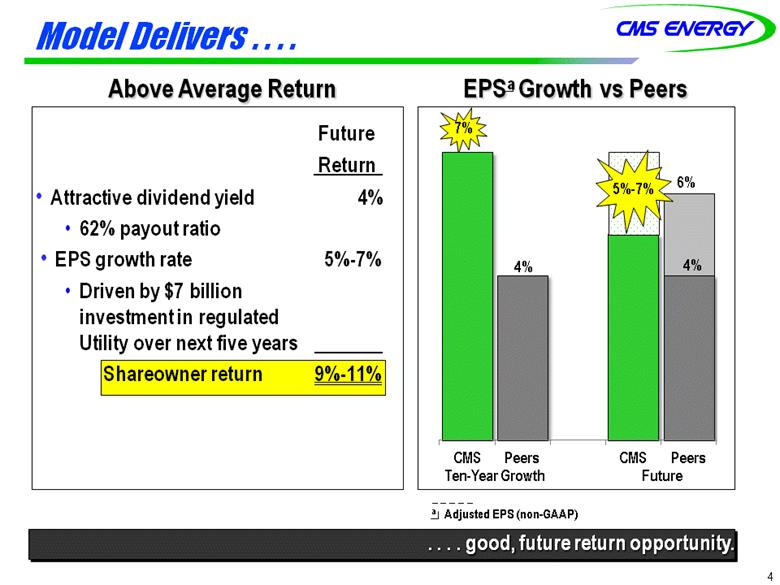
Model Delivers . . . . 4 . . . . good, future return opportunity. Above Average Return EPSa Growth vs Peers _ _ _ _ _ a Adjusted EPS (non-GAAP) Ten-Year Growth Future 5%-7% Future Return Attractive dividend yield 4% 62% payout ratio EPS growth rate 5%-7% Driven by $7 billion investment in regulated Utility over next five years Shareowner return 9%-11% |
|
|
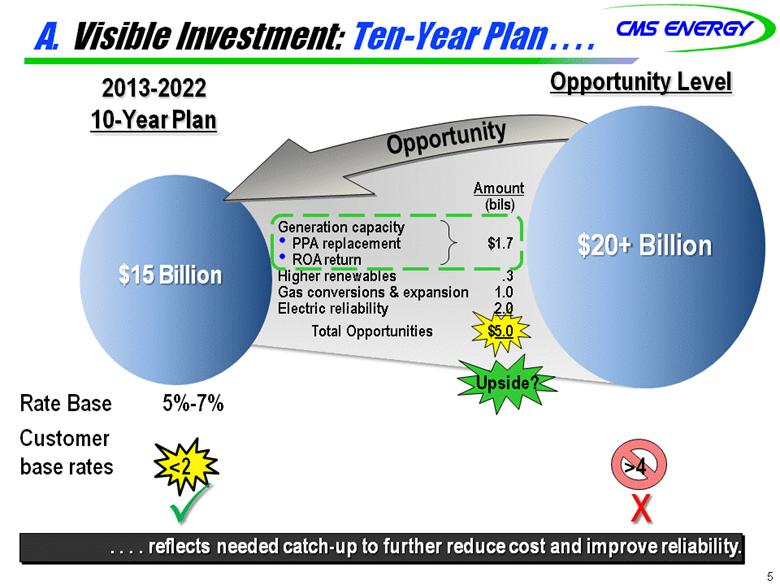
A. Visible Investment: Ten-Year Plan . . . . 5 . . . . reflects needed catch-up to further reduce cost and improve reliability. 2013-2022 10-Year Plan Opportunity Level $15 Billion $15 Billion $20+ Billion Opportunity Amount (bils) Generation capacity PPA replacement $1.7 ROA return Higher renewables .3 Gas conversions & expansion 1.0 Electric reliability 2.0 Total Opportunities $5.0 X Rate Base 5%-7% Customer base rates <2 >4 Upside? |
|
|
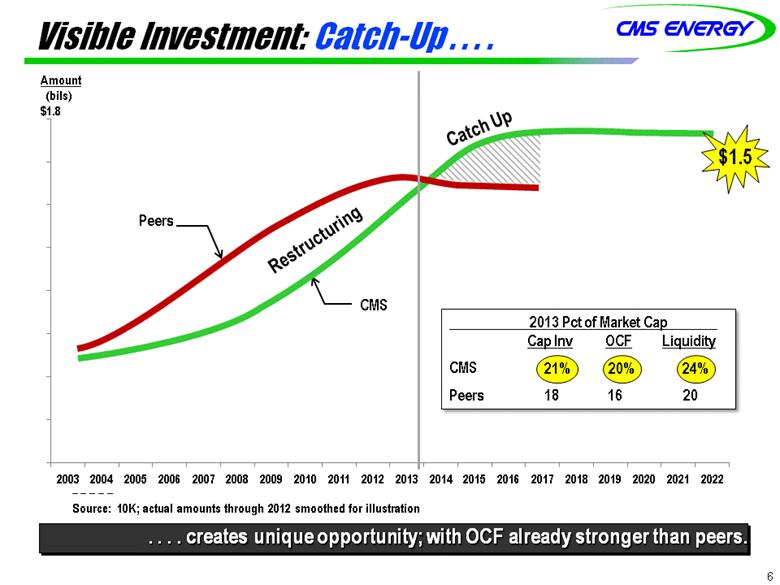
Visible Investment: Catch-Up . . . . 6 2013 Pct of Market Cap Cap Inv OCF Liquidity CMS 21% 20% 24% Peers 18 16 20 21% 20% 24% . . . . creates unique opportunity; with OCF already stronger than peers. Amount (bils) $1.8 CMS Peers _ _ _ _ _ Source: 10K; actual amounts through 2012 smoothed for illustration $1.5 Restructuring Catch Up 2003 2004 2005 2006 2007 2008 2009 2010 2011 2012 2013 2014 2015 2016 2017 2018 2019 2020 2021 2022 |
|
|
157 Bcf of gas delivered in Q1 49% from storage Customers protected from price volatility No major service interruptions Investing $5 billion over the next 10 years Visible Investment: Gas System . . . . 7 . . . . added value and held up to the test. Investment Performance Southwest Michigan Pipeline Ray Compressor Station |
|
|
Visible Investment: Gas Infrastructure . . . . 8 . . . . accelerating investment opportunities. 52,000 miles of distribution pipe Program to replace 3,000 miles $500 M next five years 1,700 miles of transmission lines $100 M West Oakland pipeline complete $120 M Southwest Michigan pipeline under construction 309 Bcf gas storage $250 M new compression complete $150 M compression upgrade under construction 4th Largest Gas System Investment Amount (bils) $ |
|
|
Visible Investment: Rate Base Growth . . . . 9 . . . . drives EPS, cash flow, and dividend growth. Base Rate Increases <2% <2% Capital Investment “Checklist” Add Customer Value Reduce O&M Costs Reduce Fuel Costs Mandated by State or Federal Regulators $8 $11 $13 Upside: Creates headroom for more investments Amount (bis) $20 15 10 5 0 Gas Electric $11 $15 $19 2013 2017 2022 |
|
|
B. PPA’s Expire . . . . 10 . . . . Replacement not yet in plan! Ten-year Capacity Growth ~780 MW 1,240 MW ~Potential for 3,000 MW of owned capacity MW PPA 2,600 capacity ~30% ~8,600 MW 540 MW 410 MW Shortfall Owned (6,000) 780 MW 8,600 MW Owned (8,020) PPA 580 MW 10,000 7,500 Today Jacksonplant Replaces Classic Seven Palisades PPA Expires 2002 MCV PPA Expires 2025 Future ROA Eliminated? |
|
|
New Capacity Opportunities . . . . Replace PPA With New Build Full Year Impact Customer Bill Investor (EPS) (mils) 1,000 MW of PPA’s expire - $325 0 ¢ Add 1,000 MW owned capacity + 325 + 5 Impact ≈ Flat Incremental Step-up Not in Plan 2 points Build - Thetford Expand - Zeeland Buy - ? LT PPA 11 . . . . upside not in Plan. + 5¢ Upside: Capacity Options |
|
|
C. Sales Growth . . . . . . . even after Energy Efficiency. First Quarter Electric Salesa Economic Indicators Annual Industrial Sales Grand Rapids Michigan U.S Building Permits* + 39% +25% +16% GDP (real) 2010 thru 2012 14 11 7 Population 2010 Census thru July 2013 3 0 2 Unemployment February 2014 6.2% 7.7% 6.7% *Annualized numbers March thru February _ _ _ _ _ a Weather normalized vs prior year b Negative with “E1” 12 Growth Upside? CMS U.S. Utilities -5% -6% 5% 2% `2% 2008-2009 Recession 2010-2012 Recory Conservative 2014-18 Plan Assumptions -1.4% -4.4% 1.8% 1.2% 1.7% 0.5%b 1.7% 2008 2009 2010 2011 2012 2013 2014 |
|
|
D. Capacity Price Market Increases . . . . 13 . . . . could add value to the 700 MW “DIG” plant. Capacity price < ($ kW per month) Today (mils) Future Scenarios (mils) $5 +$30 $55 $35 +$50 Opportunity Upside: Conditions improving <$0.50 $4.50 $7.50 |
|
|
E. Michigan Energy Law . . . . Historical test year 12-18 months regulatory lag No cap on ROA 14 10% renewables by 2015 Energy efficiency standards File-and-implement 10% ROA cap Adaptability Reliability Affordability Environmental protection Before 2008 TODAY 2015 Improvements . . . . builds on 2008 Law! Update: House hearings on HB5184 (electric deregulation) Action: No action by Committee Next Step: Gas main extension Bill/rate competitiveness Upside More renewables Better process |
|
|
Michigan Governor’s Race . . . . 15 . . . . Election Day is November 4th, 2014. Mark Schauer Democrat, Challenger Rick Snyder Republican, Incumbent Campaign Issues Education Jobs Roads Detroit On Energy On ROA 39% 45% As Senate Democratic Leader, Mark played a key role in the successful passage of the 2008 Energy Law. “Choice creates a lot of challenges and problems, essentially trying to arbitrage markets.” -Governor Rick Snyder *Polling data from Real Clear Politics, 3/9-4/15 2014. |
|
|
F. Continuous O&M Cost Reductions . . . . 16 . . . . . holds down rates and allows better system reliability. _ _ _ _ _ a O&M Change excluding major storms Amount (mils) $ $1,050 -3%a -8% +5% -8% +5% -3%a +5% 2012 Cost Reduction Reinvestment 2013 Cost Reduction Reinvestment 2014 |
|
|
Self-Initiated Cost Control . . . . 17 . . . . . holds down rates and allows better system reliability. Average Annual O&M Change +6% Peers -2% CMS Flat -2% Average -3% Plan Conservatively Upside? _ _ _ _ _ a -8% Before reinvestment +6% Peers Actual/Plan (exc 2013 major storms) 2006-2012 2012 2013 2014 2014-2018 |
|
|
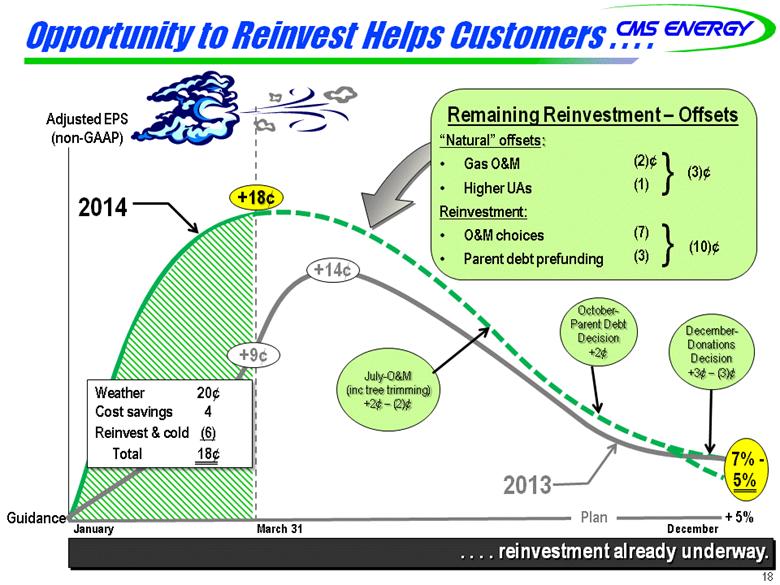
Opportunity to Reinvest Helps Customers . . . . 18 . . . . reinvestment already underway. 2014 2013 +14¢ +9¢ Adjusted EPS (non-GAAP) +18¢ Guidance 7% - 5% Remaining Reinvestment – Offsets (2)¢ (1) (7) (3) } } (3)¢ (10)¢ “Natural” offsets: Gas O&M Higher UAs Reinvestment: O&M choices Parent debt prefunding January March 31 December + 5% Plan Weather 20¢ Cost savings 4 Reinvest & cold (6) Total 18¢ December- Donations Decision +3¢ – (3)¢ October- Parent Debt Decision +2¢ July-O&M (inc tree trimming) +2¢ – (2)¢ |
|
|
Residential Bills Competitive . . . . 19 O&M Tax Cross Winds Self-initiated Rate design, regulatory ROA Policy, Legislator Consumers higher than Midwest peer avg Below Midwest peers . . . . improved industrial rates achievable through cooperative steps. Electric Rate Case Avoided Industrial Electric Rate (vs Midwest Average) |
|
|
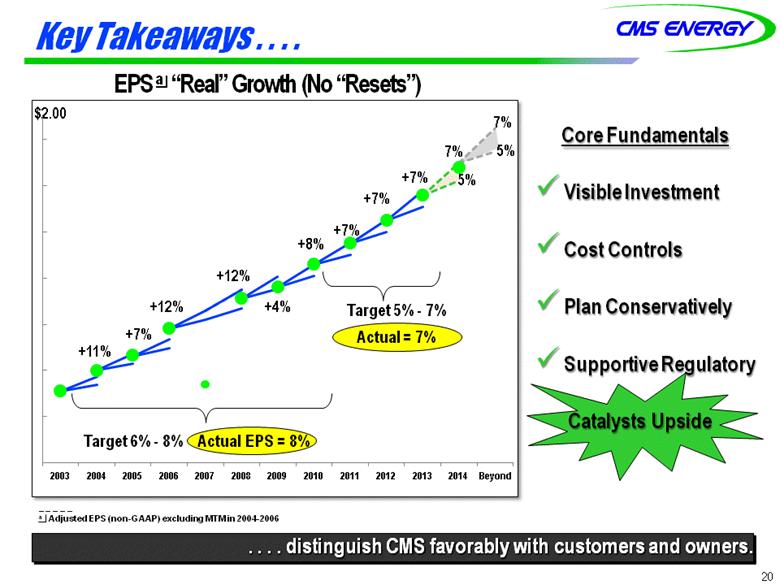
Key Takeaways . . . . 20 . . . . distinguish CMS favorably with customers and owners. _ _ _ _ _ a Adjusted EPS (non-GAAP) excluding MTM in 2004-2006 EPS a “Real” Growth (No “Resets”) $2.00 Core Fundamentals Visible Investment Cost Controls Plan Conservatively Supportive Regulatory Catalysts Upside Target 5% - 7% Actual = 7% +11% Target 6% - 8% Actual EPS = 8% +7% +12% +12% +4% +7% +7% +7% +8% 7% 5% 7% 5% 2003 2004 2005 2006 2007 2008 2009 2010 2011 2012 2013 2014 Beyond |
|
|
Appendix |
|
|
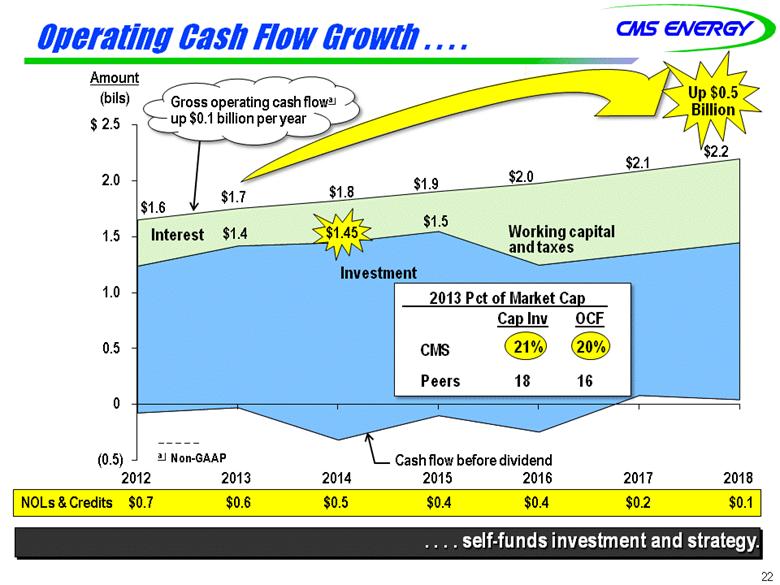
Operating Cash Flow Growth . . . . Amount (bils) $ Investment Cash flow before dividend _ _ _ _ _ a Non-GAAP NOLs & Credits $0.7 $0.6 $0.5 $0.4 $0.4 $0.2 $0.1 Gross operating cash flowa up $0.1 billion per year . . . . self-funds investment and strategy. Up $0.5 Billion $2.1 Interest Working capital and taxes $1.6 $1.9 $2.0 $1.7 $1.8 $1.45 $2.2 $1.4 $1.5 22 2013 Pct of Market Cap Cap Inv OCF CMS 13% 15% Peers 18 16 21% 20% 2014 $0 |
|
|
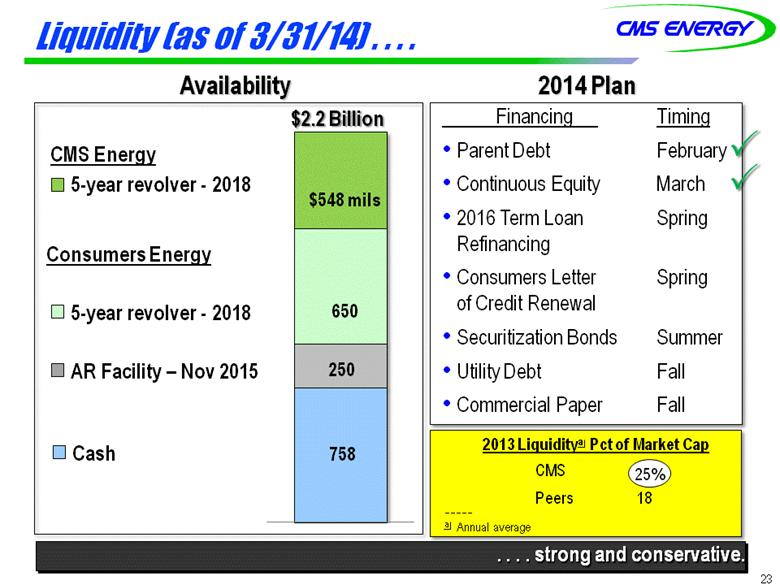
Liquidity (as of 3/31/14) . . . . . . . . strong and conservative. Availability CMS Energy 5-year revolver - 2018 Consumers Energy Cash AR Facility – Nov 2015 5-year revolver - 2018 $548 mils 650 250 758 $2.2 Billion Financing Timing Parent Debt February Continuous Equity March 2016 Term Loan Spring Refinancing Consumers Letter Spring of Credit Renewal Securitization Bonds Summer Utility Debt Fall Commercial Paper Fall 2014 Plan 23 2013 Liquiditya Pct of Market Cap CMS Peers 18 25% _ _ _ _ _ a Annual average |
|
|
Credit Ratings . . . . . . . . just upgraded, more ahead? Consistent Performance Less Risk Customer Focus Constructive Regulation Good Energy Policy Reflects Present Prior 2002 Scale S&P / Fitch Moody’s S&P (March) Moody’s (January) Fitch (February) A+ A1 A A2 Consumers Secured A- A3 BBB+ Baa1 BBB Baa2 BBB- Baa3 BB+ Ba1 CMS Unsecured BBB Baa2 BBB- Baa3 BB+ Ba1 BB Ba2 BB- Ba3 B+ B1 B B2 B- B3 Outlook Positive Stable Stable 24 |
|
|
Capital Expenditures 25 New Gas Plant Capacity 2014-2018 Plan 2013 2014 2015 2016 2017 2018 Total (mils) (mils) (mils) (mils) (mils) (mils) (mils) Electric Distribution $ 199 $ 190 $ 197 $ 202 $ 211 $ 208 $ 1,008 Generation 89 96 93 88 60 155 492 New Customers 48 47 38 39 38 34 196 Other 96 102 81 82 84 61 410 Electric Base Capital $ 432 $ 435 $ 409 $ 411 $ 393 $ 458 $ 2,106 Gas Distribution $ 177 $ 152 $ 181 $ 177 $ 193 $ 212 $ 915 New Customers 45 45 40 36 36 35 192 Other 88 60 53 53 49 44 259 Gas Base Capital $ 310 $ 257 $ 274 $ 266 $ 278 $ 291 $ 1,366 Total Base Capital $ 742 $ 692 $ 683 $ 677 $ 671 $ 749 $ 3,472 Investment Choices Environmental $ 292 $ 280 $ 200 $ 122 $ 114 $ 111 $ 827 Electric Reliability 102 156 208 108 129 133 734 Gas Infrastructure 117 182 198 178 202 211 971 New Gas Plant Capacity - - - 155 10 100 265 Renewables 83 163 9 - - - 172 Consumers Smart Energy 66 84 134 175 120 - 513 Ludington Hydro & other 62 90 55 58 56 145 404 Total Choices $ 722 $ 955 $ 804 $ 796 $ 631 $ 700 $ 3,886 Total Utility $ 1,464 $ 1,647 $ 1,487 $ 1,473 $ 1,302 $ 1,449 $ 7,358 25 |
|
|
GAAP Reconciliation |
|
|
27 2003 2004 2005 2006 2007 2008 2009 2010 2011 2012 2013 Reported earnings (loss) per share - GAAP ($0.30) $0.64 ($0.44) ($0.41) ($1.02) $1.20 $0.91 $1.28 $1.58 $1.42 $1.66 After-tax items: Electric and gas utility 0.21 (0.39) - - (0.07) 0.05 0.33 0.03 - 0.17 - Enterprises 0.74 0.62 0.04 (0.02) 1.25 (0.02) 0.09 (0.03) (0.11) (0.01) * Corporate interest and other 0.16 (0.03) 0.04 0.27 (0.32) (0.02) 0.01 * (0.01) * * Discontinued operations (income) loss (0.16) 0.02 (0.07) (0.03) 0.40 (*) (0.08) 0.08 (0.01) (0.03) * Asset impairment charges, net - - 1.82 0.76 0.60 - - - - - - Cumulative accounting changes 0.16 0.01 - - - - - - - - - Adjusted earnings per share, including MTM - non-GAAP $0.81 $0.87 $1.39 $0.57 $0.84 $1.21 (a) $1.26 $1.36 $1.45 $1.55 $1.66 Mark-to-market impacts 0.03 (0.43) 0.51 Adjusted earnings per share, excluding MTM - non-GAAP NA $0.90 $0.96 $1.08 NA NA NA NA NA NA NA * Less than $500 thousand or $0.01 per share. (a) $1.25 excluding discontinued Exeter operations and accounting changes related to convertible debt and restricted stock. Earnings Per Share By Year GAAP Reconciliation (Unaudited) |
|
|
28 2012 2013 2014 2015 2016 2017 2018 Consumers Operating Income + Depreciation & Amortization 1,635 $ (a) 1,740 $ 1,820 $ 1,876 $ 1,952 $ 2,054 $ 2,162 $ Enterprises Project Cash Flows 17 16 25 30 28 35 36 Gross Operating Cash Flow 1,652 $ 1,756 $ 1,845 $ 1,906 $ 1,980 $ 2,089 $ 2,198 $ (411) (335) (395) (356) (730) (739) (748) Net cash provided by operating activities 1,241 $ 1,421 $ 1,450 $ 1,550 $ 1,250 $ 1,350 $ 1,450 $ (a) excludes $(59) million 2012 disallowance related to electric decoupling CMS Energy Reconciliation of Gross Operating Cash Flow to GAAP Operating Activities (unaudited) (mils) Other operating activities including taxes, interest payments and working capital |