Attached files

file filename
8-K - FORM 8-K DATED MAY 8, 2014 - AmREIT, Inc.amreit141740_8k.htm


(GRAPHIC)


(GRAPHIC)


AMREIT’S
STRATEGY: Building the Irreplaceable Corner Company

HIGHEST QUALITY PORTFOLIO

EXCEPTIONAL GROWTH PEER LEADING VALUE CREATION

AMREIT’S

LOCAL

IRREPLACEABLE CORE

SHARPSHOOTER

REDEVELOPMENT

ADVANTAGE CORNER

PORTFOLIO

VERTICAL INSTITUTIONAL

JOINT VENTURE MIXED‐USE

PIPELINE NYSE LISTED: AMRE REDEVELOPMENT

2


(GRAPHIC)


LOCAL

CORE

SHARPSHOOTER

REDEVELOPMENT

ADVANTAGE

AMREIT HAS THE
HIGHEST QUALITY PORTFOLIO AMREIT’S

IRREPLACEABLE

CORNER

IN THE REAL
ESTATE SPACE: Platform PORTFOLIO

INSTITUTIONAL VERTICAL JOINT
VENTURE MIXED‐USE

PIPELINE REDEVELOPMENT

$1.1 BILLION PLATFORM OF
IRREPLACEABLE CORNERS

•
30‐YEAR‐OLD
COMPANY $490 MILLION

•
MANAGEMENT TEAM

NYSE: OWNS 8.5% OF THE

STOCK

AMRE

•
HALF OF OUR G&A IS $610
MILLION COVERED BY FEES FROM

INSTITUTIONAL JOINT VENTURES

3


(GRAPHIC)


LOCAL

CORE

SHARPSHOOTER

REDEVELOPMENT

ADVANTAGE

AMREIT HAS THE
HIGHEST QUALITY PORTFOLIO AMREIT’S

IRREPLACEABLE

CORNER

IN THE REAL
ESTATE SPACE: Top Texas Portfolio PORTFOLIO

INSTITUTIONAL VERTICAL JOINT
VENTURE MIXED‐USE

PIPELINE REDEVELOPMENT

LOCAL
EXPERTISE IN 5 FAST GROWING, AFFLUENT, DENSE SUBMARKETS FOCUSED ON 5 OF THE TOP
20 GROWTH MARKETS IN THE US

STRONG LOCAL
RELATIONSHIPS

OVER 50% OF
ACQUISITION TRANSACTIONS HAVE BEEN OFF MARKET

DALLAS

ATLANTA

SAN ANTONIO/AUSTIN

HOUSTON

4


(GRAPHIC)


LOCAL

CORE

SHARPSHOOTER

REDEVELOPMENT

ADVANTAGE

AMREIT HAS THE HIGHEST
QUALITY PORTFOLIO IN AMREIT’S


IRREPLACEABLE

CORNER

THE REAL ESTATE SPACE: Peer
Leading Demographics PORTFOLIO

INSTITUTIONAL VERTICAL JOINT
VENTURE MIXED‐USE

PIPELINE REDEVELOPMENT

$140,000

$130,000

*
$120,000 AMRE mile Radius $110,000

UBA

BFS $100,000 FRT

REG ousehold Income in a 1- $90,000

AAT

H

AKR EQY

Average $80,000

Shopping Center Avg. WRI $70,000

$60,000

25,000 30,000 35,000 40,000
45,000 50,000 55,000

Households in a 3-mile
Radius*

*Source: The Nielsen Company
and Form 10-K for the year ended December 31, 2013. Demographics for AmREIT and
selected public peer group reflect only retail and shopping center assets that
are consolidated operating properties as of December 31, 2013. Excludes any
properties in development. Does not reflect the properties in AKR’s Opportunity
Funds I through III, in which AKR owns between 20.0% to 22.2%. Information
represents a weighted average household income in a 1-mile radius for each
property owned by each respective company, as well as a weighted average number
of households in a 3-mile radius. Averages are weighted by GLA of consolidated
operating properties.

5


(GRAPHIC)


LOCAL

CORE

SHARPSHOOTER

REDEVELOPMENT

ADVANTAGE

AMREIT’S IRREPLACEABLE

EXCEPTIONAL GROWTH: Local
Sharpshooter Advantage CORNER


PORTFOLIO

INSTITUTIONAL VERTICAL JOINT
VENTURE MIXED‐USE

PIPELINE REDEVELOPMENT

CASE STUDY – PRESTON ROYAL
VILLAGE

#2 Ranked Shopping center in
Dallas purchased off‐market in Dec. 2012

•
Demographics

•
$193,351 – HHI in 1‐mile
radius

•
42,216 Households 3‐mile
radius

•
Base Rent per Square Foot

•
Today ‐$25/Square Foot
Snap Kitchen signed a

•
Market ‐$32/Square Foot
lease in the 4th Qtr. 2013 at $40psf. A 45% lift in $5,400,000 rent over the prior rent

$5,200,000

$5,000,000

$4,800,000 $4,600,000
$4,400,000 $4,200,000

$4,000,000

2013 2014 2015 2016 2017

6


(GRAPHIC)


(GRAPHIC)


LOCAL

CORE

SHARPSHOOTER

REDEVELOPMENT

ADVANTAGE

AMREIT’S IRREPLACEABLE

EXCEPTIONAL GROWTH: Local
Sharpshooter Advantage CORNER


PORTFOLIO

INSTITUTIONAL VERTICAL JOINT
VENTURE MIXED‐USE

PIPELINE REDEVELOPMENT

8


(GRAPHIC)


LOCAL

CORE

SHARPSHOOTER

REDEVELOPMENT

ADVANTAGE

AMREIT’S IRREPLACEABLE

EXCEPTIONAL GROWTH: Local
Sharpshooter Advantage CORNER


PORTFOLIO

INSTITUTIONAL VERTICAL JOINT
VENTURE MIXED‐USE

PIPELINE REDEVELOPMENT

9


(GRAPHIC)


LOCAL

CORE

SHARPSHOOTER

REDEVELOPMENT

ADVANTAGE

AMREIT’S IRREPLACEABLE

EXCEPTIONAL GROWTH: Institutional Joint Venture Pipeline CORNER

PORTFOLIO

INSTITUTIONAL VERTICAL JOINT
VENTURE MIXED‐USE

PIPELINE REDEVELOPMENT

$490 MILLION

Shadow Creek
Ranch

Market at Lake
Houston Town Center

NYSE: AMRE

Lantern Lane

Preston Towne
Crossing $610 MILLION

Woodlake
Square

Casa Linda
Plaza

10


(GRAPHIC)


LOCAL

CORE

SHARPSHOOTER

REDEVELOPMENT

ADVANTAGE

AMREIT’S IRREPLACEABLE

PEER LEADING VALUE CREATION: Core Redevelopment CORNER


PORTFOLIO

INSTITUTIONAL VERTICAL JOINT
VENTURE MIXED‐USE

PIPELINE REDEVELOPMENT

Fountain Oaks Case Study

• Demographics

• $108,568 Average Household Income – 1‐mile radius

• 32,343 Households – 3‐mile radius

• Purchased in June 2013 for $27.7 million, BEFORE
EXPANSION or a 5.9% cap rate

• Kroger lease expanded from 4 years to 10 years during
due diligence

• Kroger expansion opportunity:

• Kroger expands from 60,000 square feet to 90,000 square
feet, at an estimated cost of $7.5 million

• 8.25% return on incremental costs

AFTER
EXPANSION

• New 20 year corporate lease with Kroger

11


(GRAPHIC)


LOCAL

CORE

SHARPSHOOTER

REDEVELOPMENT

ADVANTAGE

PEER LEADING VALUE CREATION: Vertical Mixed‐Use AMREIT’S


IRREPLACEABLE

CORNER

Redevelopment PORTFOLIO

INSTITUTIONAL VERTICAL JOINT
VENTURE MIXED‐USE

PIPELINE REDEVELOPMENT

12


(GRAPHIC)


LOCAL

CORE

SHARPSHOOTER

REDEVELOPMENT

ADVANTAGE

PEER LEADING VALUE CREATION: Vertical Mixed‐Use AMREIT’S


IRREPLACEABLE

CORNER

Redevelopment PORTFOLIO

INSTITUTIONAL VERTICAL JOINT
VENTURE MIXED‐USE

PIPELINE REDEVELOPMENT

The Baker
Building site today generates $350,000 in NOI per year.

13


(GRAPHIC)


LOCAL

CORE

SHARPSHOOTER

REDEVELOPMENT

ADVANTAGE

PEER LEADING VALUE CREATION: Vertical Mixed‐Use AMREIT’S


IRREPLACEABLE

CORNER

Redevelopment PORTFOLIO

INSTITUTIONAL VERTICAL JOINT
VENTURE MIXED‐USE

PIPELINE REDEVELOPMENT

Uptown Park
Baker Building Site

14


(GRAPHIC)


LOCAL

CORE

SHARPSHOOTER

REDEVELOPMENT

ADVANTAGE

PEER LEADING VALUE CREATION: Vertical Mixed‐Use AMREIT’S


IRREPLACEABLE

CORNER

Redevelopment PORTFOLIO

INSTITUTIONAL VERTICAL JOINT
VENTURE MIXED‐USE

PIPELINE REDEVELOPMENT

Once ground
lease is executed on the Baker Building site, the NOI will increase $500,000 to
$850,000, which results in a

net increase in value of $10
Million.(1)

(1) $850,000 NOI ‐$350,000
existing NOI / 5% Cap = $10 Million net value creation

GROUND LEASE

15


(GRAPHIC)


LOCAL

CORE

SHARPSHOOTER

REDEVELOPMENT

ADVANTAGE

PEER LEADING VALUE CREATION: Vertical Mixed‐Use AMREIT’S


IRREPLACEABLE

CORNER

Redevelopment PORTFOLIO

INSTITUTIONAL VERTICAL JOINT
VENTURE MIXED‐USE

PIPELINE REDEVELOPMENT

First of 7
sites at Uptown Park Campus potentially creates

$16 Million

in net value
for shareholders.

Net Value

Capital

Return Creation

Invested

RETAIL

$12 $900,000

$6 Million
Million NOI/Yr.(1)

UNDERGROUND PARKING

$850,000 $10

GROUND LEASE $0

NOI/Yr. (2) Million

(1) $900,000 NOI / 5% Cap ‐$12
Million = $6 Million net value creation

(2) $850,000 NOI ‐$350,000
existing NOI / 5% Cap = $10 Million net value creation Total Net Value Creation $16 Million

16


(GRAPHIC)


LOCAL

CORE

SHARPSHOOTER

REDEVELOPMENT

ADVANTAGE

PEER LEADING VALUE CREATION: Vertical Mixed‐Use AMREIT’S


IRREPLACEABLE

CORNER

Redevelopment PORTFOLIO

INSTITUTIONAL VERTICAL JOINT
VENTURE MIXED‐USE

PIPELINE REDEVELOPMENT

With a GP Interest in the
Vertical Improvements value creation grows to

POTENTIAL GP INTEREST IN $20.6 Million. VERTICAL IMPROVEMENTS

Capital Current Net Value
Invested Return Creation

$4.8 $4.6
Million (3) Million

RETAIL

$12 $900,000

$6 Million
Million NOI/Yr.(1)

UNDERGROUND PARKING

$850,000 $10

GROUND LEASE $0

NOI/Yr.
Million

(1) $900,000 NOI / 5% Cap ‐$12
Million = $6 Million net value creation

(2) $850,000 NOI ‐$350,000
existing NOI / 5% Cap = $10 Million net value creation $20.6 Million (3) Represents 50% of the GP &15% interest in the vertical
improvements TOTAL NET VALUE
CREATION

17


(GRAPHIC)


LOCAL

CORE

SHARPSHOOTER

REDEVELOPMENT

ADVANTAGE

PEER LEADING VALUE CREATION: Vertical Mixed‐Use AMREIT’S


IRREPLACEABLE

CORNER

Redevelopment PORTFOLIO

INSTITUTIONAL VERTICAL JOINT
VENTURE MIXED‐USE

PIPELINE REDEVELOPMENT

Uptown Park – Ground Lease
NOI to Build Value

$9,000,000
$8,000,000 $7,000,000 $6,000,000

$5,000,000 $100 MM $4,000,000 IN VALUE

$3,000,000
$2,000,000 $1,000,000

$0

BAKER PHASE 2
PHASE 3 PHASE 4 PHASE 5 PHASE 6 PHASE 7

•
Seven development sites on
Uptown Park will fuel redevelopment over the next 7‐10 years

•
Anticipated $100 million value
creation through ground lease alone

•
Security of unsubordinated
ground lease structure (superior risk adjusted returns)

18


(GRAPHIC)


LOCAL

CORE

SHARPSHOOTER

REDEVELOPMENT

ADVANTAGE

AMREIT HAS THE
HIGHEST QUALITY PORTFOLIO AMREIT’S

IRREPLACEABLE

CORNER

PORTFOLIO

IN THE REAL
ESTATE SPACE: Strong Balance Sheet INSTITUTIONAL VERTICAL

JOINT VENTURE MIXED‐USE


PIPELINE REDEVELOPMENT

Debt Maturity Schedule ($MM)

$80,000,000 8% 8%

$70,000,000 7%

$60,000,000 6%

ount 5.39% In

$50,000,000 5%

Am 4.69% 4.65% 4.54%

4.30% terest

$40,000,000 4%

3.21% Rate rincipal $30,000,000 3%

P

$20,000,000 2%

$10,000,000 1%

N/A N/A N/A $‐0% 2014 2015 2016 2017 2018 2019 2020
2021 2022 2023

•
35% Net Debt to Capitalization

•
100% Fixed Rate Debt

•
4.6% Average Interest Rate

19


(GRAPHIC)


LOCAL

CORE

SHARPSHOOTER

REDEVELOPMENT

ADVANTAGE

AMREIT HAS THE HIGHEST
QUALITY PORTFOLIO IN AMREIT’S


IRREPLACEABLE

CORNER

THE REAL ESTATE SPACE:
Superior Operating Results PORTFOLIO

INSTITUTIONAL VERTICAL JOINT
VENTURE MIXED‐USE

PIPELINE REDEVELOPMENT

Same Store NOI Growth Re‐leasing
Spreads

2010 through 2013 2010
through 2013

8% 4.0%

6.8%

3.5% 7%

3.2%

3.0% 6%

2.5% 5%

2.2%

3.8%

2.0% 4% 1.5% 3% 1.0% 2% 0.5%
1%

0.0% 0%

AMRE PEER AVERAGE AMRE PEER
AVERAGE

*Peers include
FRT, AKR, WRI, BFS, AAT, REG, EQY, UBA

20


(GRAPHIC)


LOCAL

CORE

SHARPSHOOTER

REDEVELOPMENT

ADVANTAGE

AMREIT HAS THE
HIGHEST QUALITY PORTFOLIO AMREIT’S

IRREPLACEABLE

CORNER

IN THE REAL
ESTATE SPACE: CAGR PORTFOLIO

INSTITUTIONAL VERTICAL JOINT
VENTURE MIXED‐USE

PIPELINE REDEVELOPMENT

$55,000,000

9% CAGR‐AMRE

$50,000,000

$45,000,000

$40,000,000 4.2% Peer Average over 5 years

$35,000,000 $30,000,000
$25,000,000

$20,000,000

2013 2014 2015
2016 2017 2018

NOI - Baseline Same Store
NOI Growth Acquisitions NOI-Cumulative Redevelopment NOI

21


(GRAPHIC)


LOCAL

CORE

SHARPSHOOTER

REDEVELOPMENT

ADVANTAGE

AMREIT HAS THE HIGHEST
QUALITY PORTFOLIO IN THE AMREIT’S


IRREPLACEABLE

CORNER

REAL ESTATE SPACE: Cost of
Capital Using CAGR PORTFOLIO

INSTITUTIONAL VERTICAL JOINT
VENTURE MIXED‐USE

PIPELINE REDEVELOPMENT

10.0%

8.93% AMRE

9.0% Due to our discount to NAV,

8.63%

8.34% AmREIT’s initial cost of capital is 8.0%
7.55% about 100 basis points higher

7.33%

7.12% than our peers. However,

6.91%

7.0% 6.71% based on the CAGR of our NOI

6.63% as shown in the previous slide,

6.25%

6.0% 5.69% our return on investment is approximately 150 basis points 5.0% higher than our peers over a five year
period, giving us a 4.0% strategic
advantage.

YEAR 1 YEAR 2
YEAR 3 YEAR 4 YEAR 5

TYPICAL REIT
AMRE BLENDED COST OF CAPITAL

22


(GRAPHIC)


LOCAL

CORE

SHARPSHOOTER

REDEVELOPMENT

ADVANTAGE

AMREIT HAS THE HIGHEST
QUALITY PORTFOLIO IN AMREIT’S


IRREPLACEABLE

CORNER

THE REAL ESTATE SPACE: Peer
Leading Demographics PORTFOLIO

INSTITUTIONAL VERTICAL JOINT
VENTURE MIXED‐USE

PIPELINE REDEVELOPMENT

$140,000

$130,000

*
$120,000 AMRE mile Radius $110,000

UBA

BFS $100,000 FRT

REG ousehold Income in a 1- $90,000

AAT

H

AKR EQY

Average $80,000

Shopping Center Avg. WRI $70,000

$60,000

25,000 30,000 35,000 40,000
45,000 50,000 55,000

Households in a 3-mile
Radius*

*Source: The Nielsen Company
and Form 10-K for the year ended December 31, 2013. Demographics for AmREIT and
selected public peer group reflect only retail and shopping center assets that
are consolidated operating properties as of December 31, 2013. Excludes any
properties in development. Does not reflect the properties in AKR’s Opportunity
Funds I through III, in which AKR owns between 20.0% to 22.2%. Information
represents a weighted average household income in a 1-mile radius for each
property owned by each respective company, as well as a weighted average number
of households in a 3-mile radius. Averages are weighted by GLA of consolidated
operating properties.

23


(GRAPHIC)


LOCAL

CORE

SHARPSHOOTER

REDEVELOPMENT

ADVANTAGE

AMREIT HAS THE HIGHEST
QUALITY PORTFOLIO IN THE AMREIT’S


IRREPLACEABLE

CORNER

REAL ESTATE SPACE: Summary PORTFOLIO

INSTITUTIONAL VERTICAL JOINT
VENTURE MIXED‐USE

PIPELINE REDEVELOPMENT

AMREIT’S IRREPLACEABLE

CORNER HIGHEST QUALITY CORE PORTFOLIO IN THE REAL
ESTATE SPACE

PORTFOLIO

LOCAL 30 YEAR OLD COMPANY WITH AN EXPERIENCED TEAM
OF LOCAL

SHARPSHOOTER

ADVANTAGE SHARPSHOOTERS ALIGNED WITH SHAREHOLDERS

INSTITUTIONAL EXCEPTIONAL GROWTH WITH WORLD CLASS
INSTITUTIONAL

JOINT VENTURE

PIPELINE PARTNERS

PEER LEADING VALUE CREATION
WITH CORE REDEVELOPMENT

CORE REDEVELOPMENT

CAPABILITIES

VERTICAL MIXED‐PEER LEADING VALUE CREATION WITH VERTICAL
MIXED‐USE

USE

REDEVELOPMENT OPPORTUNITIES

24


(GRAPHIC)


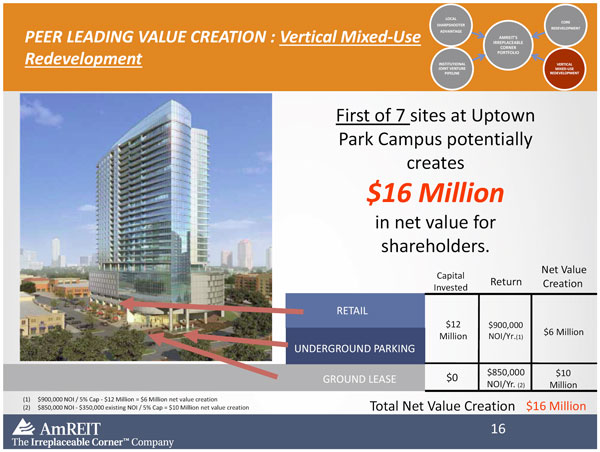
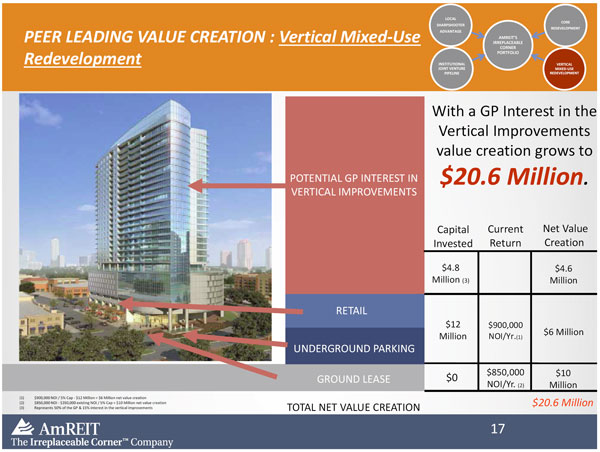
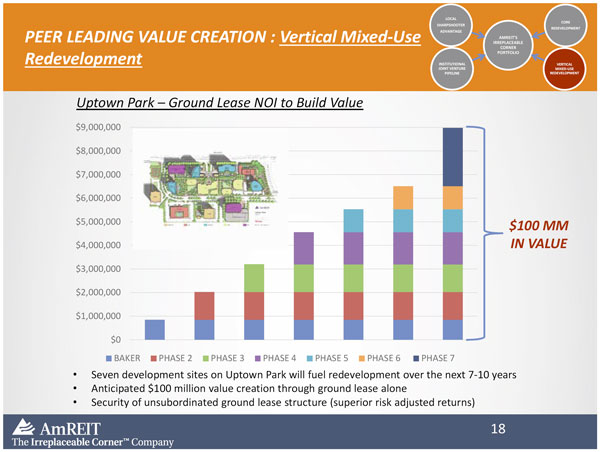
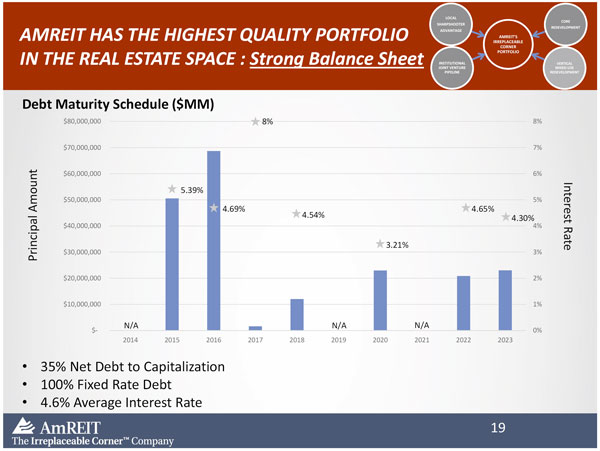
FORWARD LOOKING STATEMENTS

Cautionary Statement
Regarding Forward‐Looking Statements

These materials contain
“forward‐looking statements” within the meaning of Section 27A of the
Securities Act of 1933, as amended, or the Securities Act, and Section 21E of
the Securities Exchange Act of 1934, or the Exchange Act. Forward‐looking
statements provide the Company’s current expectations or
forecasts of future events and are not statements of historical fact. These
forward‐looking statements include information about possible or assumed
future events, including, among other things, discussion and analysis of the
Company’s future financial condition, results of operations, the Company’s
strategic plans and objectives, occupancy and leasing rates and trends, amounts
of anticipated cash distributions to stockholders in the future and other
matters. Words such as “anticipates,” “expects,” “intends,” “plans,”
“believes,” “seeks,” “estimates” and variations of these words and other similar
expressions are intended to identify forward‐looking statements. These
statements are not guarantees of future performance and are subject to risks,
uncertainties and other factors, some of which are beyond the Company’s
control, are difficult to predict and/or could cause actual results to differ
materially from those expressed or forecasted in the forward‐looking
statements.

Forward‐looking
statements involve inherent uncertainty and may ultimately prove to be
incorrect or false. You are cautioned to not place undue reliance on forward‐looking
statements. Except as otherwise may be required by law, the Company undertakes
no obligation to update or revise forward‐looking statements to reflect
changed assumptions, the occurrence of unanticipated events or actual operating
results. The Company’s actual results could differ materially from those
anticipated in these forward‐looking statements as a result of various
factors, including, but not limited to:

•
Risks and uncertainties related
to the recent economic recession, the national and local economies, and the
real estate industry in general and in the Company’s specific markets
(including the state of Texas, generally, and the Company’s core markets of
Houston, Dallas, San Antonio and Austin, specifically);volatility in the
capital markets;rising interest and insurance rates;competition from third‐party
owners and operators of retail real estate and the Company’s inability to
obtain new tenants on favorable terms, or at all, upon the expiration of
existing leases;availability and terms of capital and financing, both to fund
operations and to refinance indebtedness as it matures;legislative or
regulatory changes, including changes to real estate, zoning and construction
laws;a possible failure to maintain the Company’s status as a REIT and the
risk of changes in laws governing REITs;the Company’s dependence upon key
personnel whose continued service is not guaranteed;the Company’s ability to
identify, hire and retain highly qualified executives in the future;
availability of appropriate acquisition, development and redevelopment
opportunities;failure to integrate acquisitions successfully;the financial
condition and liquidity of, or disputes with, joint venture and development
partners;impact of ad valorem, property and income taxes;changes in generally
accepted accounting principles;construction delays, increasing construction
costs or construction costs that exceed estimates;potential liability for
uninsured losses and environmental liabilities;lease‐up risks;and the
potential need to fund improvements or other capital expenditures out of
operating cash flow.

This list of risks and
uncertainties, however, is only a summary of some of the most important factors
and is not intended to be exhaustive. You should carefully read the section
entitled “Risk Factors” in our various Company documents filed with the SEC.
New risks and uncertainties may also emerge from time to time that could
materially and adversely affect the Company. All forward‐looking statements
are based on information available to the Company on this date and the Company
assumes no obligation to update or revise any forward‐looking statements,
whether as a result of new information, future events or otherwise.

25