Attached files
| file | filename |
|---|---|
| 8-K - 8-K - Transocean Ltd. | may2014qearnings8-kcoversh.htm |
llllllllllllllllllllllllllllllllllllllllll | |
Transocean Ltd. | |
Investor Relations and Corporate Communications | |
 | |
lllllllllllllllllllllllllllllllllllllllllllllllllllllllllllll | |
Analyst Contacts: | Thad Vayda +1 713-232-7551 | News Release | |
Diane Vento +1 713-232-8015 | |||
Media Contact: | Chris Kettmann +1 713-232-7647 | FOR RELEASE: May 7, 2014 | |
TRANSOCEAN LTD. REPORTS FIRST QUARTER 2014 RESULTS
• | Revenues were $2.339 billion, compared with $2.252 billion in the fourth quarter of 2013; |
• | Operating and maintenance expenses were $1.269 billion, compared with $1.461 billion in the fourth quarter of 2013; |
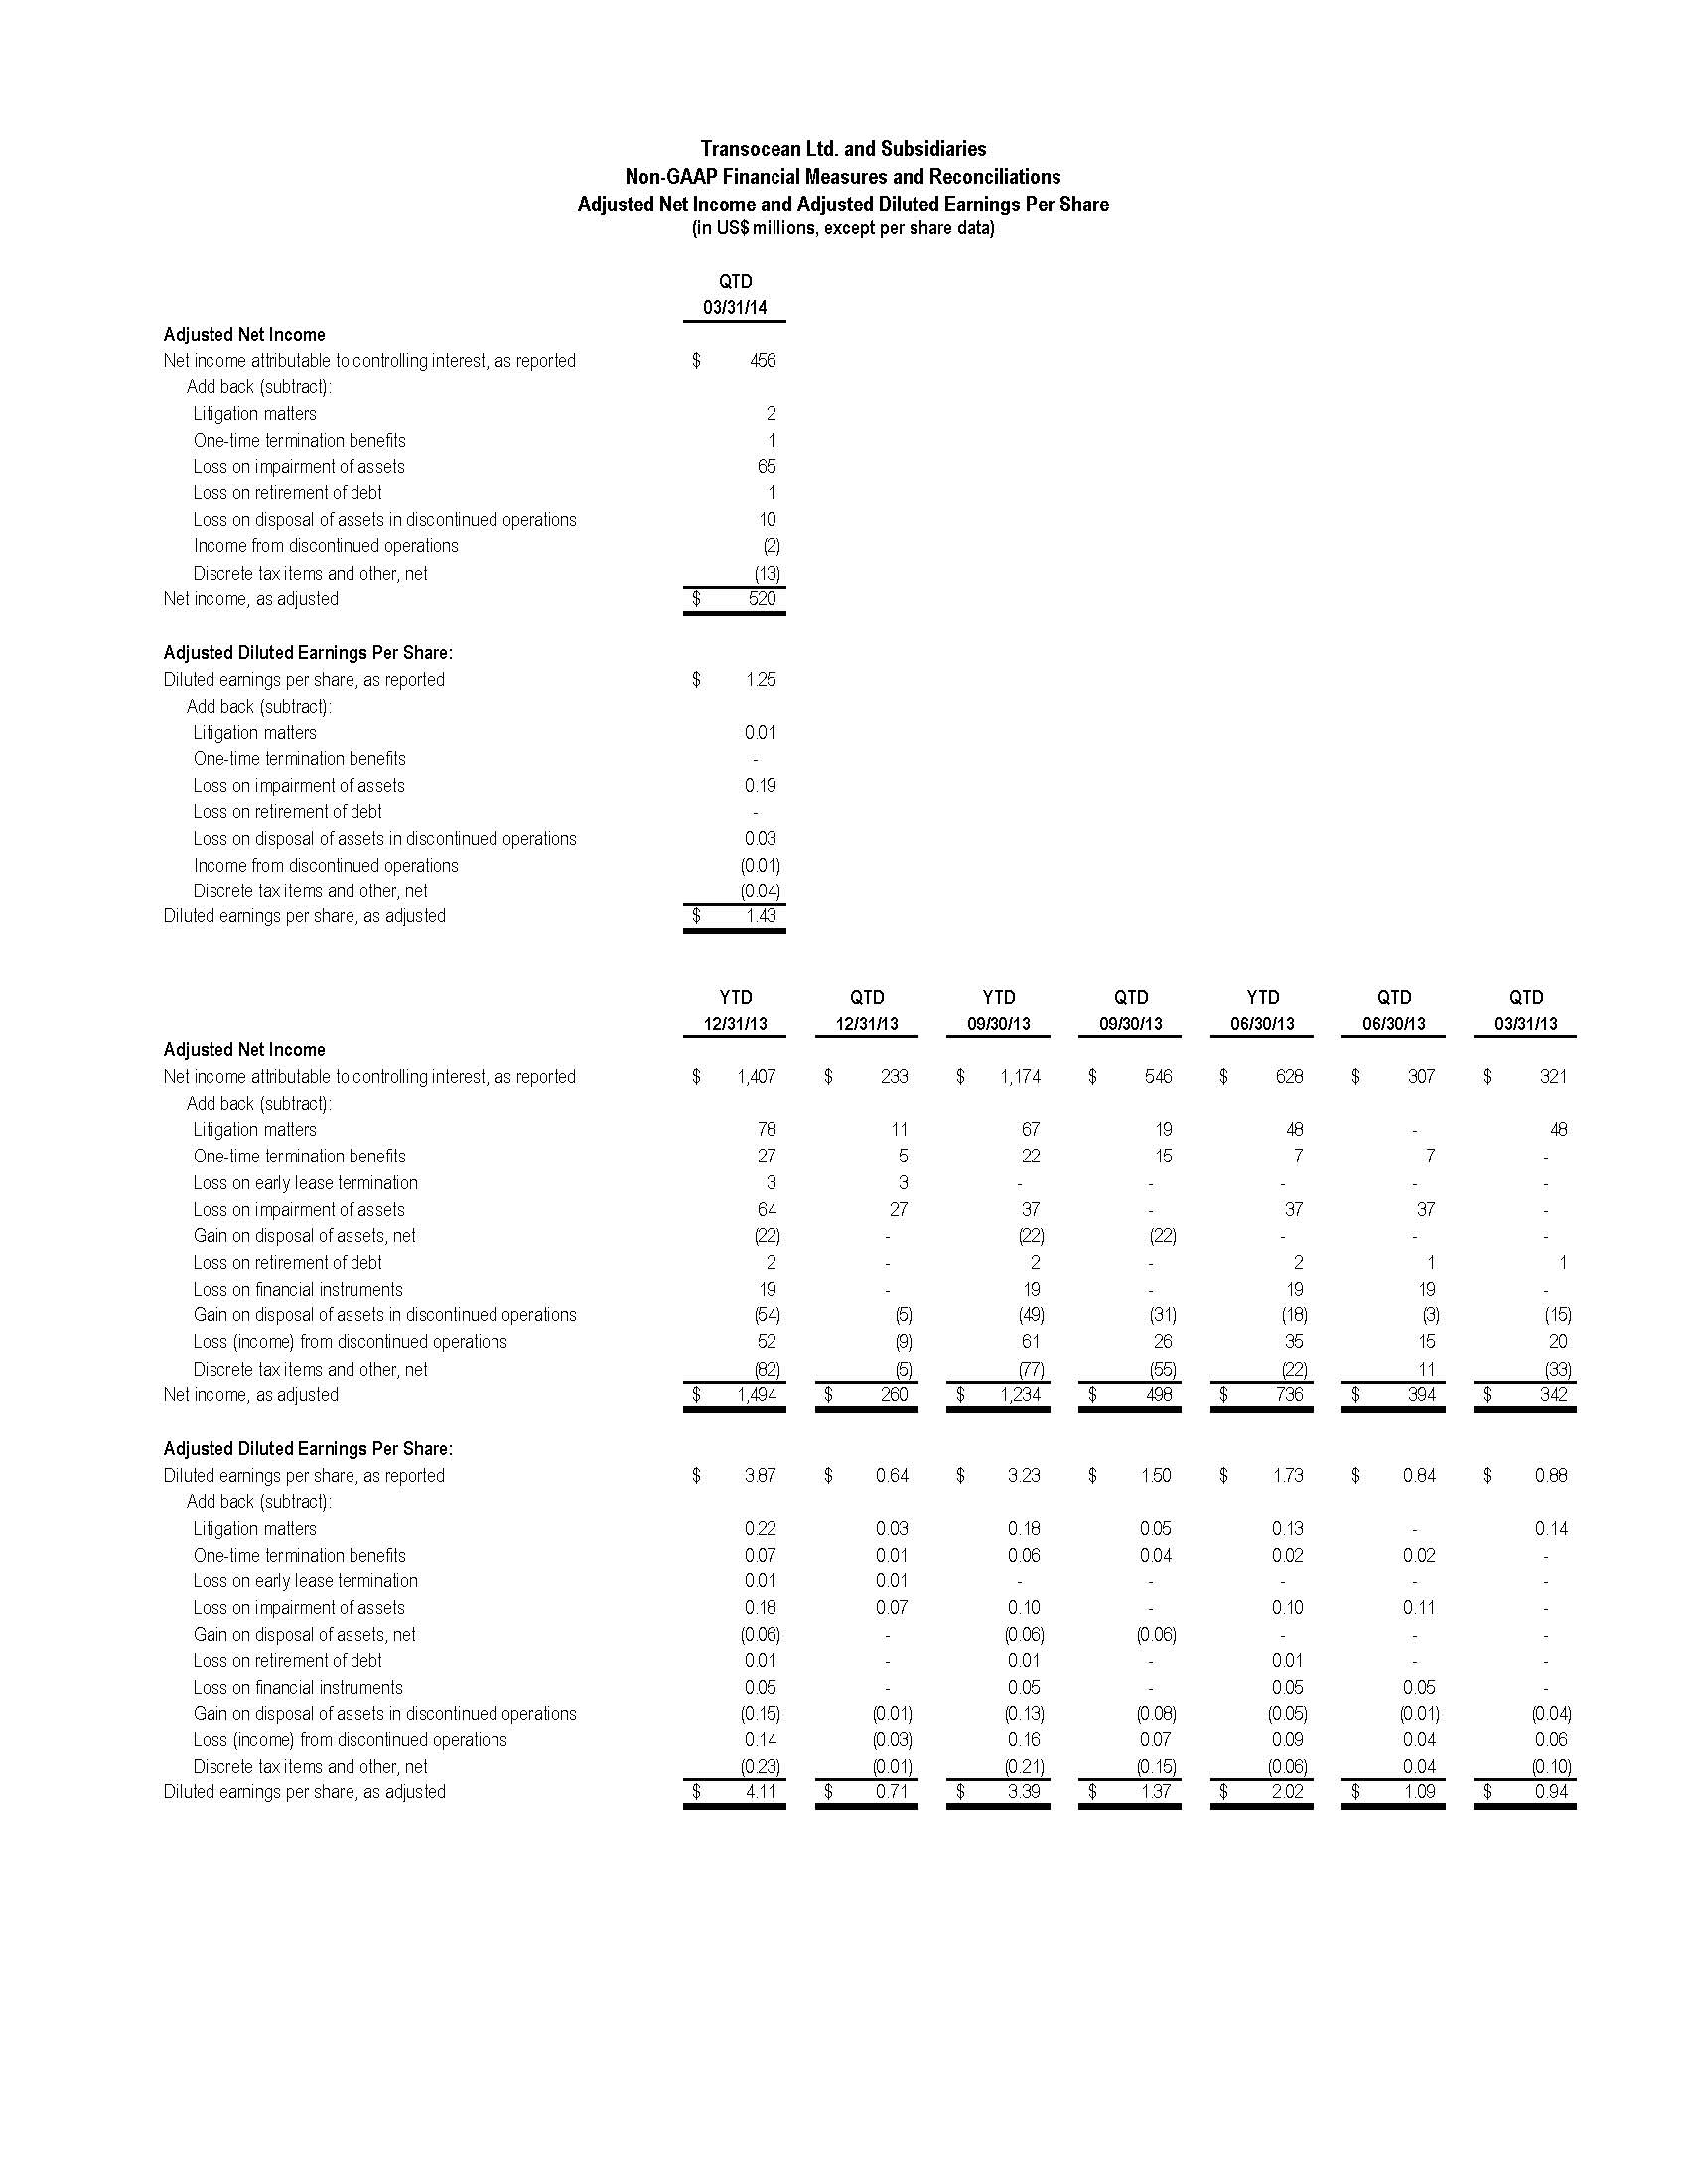
• | Net income attributable to controlling interest was $456 million, which included $64 million of net unfavorable items. This compares with the fourth quarter 2013 net income attributable to controlling interest of $233 million, which included $27 million of net unfavorable items; |
• | The Annual Effective Tax Rate(1) from continuing operations was 15.1 percent, compared with 17.7 percent in the fourth quarter of 2013; |
• | Net income attributable to controlling interest was $456 million, or $1.25 per diluted share. After adjusting for net unfavorable items, adjusted earnings from continuing operations were $520 million, or $1.43 per diluted share; |
• | Cash flows from operating activities were $136 million in the first quarter, compared with $773 million in the fourth quarter of 2013; |
• | Fleet revenue efficiency(2) was 95.7 percent in the first quarter, compared with 91.7 percent in the fourth quarter of 2013. Revenue efficiency on ultra-deepwater rigs was 96.4 percent, compared with 90.0 percent in the prior quarter; |
• | Fleet utilization(3) was 78 percent, compared with 75 percent in the prior quarter; |
• | Contract backlog was $26.1 billion as of the April 17, 2014 Fleet Status Report. Since this report, additional contracts totaling $470 million were secured; and |
• | The company completed the sale of Applied Drilling Technology International Limited. As a result of the sale, the company has reclassified the results of operations of this segment to discontinued operations for all periods presented. |
ZUG, SWITZERLAND-May 7, 2014-Transocean Ltd. (NYSE: RIG) (SIX: RIGN) today reported net income attributable to controlling interest of $456 million, or $1.25 per diluted share, for the three months ended March 31, 2014. First quarter 2014 results included net unfavorable items of $64 million, or $0.18 per diluted share, as follows:
• | $65 million, or $0.19 per diluted share, in impairments of assets classified as held for sale; |
• | $8 million, or $0.02 per diluted share, in net losses from discontinued operations; and |
• | $4 million, or $0.01 per diluted share, related to an unfavorable adjustment in contingencies associated with the Macondo well incident, and other miscellaneous items. |
These net unfavorable items were partially offset by:
• | $13 million, or $0.04 per diluted share, in favorable discrete tax benefits. |
After consideration of these net unfavorable items, first quarter 2014 adjusted earnings from continuing operations were $520 million, or $1.43 per diluted share.
For the three months ended March 31, 2013 the company reported net income attributable to controlling interest of $321 million, or $0.88 per diluted share, which included net unfavorable items of $21 million, or $0.06 per diluted share. The net unfavorable items were due primarily to $48 million, or $0.14 per diluted share, associated with contingencies related to the Macondo well incident, partly offset by $33 million, or $0.10 per diluted share related to favorable discrete tax items. After consideration of these net unfavorable items, first quarter 2013 adjusted earnings from continuing operations were $342 million, or $0.94 per diluted share. A reconciliation of the non-GAAP adjusted net income and diluted earnings per share is included in the accompanying schedules.
Revenues for the three months ended March 31, 2014 were $2.339 billion, compared with revenues of $2.252 billion during the quarter ended December 31, 2013. Contract drilling revenues increased $90 million due primarily to higher revenue efficiency and fleet utilization. Total fleet revenue efficiency was 95.7 percent in the first quarter, compared with 91.7 percent in the fourth quarter of 2013. Ultra-deepwater revenue efficiency was 96.4 percent, compared with 90.0 percent in the prior quarter. Fleet utilization was 78 percent in the first quarter reflecting lower out-of-service days offset by increased idle time, compared with fleet utilization of 75 percent in the prior quarter. Other Revenues decreased $3 million to $47 million, compared with $50 million in the fourth quarter of 2013.
Operating and maintenance expenses decreased $192 million to $1.269 billion, compared with $1.461 billion for the prior quarter. The decrease primarily reflects lower shipyard and maintenance costs and the effect of the company’s cost reduction initiatives.
General and administrative expenses decreased $18 million to $57 million for the first quarter of 2014, compared with $75 million in the previous quarter. The decrease was due mainly to personnel costs and professional fees incurred in the fourth quarter of 2013 that were not repeated.
Transocean’s first quarter Effective Tax Rate(4) was 14.4 percent, compared with 16.7 percent in the fourth quarter of 2013. The decrease was due to changes in the blend of income that is taxed based on gross revenues versus pre-tax income, rig movements between taxing jurisdictions, and changes in estimates primarily related to settlements of prior years’ tax liabilities. Transocean’s Annual Effective Tax Rate from continuing operations for the first quarter of 2014 was 15.1 percent. This compares with 17.7 percent for the prior quarter.
Interest expense, net of amounts capitalized, was $126 million in the first quarter of 2014, compared with $139 million in the prior quarter. Capitalized interest was $34 million, compared with $22 million in the fourth quarter of 2013. Interest income was $10 million, compared with $13 million in the fourth quarter of 2013.
Cash flows from operating activities decreased $637 million to $136 million, compared with $773 million for the fourth quarter of 2013. The decrease was due primarily to the payment of $472 million, including interest, related to the January 2013 agreement with the U.S. Department of Justice and other changes in working capital.
Capital expenditures increased $183 million to $1.1 billion, compared with $948 million in the fourth quarter of 2013. The increase in capital expenditures was primarily associated with the company’s newbuild program including shipyard milestone payments on the Deepwater Asgard and the Deepwater Invictus and initial deposits on the two ultra-deepwater drillships announced during the period.
Forward-Looking Statements
The statements described in this press release that are not historical facts are forward-looking statements within the meaning of Section 27A of the Securities Act of 1933 and Section 21E of the Securities Exchange Act of 1934. Forward-looking statements which could be made include, but are not limited to, estimated loss contingencies associated with the Macondo well incident and changes in tax estimates. These include but are not limited to operating hazards and delays, risks associated with international operations, actions by customers and other third parties, the future prices of oil and gas and other factors, including those discussed in the company's most recent Annual Report on Form 10-K for the year ended December 31, 2013, and in the company's other filings with the SEC, which are available free of charge on the SEC's website at www.sec.gov. Should one or more of these risks or uncertainties materialize (or the other consequences of such a development worsen), or should underlying assumptions prove incorrect, actual results may vary materially from those indicated or expressed or implied by such forward-looking statements. All subsequent written and oral forward-looking statements attributable to the company or to persons acting on our behalf are expressly qualified in their entirety by reference to these risks and uncertainties. You should not place undue reliance on forward-looking statements. Each forward-looking statement speaks only as of the date of the particular statement, and we undertake no obligation to publicly update or revise any forward-looking statements. All non-GAAP financial measure reconciliations to the most comparative GAAP measure are displayed in quantitative schedules on the company’s web site at www.deepwater.com.
This press release or referenced documents does not constitute an offer to sell, or a solicitation of an offer to buy, any securities, and it does not constitute an offering prospectus within the meaning of article 652a or article 1156 of the Swiss Code of Obligations or a listing prospectus within the meaning of the listing rules of the SIX Swiss Exchange. Investors must rely on their own evaluation of Transocean Ltd. and its securities, including the merits and risks involved. Nothing contained herein is, or shall be relied on as, a promise or representation as to the future performance of Transocean Ltd.
Conference Call Information
Transocean will conduct a teleconference call at 10:00 a.m. EDT, 4:00 p.m. CEST, on Thursday, May 8, 2014. To participate, dial +1 913-312-1513 and refer to confirmation code 9935570 approximately five to 10 minutes prior to the scheduled start time of the call.
In addition, the conference call will be simultaneously broadcast over the Internet in a listen-only
mode and can be accessed at Transocean’s website, www.deepwater.com, by selecting "Investor Relations/Overview." The conference call may also be accessed via the Internet at www.CompanyBoardroom.com by typing in Transocean's New York Stock Exchange trading symbol, "RIG." Supplemental materials that may be referenced during the conference call have been posted to Transocean's website and can be found by selecting "Investor Relations/Financial Reports."
A telephonic replay of the conference call will be available after 1:00 p.m. EDT, 7:00 p.m. CEST, on May 8, 2014, and can be accessed by dialing +1 719-457-0820 and referring to the confirmation code 9935570. Also, a replay will be available by visiting either of the aforementioned website addresses. The archived call will be available for approximately 30 days.
About Transocean
Transocean is a leading international provider of offshore contract drilling services for oil and gas wells. The company specializes in technically demanding sectors of the global offshore drilling business with a particular focus on deepwater and harsh environment drilling services, and believes that it operates one of the most versatile offshore drilling fleets in the world.
Transocean owns or has partial ownership interests in, and operates a fleet of, 78 mobile offshore drilling units consisting of 46 high-specification floaters (ultra-deepwater, deepwater and harsh environment drilling rigs), 21 midwater floaters and 11 high-specification jackups. In addition, the company has nine ultra-deepwater drillships and five high-specification jackups under construction.
For more information about Transocean, please visit the website www.deepwater.com.
Notes
(1) Annual Effective Tax Rate is defined as income tax expense from continuing operations excluding various discrete items (such as changes in estimates and tax on items excluded from income before income tax expense), divided by income from continuing operations before income tax expense excluding gains on sales and similar items pursuant to the accounting standards for income taxes. See the accompanying schedule entitled "Supplemental Effective Tax Rate Analysis."
(2) Revenue efficiency is defined as actual contract drilling revenues for the measurement period divided by the maximum revenue calculated for the measurement period, expressed as a percentage. Maximum revenue is defined as the greatest amount of contract drilling revenues the drilling unit could earn for the measurement period, excluding amounts related to incentive provisions. See the accompanying schedule entitled "Revenue Efficiency."
(3) Rig utilization is defined as the total number of operating days divided by the total number of rig calendar days in the measurement period, expressed as a percentage. See the accompanying schedule entitled "Utilization."
(4) Effective Tax Rate is defined as income tax expense for continuing operations divided by income from continuing operations before income taxes. See the accompanying schedule entitled "Supplemental Effective Tax Rate Analysis."
TRANSOCEAN LTD. AND SUBSIDIARIES
CONDENSED CONSOLIDATED STATEMENTS OF OPERATIONS
(In millions, except per share data)
(Unaudited)
Three months ended March 31, | ||||||||||
2014 | 2013 | |||||||||
Operating revenues | ||||||||||
Contract drilling revenues | $ | 2,292 | $ | 2,145 | ||||||
Other revenues | 47 | 39 | ||||||||
2,339 | 2,184 | |||||||||
Costs and expenses | ||||||||||
Operating and maintenance | 1,269 | 1,356 | ||||||||
Depreciation | 273 | 275 | ||||||||
General and administrative | 57 | 67 | ||||||||
1,599 | 1,698 | |||||||||
Loss on impairment | (65 | ) | — | |||||||
Loss on disposal of assets, net | (3 | ) | (7 | ) | ||||||
Operating income | 672 | 479 | ||||||||
Other income (expense), net | ||||||||||
Interest income | 10 | 17 | ||||||||
Interest expense, net of amounts capitalized | (126 | ) | (157 | ) | ||||||
Other, net | (2 | ) | (1 | ) | ||||||
(118 | ) | (141 | ) | |||||||
Income from continuing operations before income tax expense | 554 | 338 | ||||||||
Income tax expense | 80 | 20 | ||||||||
Income from continuing operations | 474 | 318 | ||||||||
Loss from discontinued operations, net of tax | (8 | ) | (5 | ) | ||||||
Net income | 466 | 313 | ||||||||
Net income (loss) attributable to noncontrolling interest | 10 | (8 | ) | |||||||
Net income attributable to controlling interest | $ | 456 | $ | 321 | ||||||
Earnings (loss) per share‑basic | ||||||||||
Earnings from continuing operations | $ | 1.27 | $ | 0.89 | ||||||
Loss from discontinued operations | (0.02 | ) | (0.01 | ) | ||||||
Earnings per share | $ | 1.25 | $ | 0.88 | ||||||
Weighted‑average shares outstanding | ||||||||||
Basic | 361 | 360 | ||||||||
Diluted | 361 | 360 | ||||||||
TRANSOCEAN LTD. AND SUBSIDIARIES
CONDENSED CONSOLIDATED BALANCE SHEETS
(In millions, except per share data)
(Unaudited)
March 31, 2014 | December 31, 2013 | |||||||||
Assets | ||||||||||
Cash and cash equivalents | $ | 1,987 | $ | 3,243 | ||||||
Accounts receivable, net of allowance for doubtful accounts of $14 at March 31, 2014 and December 31, 2013 | 2,217 | 2,162 | ||||||||
Materials and supplies, net of allowance for obsolescence of $84 and $80 at March 31, 2014 and December 31, 2013, respectively | 768 | 737 | ||||||||
Assets held for sale | 160 | 148 | ||||||||
Deferred income taxes, net | 155 | 151 | ||||||||
Other current assets | 346 | 331 | ||||||||
Total current assets | 5,633 | 6,772 | ||||||||
Property and equipment | 30,250 | 29,518 | ||||||||
Less accumulated depreciation | (7,897 | ) | (7,811 | ) | ||||||
Property and equipment, net | 22,353 | 21,707 | ||||||||
Goodwill | 2,987 | 2,987 | ||||||||
Other assets | 924 | 1,080 | ||||||||
Total assets | $ | 31,897 | $ | 32,546 | ||||||
Liabilities and equity | ||||||||||
Accounts payable | $ | 931 | $ | 1,106 | ||||||
Accrued income taxes | 74 | 53 | ||||||||
Debt due within one year | 162 | 323 | ||||||||
Other current liabilities | 1,596 | 2,072 | ||||||||
Total current liabilities | 2,763 | 3,554 | ||||||||
Long-term debt | 10,308 | 10,379 | ||||||||
Deferred income taxes, net | 368 | 374 | ||||||||
Other long‑term liabilities | 1,281 | 1,554 | ||||||||
Total long‑term liabilities | 11,957 | 12,307 | ||||||||
Commitments and contingencies | ||||||||||
Redeemable noncontrolling interest | 2 | — | ||||||||
Shares, CHF 15.00 par value, 373,830,649 authorized, 167,617,649 conditionally authorized, 373,830,649 issued and 361,984,609 outstanding at March 31, 2014 and 373,830,649 authorized, 167,617,649 conditionally authorized, 373,830,649 issued and 360,764,100 outstanding at December 31, 2013 | 5,164 | 5,147 | ||||||||
Additional paid‑in capital | 6,792 | 6,784 | ||||||||
Treasury shares, at cost, 2,863,267 held at March 31, 2014 and December 31, 2013 | (240 | ) | (240 | ) | ||||||
Retained earnings | 5,718 | 5,262 | ||||||||
Accumulated other comprehensive loss | (263 | ) | (262 | ) | ||||||
Total controlling interest shareholders’ equity | 17,171 | 16,691 | ||||||||
Noncontrolling interest | 4 | (6 | ) | |||||||
Total equity | 17,175 | 16,685 | ||||||||
Total liabilities and equity | $ | 31,897 | $ | 32,546 | ||||||
TRANSOCEAN LTD. AND SUBSIDIARIES
CONDENSED CONSOLIDATED STATEMENTS OF CASH FLOWS
(In millions)
(Unaudited)
Three months ended March 31, | ||||||||||
2014 | 2013 | |||||||||
Cash flows from operating activities | ||||||||||
Net income | $ | 466 | $ | 313 | ||||||
Adjustments to reconcile to net cash provided by operating activities: | ||||||||||
Amortization of drilling contract intangibles | (4 | ) | (9 | ) | ||||||
Depreciation | 273 | 275 | ||||||||
Share‑based compensation expense | 28 | 21 | ||||||||
Loss on impairment | 65 | — | ||||||||
Loss on disposal of assets, net | 3 | 7 | ||||||||
(Gain) loss on disposal of assets in discontinued operations, net | 10 | (15 | ) | |||||||
Deferred income taxes | (15 | ) | (28 | ) | ||||||
Other, net | 12 | 15 | ||||||||
Changes in deferred revenue, net | (26 | ) | (6 | ) | ||||||
Changes in deferred costs, net | 38 | 17 | ||||||||
Changes in operating assets and liabilities | (714 | ) | (484 | ) | ||||||
Net cash provided by operating activities | 136 | 106 | ||||||||
Cash flows from investing activities | ||||||||||
Capital expenditures | (1,131 | ) | (488 | ) | ||||||
Proceeds from disposal of assets, net | 91 | 1 | ||||||||
Proceeds from disposal of assets in discontinued operations, net | 14 | 63 | ||||||||
Other, net | (12 | ) | 9 | |||||||
Net cash used in investing activities | (1,038 | ) | (415 | ) | ||||||
Cash flows from financing activities | ||||||||||
Repayments of debt | (237 | ) | (1,190) | |||||||
Proceeds from restricted cash investments | 107 | 128 | ||||||||
Deposits to restricted cash investments | (20 | ) | (59 | ) | ||||||
Distribution of qualifying additional paid-in capital | (202 | ) | — | |||||||
Other, net | (2 | ) | (15 | ) | ||||||
Net cash used in financing activities | (354) | (1,136) | ||||||||
Net decrease in cash and cash equivalents | (1,256 | ) | (1,445 | ) | ||||||
Cash and cash equivalents at beginning of period | 3,243 | 5,134 | ||||||||
Cash and cash equivalents at end of period | $ | 1,987 | $ | 3,689 | ||||||
TRANSOCEAN LTD. AND SUBSIDIARIES
FLEET OPERATING STATISTICS
Operating Revenues (in millions) | |||||||||||
Three months ended | |||||||||||
March 31, 2014 | December 31, 2013 | March 31, 2013 | |||||||||
Contract drilling revenues | |||||||||||
High-Specification Floaters: | |||||||||||
Ultra-Deepwater Floaters | $ | 1,197 | $ | 1,098 | $ | 1,047 | |||||
Deepwater Floaters | 259 | 255 | 254 | ||||||||
Harsh Environment Floaters | 286 | 283 | 282 | ||||||||
Total High-Specification Floaters | 1,742 | 1,636 | 1,583 | ||||||||
Midwater Floaters | 411 | 429 | 429 | ||||||||
High-Specification Jackups | 135 | 143 | 124 | ||||||||
Contract intangible revenue | 4 | (6) | 9 | ||||||||
Total contract drilling revenues | 2,292 | 2,202 | 2,145 | ||||||||
Other revenues | |||||||||||
Client reimbursable revenues | 44 | 42 | 39 | ||||||||
Integrated services and other | 3 | 8 | — | ||||||||
Total other revenues | 47 | 50 | 39 | ||||||||
Total revenues | 2,339 | 2,252 | 2,184 | ||||||||
Average Daily Revenue (1) | |||||||||||
Three months ended | |||||||||||
March 31, 2014 | December 31, 2013 | March 31, 2013 | |||||||||
High-Specification Floaters: | |||||||||||
Ultra-Deepwater Floaters | $ | 547,000 | $ | 510,200 | $ | 457,800 | |||||
Deepwater Floaters | 392,000 | 370,700 | 327,600 | ||||||||
Harsh Environment Floaters | 454,700 | 438,200 | 454,400 | ||||||||
Total High-Specification Floaters | 500,900 | 469,400 | 429,900 | ||||||||
Midwater Floaters | 334,500 | 338,400 | 291,800 | ||||||||
High-Specification Jackups | 162,000 | 165,600 | 163,000 | ||||||||
Total | 413,100 | 393,100 | 361,200 | ||||||||
(1) Average daily revenue is defined as contract drilling revenues earned per operating day. An operating day is defined as a calendar day during which a rig is contracted to earn a dayrate during the firm contract period after commencement of operations. | |||||||||||
TRANSOCEAN LTD. AND SUBSIDIARIES
FLEET OPERATING STATISTICS (continued)
Utilization (2) | ||||||||||
Three months ended | ||||||||||
March 31, 2014 | December 31, 2013 | March 31, 2013 | ||||||||
High-Specification Floaters: | ||||||||||
Ultra-Deepwater Floaters | 90% | 87% | 94% | |||||||
Deepwater Floaters | 61% | 62% | 62% | |||||||
Harsh Environment Floaters | 100% | 100% | 99% | |||||||
Total High-Specification Floaters | 84% | 82% | 86% | |||||||
Midwater Floaters | 62% | 60% | 65% | |||||||
High-Specification Jackups | 84% | 79% | 92% | |||||||
Total | 78% | 75% | 80% | |||||||
(2) Rig utilization is defined as the total number of operating days divided by the total number of rig calendar days in the measurement period, expressed as a percentage. | ||||||||||
Revenue Efficiency(3) | |||||||
Trailing Five Quarters and Historical Data | |||||||
1Q 2014 | 4Q 2013 | 3Q 2013 | 2Q 2013 | 1Q 2013 | FY 2013 | FY 2012 | |
Ultra-Deepwater | 96.4% | 90.0% | 92.5% | 91.1% | 83.8% | 89.4% | 93.2% |
Deepwater | 100.5% | 95.0% | 91.1% | 91.8% | 86.4% | 91.0% | 91.4% |
Harsh Environment Floaters | 96.3% | 92.1% | 99.9% | 98.3% | 97.6% | 96.9% | 97.1% |
Midwater Floaters | 91.1% | 92.3% | 95.3% | 94.5% | 92.1% | 93.5% | 90.9% |
High Specification Jackups | 94.5% | 97.2% | 98.9% | 98.6% | 96.4% | 97.8% | 95.0% |
Total | 95.7% | 91.7% | 94.0% | 93.1% | 88.0% | 91.7% | 93.0% |
(3) Revenue efficiency is defined as actual contract drilling revenues for the measurement period divided by the maximum revenue calculation for the measurement period, expressed as a percentage. Maximum revenue is defined as the greatest amount of contract drilling revenues the drilling unit could earn for the measurement period, excluding amounts related to incentive provisions. | |||||||
Transocean Ltd. and Subsidiaries | |||||||||||
Supplemental Effective Tax Rate Analysis | |||||||||||
(In US$ millions) | |||||||||||
Three months ended | |||||||||||
March 31, | December 31, | March 31, | |||||||||
2014 | 2013 | 2013 | |||||||||
Income from continuing operations before income taxes | $ | 554 | $ | 264 | $ | 338 | |||||
Add back (subtract): | |||||||||||
Litigation matters | 3 | 17 | 74 | ||||||||
One-time termination benefits | 1 | 6 | — | ||||||||
Loss on early lease termination | — | 3 | — | ||||||||
Loss on impairment of goodwill and other assets | 65 | 27 | — | ||||||||
Loss on retirement of debt | 1 | — | 1 | ||||||||
Adjusted income from continuing operations before income taxes | 624 | 317 | 413 | ||||||||
Income tax expense (benefit) from continuing operations | 80 | 44 | 20 | ||||||||
Add back (subtract): | |||||||||||
Litigation matters | 1 | 6 | 26 | ||||||||
One-time termination benefits | — | 1 | — | ||||||||
Changes in estimates (1) | 13 | 5 | 33 | ||||||||
Adjusted income tax expense from continuing operations (2) | $ | 94 | $ | 56 | $ | 79 | |||||
Effective Tax Rate (3) | 14.4 | % | 16.7 | % | 5.9 | % | |||||
Annual Effective Tax Rate (4) | 15.1 | % | 17.7 | % | 19.1 | % | |||||
(1) Our estimates change as we file tax returns, settle disputes with tax authorities or become aware of other events and include changes in (a) deferred taxes, (b) valuation of allowances on deferred taxes and (c) other tax liabilities. | |||||||||||
(2) The three months and year ended December 31, 2013 includes ($7) million of additional tax expense (benefit) reflecting the catch-up effect of an increase (decrease) in the annual effective tax rate from the previous quarter estimate. | |||||||||||
(3) Effective Tax Rate is income tax expense for continuing operations, divided by income from continuing operations before income taxes. | |||||||||||
(4) Annual Effective Tax Rate is income tax expense for continuing operations, excluding various discrete items (such as changes in estimates and tax on items excluded from income before income taxes), divided by income from continuing operations before income tax expense excluding gains and losses on sales and similar items pursuant to the accounting standards for income taxes and estimating the annual effective tax rate. | |||||||||||