Attached files
| file | filename |
|---|---|
| EX-99.1 - EX-99.1 - SPARTON CORP | d722960dex991.htm |
| 8-K - 8-K - SPARTON CORP | d722960d8k.htm |
 Third Quarter Financial
Results Conference Call
May 7, 2014
Exhibit 99.2 |
 2
Safe Harbor Statement
Safe Harbor Statement
Certain statements herein constitute forward-looking statements within the
meaning of the Securities Act of 1933, as
amended
and
the
Securities
Exchange
Act
of
1934,
as
amended.
When
used
herein,
words
such
as
“believe,”
“expect,”
“anticipate,”
“project,”
“plan,”
“estimate,”
“will”
or “intend”
and similar words or expressions as they relate
to the Company or its management constitute forward-looking statements. These
forward-looking statements reflect our
current
views
with
respect
to
future
events
and
are
based
on
currently
available
financial,
economic
and
competitive data and our current business plans. The Company is under no obligation
to, and expressly disclaims any obligation to, update or alter its
forward-looking statements whether as a result of such changes, new
information, subsequent events or otherwise. Actual results could vary materially
depending on risks and uncertainties that may affect our operations,
markets, prices and other factors. Important factors that could cause actual
results to differ materially from those forward-looking statements include those contained under the heading
of risk factors and in the management’s discussion and analysis contained from
time-to-time in the Company’s filings with the Securities and
Exchange Commission. Adjusted EBITDA and related reconciliation presented
here represents earnings before interest, taxes, depreciation and
amortization as adjusted for restructuring/impairment charges, gross profit effects of capitalized profit in
inventory from acquisition and acquisition contingency settlement, and gain on sale
of investment. The Company believes Adjusted EBITDA is commonly used by
financial analysts and others in the industries in which the Company
operates and, thus, provides useful information to investors. The Company does not intend, nor should
the reader consider, Adjusted EBITDA an alternative to net income, net cash
provided by operating activities or any other items calculated in accordance
with GAAP. The Company's definition of Adjusted EBITDA may not be comparable
with Adjusted EBITDA as defined by other companies. Accordingly, the measurement has limitations
depending on its use. |
 3
•
3
Quarter
Highlights
•
3
Quarter
Segmented
Operating
Results
•
Liquidity & Capital Resources
•
Acquisition Update
•
Fiscal 2014 Outlook
•
Investor Activities
•
Q & A
Today’s Agenda
Today’s Agenda
rd
rd |
 4
•
Quarterly revenue grew 29% to $84 million as compared to the same
quarter of the prior year
–
Organic growth, net of acquisitions, was 11% from the same quarter of the
prior year.
•
Adjusted EBITDA grew 120% in the quarter and 73% YTD as compared
to the prior year periods
•
20
new
business
programs
awarded
with
potential
annualized
sales
of
$6.1 million
•
Completed the acquisition of Aubrey Group, Inc.
3 Quarter Highlights
3 Quarter Highlights
rd |
 5
Consolidated Financial Results
Consolidated Financial Results
Fiscal 2014 YTD
Fiscal 2014 YTD
(Adjusted)
2014
2013
2014
2013
Net Sales
$ 242,691
$ 183,203
$ 242,691
$ 183,203
$ 59,488
Gross Profit
43,597
30,220
43,853
30,786
13,067
18.0%
16.5%
18.1%
16.8%
Selling and Administrative Expense
25,139
19,650
25,139
19,650
(5,489)
10.4%
10.7%
10.4%
10.7%
Internal R&D Expense
1,004
889
1,004
889
(115)
Amortization of intangible assets
2,323
984
2,323
984
(1,339)
Restructuring/impairment charges
188
-
-
-
-
Other operating expense, net
(14)
16
(14)
16
30
Operating Income
14,957
8,681
15,401
9,247
6,154
6.2%
4.7%
6.3%
5.0%
Income Before Provision For Income Tax
14,873
8,665
15,317
9,231
6,086
Provision For Income Taxes
4,857
831
5,002
3,086
(1,916)
Net Income
$ 10,016
$ 7,834
$ 10,315
$ 6,145
$ 4,170
4.1%
4.3%
4.3%
3.4%
Income per Share (Basic)
$ 0.99
$ 0.77
$ 1.02
$ 0.60
$ 0.42
Income per Share (Diluted)
$ 0.99
$ 0.77
$ 1.02
$ 0.60
$ 0.42
($ in 000’s, except per share)
(adjusted removes certain gains and charges)
(Reported)
(Adjusted)
9 months ended Mar 31,
9 months ended Mar 31,
Total YoY
Variance |
 6
Consolidated Financial Results
Consolidated Financial Results
Adjusted EBITDA
Adjusted EBITDA
2014
2013
2014
2013
Variance
Net Income
$ 4,246
$ 1,536
$ 10,016
$ 7,834
$ 2,182
Interest expense
187
136
547
390
157
Interest income
- (48)
(2)
(99)
97
Provision for income taxes
2,014
832
4,857
831
4,026
Depreciation and amortization
2,270
1,564
5,910
3,036
2,874
Restructuring/impairment charges
-
- 188
- 188
Capitalized profit in inventory from acquisition
148
- 256
566
(310)
Adjusted EBITDA
$ 8,865
$ 4,020
$ 21,772
$ 12,558
$ 9,214
10.6%
6.2%
9.0%
6.9%
3 months ended Mar 31,
9 months ended Mar 31, |
 7
Operating Results
Operating Results
Revenue & Gross Profit
Revenue & Gross Profit
SEGMENT
2014
% of Total
2013
% Change
2014
% of Total
2013
% Change
Medical
$ 37,215
44%
$ 39,139
-5%
$ 123,539
51%
$ 102,002
21%
Complex Systems
23,563
28%
16,482
43%
60,132
25%
42,888
40%
DSS
28,853
34%
14,186
103%
72,824
30%
51,850
40%
Inter-company
(5,700)
-6%
(4,659)
22%
(13,804)
-6%
(13,537)
2%
Totals
$ 83,931
100%
$ 65,148
29%
$ 242,691
100%
$ 183,203
32%
SEGMENT
2014
GP %
2013
GP %
2014
GP %
2013
GP %
Medical
$ 5,332
14.3%
$ 5,339
13.6%
$ 19,134
15.5%
$ 14,443
14.2%
Complex Systems
2,555
10.8%
1,890
11.5%
6,367
10.6%
4,414
10.3%
DSS
8,687
30.1%
2,896
20.4%
18,352
25.2%
11,929
23.0%
Totals
$ 16,574
19.7%
$ 10,125
15.5%
$ 43,853
18.1%
$ 30,786
16.8%
($ in 000’s)
3 months ended Mar 31,
3 months ended Mar 31,
9 months ended Mar 31,
9 months ended Mar 31,
REVENUE
ADJUSTED GROSS PROFIT |
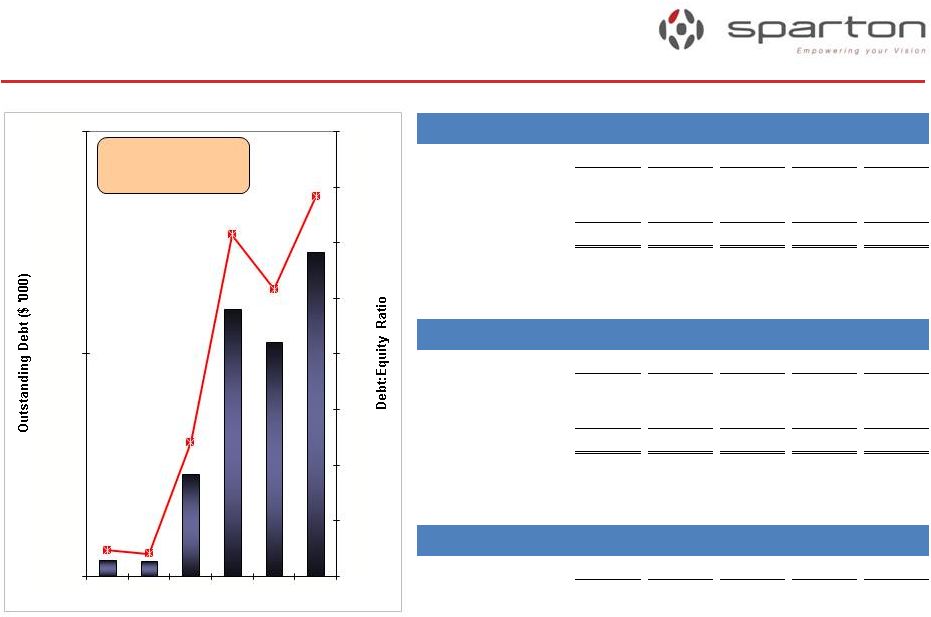 8
Liquidity & Capital Resources
Liquidity & Capital Resources
1,796
1,669
11,539
30,006
26,331
36,437
0.26
0.34
-
0.05
0.10
0.15
0.20
0.25
0.30
0.35
0.40
0
25,000
50,000
Net Debt-to-EBITDA
Leverage = 0.9x
($ in '000)
Mar-13
Jun-13
Sep-13
Dec-13
Mar-14
Cash and equivalents
4,358
6,085
2,719
1,009
7,502
LOC Availability*
87,000
90,000
71,000
75,000
65,000
Total
91,358
96,085
73,719
76,009
72,502
* Includes a $35 million accordian feature as part of the existing credit
facility. ($ in '000)
Mar-13
Jun-13
Sep-13
Dec-13
Mar-14
Credit Revolver
13,000
10,000
28,500
25,000
35,000
IRB (Ohio)
1,572
1,539
1,506
1,472
1,437
Total
14,572
11,539
30,006
26,472
36,437
($ in '000)
Mar-13
Jun-13
Sep-13
Dec-13
Mar-14
Net Inventory
46,928
46,334
55,658
52,393
51,466
Cash Availability
Debt
Inventory
Jun-11
Jun-12
Jun-13
Sep-13
Dec-13
Mar-14 |
 9
•
Aubrey Group
–
Closed transaction on March 17, 2014
–
Located in Irvine, CA
–
Design and contract manufacturing company using state-of-the-art
technologies to develop new products for OEMs in the Medical and
Biotechnological markets –
Over 20 years of experience and expertise in a number of core platforms: Medical
Device Controllers, RF Generation, and Pumps and Disposables
–
$8 million of revenue
–
Financials reported within Medical segment
–
Minimal integration activities required
–
Accretive to earnings within 12 months
Acquisition Update
Acquisition Update |
 10
•
Implementation of the strategic growth plan
–
Continue to grow organically
–
Maintain our level of investment in internal research & development to
commercially extend our product lines
–
Continue to enable our engineering workforce to develop new and innovative
proprietary solutions for our end markets
–
Continue to seek out complementary and compatible acquisitions
–
Further leverage Viet Nam as a low cost country alternative and in-region
provider •
Focus on sustained profitability
–
Continue margin improvements across the entire company
–
Increase capacity utilization
–
Continue additional improvements in operating performance through lean and quality
efforts
•
Complete the integration of Beckwood Services & Aubrey Group
Fiscal 2014/2015 Outlook
Fiscal 2014/2015 Outlook |
 11
•
Sidoti
Conference
in
NYC
on
May
9
th
•
B.
Riley
Investor
Conference
in
Santa
Monica
on
May
19
th
-21st
•
Barrington’s
Spring
Investor
Day
in
Chicago
on
May
22
nd
in
Chicago
•
KeyBanc
Capital
Markets
Conference
in
Boston
on
May
27
th
-28
th
•
East
Coast
Ideas
Conference
in
Boston
on
June
5
th
•
CJS New Ideas Conference in July
•
Midwest
Ideas
Conference
in
Chicago
from
August
26
th
-27
th
•
Sparton
Investor
Day
in
Orlando
on
October
8
th
–
Progress to the 2015 Vision
–
Communicate our new 2020 Vision
–
Provide access to senior management
–
Tour our DSS operation in DeLeon Springs, FL.
Investor Activities
Investor Activities |
 12
Q & A |