Attached files
| file | filename |
|---|---|
| 8-K - 8-K - NEWTEK BUSINESS SERVICES, INC. | d721988d8k.htm |
 Newtek Business
Services, Inc. “The Small Business Authority®”
Hosted by:
Barry Sloane, President & CEO
Jennifer Eddelson, EVP & CAO
First Quarter 2014
Financial Results Conference Call
May 7, 2014 4:15pm ET
NASDAQ: NEWT
www.thesba.com
Investor Relations
Public Relations
Newtek Investor Relations
Hayden Investor Relations
Newtek Public Relations
Jayne Cavuoto
Director of IR
jcavuoto@thesba.com
(212) 273-8179
Brett Maas
brett@haydenir.com
(646) 536-7331
Peter Seltzberg
peter@haydenir.com
(646) 415-8972
Simrita Singh
Director of Marketing
ssingh@thesba.com
(212) 356-9566
Exhibit 99.1 |
 Safe Harbor
Statement The statements in this slide presentation including statements regarding
anticipated future financial performance, Newtek's beliefs, expectations, intentions or
strategies for the future, may be "forward-looking statements" under the
Private Securities Litigation Reform Act of 1995. All forward-looking statements
involve a number of risks and uncertainties that could cause actual results to differ
materially from the plans, intentions and expectations reflected in or suggested by the
forward-looking statements. Such risks and uncertainties include, among others,
intensified competition, operating problems and their impact on revenues and profit
margins, anticipated future business strategies and financial performance, anticipated future
number of customers, business prospects, legislative developments and similar matters.
Risk factors, cautionary statements and other conditions which could cause
Newtek’s actual results to differ from management's current expectations are
contained in Newtek’s filings with the Securities and Exchange Commission and
available through http://www.sec.gov 2 |
 Business
Development Company The Company expects to present to its shareholders a proposal
to convert to a Business Development Company (“BDC”) once we are
cleared to do so by the SEC
In addition, the Company has filed preliminary materials to conduct a
public offering of up to $50 million of the shares of the BDC in
conjunction with the conversion
We will not be able to offer any further information or take any
questions regarding this proposed conversion or offering
3 |
 Q1 2014
Financial Highlights Reaffirmed 2014 consolidated guidance
•
Expect double-digit top-
and bottom-line percentage growth in 2014
Adjusted EBITDA was $4.8 million; a year-over-year increase of 10.6%
Operating revenues were $36.1 million; a year-over-year increase of 5.7%
Pretax net income was $2.2 million; a year-over-year increase of 0.6%
Diluted EPS of $0.04 equal to Q1 2013
Small Business Finance Segment
•
Revenue: $10.0 million; a year-over-year increase of 34.8%
•
Pretax income: $2.7 million; a year-over-year increase of 23.7%
4 |
 Q1 2014
Operational Highlights Originated $45.7 million in loans, a 31.2%
year-over-year increase •
Expect to originate between $240-$260 million in loans in 2014
Lender on a run rate to receive over $6.0 billion in referrals for 2014,
versus the $4.4 billion in referrals received in 2013
Total loan servicing portfolio grew by 95.6% to $1.1 billion in Q1 2014
on a year-over-year basis
Through Q1 2014, received 500,000+ referrals from independent
business owners through NewTracker®
Expanded alliance partnerships with nationally recognized firms such
as The Hartford, Teachers Federal Credit Union
(“TFCU”) and Paragon Financial Group,
Inc. Expanding depth and breadth of management team with hiring of
senior executives
5 |
 Company Reduces
Cost of Capital Potential BDC equity raise
Potential $20 million facility with Capital One Bank to refinance
Summit Capital Partners debt
Potential closing of $75 million Goldman Sachs small business
lending warehouse line
6 |
 Building Our
Senior Executive Team Richard
Rebetti,
President
and
Chief
Operating
Officer
of
Newtek
Technology
Services
•
Over 20 years’
experience both business development and executive operations of
high technology and communication companies
•
Former Chief Operating Officer of Data Storage Corporation and Telco Group Inc.
•
Former Chief Technology Officer of STi Prepaid, LLC
Susan
Streich,
Chief
Risk
Officer
and
Chief
Compliance
Officer
for
Newtek
Business Services, Inc. and Newtek Small Business Finance
•
Over 30 years’
experience as an executive level finance professional; extensive
experience initiating and leading national small business lending departments and
ensuring their compliance with federal and corporate requirements.
•
Former
Senior
Advisor,
Project
Lead
and
Subject
Matter
Expert
at
Booz
Allen
Hamilton, advising clients including the U.S. Department of Treasury, Community
Development Financial Institutions Fund and the State Small Business Credit
Initiative Fund
•
Former Director of Capital One Bank and President of Transamerica Small Business
Capital
7 |
 Reaffirmed 2014
Guidance* 8
Operating Revenue:
•
Midpoint of $161.0 million, with a range of $154.0 million and $168.0
million
•
Increase of 12.1% over 2013 revenue of $143.6 million
Pretax Income:
•
Midpoint of $13.5 million, with a range of $11.8 million and $15.1 million
•
Increase of 21.6% over 2013 pretax income $11.1 million
Diluted EPS:
•
Midpoint of $0.23, with a range of $0.20 and $0.26 per share
•
Increase of 15.0% over 2013 diluted EPS of $0.20
Adjusted EBITDA**:
•
Midpoint of $26.0 million, with a range of $24.5 million and $27.5 million
•
Increase of 26.2% over 2013 Adjusted EBITDA* of $20.6 million
**See slide 28 for definition of Adjusted EBITDA
Expect double-digit top-
and bottom-line percentage growth in 2014
*As of 5/7/2014 |
 Consolidated
Balance Sheet 9
$ in thousands
Balance
March 31, 2014
Balance
Dec 31, 2013
Total Cash & Cash Equivalents*
$20,803
$29,385
Total Assets
$192,448
$198,612
Total Liabilities
$113,949
$121,603
Total Equity
$78,499
$77,009
Selected Items
*Includes restricted cash of $10.6 million at March 31, 2014, and $16.9 million at December
31, 2013 |
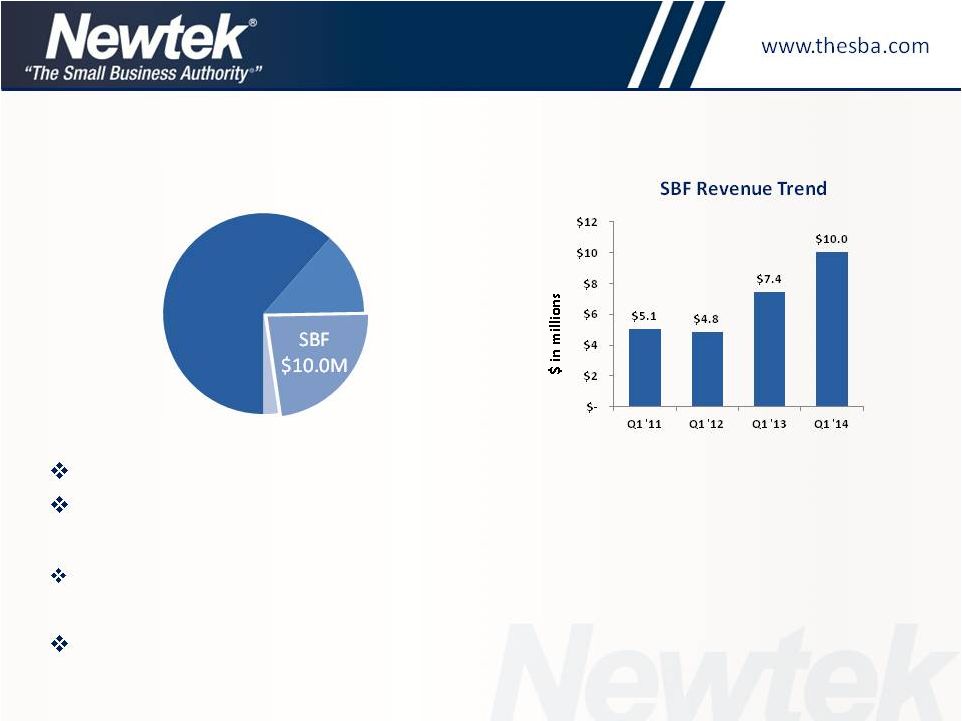 Small Business
Finance 10
Q1 2014 SBF revenue increased by 34.8% to $10.0 million
Funded $45.7 million in Q1 2014, a 31.2% increase year-over-year
•
Company on track to originate $240 to $260 million in SBA 7(a) loans in 2014
Total loan servicing portfolio grew by 95.6% to $1.1 billion in Q1 2014 on a
year-over-year basis
Lender on a run rate to receive over $6.0 billion in referrals for 2014, versus the $4.4
billion in referrals received in 2013
Q1 2014 SBF revenue was 27.8% of total operating revenue
Newtek Business Service, Inc.
Q1
2014
Total
Operating
Revenue:
$36.1
million
|
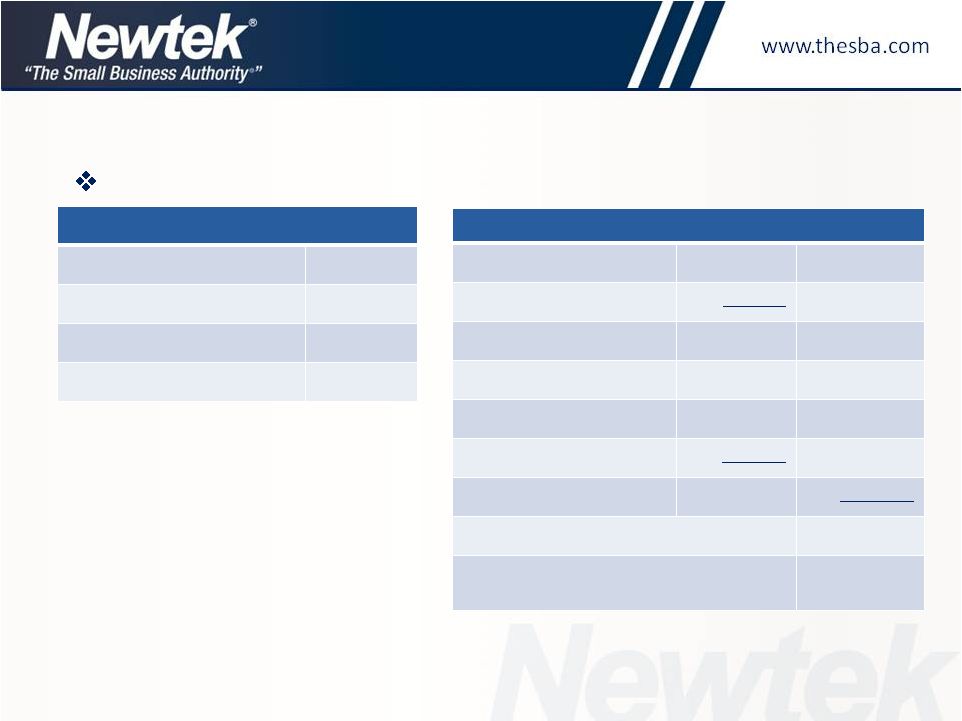 Key Variables
in Loan Sale Transaction Loan Amount
$1,000,000
Guaranteed Balance (75%)
$750,000
Unguaranteed Balance (25%)
$250,000
Premium*
12.5%
11
Loan Sale Transaction
Direct
Revenue
/
Expense
of
a
Loan
Sale
Transaction
–
An
Example
Resulting Revenue (Expense)
Associated Premium**
$93,750
Servicing Asset***
$18,630
Total Premium Income
$112,380
Packaging Fee Income
$2,500
FV Discount
$(15,000)
Referral Fees
$(7,500)
Total Direct Expenses
$(22,500)
Net Risk-adjusted Profit Recognized
$92,380
Net Cash Created pretax
(post securitization)****
$11,250
**Assumes 12.5% of the Guaranteed balance
***
Value determined by GAAP servicing value; a
present value of future servicing income
**** Assuming the loan is sold in a securitization in
12 months
*Premiums above 10% split 50/50 with SBA. This
example assumes guaranteed balance is sold at
15%. The additional 5% (15%-10%) is split with SBA.
Newtek nets 12.5% |
 12
Loan Sale Transaction
Net Cash Created Pretax
Guaranteed Balance
$750,000
Premium Received on
Guaranteed Balance**
$93,750
Cash received in
Securitization***
$167,500
Total
$1,011,250
Net Cash Created pretax
(post securitization)****
$11,250
**Assumes 12.5% of the Guaranteed balance
***
Assumes 67% advance rate in securitization on
unguaranteed balance
**** Assuming the loan is sold in a securitization in 12 months
*Premiums above 10% split 50/50 with SBA. This
example assumes guaranteed balance is sold at
15%. The additional 5% (15%-10%) is split with SBA.
Newtek nets 12.5%
Net cash assumes: cash premium on guaranteed balance after sale PLUS
cash from
securitizing unguaranteed balance in an S&P-rated structured-finance
transaction Key Variables in Loan Sale Transaction
Loan Amount
$1,000,000
Guaranteed Balance (75%)
$750,000
Unguaranteed Balance (25%)
$250,000
Premium*
12.5%
Net
Cash
Created
in
Loan
Sale
Transaction
–
An
Example |
 13
Comparative Loan Portfolio Data
Loan Characteristic
As of 12/31/10
As of 3/31/14
Business Type:
Existing Businesses
53.93%
79.57%
Business Acquisition
25.89%
13.45%
Start-Ups
20.18%
6.98%
Primary Collateral:
Commercial RE
45.33%
53.61%
Machinery & Equipment
22.79%
24.90%
Residential RE
22.27%
11.00%
Other
9.61%
6.68%
Percentage First Lien on RE:
Commercial RE
84.84%
95.69%
Residential RE
9.87%
22.67%
Other:
Weighted Average Mean FICO
675
707
Weighted Average Current LTV
78.23%
72.62%
(12/31/10 vs. 3/31/2014)
Loan Characteristic
As of 12/31/10
Loan Characteristic
As of 3/31/14
Industry:
Industry:
Restaurant
10.60%
Restaurant
6.94%
Hotels & Motels
7.58%
Amusement,
Gambling and
Recreation
6.15%
State Concentration:
State Concentration:
Florida
21.55%
New York
13.16%
New York
12.66%
Florida
8.97%
Georgia
14.08%
Texas
7.65% |
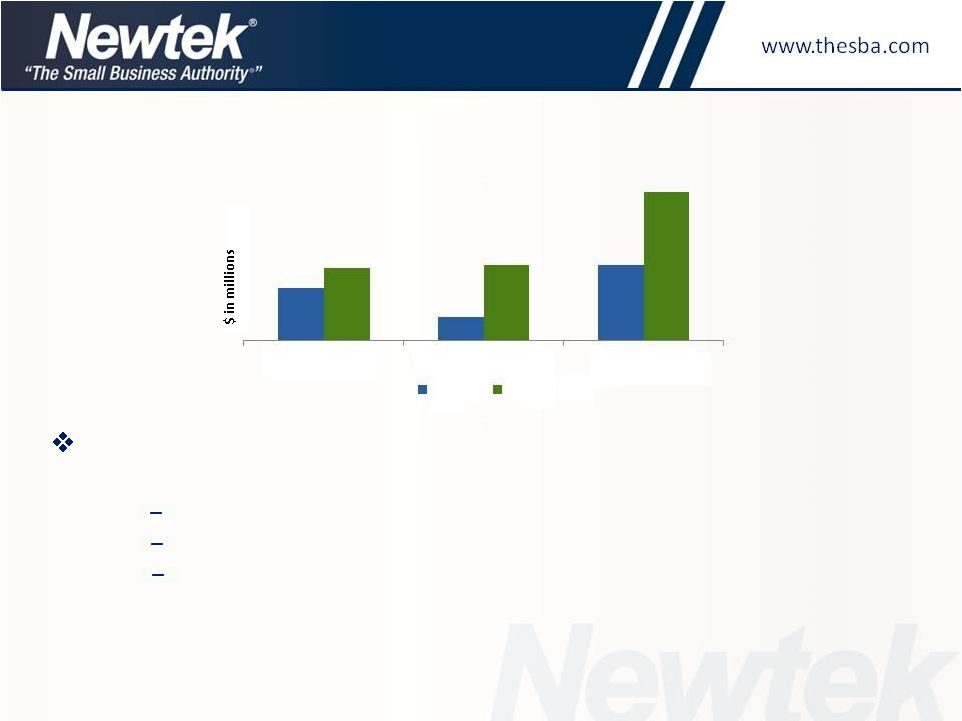 Servicing
Portfolio 14
The
SBF
servicing
portfolio
–
Q1
2013
vs.
Q1
2014
•
Total servicing portfolio increased by 95.6% to $1.1 billion
Newtek portfolio increased by 37.5%
Third-party servicing portfolio increased by 227.3%
Plan to continue to grow the loan servicing aspect of the business both
organically, through growth in loan originations, as well as through acquisition
of third-party loan servicing portfolios
*Principal balance of loans serviced (dollars in millions)
$379.2
$167.2
$546.4
$521.5
$547.3
$1,068.7
NEWT Loans*
Servicing Other Loans*
Total Loans*
Q1 2013
Q1 2014 |
 Q1 2014 EPP
revenue decreased slightly by 0.7% to $21.5 million Commenced advertising campaign for
EPP Division in Q1 2014 •
Aim to increase the national recognition of EPP program, and grow merchant client
base, attracting new quality independent sales organizations ("ISOs"), agent banks
and merchant processing customers to our program
Electronic Payment Processing
15
EPP
Revenue
$21.5M
Q1 2014 EPP revenue was 59.7% of total operating revenue
Newtek Business Services, Inc.
Q1
2014
Total
Operating
Revenue:
$36.1
million
$20.1
$20.6
$21.7
$21.5
$0
$4
$8
$12
$16
$20
$24
Q1 '11
Q1' 12
Q1 '13
Q1' 14
EPP Revenue Trend |
 Electronic
Payment Processing 16
Growth in business depends on:
•
Execution of Point of Sale (“POS”) in the Cloud Strategy
•
Execution of EuroPay, Mastercard®
and Visa®
(“EMV”) Strategy
•
Growth
of
Newtek
Advantage™
platform
•
Successful integration of our EPP product into The Newtek
Advantage™
–
Digital financial reporting and digital tax products to be developed
and integrated into The Newtek Advantage™
•
Successful execution of all of the above with new and existing
alliance partners |
 Managed
Technology Solutions 17
MTS
$4.1M
Q1 2014 MTS revenue decreased by 7.7% to $4.1 million
This segment is being transformed to take advantage of shift to cloud-based business
trends including: eCommerce, Payroll and Insurance
Upgrade to Linux-based platforms expected to help increase revenues and margins
Launched
Cloud
Authority™
TV
advertising
campaign
in
Q1
2014
•
Aim to attract IT decision makers and small business owners to Newtek’s
industry- leading cloud offerings
Q1 2014 MTS revenue was 11.2% of total operating revenue
Newtek Business Services, Inc.
Q1
2014
Total
Operating
Revenue:
$36.1
million
$4.8
$4.7
$4.4
$4.1
$-
$1
$2
$3
$4
$5
Q1' 11
Q1' 12
Q1' 13
Q1' 14
MTS Revenue Trend |
 Managed
Technology Solutions 18
Results attributable to:
•
Decrease in the number of lower-priced shared hosting plans
•
Decrease in the number of higher-priced dedicated hosting plans
•
Maintained investment in software development costs given lower
revenues
Key to turnaround success:
•
Execute on hyper-growth plans for Cloud offerings
•
Growth in the number of higher-priced dedicated server plans
•
Integrate additional products and services into our existing Cloud
offering |
 Newtek: 2014
and Beyond 19
To
further
our
position
as
THE
brand,
the
authoritative
presence,
that
independent business owners depend on for business and financial
products and services
Is our operating model more similar to Walmart or Amazon? Walmart
•
We control the service experience: 24/7/365
•
We take care of our business clients
•
We are The Authority for financial and business products and services
How do we Succeed?
•
Winning technology as a FinTech Company
•
Services in the Cloud through The Newtek Advantage®
•
Aggressive marketing strategy |
 Positioned as
a FinTech Company 20
Proprietary state-of-the-art web-based technology, NewTracker®
allows cost-
effective client acquisition
•
NewTracker®
technology positions Newtek as a FinTech Company
•
To date have received 500,000+ referrals from independent business owners through
NewTracker®
•
FinTech approach to customer acquisition disintermediates human function and
provides a cost advantage to Newtek versus its industry peers
•
This Internet trend is prevalent in the Global economy
The Newtek Advantage™: Cloud-based operating platform
•
Our business services are hosted in our Cloud and reported directly to a business
owners’
tablet, telephone phone or desktop, or by a human in our service center in
real time through a mobile application accessible by the business anytime
Integration of Products
•
Integrated offerings are our key to the highest level of customer service giving Newtek
a tremendous competitive advantage in the market |
 21
All-in-one e-Commerce offering
•
Secure proprietary gateway
•
Web Design
•
Secure web hosting in the Cloud
•
We are the merchant processor
•
Data protection and secure payments
Payroll
•
Health & Benefits
•
Worker’s Compensation and P&C
•
Payroll in the Cloud
Payroll and point of sale (“POS”) in the Cloud
•
Plan to integrate into digital financial reporting and digital tax similar to
Intuit’s QuickBooks or online tax
Positioned as a FinTech Company |
 Services in the
Cloud Through The Newtek Advantage™
22
Current working modules include:
•
eCommerce in the Cloud
•
Payroll in the Cloud
•
Web hosting in the Cloud
•
Manage a business from a mobile device, i.e. Tablet or Smartphone
Intend to add modules including:
•
Insurance Agency in the Cloud
•
Cloud Hosting of financial reporting and tax
•
Lending information in the Cloud
•
POS in the Cloud
How do we do this?
•
11 years of developing this platform from ‘ground zero’
•
To date have received 500,000+ referrals from independent business owners
through NewTracker® |
 Marketing
Strategy 23
Continue branding of The Small Business Authority®
•
Present Company to the independent business audience as the
authoritative presence in the small-
and medium-sized business
market for all their business and financial product and service needs
Expansion of national TV advertising campaign
Growth through acquisition and viral marketing
Expand alliance relationships
Grow client database with new outbound efforts including:
•
Newsletters
•
Magazine
•
Social media |
 Competition
24
Publicly Traded Comparables
Intuit, Inc. (INTU)
Digital River, Inc. (DRIV)
Heartland Payment Systems, Inc. (HPY)
Vantiv, Inc. (VNTV)
JetPay, Inc. (JTPY)
formerly UBPS
Web.com Group, Inc. (WWWW)
Endurance International Group, Inc. (EIGI)
Rackspace Holdings, Inc. (RAX)
Paychex, Inc. (PAYX)
ADP®
(ADP)
Marchex, Inc. (MCHX)
Cbeyond, Inc. (CBEY) |
 Comparable
Company Statistics Lending Club –
$3.8 billion market valuation
•
4/17/2014: raised $115 million in debt and equity
On Deck Capital –
recently raised $180 million in venture capital
•
Have made less than $1.0 billion in loans
Go Daddy estimated worth more than $6 billion in an IPO, based
on GoDaddy’s
CEO’s sales growth projections; IPO planned for 2
nd
half of 2014
•
GoDaddy previously announced strategic purchase of a cloud-based financial
management application company to reach more small businesses
Digital River (DRIV) purchased LML Payment Systems (LMLP)
Universal Business Payment Solutions (UBPS), now JetPay, LLC (JTPY), completed
$179 million acquisition of credit/debit card sales and processing (JetPay, LLC),
payroll processing and tax filing companies (AD Computer Corporation)
25
Newtek’s competitive advantage
is its experience of providing a “suite of services”
which are integrated on a similar, coordinated platform, and are
available in the
Cloud; it’s called The Newtek Advantage™
|
 Investment
Summary Publicly traded Company since 2000
Management’s interests aligned with shareholders
•
CEO alone owns approximately 13.4% of outstanding shares*
•
Founders, Management and Board combined own over 25% of outstanding shares*
Trades at approximately 4.0x 2014 forecasted Adjusted EBITDA**
•
2014 forecasted Adjusted EBITDA** of $26.0 million, an increase of approximately
26.2% over FY 2013 Adjusted EBITDA** of $20.6 million
Growing revenues
•
Expect to grow revenues by approximately 12% in 2014
Tremendous opportunity to penetrate market
•
Over 27.5 million small businesses in the U.S.
Inexpensive relative to market comparables
•
Market comps: DRIV, WWWW, VNTV, JTPY, EIGI, INTU
26
*As of 5/7/2014
**See slide 28 for definition of Adjusted EBITDA |
 Key Statistics
– NASDAQ: NEWT
27
Stock Price
52-Week Range
Common Shares O/S
Market Cap
Avg. Daily Trading Vol.
(200-day average)
Share
Statistics*
(USD)
………………………....................
*As of 5/6/2014
**See slide 28 for definition of Adjusted EBITDA
*** As of 5/7/2014. Represents midpoint of expected range
2014
Guidance***
………………………...........................
Revenue
$161.0M
Pre-tax Income
$13.5M
Diluted EPS
$0.23
Adjusted EBITDA**
$26.5M
81,166
$99.9M
$1.98-$3.43
37.0M
$2.70 |
 Financial
Review Jennifer C. Eddelson -
CAO |
 Non-GAAP
Financial Measures 29
In evaluating its business, Newtek considers and uses adjusted EBITDA as a supplemental measure
of its operating performance. The Company defines adjusted EBITDA as earnings
before income from tax credits, interest expense, taxes, depreciation and amortization,
stock compensation expense, other than temporary decline in value of investments, Capco
fair value change and the amortization of the 2011 accrued loss on the lease restructure. Newtek
uses adjusted EBITDA as a supplemental measure to review and assess its operating
performance. The Company also presents adjusted EBITDA because it believes it is
frequently used by securities analysts, investors and other interested parties as a
measure of financial performance. The term adjusted EBITDA is not defined under U.S. generally accepted accounting principles, or
U.S. GAAP, and is not a measure of operating income(loss), operating performance or
liquidity presented in accordance with U.S. GAAP. Adjusted EBITDA has limitations
as a analytical tool and, when assessing the Company’s operating performance,
investors should not consider adjusted EBITDA in isolation, or as a substitute for net income
(loss) or other consolidated income statement data prepared in accordance with U.S.
GAAP. Among other things, adjusted EBITDA does not reflect the Company’s
actual cash expenditures. Other companies may calculate similar measures differently than Newtek,
limiting their usefulness as comparative tools. Newtek compensates for these limitations
by relying primarily on its GAAP results and using adjusted EBITDA only supplementally.
Our Capcos operate under a different set of rules in each of the 7 jurisdictions and these place
varying requirements on the structure of our investments. In some cases, particularly in
Louisiana or in certain situations in New York, we do not control the equity or
management of a qualified business, but that cannot always be presented orally or in written
presentations.
|
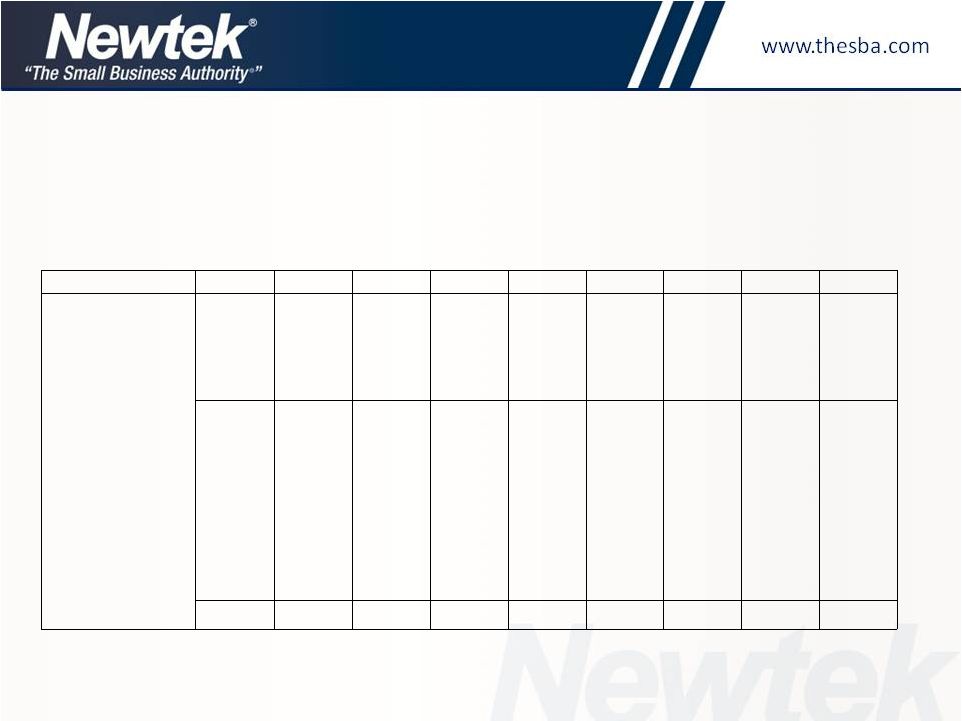
 In
millions of dollars *Note: totals may not add due to rounding
Q1 2014 Actual vs. Q1 2013 Actual
30
Revenue For
The Quarter
Ended
March 31, 2014
Revenue For
The Quarter
Ended
March 31, 2013
Pretax Income
(Loss) For The
Quarter Ended
March 31, 2014
Pretax Income
(Loss) For The
Quarter Ended
March 31, 2013
ADJUSTED
EBITDA For The
Quarter Ended
March 31, 2014
ADJUSTED
EBITDA For The
Quarter Ended
March 31, 2013
Electronic
Payment
Processing
21.528
21.679
1.718
1.835
1.805
1.950
Small
Business
Finance
10.038
7.449
2.691
2.175
4.671
3.686
Managed
Technology
Solutions
4.056
4.394
0.751
0.896
1.104
1.256
All Other
0.576
0.646
(0.399)
(0.462)
(0.339)
(0.404)
Corporate
Activities
0.199
0.200
(2.187)
(1.956)
(2.116)
(1.854)
CAPCO
0.104
0.050
(0.271)
(0.286)
(0.215)
(0.275)
Interco
Eliminations
(0.414)
(0.274)
(0.087)
–
(0.087)
–
Total
36.087
34.144
2.216
2.202
4.823
4.359 |
 2014 Segment
Guidance *Note: totals may not add due to rounding
In millions of dollars
Electronic
Small
Managed
Total
Inter-
Payment
Business
Technology
All
Corporate
Business
CAPCO
Company
Processing
Finance
Solutions
Other
Activities
Segments
Segment
Eliminations
Total
Low
High
Low
High
Low
High
Low
High
Low
High
Low
High
Low
High
Low
High
2014 Full Year
Revenue
90.2
99.2
44.0
47.0
17.4
19.2
2.6
2.8
0.8
0.8
155.0
169.0
0.2
0.2
(1.2)
154.0
168.0
Pretax Income (Loss)
8.3
9.2
13.6
15.2
3.3
3.7
(1.1)
(1.1)
(11.0)
(10.6)
13.1
16.4
(1.3)
(1.3)
-
11.8
15.1
Income from tax credits
-
-
-
-
-
-
-
-
-
-
-
-
(0.1)
(0.1)
-
(0.1)
(0.1)
Net change in fair value of
credits in lieu of cash and
notes payable in credits in
lieu of cash
-
-
-
-
-
-
-
-
-
-
-
-
-
-
-
-
-
Deferred compensation
expense
-
-
0.1
0.1
0.1
-
-
-
0.6
0.5
0.9
0.7
-
-
-
0.9
0.7
Lease loss amortization
-
-
-
-
-
-
-
-
(0.3)
(0.3)
(0.3)
(0.3)
-
-
-
(0.3)
(0.3)
Interest Expense
-
-
8.5
8.3
0.1
0.1
-
-
-
-
8.6
8.4
0.2
0.2
-
8.8
8.6
Depreciation and
Amortization
0.4
0.4
1.5
1.5
1.3
1.3
0.2
0.2
0.1
0.1
3.5
3.5
-
-
-
3.5
3.5
Adjusted EBITDA
8.7
9.5
23.8
25.1
4.8
5.2
(0.9)
(0.8)
(10.5)
(10.2)
26.8
28.8
(1.4)
(1.2)
-
24.5
27.5
31
*As of 5/7/2014 |
 Addenda
|
 Adjusted
EBITDA Reconciliation Adjusted EBITDA Reconciliation from Pretax Income (Loss)
For the three months ended March 31, 2014
In millions of dollars
*Note: totals may not add due to rounding
33
Pretax
Income
(Loss)
Income from
Tax Credits
Net
Change in
Fair Value
of Credits
in Lieu of
Cash and
Notes
Payable in
Credits in
Lieu of
Cash
Other than
Temporary
Decline in
Value of
Investments
Deferred
Comp
Expense
Amortization
of 2011 Lease
restructuring
charge
Interest
Expense
Depreciation
and
amortization
First
Quarter
2014
Adjusted
EBITDA
Electronic Payment
Processing
1.718
-
-
-
0.027
-
-
0.061
1.806
Small Business
Finance
2.691
-
-
-
0.026
-
1.585
0.369
4.671
Managed
Technology
Solutions
0.751
-
-
-
(0.002)
-
0.018
0.337
1.104
All Other
(0.399)
-
-
-
0.009
-
-
0.051
(0.339)
Corporate Activities
(2.187)
-
-
-
0.098
(0.073)
0.009
0.037
(2.116)
CAPCO
(0.271)
(0.013)
(0.001)
0.045
-
-
0.024
-
(0.216)
Interco
Eliminations
(0.087)
(0.087)
Total
2.216
(0.013)
(0.001)
0.045
0.158
(0.073)
1.636
0.855
4.823 |
 Pretax
Income
(Loss)
Income
from Tax
Credits
Net Change
in Fair Value
of Credits in
Lieu of Cash
and Notes
Payable in
Credits in
Lieu of Cash
Deferred
Comp
Expense
Amortization of
2011 Lease
restructuring
charge
Interest
Expense
Depreciation
and
amortization
First
Quarter
2013
Adjusted
EBITDA
Electronic Payment
Processing
1.835
-
-
0.002
-
-
0.113
1.950
Small Business Finance
2.175
-
-
0.023
-
1.217
0.271
3.686
Managed Technology
Solutions
0.896
-
-
0.009
-
0.024
0.326
1.256
All Other
(0.462)
-
-
0.008
-
-
0.051
(0.404)
Corporate Activities
(1.956)
-
-
0.124
(0.073)
0.005
0.044
(1.854)
CAPCO
(0.286)
(0.026)
(0.019)
-
-
0.056
0.001
(0.275)
Total
2.202
(0.026)
(0.019)
0.166
(0.073)
1.302
0.807
4.359
Adjusted EBITDA Reconciliation
Adjusted EBITDA Reconciliation from Pretax Income (Loss)
For the three months ended March 31, 2013
In millions of dollars
*Note: totals may not add due to rounding
34 |
 Pretax
Income
(Loss)
Income
from Tax
Credits
Net Change
in Fair Value
of Credits in
Lieu of Cash
and Notes
Payable in
Credits in
Lieu of Cash
Other than
Temporary
Decline in
Value of
Investments
Deferred
Comp
Expense
Amortization of
2011 Lease
restructuring
charge
Interest
Expense
Depreciation
and
amortization
2013
Adjusted
EBITDA
Electronic Payment
Processing
8.304
-
-
-
0.019
-
-
0.358
8.681
Small Business Finance
10.143
-
-
-
0.103
-
5.568
1.242
17.055
Managed Technology
Solutions
3.564
-
-
-
0.051
-
0.094
1.316
5.025
All Other
(1.606)
-
-
-
0.035
-
-
0.202
(1.366)
Corporate Activities
(8.002)
-
-
-
0.575
(0.291)
0.027
0.161
(7.529)
CAPCO
(1.284)
(0.113)
(0.021)
0.017
-
-
0.174
0.005
(1.222)
Interco Eliminations
(0.050)
(0.051)
Total
11.069
(0.113)
(0.021)
0.017
0.784
(0.291)
5.863
3.284
20.593
Adjusted EBITDA Reconciliation
Adjusted EBITDA Reconciliation from Pretax Income (Loss)
For the year ended December 31, 2013
In millions of dollars
*Note: totals may not add due to rounding
35 |