Attached files
| file | filename |
|---|---|
| 8-K - CURRENT REPORT - MERITOR, INC. | mtor-8k.htm |

1 1 Wells Fargo 2014 Industrial and Construction Conference Kevin Nowlan, Senior Vice President & CFO May 7, 2014
2 Forward-Looking Statements This presentation contains statements relating to future results of the company (including certain projections and business trends) that are “forward-looking statements” as defined in the Private Securities Litigation Reform Act of 1995. Forward-looking statements are typically identified by words or phrases such as “believe,” “expect,” “anticipate,” “estimate,” “should,” “are likely to be,” “will” and similar expressions. SEC filings may differ materially from those projected as a result of certain risks and uncertainties, including but not limited to reduced production for certain military programs and our ability to secure new military programs as our primary military programs wind down by design through 2015; reliance on major original equipment manufacturer (“OEM”) customers and possible negative outcomes from contract negotiations with our major customers, including failure to negotiate acceptable terms in contract renewal negotiations and our ability to obtain new customers; the outcome of actual and potential product liability, warranty and recall claims; our ability to successfully manage rapidly changing volumes in the commercial truck markets and work with our customers to adjust their demands in view of rapid changes in production levels; global economic and market cycles and conditions; availability and sharply rising costs of raw materials, including steel, and our ability to manage or recover such costs; our ability to manage possible adverse effects on our European operations, or financing arrangements related thereto, in the event one or more countries exit the European monetary union; risks inherent in operating abroad (including foreign currency exchange rates, implications of foreign regulations relating to pensions and potential disruption of production and supply due to terrorist attacks or acts of aggression); rising costs of pension and other postretirement benefits; the ability to achieve the expected benefits of restructuring actions; the demand for commercial and specialty vehicles for which we supply products; whether our liquidity will be affected by declining vehicle productions in the future; OEM program delays; demand for and market acceptance of new and existing products; successful development of new products; labor relations of our company, our suppliers and customers, including potential disruptions in supply of parts to our facilities or demand for our products due to work stoppages; the financial condition of our suppliers and customers, including potential bankruptcies; possible adverse effects of any future suspension of normal trade credit terms by our suppliers; potential difficulties competing with companies that have avoided their existing contracts in bankruptcy and reorganization proceedings; potential impairment of long-lived assets, including goodwill; potential adjustment of the value of deferred tax assets; competitive product and pricing pressures; the amount of our debt; our ability to continue to comply with covenants in our financing agreements; our ability to access capital markets; credit ratings of our debt; the outcome of existing and any future legal proceedings, including any litigation with respect to environmental or asbestos-related matters; and possible changes in accounting rules; as well as other substantial costs, risks and uncertainties, including but not limited to those detailed herein and from time to time in other filings of the company with the SEC. These forward-looking statements are made only as of the date hereof, and the company undertakes no obligation to update or revise the forward-looking statements, whether as a result of new information, future events or otherwise, except as otherwise required by law. All earnings per share amounts are on a diluted basis. The company's fiscal year ends on the Sunday nearest Sept. 30, and its fiscal quarters generally end on the Sundays nearest Dec. 31, March 31 and June 30. All year and quarter references relate to the company's fiscal year and fiscal quarters, unless otherwise stated.
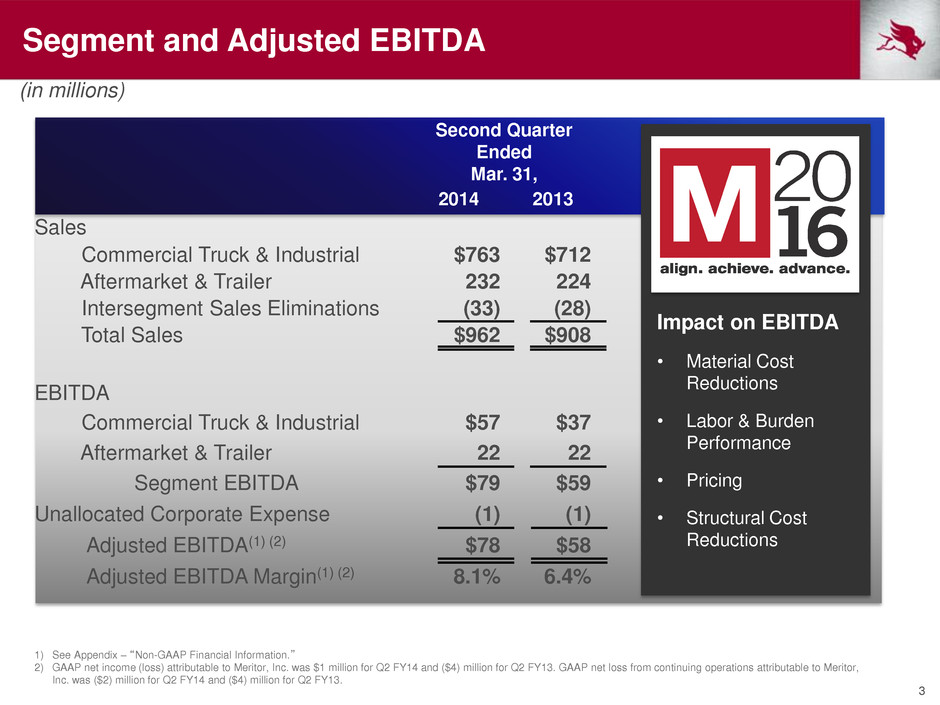
3 Second Quarter Ended Mar. 31, 2014 2013 Sales Commercial Truck & Industrial $763 $712 Aftermarket & Trailer 232 224 Intersegment Sales Eliminations (33) (28) Total Sales $962 $908 EBITDA Commercial Truck & Industrial $57 $37 Aftermarket & Trailer 22 22 Segment EBITDA $79 $59 Unallocated Corporate Expense (1) (1) Adjusted EBITDA(1) (2) $78 $58 Adjusted EBITDA Margin(1) (2) 8.1% 6.4% 1) See Appendix – “Non-GAAP Financial Information.” 2) GAAP net income (loss) attributable to Meritor, Inc. was $1 million for Q2 FY14 and ($4) million for Q2 FY13. GAAP net loss from continuing operations attributable to Meritor, Inc. was ($2) million for Q2 FY14 and ($4) million for Q2 FY13. (in millions) Segment and Adjusted EBITDA Impact on EBITDA • Material Cost Reductions • Labor & Burden Performance • Pricing • Structural Cost Reductions
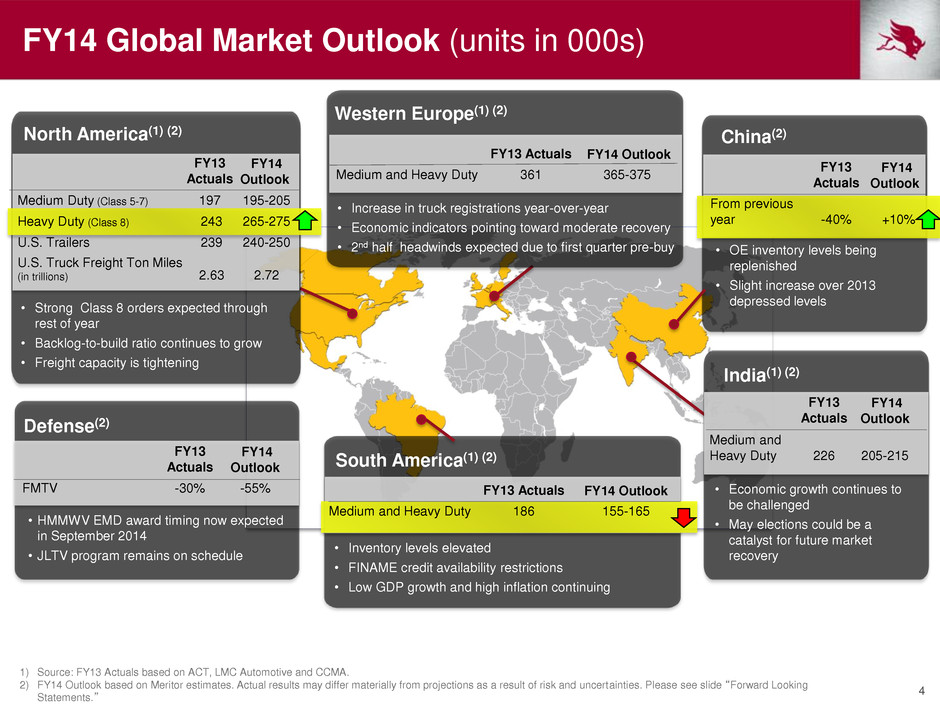
4 FY14 Global Market Outlook (units in 000s) 1) Source: FY13 Actuals based on ACT, LMC Automotive and CCMA. 2) FY14 Outlook based on Meritor estimates. Actual results may differ materially from projections as a result of risk and uncertainties. Please see slide “Forward Looking Statements.” North America(1) (2) • Strong Class 8 orders expected through rest of year • Backlog-to-build ratio continues to grow • Freight capacity is tightening China(2) • OE inventory levels being replenished • Slight increase over 2013 depressed levels South America(1) (2) • Inventory levels elevated • FINAME credit availability restrictions • Low GDP growth and high inflation continuing FY13 Actuals FY14 Outlook Medium and Heavy Duty 361 365-375 Western Europe(1) (2) FY13 Actuals FY14 Outlook Medium and Heavy Duty 226 205-215 India(1) (2) • Economic growth continues to be challenged • May elections could be a catalyst for future market recovery Defense FY13 Actuals FY14 Outlook FMTV -30% -55% Defense(2) • HMMWV EMD award timing now expected in September 2014 • JLTV program remains on schedule • Increase in truck registrations year-over-year • Economic indicators pointing toward moderate recovery • 2nd half headwinds expected due to first quarter pre-buy FY13 Actuals FY14 Outlook Medium Duty (Class 5-7) 197 195-205 Heavy Duty (Class 8) 243 265-275 U.S. Trailers 239 240-250 U.S. Truck Freight Ton Miles (in trillions) 2.63 2.72 FY13 Actuals FY14 Outlook From previous year -40% +10% FY13 Actuals FY14 Outlook Medium and Heavy Duty 186 155-165
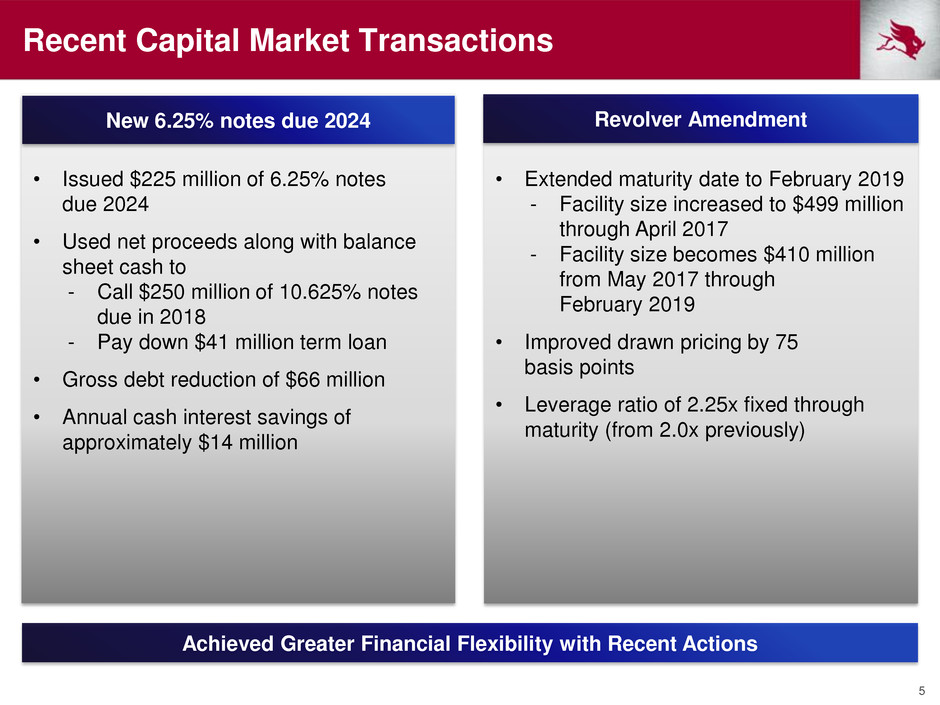
5 Achieved Greater Financial Flexibility with Recent Actions Recent Capital Market Transactions • Issued $225 million of 6.25% notes due 2024 • Used net proceeds along with balance sheet cash to - Call $250 million of 10.625% notes due in 2018 - Pay down $41 million term loan • Gross debt reduction of $66 million • Annual cash interest savings of approximately $14 million • Extended maturity date to February 2019 - Facility size increased to $499 million through April 2017 - Facility size becomes $410 million from May 2017 through February 2019 • Improved drawn pricing by 75 basis points • Leverage ratio of 2.25x fixed through maturity (from 2.0x previously) New 6.25% notes due 2024 Revolver Amendment
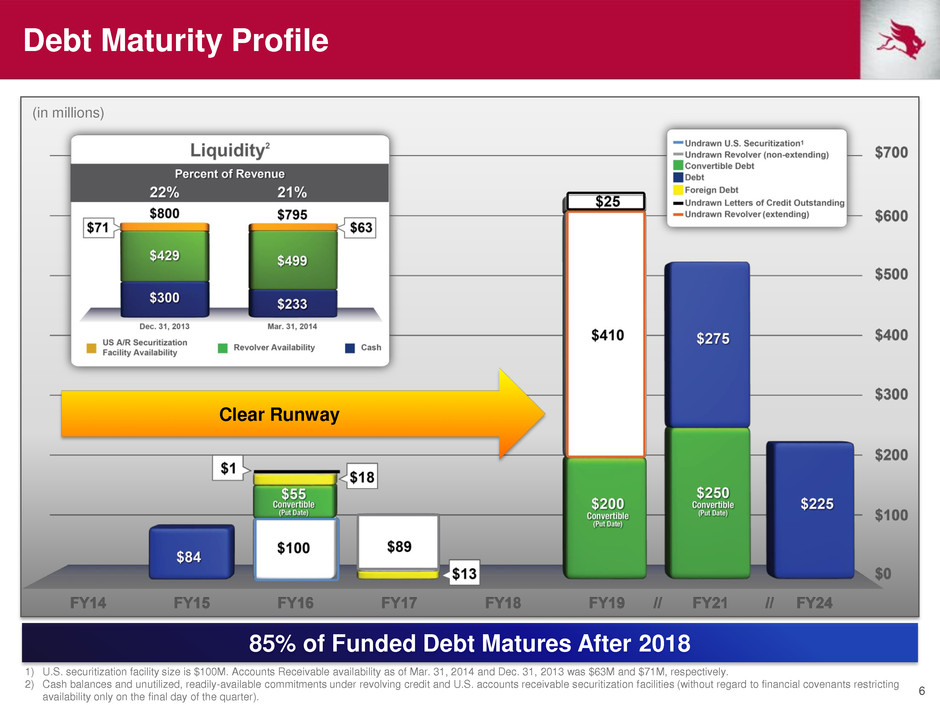
6 Debt Maturity Profile (in millions) 85% of Funded Debt Matures After 2018 Clear Runway 1) U.S. securitization facility size is $100M. Accounts Receivable availability as of Mar. 31, 2014 and Dec. 31, 2013 was $63M and $71M, respectively. 2) Cash balances and unutilized, readily-available commitments under revolving credit and U.S. accounts receivable securitization facilities (without regard to financial covenants restricting availability only on the final day of the quarter).
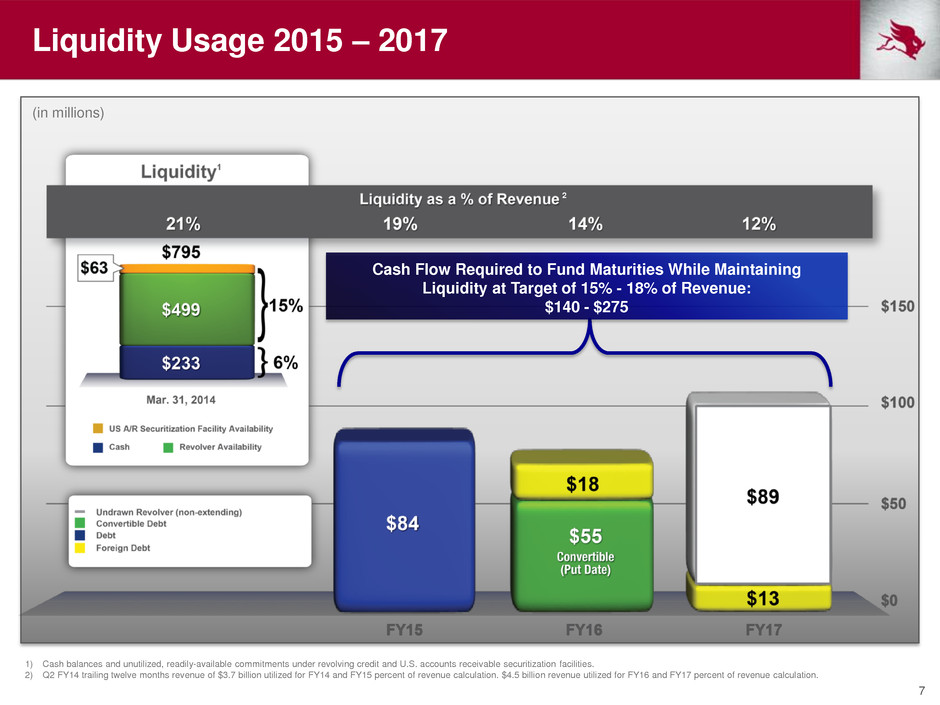
7 Liquidity Usage 2015 – 2017 (in millions) Cash Flow Required to Fund Maturities While Maintaining Liquidity at Target of 15% - 18% of Revenue: $140 - $275 1) Cash balances and unutilized, readily-available commitments under revolving credit and U.S. accounts receivable securitization facilities. 2) Q2 FY14 trailing twelve months revenue of $3.7 billion utilized for FY14 and FY15 percent of revenue calculation. $4.5 billion revenue utilized for FY16 and FY17 percent of revenue calculation. 2
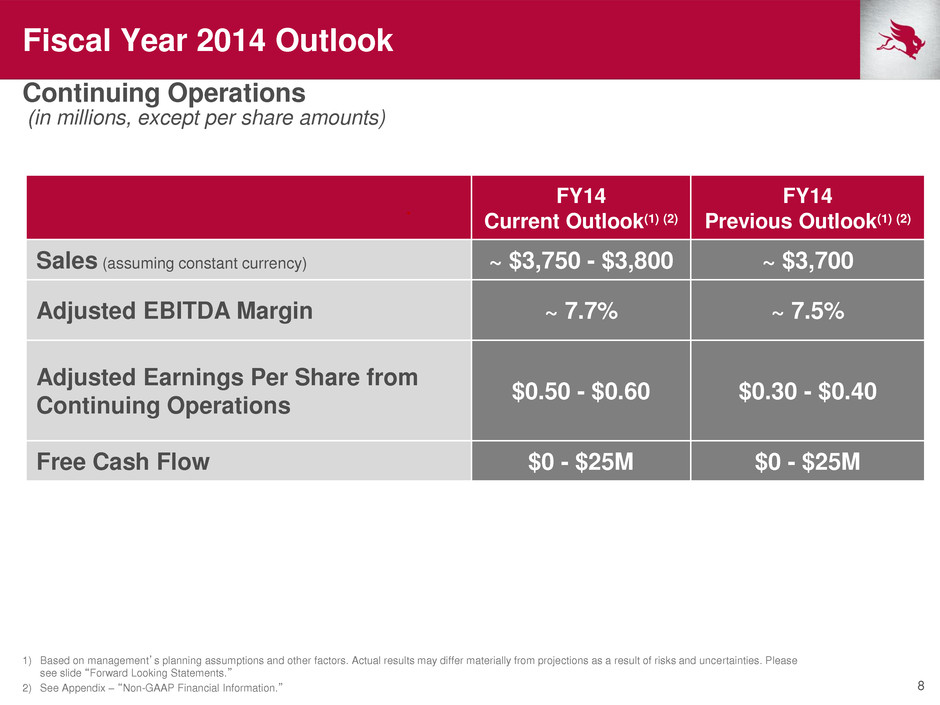
8 Fiscal Year 2014 Outlook Continuing Operations 1) Based on management’s planning assumptions and other factors. Actual results may differ materially from projections as a result of risks and uncertainties. Please see slide “Forward Looking Statements.” 2) See Appendix – “Non-GAAP Financial Information.” . FY14 Current Outlook(1) (2) FY14 Previous Outlook(1) (2) Sales (assuming constant currency) ~ $3,750 - $3,800 ~ $3,700 Adjusted EBITDA Margin ~ 7.7% ~ 7.5% Adjusted Earnings Per Share from Continuing Operations $0.50 - $0.60 $0.30 - $0.40 Free Cash Flow $0 - $25M $0 - $25M (in millions, except per share amounts)
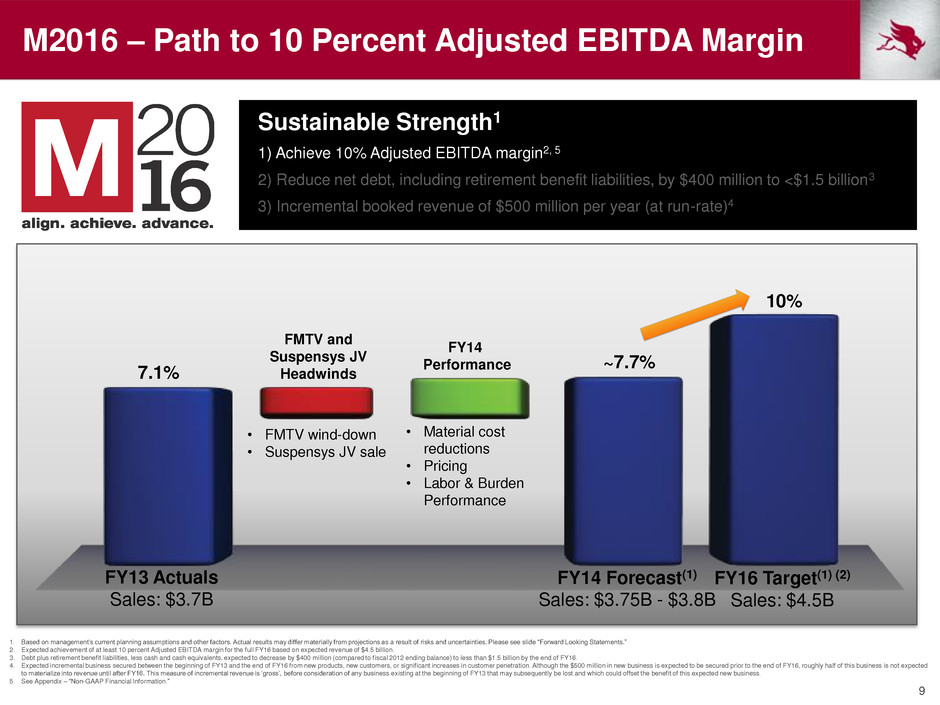
9 M2016 – Path to 10 Percent Adjusted EBITDA Margin Sustainable Strength1 1) Achieve 10% Adjusted EBITDA margin2, 5 2) Reduce net debt, including retirement benefit liabilities, by $400 million to <$1.5 billion3 3) Incremental booked revenue of $500 million per year (at run-rate)4 FY14 Forecast(1) Sales: $3.75B - $3.8B FY14 Performance FMTV and Suspensys JV Headwinds • FMTV wind-down • Suspensys JV sale • Material cost reductions • Pricing • Labor & Burden Performance 1. Based on management’s current planning assumptions and other factors. Actual results may differ materially from projections as a result of risks and uncertainties. Please see slide “Forward Looking Statements.” 2. Expected achievement of at least 10 percent Adjusted EBITDA margin for the full FY16 based on expected revenue of $4.5 billion. 3. Debt plus retirement benefit liabilities, less cash and cash equivalents, expected to decrease by $400 million (compared to fiscal 2012 ending balance) to less than $1.5 billion by the end of FY16. 4. Expected incremental business secured between the beginning of FY13 and the end of FY16 from new products, new customers, or significant increases in customer penetration. Although the $500 million in new business is expected to be secured prior to the end of FY16, roughly half of this business is not expected to materialize into revenue until after FY16. This measure of incremental revenue is ‘gross’, before consideration of any business existing at the beginning of FY13 that may subsequently be lost and which could offset the benefit of this expected new business. 5. See Appendix – “Non-GAAP Financial Information.” FY16 Target(1) (2) Sales: $4.5B 7.1% 10% FY13 Actuals Sales: $3.7B ~7.7%
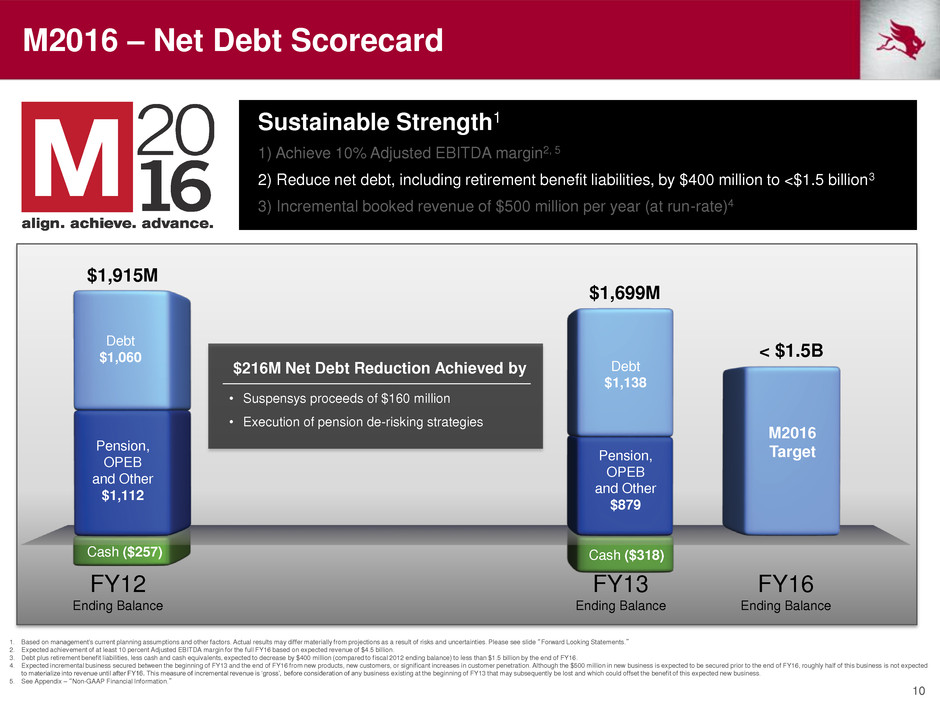
10 M2016 – Net Debt Scorecard Title FY12 Ending Balance FY13 Ending Balance FY16 Ending Balance $1,915M M2016 Target < $1.5B Sustainable Strength1 1) Achieve 10% Adjusted EBITDA margin2, 5 2) Reduce net debt, including retirement benefit liabilities, by $400 million to <$1.5 billion3 3) Incremental booked revenue of $500 million per year (at run-rate)4 1. Based on management’s current planning assumptions and other factors. Actual results may differ materially from projections as a result of risks and uncertainties. Please see slide “Forward Looking Statements.” 2. Expected achievement of at least 10 percent Adjusted EBITDA margin for the full FY16 based on expected revenue of $4.5 billion. 3. Debt plus retirement benefit liabilities, less cash and cash equivalents, expected to decrease by $400 million (compared to fiscal 2012 ending balance) to less than $1.5 billion by the end of FY16. 4. Expected incremental business secured between the beginning of FY13 and the end of FY16 from new products, new customers, or significant increases in customer penetration. Although the $500 million in new business is expected to be secured prior to the end of FY16, roughly half of this business is not expected to materialize into revenue until after FY16. This measure of incremental revenue is ‘gross’, before consideration of any business existing at the beginning of FY13 that may subsequently be lost and which could offset the benefit of this expected new business. 5. See Appendix – “Non-GAAP Financial Information.” $1,699M $216M Net Debt Reduction Achieved by • Suspensys proceeds of $160 million • Execution of pension de-risking strategies Debt $1,060 Pension, OPEB and Other $1,112 Cash ($257) Debt $1,138 Pension, OPEB and Other $879 Cash ($318)
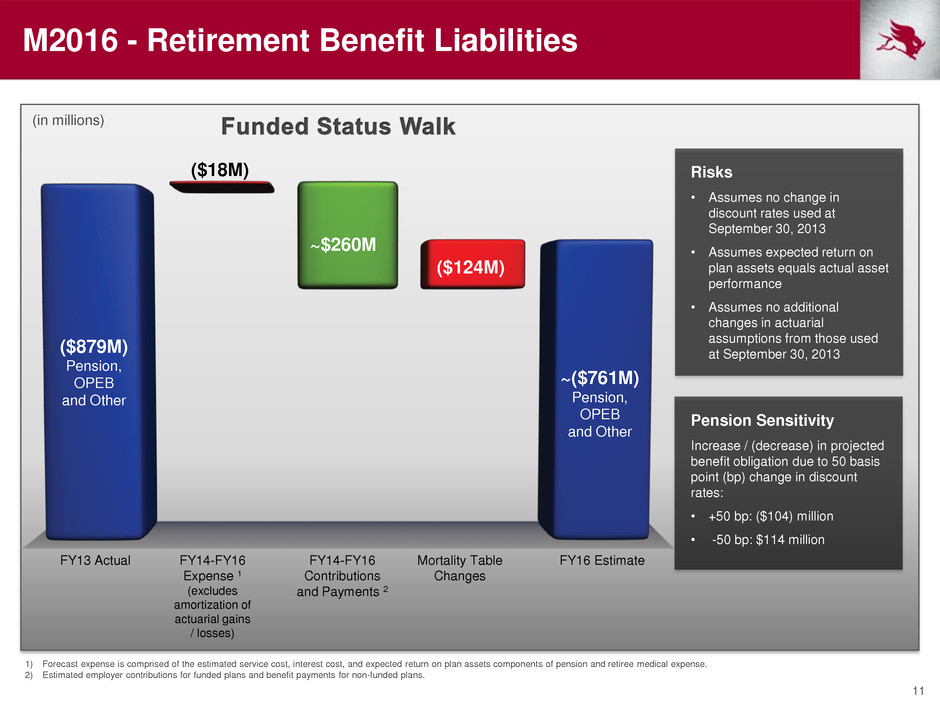
11 FY13 Actual FY14-FY16 Expense 1 (excludes amortization of actuarial gains / losses) FY14-FY16 Contributions and Payments 2 FY16 Estimate ($879M) Pension, OPEB and Other ~$260M ~($761M) Pension, OPEB and Other ($18M) (in millions) M2016 - Retirement Benefit Liabilities Risks • Assumes no change in discount rates used at September 30, 2013 • Assumes expected return on plan assets equals actual asset performance • Assumes no additional changes in actuarial assumptions from those used at September 30, 2013 1) Forecast expense is comprised of the estimated service cost, interest cost, and expected return on plan assets components of pension and retiree medical expense. 2) Estimated employer contributions for funded plans and benefit payments for non-funded plans. Pension Sensitivity Increase / (decrease) in projected benefit obligation due to 50 basis point (bp) change in discount rates: • +50 bp: ($104) million • -50 bp: $114 million ($124M) Mortality Table Changes
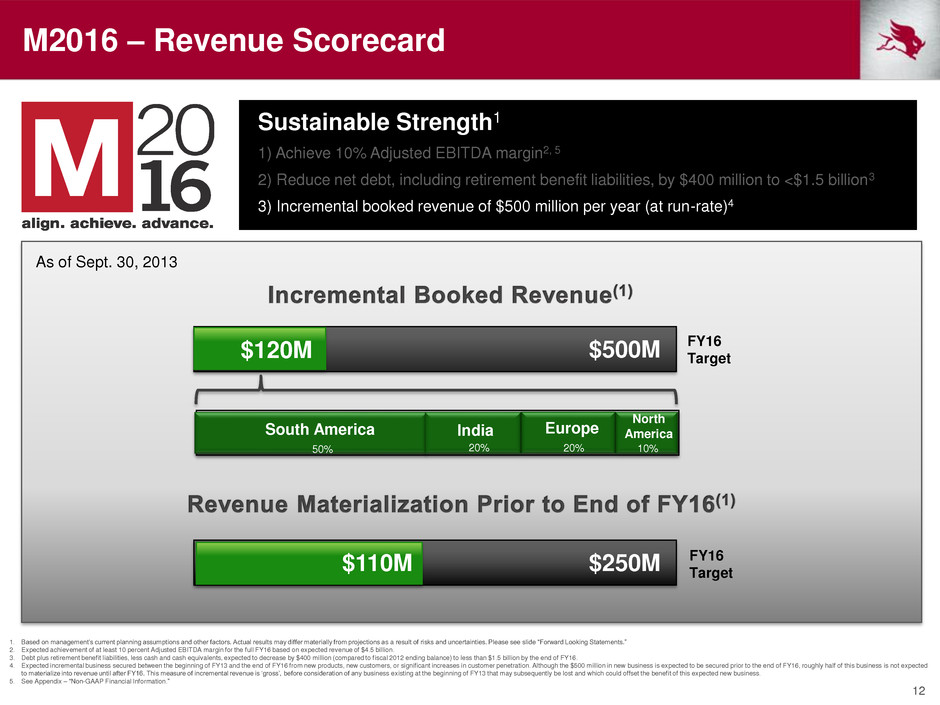
12 M2016 – Revenue Scorecard FY16 Target Sustainable Strength1 1) Achieve 10% Adjusted EBITDA margin2, 5 2) Reduce net debt, including retirement benefit liabilities, by $400 million to <$1.5 billion3 3) Incremental booked revenue of $500 million per year (at run-rate)4 1. Based on management’s current planning assumptions and other factors. Actual results may differ materially from projections as a result of risks and uncertainties. Please see slide “Forward Looking Statements.” 2. Expected achievement of at least 10 percent Adjusted EBITDA margin for the full FY16 based on expected revenue of $4.5 billion. 3. Debt plus retirement benefit liabilities, less cash and cash equivalents, expected to decrease by $400 million (compared to fiscal 2012 ending balance) to less than $1.5 billion by the end of FY16. 4. Expected incremental business secured between the beginning of FY13 and the end of FY16 from new products, new customers, or significant increases in customer penetration. Although the $500 million in new business is expected to be secured prior to the end of FY16, roughly half of this business is not expected to materialize into revenue until after FY16. This measure of incremental revenue is ‘gross’, before consideration of any business existing at the beginning of FY13 that may subsequently be lost and which could offset the benefit of this expected new business. 5. See Appendix – “Non-GAAP Financial Information.” $500M $250M FY16 Target $120M $110M North America South America Europe India 50% 20% 20% 10% As of Sept. 30, 2013

13
Appendix 14
15 Use of Non-GAAP Financial Information In addition to the results reported in accordance with accounting principles generally accepted in the United States (“GAAP”) included throughout this presentation, the company has provided information regarding Adjusted income or loss from continuing operations, Adjusted diluted earnings per share from continuing operations, Adjusted EDITDA, Adjusted EBITDA margin, free cash flow and net debt which are non-GAAP financial measures. Adjusted income (loss) from continuing operations and Adjusted diluted earnings (loss) per share from continuing operations are defined as reported income or loss from continuing operations and reported diluted earnings or loss per share from continuing operations before restructuring expenses, asset impairment charges and other special items as determined by management. Adjusted EBITDA is defined as income (loss) from continuing operations before interest, income taxes, depreciation and amortization, non-controlling interests in consolidated joint ventures, loss on sale of receivables, restructuring expenses, asset impairment charges and other special items as determined by management. Adjusted EBITDA margin is defined as Adjusted EBITDA divided by consolidated sales. Free cash flow is defined as cash flows provided by (used for) operating activities less capital expenditures. Net debt including retirement liabilities is defined as total debt plus pension assets, pension liability, retiree medical liability and other retirement benefits less cash and cash equivalents. Management believes that the non-GAAP financial measures used in this presentation are useful to both management and investors in their analysis of the company's financial position and results of operations. In particular, management believes that Adjusted EBITDA is a meaningful measure of performance as it is commonly utilized by management and the investment community to analyze operating performance in our industry. Further, management uses Adjusted EBITDA for planning and forecasting in future periods. Management believes that free cash flow is useful in analyzing our ability to service and repay debt. Net debt including retirement liabilities is a specific financial measure which is part of our three- year plan, M2016, to reduce debt and other balance sheet liabilities. Adjusted income (loss) from continuing operations, Adjusted diluted earnings (loss) per share from continuing operations and Adjusted EBITDA should not be considered a substitute for the reported results prepared in accordance with GAAP and should not be considered as an alternative to net income as an indicator of our operating performance or to cash flows as a measure of liquidity. Free cash flow should not be considered a substitute for cash provided by (used for) operating activities, or other cash flow statement data prepared in accordance with GAAP, or as a measure of financial position or liquidity. In addition, these non-GAAP cash flow measures do not reflect cash used to service debt or cash received from the divestitures of businesses or sales of other assets and thus do not reflect funds available for investment or other discretionary uses. These non-GAAP financial measures, as determined and presented by the company, may not be comparable to related or similarly titled measures reported by other companies. Set forth on the following pages are reconciliations of these non-GAAP financial measures to the most directly comparable financial measures calculated and presented in accordance with GAAP.
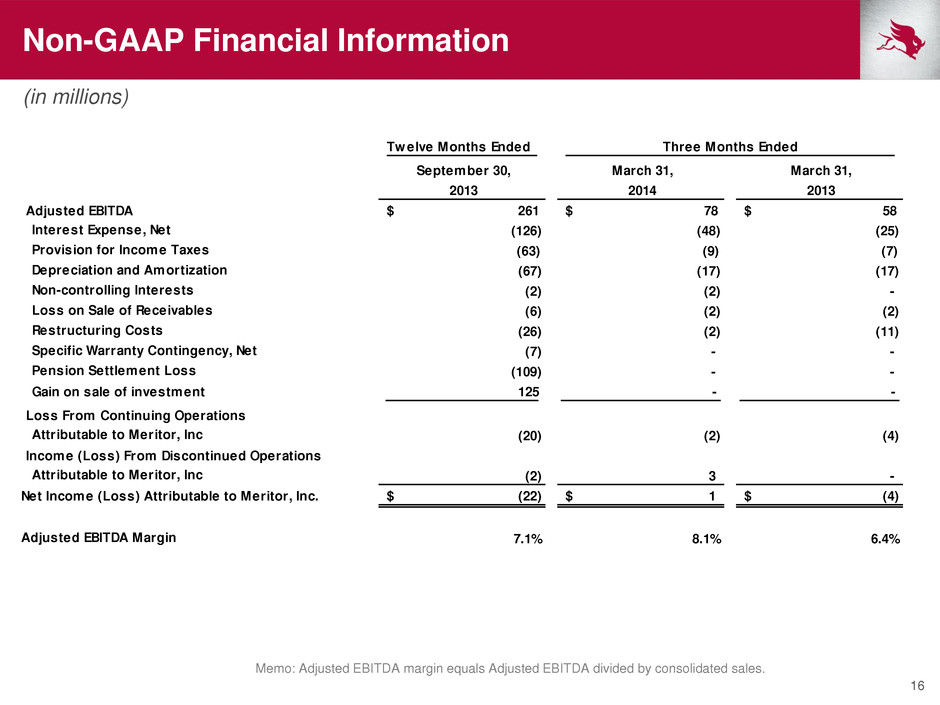
16 Non-GAAP Financial Information Memo: Adjusted EBITDA margin equals Adjusted EBITDA divided by consolidated sales. (in millions) Twelve Months Ended September 30, March 31, March 31, 2013 2014 2013 Adjusted EBITDA $ 261 $ 78 $ 58 Interest Expense, Net (126) (48) (25) Provision for Income Taxes (63) (9) (7) Depreciation and Amortization (67) (17) (17) Non-controlling Interests (2) (2) - Loss on Sale of Receivables (6) (2) (2) Restructuring Costs (26) (2) (11) Specific Warranty Contingency, Net (7) - - Pension Settlement Loss (109) - - Gain on sale of investment 125 - - Loss From Continuing Operations Attributable to Meritor, Inc (20) (2) (4) Income (Loss) From Discontinued Operations Attributable to Meritor, Inc (2) 3 - Net Income (Loss) Attributable to Meritor, Inc. (22)$ 1$ (4)$ Adjusted EBITDA Margin 7.1% 8.1% 6.4% Three Months Ended

17
