Attached files
| file | filename |
|---|---|
| 8-K - FORM 8-K - FINANCIAL INSTITUTIONS INC | d722684d8k.htm |
 May 7,
2014 Annual Meeting of
Shareholders
Exhibit 99.1 |
 John E. Benjamin
Chairman |
 Introductions
Call Meeting to Order
Call Meeting to Order
Director Nominations & Election
Director Nominations & Election
Ratify the Appointment of KPMG LLP as independent
Ratify the Appointment of KPMG LLP as independent
registered public accounting firm
registered public accounting firm
Non-Binding Vote on Executive Compensation
Non-Binding Vote on Executive Compensation
Management Presentation
Management Presentation
Voting Results
Voting Results
Closing Remarks
Closing Remarks
Agenda |
 Call Meeting to Order
Formal Meeting |
 Call Meeting to Order
Director Nominations & Election
Director Nominations & Election
Formal Meeting |
 Call Meeting to Order
Director Nominations & Election
Director Nominations & Election
Ratify the appointment of KPMG, LLP as independent
Ratify the appointment of KPMG, LLP as independent
registered public accounting firm
registered public accounting firm
Formal Meeting |
 Call Meeting to Order
Director Nominations & Election
Director Nominations & Election
Ratify the appointment of KPMG, LLP as independent
Ratify the appointment of KPMG, LLP as independent
registered public accounting firm
registered public accounting firm
Non-Binding Vote on Executive Compensation
Non-Binding Vote on Executive Compensation
Formal Meeting |
 Martin K. Birmingham
President and
Chief Executive Officer
Management Presentation |
 Statements contained in this presentation which are not historical
facts Statements contained in this presentation which are not
historical facts and which pertain to future operating results
of Financial Institutions, and which pertain to future
operating results of Financial Institutions, Inc.
Inc.
and
and
its
its
subsidiaries
subsidiaries
constitute
constitute
“forward
“forward
looking
looking
statements”
statements”
within
within
the meaning of the Private Securities Litigation Reform Act of
1995. the meaning of the Private Securities Litigation
Reform Act of 1995. These forward looking statements
involve significant risks and These forward looking statements
involve significant risks and uncertainties. We refer you
to the documents the Company files from uncertainties. We
refer you to the documents the Company files from time to time
with the Securities and Exchange Commission, time to time with
the Securities and Exchange Commission, specifically the
Company’s last filed Form 10-K and Form 10-Q.
specifically the Company’s last filed Form 10-K and Form
10-Q. These documents contain and identify important
factors that could These documents contain and identify
important factors that could cause actual results to differ
materially from those contained in our cause actual results to
differ materially from those contained in our projections or
forward looking statements. The Company assumes no projections
or forward looking statements. The Company assumes no
obligation to update any information presented herein.
obligation to update any information presented herein.
|
 The Fundamental Drivers of our Business Success
•
Core Deposit Growth
•
Quality Loan Growth
•
Sound Risk Management
•
Expense Management
•
Community Involvement
•
High Performance Culture
•
The Customer Experience |
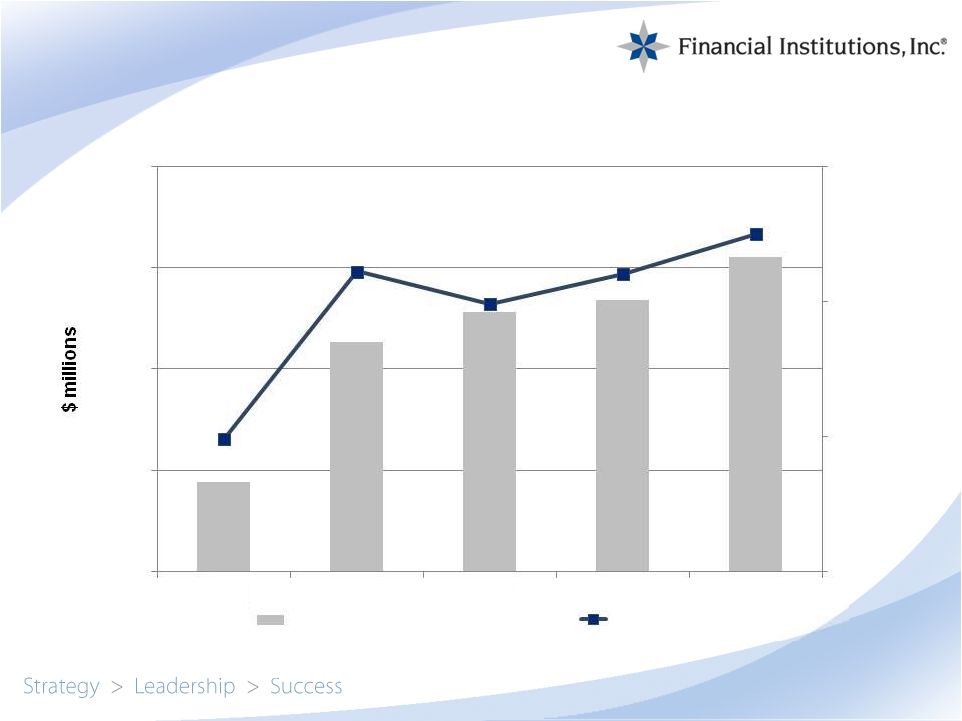
 Core Deposit Growth
$1,570
$1,699
$1,718
$2,039
$2,094
$2,268
$1,000
$1,200
$1,400
$1,600
$1,800
$2,000
$2,200
$2,400
$2,600
2009Y
2010Y
2011Y
2012Y
2013Y
2014Q1
Total Deposits
Core Deposits |
 Quality Loan Growth
$1,264
$1,346
$1,485
$1,834
$1,849
$1,000
$1,100
$1,200
$1,300
$1,400
$1,500
$1,600
$1,700
$1,800
$1,900
$2,000
2009Y
2010Y
2011Y
2012Y
2013Y
2014Q1
$1,706 |
 Sound Risk Management |
 E f f i c i e n c y R a t i o
E x p e n s e a s a P e r c e n
t o f R e v e n u e Expense
Management Note: Peer data as of 12/31/13 reflects median values
for the SNL US Banks $1-$5B Index
Peer
67.58%
65.52%
60.36%
60.55%
62.87%
58.48%
56.96%
50.00%
52.00%
54.00%
56.00%
58.00%
60.00%
62.00%
64.00%
66.00%
68.00%
2009Y
2010Y
2011Y
2012Y
2013Y
2014Q1 |
 Community Involvement |
 High Performance Culture
Engaged
Index
10%
Willingness to
Recommend
FSB
15%
Teamwork &
Personal
Growth
10%
Motivated
to Go
Above &
Beyond
3%
Source: Annual FSB Employee Assessments November 2012
compared to October 2013 |
 The Customer Experience
Customer
Loyalty
Overall
Satisfaction
Likelihood to
Recommend
Likelihood to
Continue to
Purchase
Likelihood to
Choose FSB
Again
4%
4%
3%
4%
6%
Source: Annual FSB Retail Customer Assessment; June 2013 compared
to April 2014 |
 4/30/13
4/30/14
Market capitalization
$263.9 mil.
$320.7 mil.
Shares outstanding
13.8 mil.
13.9 mil.
Price
$19.13
$23.15
52-week range
$15.71 -
$17.92 -
$20.83
$26.59
Annualized Dividend Rate
$ 0.72
$ 0.76
Dividend yield
3.76%
3.28%
Shareholder Value |
 Share Price
$13.64
$23.15 |
 Kevin B. Klotzbach
EVP and
Chief Financial
Officer/Treasurer
Financial Overview |
 22
Balance Sheet Growth
$1,264
$1,346
$1,485
$1,706
$1,834
$1,717
$1,849
$1,743
$1,883
$1,932
$2,262
$2,320
$2,409
$2,533
$2,062
$2,214
$2,336
$2,764
$2,929
$2,828
$3,016
$1,000
$1,500
$2,000
$2,500
$3,000
$3,500
2009Y
2010Y
2011Y
2012Y
2013Y
2013Q1
2014Q1 |
 23
Loan Portfolio Composition
6.5%
$0
$200
$400
$600
$800
$1,000
$1,200
$1,400
$1,600
$1,800
$2,000
2009Y
2010Y
2011Y
2012Y
2013Y
2013Q1
2014Q1
Comm Loan
Comm Mortg
Res Mortg
Home Equity
Indirect
Consumer
9.1%
12.9%
15.9% |
 24
Note: Peer data reflects median values for the component companies
within each group obtained from SNL Financial.
NPAs / Assets
0.56%
1.49%
1.27%
0.00%
0.50%
1.00%
1.50%
2.00%
2.50%
3.00%
3.50%
2009Y
2010Y
2011Y
2012Y
2013Y
2014Q1
FISI
SNL US Banks $1-$5B
Mid-Atl. Banks $1-$5B |
 Low risk security portfolio
High percentage of the portfolio consists
of securities backed by the U.S.
government and agencies
$860 million in total securities and the
majority are utilized for various pledging
purposes
25
Data as of December 31,2013
Low Risk Securities Portfolio
15.6%
23.7%
31.6%
29.1%
US Gov't Agencies & GSE
US Gov't Agencies CMO's
US
Gov't
Agencies
Mtg,
Backed
Pass-Throughs
HTM Municipal Debt ($250 Million) |
 26
Deposit Composition
$0
$500
$1,000
$1,500
$2,000
$2,500
$3,000
2009Y
2010Y
2011Y
2012Y
2013Y
2013Q1
2014Q1
CDs >$100
CDs <$100
Savings & MM
Int-bearing Demand
Nonint-bearing Demand
18.1%
6.7%
13.4% |
 27
Capital Adequacy
12.08%
10.82%
7.63%
6.72%
4.00%
6.00%
8.00%
10.00%
12.00%
14.00%
16.00%
2009
2010
2011
2012
2013
Total Risk-Based Capital
Tier 1 Risk-Based Capital
Leverage Ratio
Tang. Comm. Equity / Tang. Assets |
 28
Note: All periods exclude OTTI & Securities Gains
Revenue Growth
$72.3
$78.8
$81.9
$88.5
$91.6
$22.9
$23.3
$20.0
$19.9
$20.9
$22.2
$23.6
$5.7
$6.0
$0.0
$20.0
$40.0
$60.0
$80.0
$100.0
$120.0
$140.0
2009Y
2010Y
2011Y
2012Y
2013Y
2013Q1
Net Interest Income
Noninterest Income
$29.3
$28.6
2014Q1 |
 29
Net Interest Income
Continues to
Grow…
…despite margin
compression
headwinds
Growing Net Interest Income
3.00%
3.20%
3.40%
3.60%
3.80%
4.00%
4.20%
4.40%
4.60%
4.80%
5.00%
$0.0
$10.0
$20.0
$30.0
$40.0
$50.0
$60.0
$70.0
$80.0
$90.0
$100.0
2009Y
2010Y
2011Y
2012Y
2013Y
Net Interest Income
Net Interest Margin
$91.6
3.64% |
 30
12/31/13
YTD $23.6 Million
12/31/12
YTD $21.2 Million
All periods exclude OTTI &
Securities Gains
Noninterest Income
39%
21%
9%
8%
23%
42%
22%
10%
7%
19%
Service Charges on Deposits
ATM & Debit Card Revenue
Investment Advisory Revenue
Company Owned Life Insurance
Other |
 31
Revenue grew by 25% since 2009 while
expenses increased by only 11%
Noninterest Expense
65.52%
58.48%
54.00%
56.00%
58.00%
60.00%
62.00%
64.00%
66.00%
68.00%
$0
$10
$20
$30
$40
$50
$60
$70
$80
$90
2009Y
2010Y
2011Y
2012Y
2013Y
Noninterest expense
Efficiency Ratio |
 32
Provision for Loan Loss
0.47%
0.40%
0.00%
0.10%
0.20%
0.30%
0.40%
0.50%
0.60%
$0
$2
$4
$6
$8
$10
2009Y
2010Y
2011Y
2012Y
2013Y
Provision
Net Charge
-Offs |
 33
Earnings
$14.4
$21.3
$22.8
$23.4
$25.5
$0.99
$1.61
$1.49
$1.60
$1.75
$0.50
$1.00
$1.50
$2.00
$10.0
$15.0
$20.0
$25.0
$30.0
2009
2010
2011
2012
2013
Net Income
Diluted EPS |
 34
Source: SNL Financial
Note: FISI market data as of 4/30/2014. Peer data reflects median
values for the component companies within each group as
of 3/31/14. Dividend Yield
3.28%
2.10%
1.63%
0.0%
0.5%
1.0%
1.5%
2.0%
2.5%
3.0%
3.5%
FISI
Mid-Atl. Banks
$1-$5B
SNL US Banks
$1-$5B |
 35
Source: SNL Financial
Note: Market data as of 4/30/2014. Peer data reflects median values
for the component companies within each group
Total Shareholder Return
82%
68%
71%
25%
22%
23%
0%
10%
20%
30%
40%
50%
60%
70%
80%
90%
FISI
Mid-Atl. Banks $1-$5B
SNL US Banks $1-$5B
5 Year Return
1 Year Return |
 Voting Results
John E. Benjamin
John E. Benjamin
Chairman |
 Closing Remarks
John E. Benjamin
John E. Benjamin
Chairman |
 May 7,
2014 Annual Meeting of
Shareholders |