Attached files
| file | filename |
|---|---|
| 8-K - CURRENT REPORT ON FORM 8-K - DELTA AIR LINES, INC. | delta_8k.htm |
Exhibit 99.1

Delta: Setting A New Standard Bank of America/Merrill Lynch Transportation Conference May 7, 2014
2 This presentation contains various projections and other forward - looking statements which represent Delta’s estimates or expectations regarding future events. All forward - looking statements involve a number of assumptions, risks and uncertainties, many of which are beyond Delta’s control, that could cause the actual results to differ materially from the projected results. Factors which could cause such differences include, without limitation, business, economic, competitive, industry, regulatory, market and financial uncertainties and contingencies, as well as the “Risk Factors” discussed in Delta’s SEC filings. Caution should be taken not to place undue reliance on Delta’s forward - looking statements, which represent Delta’s views only as of the date of this presentation, and which Delta has no current intention to update. In this presentation, we will discuss certain non - GAAP financial measures. You can find the reconciliations of those measures to comparable GAAP measures on our website at delta.com. Safe Harbor

3 Setting A New Standard Taking Momentum into 2014 Setting the Long - Term Foundation Balanced Capital Deployment Leveraging Delta’s strengths with initiatives to further our financial momentum and achieve long - term financial goals Building on a record setting 2013 with further earnings growth, margin expansion and free cash flow generation in 2014 Balanced cash deployment allows for reinvestment in the business, strengthening the balance sheet through debt and pension reduction, and returning cash to shareholders

4 Outpacing The Airline Industry • Delta is the leader in an evolving industry $3,038 $2,563 $1,408 $904 $688 $262 • Record $444 million pre - tax profit, a $363 million increase year over year, with 400 basis points of pre - tax margin expansion • $390 million of free cash flow, adjusted net debt of $9.1 billion, $600 million contributed to the pension plans, and $175 million returned to shareholders • Highest customer satisfaction scores among network carriers • Recognized as Fortune’s “Most Admired Airline”, “Best Airline” by Business Travel News, and “Airline of the Year” by Air Transport World LTM 1Q14 Pre - Tax Income ($M) 1Q 2014 Highlights Excludes special items
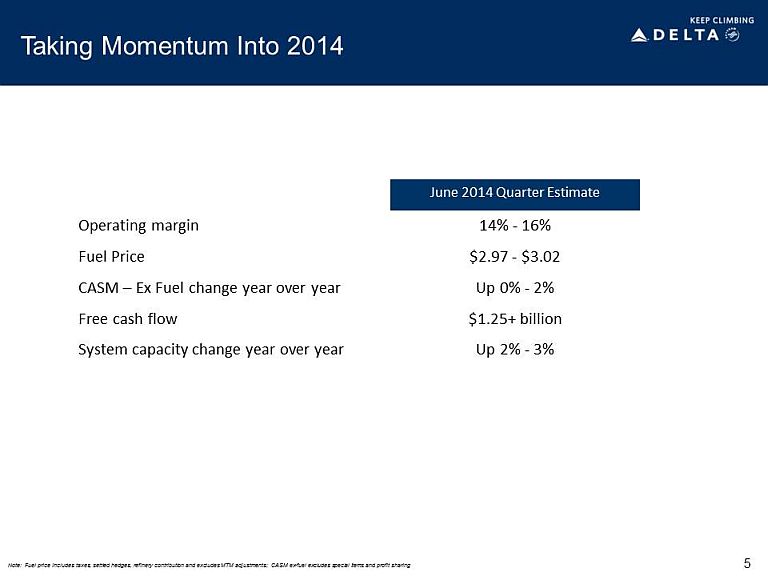
5 Taking Momentum Into 2014 June 2014 Quarter Estimate Operating margin 14% - 16% Fuel Price $2.97 - $3.02 CASM – Ex Fuel change year over year Up 0% - 2 % Free cash flow $1.25+ billion System capacity change year over year Up 2% - 3% Note: Fuel price includes taxes, settled hedges, refinery contribution and excludes MTM adjustments; CASM ex - fuel excludes special items and profit sharing
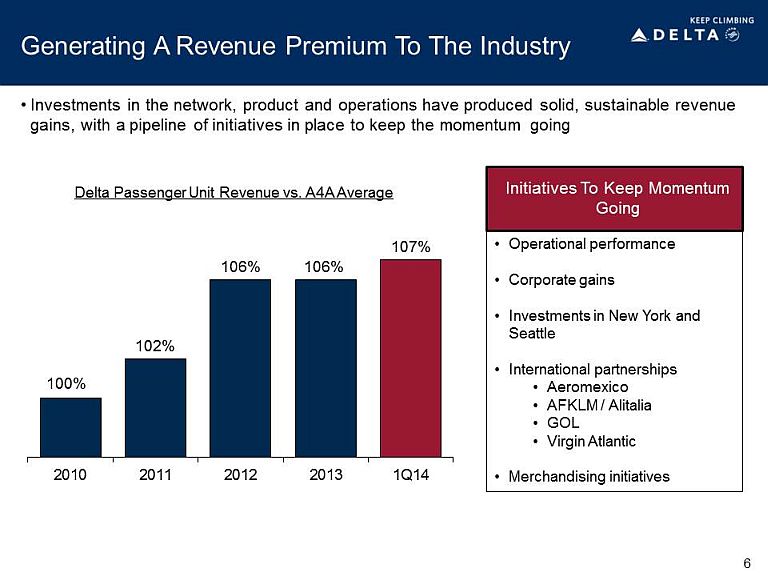
6 Generating A Revenue Premium To The Industry • Investments in the network, product and operations have produced solid, sustainable revenue gains, with a pipeline of initiatives in place to keep the momentum going 100% 102% 106% 106% 107% 2010 2011 2012 2013 1Q14 Delta Passenger Unit Revenue vs. A4A Average • Operational performance • Corporate gains • Investments in New York and Seattle • International partnerships • Aeromexico • AFKLM / Alitalia • GOL • Virgin Atlantic • Merchandising initiatives Initiatives To Keep Momentum Going

4.6% 3.7% 1.2% 0.3% 2012 1H13 2H13 1Q14 2Q14E Long Term <2% Growth 7 Sustaining Our Cost Performance • Initiatives have contributed to our ability to keep non - fuel unit costs below 2% Sustaining Our Cost Performance Non - Fuel Unit Cost Growth Excludes special items • A solid base of supply chain, productivity, and maintenance initiatives in 2013 established momentum for 2014 and beyond • Leveraging the strengths across the business to sustain this cost performance going forward – Domestic refleeting – Maintenance – Headcount – Supply chain – Productivity – Technology 0 – 2%

-15 -10 -5 0 5 10 15 Jan-11 Jan-12 Jan-13 Jan-14 Jet Fuel Premium/(Discount) to ULSD Historical Avg (pre-2013) • Trainer expected to generate modest profit for 2014 – Small loss in 1Q14 despite taking down major unit to improve future distillate production • Shifting to less expensive domestic Bakken crude supply – Targeting 70K bpd in 2014 vs. 17K in 2013 – Lowers average crude cost by $2 - 3 per barrel 8 • Well positioned for 2014 at current price levels • Current hedge position expected to generate approximately $300 million of benefit in 2014 • Roughly 20% hedged for the first half of year Trainer Refinery Fuel Hedging ¢ Jet Fuel Premium/(Discount) to ULSD (cents per gallon) ¢ ¢ ¢ ¢ ¢ Managing Fuel Expense to Reduce Risk • Unique approach to Delta’s largest input cost

9 Long - Term Goals Guide the Planning Process • 10 - 12% annual operating margins Operating Margin • Annual EPS growth of 10% - 15% EPS Growth • 15%+ return on invested capital ROIC • $5+ billion annual operating cash flow with ~50% reinvested back into the business Cash Flow • Investment grade credit metrics and $7 billion adjusted net debt by 2015 Balance Sheet Long - term goals provided the core foundation… • Our long - term goals target solid margins and cash flow, investment grade quality balance sheet, and sustainable shareholder returns • 11 - 14% operating margins Operating Margin • Annual EPS growth of 10% - 15% after 2014 EPS Growth • 15 - 18% return on invested capital ROIC • $6 billion annual operating cash flow and $3 billion free cash flow Cash Flow • $5 billion adjusted net debt by 2016 and pension at 80% funded status by 2020 Balance Sheet …for our updated five year plan targets

10 2014’s Five Year Plan Continues Our Momentum • 2014’s five year plan shows path to achieving our long - term financial goals with margin expansion, free cash flow generation, and balance sheet improvement Revenue Growth Strong Cash Flow Cost Efficiency Capacity Discipline Grow passenger, ancillary and third - party business revenues by harvesting investments in operational reliability, products, and network Maintain historical capacity discipline through conservative fuel and GDP assumptions and fleet flexibility Focus on all areas of the cost base – maintain non - fuel unit cost growth below 2% annually, manage fuel costs and risk through the refinery and hedging, and continue interest savings from debt reduction Allocate $6 billion annual operating cash flows to reinvestment in the business, strengthening the balance sheet through debt reduction and incremental pension funding, and returning cash to shareholders

11 Debt Reduction Remains A Priority • Debt levels have been reduced significantly, but more delevering is needed; targeting $5 billion of adjusted net debt by the end of 2016 • Debt reduction provides earnings tailwind; interest expense at $5 billion debt level should be ~$350 million per year, down from $750 million in 2014 and $1.3 billion in 2009 Adjusted Net Debt $ 17.0B $ 15.0B $ 12.9B $ 11.7B $ 9.4B $ 5.0B 2009 2010 2011 2012 2013 2016E • Further delevering creates value by: – Reducing Delta’s cost of capital, lowering funding costs – Improving earnings through lower interest expense – De - risking the business through a healthier balance sheet – Providing more consistent access to the capital markets by reducing leverage and improving Delta’s credit metrics Excludes special items

12 Addressing Long - Term Pension Obligations • Plan to maintain pension funding at $1 billion per year through 2020, consistent with 2013 - 14 levels • Incremental pension funding helps drive balance sheet improvement – At current rates, pension would be 80% funded and balance sheet liability reduced to $3.5 billion by 2020 – With a 100 bps increase in discount rates, the liability would decline to $2 billion over that time • Higher funded status will reduce pension expense, currently at $230 million for 2014 • Plans are permanently frozen and closed to new participants. No additional benefits are accruing to existing plan participants • Continued flexibility on future funding as a result of airline relief contained in the Pension Protection Act of 2006 – Delta has until 2031 to fully fund pension plans Pension Funded Status 40% 50% 60% 70% 80% 90% 100% 2014 2017 2020 At current discount rates With 100 bps increase in discount rates • Targeting 80% funded status by 2020

13 Increasing Shareholder Returns • Demonstrating a strong commitment to shareholder returns with 50% increase to the dividend and a new $2 billion share repurchase authorization • Return levels moving closer to averages of high quality industrial peer set Regular Dividend $300 million per year Share Repurchase Authorization $2 billion through 2016 • Dividend represents a long - term commitment to returning cash to our owners • Increasing quarterly dividend by 50% to $0.09 per share beginning in the September 2014 quarter - At Monday’s closing price, this represents ~1% dividend yield • Share repurchase program provides flexibility to adapt to seasonal cash flows and changing economic conditions - Have shown our willingness to accelerate buybacks with excess free cash flow • New $2 billion share repurchase has been authorized, to be completed no later than December 31, 2016 - May 2013 $500 million authorization set to be completed in early June 2014, two years ahead of its expiration date Plan To Return Additional $2.75 Billion To Shareholders Through 2016

• Plan targets compare favorably with other high quality industrial transports and should help drive better valuations 14 The Path To Improved Valuation 14% Delta High Quality Industrial Transports ROIC Delta High Quality Industrial Transports EPS Growth $ 3.0B $ 1.5B Delta High Quality Industrial Transports Free Cash Flow Note: High quality industrial transports are companies with similar index characteristics to Delta – part of S&P 500 and Dow Tra nsportation Index (CHRW, CSX, EXPD, FDX, KSU, NSC, R, UNP, UPS); For high quality industrial transports, ROIC is five year historical average and free cash flow and EPS growth are 201 4 - 1 6 analyst consensus. Data source is Thomson One 10 – 15% 10.9 12.8 13.0 13.2 15.3 15.4 16.0 16.7 18.5 18.9 19.8 Forward Price to Earnings EV to EBITDA 5.8 7.1 7.2 8.3 9.1 9.8 9.9 11.0 11.4 12.5 13.1 15 – 18% 14% Excludes special items

Non - GAAP Reconciliations 16

Non-GAAP Financial Measures
Delta sometimes uses information ("non-GAAP financial measures") that is derived from the Consolidated Financial Statements, but that is not presented in accordance with accounting principles generally accepted in the U.S. ("GAAP"). Under the U.S. Securities and Exchange Commission rules, non-GAAP financial measures may be considered in addition to results prepared in accordance with GAAP, but should not be considered a substitute for or superior to GAAP results. The tables below show reconciliations of non-GAAP financial measures used in this press release to the most directly comparable GAAP financial measures.
Forward Looking Projections. Delta is unable to reconcile certain forward-looking projections to GAAP as the nature or amount of special items cannot be estimated at this time.
Non - GAAP Reconciliations Non - GAAP Financial Measures 17 Delta sometimes uses information ("non-GAAP financial measures") that is derived from the Consolidated Financial Statements, but that is not presented in accordance with accounting principles generally accepted in the U.S. ("GAAP"). Under the U.S. Securities and Exchange Commission rules, non- GAAP financial measures may be considered in addition to results prepared in accordance with GAAP, but should not be considered a substitute for or superior to GAAP results. The tables below show reconciliations of non-GAAP financial measures used in this press release to the most directly comparable GAAP financial measures. Forward Looking Projections. Delta is unable to reconcile certain forward-looking projections to GAAP as the nature or amount of special items cannot be estimated at this time.
| 17 |
Pre-Tax Income & Margin
Delta excludes special items from pre-tax income and margin because management believes the exclusion of these items is helpful to investors to evaluate the company's recurring core operational performance in the periods shown. Therefore, we adjust for these amounts to arrive at more meaningful financial measures. Special items excluded in the tables below showing the reconciliation of pre-tax income are:
Mark-to-market adjustments on fuel hedges recorded in periods other than the settlement period ("MTM adjustments"). MTM adjustments are based on market prices at the end of the reporting period for contracts settling in future periods. Such market prices are not necessarily indicative of the actual future value of the underlying hedge in the contract settlement period. Therefore, excluding these adjustments allows investors to better understand and analyze the company's core operational performance in the periods shown.
Restructuring and other items. Because of the variability in restructuring and other items, the exclusion of this item is helpful to investors to analyze the company’s recurring core operational performance in the periods shown.
Loss on extinguishment of debt and other. Because of the variability in loss on extinguishment of debt and other, the exclusion of this item is helpful to investors to analyze the company’s recurring core operational performance in the periods shown.
Three Months Ended | Last Twelve Months Ended March 31, | |||||||||||||||
| (in millions) | 2014 | 2013 | Change | 2014 | ||||||||||||
| Pre-tax income | $ | 335 | $ | 3 | $ | 2,859 | ||||||||||
| Items excluded: | ||||||||||||||||
| MTM adjustments | 34 | (24 | ) | (218 | ) | |||||||||||
| Restructuring and other items | 49 | 102 | 349 | |||||||||||||
| Loss on extinguishment of debt and other | 26 | – | 48 | |||||||||||||
| Pre-tax income, excluding special items | $ | 444 | $ | 81 | $ | 363 | $ | 3,038 | ||||||||
| 2014 | 2013 | Change | ||||||||||
| Pre-tax margin | 3.8% | 0.0% | ||||||||||
| Items excluded: | ||||||||||||
| MTM adjustments | 0.4% | -0.2% | ||||||||||
| Restructuring and other items | 0.5% | 1.2% | ||||||||||
| Loss on extinguishment of debt and other | 0.3% | 0.0% | ||||||||||
| Pre-tax margin, excluding special items | 5.0% | 1.0% | 400 pts | |||||||||
| 18 |
Free Cash Flow
Delta presents free cash flow because management believes this metric is helpful to investors to evaluate the company's ability to generate cash that is available for use for debt service or general corporate initiatives.
| (in millions) | Three Months Ended March 31, 2014 | |||
| Net cash provided by operating activities | $ | 951 | ||
| Net cash used in investing activities | (561 | ) | ||
| Total free cash flow | $ | 390 | ||
Adjusted Net Debt
Delta uses adjusted total debt, including aircraft rent, in addition to long-term adjusted debt and capital leases, to present estimated financial obligations. Delta reduces adjusted total debt by cash, cash equivalents and short-term investments resulting in adjusted net debt to present the amount of assets needed to satisfy the debt. Management believes this metric is helpful to investors in assessing the company’s overall debt profile.
| Three Months Ended March 31, 2014 | December 31, 2013 | December 31, 2012 | December 31, 2011 | December 31, 2010 | December 31, 2009 | |||||||||||||||||||||||||||||||||||||||||||
| Debt and capital lease obligations | $ | 11.0 | $ | 11.3 | $ | 12.7 | $ | 13.8 | $ | 15.3 | $ | 17.2 | ||||||||||||||||||||||||||||||||||||
| Plus: unamortized discount, net from purchase accounting and fresh start reporting | 0.4 | 0.4 | 0.5 | 0.6 | 0.6 | 1.1 | ||||||||||||||||||||||||||||||||||||||||||
| Adjusted debt and capital lease obligations | $ | 11.4 | $ | 11.7 | $ | 13.2 | $ | 14.4 | $ | 15.9 | $ | 18.3 | ||||||||||||||||||||||||||||||||||||
| Plus: 7x last twelve months' aircraft rent | 1.4 | 1.5 | 1.9 | 2.1 | 2.7 | 3.4 | ||||||||||||||||||||||||||||||||||||||||||
| Adjusted total debt | 12.8 | 13.2 | 15.1 | 16.5 | 18.6 | 21.7 | ||||||||||||||||||||||||||||||||||||||||||
| Less: cash, cash equivalents and short-term investments | (3.7 | ) | (3.8 | ) | (3.4 | ) | (3.6 | ) | (3.6 | ) | (4.7 | ) | ||||||||||||||||||||||||||||||||||||
| Adjusted net debt | $ | 9.1 | $ | 9.4 | $ | 11.7 | $ | 12.9 | $ | 15.0 | $ | 17.0 | ||||||||||||||||||||||||||||||||||||
| 19 |
CASM-Ex
Cost per Available Seat Mile or Non-Fuel Unit Cost ("CASM-Ex"): We exclude the following items from consolidated CASM to evaluate the company’s core cost performance:
Aircraft fuel and related taxes. The volatility in fuel prices impacts the comparability of year-over-year non-fuel financial performance. The exclusion of aircraft fuel and related taxes (including our regional carriers under capacity purchase arrangements) allows investors to better understand and analyze our non-fuel costs and our year-over-year financial performance.
Ancillary businesses. Our ancillary businesses include aircraft maintenance and staffing services we provide to third parties and our vacation wholesale operations. Because these businesses are not related to the generation of a seat mile, we exclude the costs related to these businesses to provide a more meaningful comparison of costs of our airline operations to the rest of the airline industry.
Profit sharing. We exclude profit sharing because this exclusion allows investors to better understand and analyze our recurring cost performance and provides a more meaningful comparison of our core operating costs to the airline industry.
Restructuring and other items and MTM adjustments. We exclude restructuring and other items and MTM adjustments from CASM for the same reasons described previously under the heading Pre-Tax Income & Margin.
| Year Ended December 31, | |||||||||
| 2012 | 2011 | ||||||||
| CASM | 14.97 | ¢ | 14.12 | ¢ | |||||
| Items excluded: | |||||||||
| Aircraft fuel and related taxes | (5.32 | ) | (5.00 | ) | |||||
| Ancillary businesses | (0.38 | ) | (0.37 | ) | |||||
| Profit sharing | (0.16 | ) | (0.11 | ) | |||||
| Restructuring and other items | (0.20 | ) | (0.10 | ) | |||||
| MTM adjustments | 0.01 | (0.01 | ) | ||||||
| CASM-Ex | 8.92 | ¢ | 8.53 | ¢ | |||||
| Year-over-year change | 4.6% | ||||||||
| Six Months Ended | |||||||||||||||||
| June 30, | June 30, | December 31, | December 31, | ||||||||||||||
| 2013 | 2012 | 2013 | 2012 | ||||||||||||||
| CASM | 15.12 | ¢ | 15.49 | ¢ | 14.44 | ¢ | 14.46 | ¢ | |||||||||
| Items excluded: | |||||||||||||||||
| Aircraft fuel and related taxes | (5.14 | ) | (5.42 | ) | (4.94 | ) | (5.22 | ) | |||||||||
| Ancillary businesses | (0.31 | ) | (0.42 | ) | (0.34 | ) | (0.34 | ) | |||||||||
| Profit sharing | (0.12 | ) | (0.12 | ) | (0.31 | ) | (0.20 | ) | |||||||||
| Restructuring and other items | (0.12 | ) | (0.16 | ) | (0.22 | ) | (0.23 | ) | |||||||||
| MTM adjustments | (0.09 | ) | (0.36 | ) | 0.31 | 0.37 | |||||||||||
| CASM-Ex | 9.34 | ¢ | 9.01 | ¢ | 8.94 | ¢ | 8.84 | ¢ | |||||||||
| Year-over-year change | 3.7% | 1.2% | |||||||||||||||
| Three Months Ended March 31, |
|||||||||
| 2014 | 2013 | ||||||||
| CASM (cents) | 15.39 | ¢ | 15.61 | ¢ | |||||
| Items excluded: | |||||||||
| Aircraft fuel and related taxes | (5.01 | ) | (5.28 | ) | |||||
| Ancillary businesses | (0.34 | ) | (0.35 | ) | |||||
| Profit sharing | (0.18 | ) | (0.04 | ) | |||||
| Restructuring and other items | (0.09 | ) | (0.19 | ) | |||||
| CASM-Ex | 9.77 | ¢ | 9.75 | ¢ | |||||
| 0.3% | |||||||||
| 20 |