Attached files
| file | filename |
|---|---|
| 8-K - FORM 8-K - HYSTER-YALE MATERIALS HANDLING, INC. | d721181d8k.htm |
 INVESTOR PRESENTATON
May 2014
1
Exhibit 99.1 |
 1
Safe Harbor Statement
The following information includes forward-looking statements within the meaning of
Section 27A of the Securities Act of 1933, as amended, and Section 21E of the
Securities Exchange Act of 1934, as amended. Any and all statements regarding the Company’s
expected future financial position, results of operations, cash flows, business
strategy, budgets, projected costs, capital expenditures, products, competitive
positions, growth opportunities, plans, goals and objectives of management for future operations, as well as
statements that include words such as “anticipate,” “if,”
“believe,” “plan,” “estimate,” “expect,” “intend,” “may,” “could,” “should,” “will,” and
other similar expressions are forward-looking statements. Such forward-looking
statements are inherently uncertain, and readers must recognize that actual
results may differ materially from the expectations of the Company’s management. The Company does not
undertake a duty to update such forward-looking statements. Among the factors that
could cause plans, actions and results to differ materially from current
expectations include, without limitation, reduction in demand for lift trucks and related aftermarket parts and
service on a global basis, the ability of dealers, suppliers and end-users to
obtain financing at reasonable rates, or at all, as a result of current economic
and market conditions, the political and economic uncertainties in Eastern Europe, customer acceptance of pricing,
delays in delivery or increases in costs, including transportation costs, of raw
materials or sourced products and labor or changes in or unavailability of
quality suppliers, exchange rate fluctuations, changes in foreign import tariffs and monetary policies and other changes in
the regulatory climate in the foreign countries in which the Company operates and/or
sells products, delays in manufacturing and delivery schedules, bankruptcy of or
loss of major dealers, retail customers or suppliers, customer acceptance of, changes in the costs of, or
delays in the development of new products, introduction of new products by, or more
favorable product pricing offered by, competitors, product liability or other
litigation, warranty claims or returns of products, the effectiveness of the cost reduction programs implemented
globally, including the successful implementation of procurement and sourcing
initiatives, changes mandated by federal, state and other regulation, including
health, safety or environmental legislation, delays in or increased costs associated with the Brazil plant construction,
delays in or cancellation of the sale of the existing Brazil facility and land and
other risks identified in the Company’s Annual Report on Form 10-K and
other filings with the Securities and Exchange Commission. Many of these factors are outside of the Company’s control. |
 2
Hyster-Yale Snapshot
Hyster-Yale
Materials
Handling,
Inc.
(NYSE:HY)
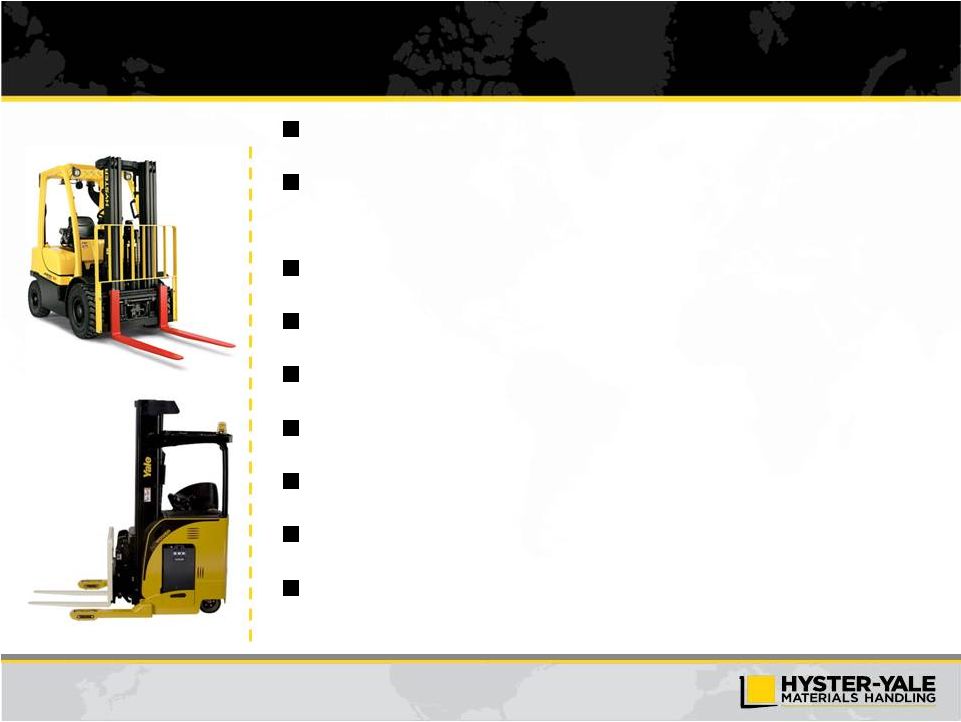
Leading global designer, manufacturer and marketer of lift
trucks and provider of aftermarket parts and support
Headquartered in Cleveland, Ohio
Over 5,100 employees globally
LTM
3/31/14
Revenue
–
$2.7
billion
LTM
3/31/14
Net
income
-
$107.5
million
LTM
3/31/14
EBITDA
(1)
–
$164.0
million
3/31/14
Net
cash
–
$74.3
million
LTM 3/31/14 ROTCE
(1)
of 30.6% (Net cash basis)
_____________________
(1)
EBITDA and ROTCE are non-GAAP measures and should not be considered in isolation or
as a substitute for GAAP measures. For discussion of non-GAAP items and the related
reconciliations to GAAP measures, see pages starting on 30.
|
 3
Growth similar to GDP levels in developed markets with emerging markets
driving expansion, particularly China
Strong demand for warehouse and distribution industry applications
Increasing focus on electric truck technology development
Importance of total lifecycle cost of ownership
Key Themes
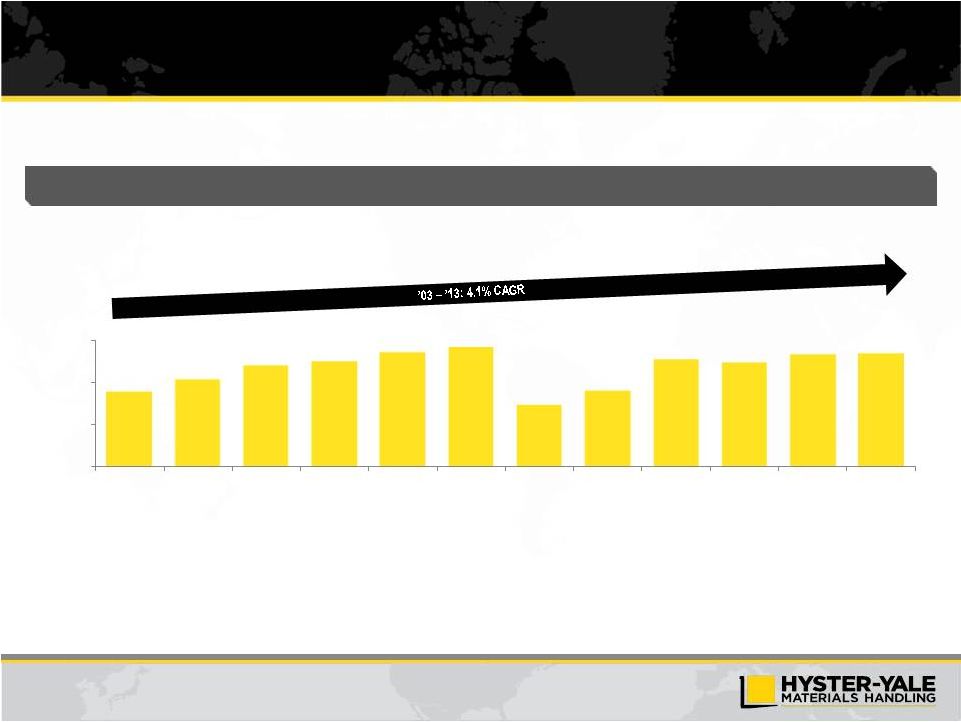
Industry Overview
(units in thousands)
Global Lift Truck Industry Size
Source: WITS. Represents order intake.
Global Lift Truck Industry Breakdown (Units)
Source: WITS. LTM 3/31/14 order intake.
Long-term CAGR (2003 –
2013) = 5.3%
951
872
547
794
975
944
1,009
1,033
0
300
600
900
1,200
2007
2008
2009
2010
2011
2012
2013
LTM Q1 14
Europe
30%
China
25%
Americas
25%
Japan
7%
Asia Pacific
7%
Middle East & Africa
6% |
 4
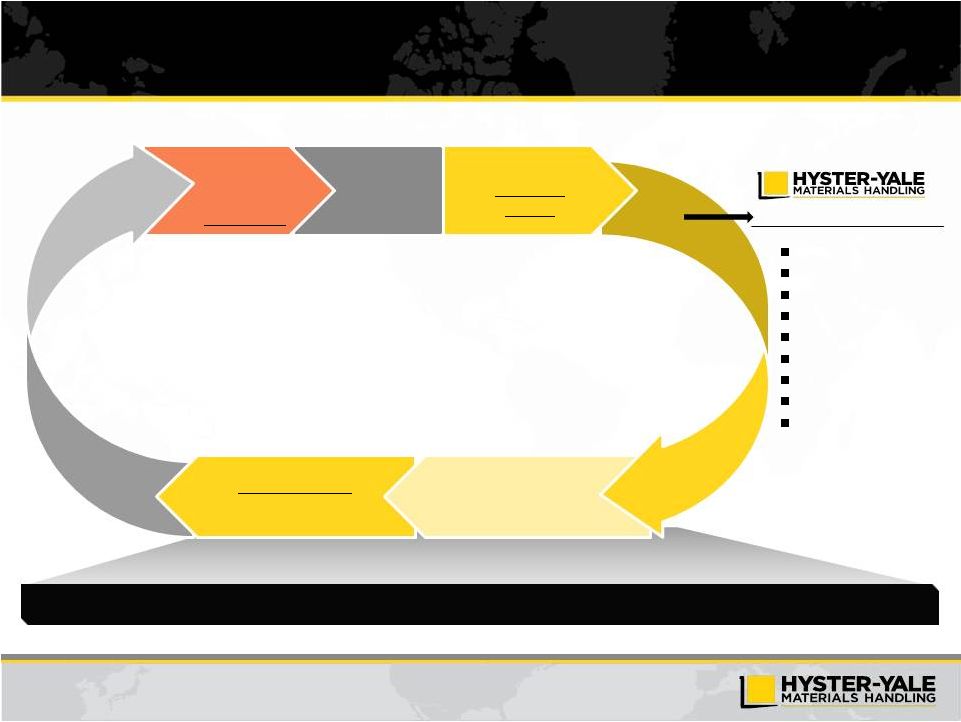
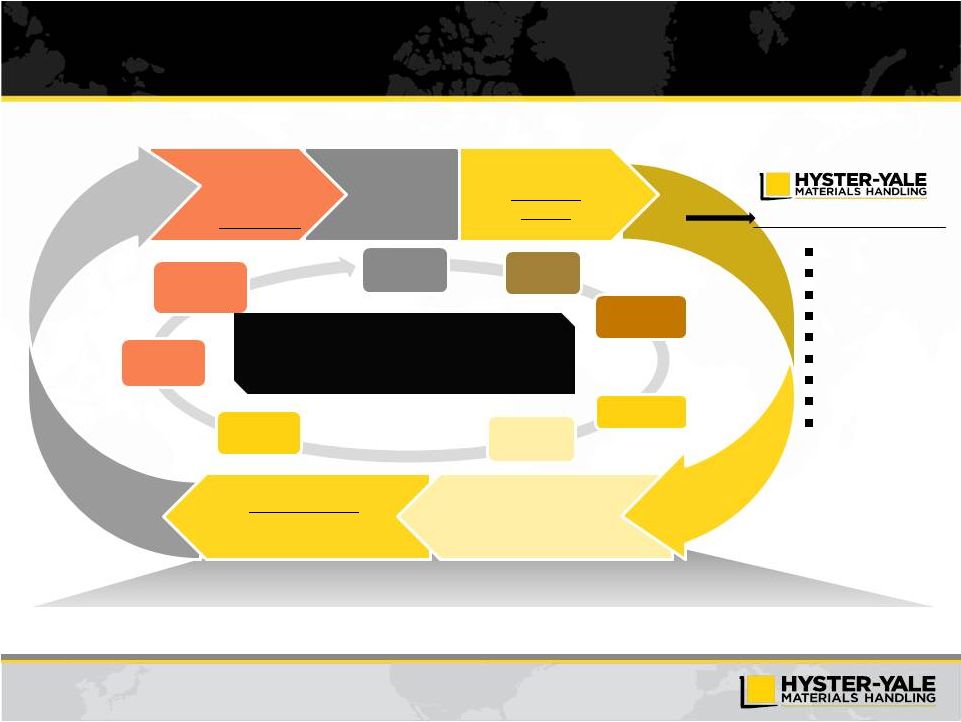
Economic Engine is Driven by Unit Volume
Geographic
and Product
Balance
Worldwide
Distribution
Strength to Drive
Market
Share
Parts
and
Service
Volume
Large Lift Truck
Population in Service
Volume
Economies
of Scale
Design
Component Commonality
Supply Chain
Manufacturing
Quality
Marketing
Parts
Infrastructure
Capital Requirements
A large lift truck population base drives parts and service volume resulting in
enhanced profitability for dealers and Hyster-Yale Basic Business
Areas Drivers of long term competitive advantage |
 5
Hyster-Yale Overview
Leading global lift truck manufacturer in terms of units sold
–
#3 globally in 2013
–
Large installed base that drives parts sales
–
Over 815,000 units worldwide
–
Sales of more than 85,500 units in 2013
–
Sales of > 4,200 units at SN JV in Japan & Asia in 2013
Diverse customer and application base
Global independent dealer network
Comprehensive, updated global product line
Globally integrated operations with economies of scale
Experienced management team
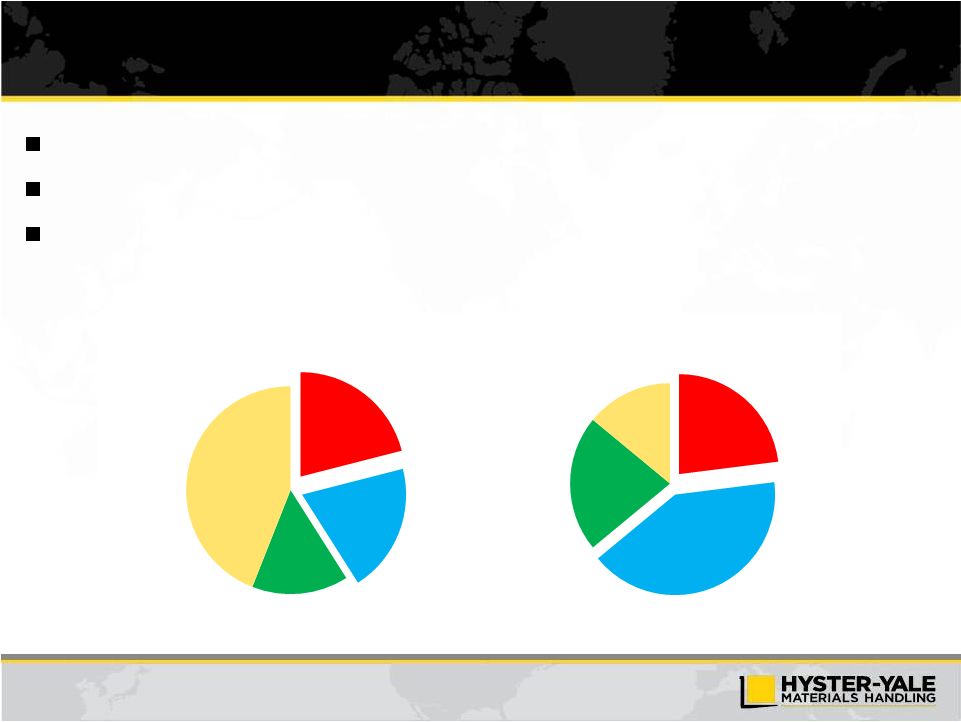
2013 Worldwide Sales by Product
2013 Sales by Geography
Key Highlights
Global Footprint
2013
Retail
Shipments
by
End
Market
(1)
(1)
Represents Hyster-Yale North American unit shipments by industry.
(2)
Includes Big Truck sales that represent 5.1% of total sales.
Americas
66%
Europe, Africa &
Middle East
26%
Asia-Pacific
8%
Internal
Combustion
Engine
Units
(2)
55%
Electric Units
27%
Parts
13%
Other
5%
Manufacturing
28%
Wholesale
Distribution
14%
Food & Beverage
14%
Rental
10%
Home Centers/
Retail
10%
Freight & Logistics
9%
Paper
7%
Other
8% |
 6
Certified
ISO
9001:2000
–
Global
Registration
Certified
ISO
14001
–
Environmental
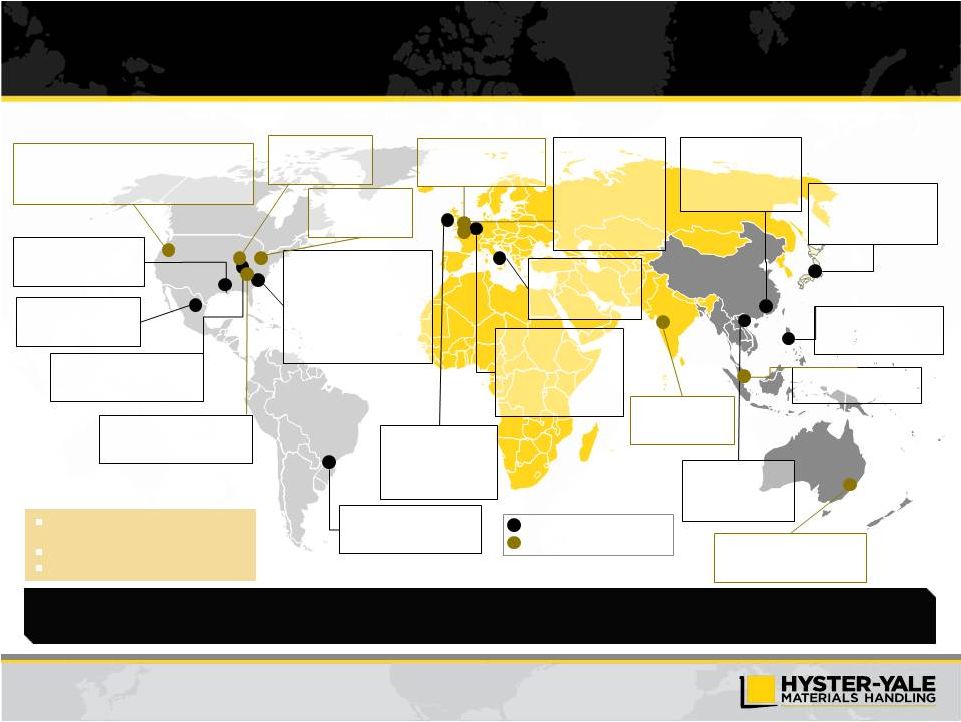
Demand Flow Technology (DFT)
Strategically located fabrication and assembly footprint using lean processes
Hyster-Yale’s Global Manufacturing Footprint
Ramos Arizpé, Mexico
Manufacture of component
parts for lift trucks
Sulligent, Alabama
Manufacture of component
parts for lift trucks
Berea, Kentucky
Assembly of lift trucks and
manufacture of component parts
Greenville, NC
Divisional headquarters and
marketing and sales operations
for
Hyster®
and
Yale®
in
Americas; Americas warehouse
development center; assembly of
lift trucks and manufacture of
component parts
Sao Paulo, Brazil
Assembly of lift trucks and
marketing operations for Brazil
Craigavon, N. Ireland
Manufacture of lift
trucks; cylinder and mast
fabrication and assembly
for Europe
Nijmegen, Netherlands
Big trucks development
center; manufacture and
assembly of big trucks and
component parts; European
parts distribution center
Masate, Italy
Assembly of lift trucks;
European warehouse
development center
Shanghai, China (JV)
Assembly of lift trucks by
Shanghai Hyster joint
venture and marketing
operations of China
Obu, Japan (JV)
Assembly and distribution
capabilities for Sumitomo
Nacco JV
Cavite, Philippines
Manufacture components
for Sumitomo Nacco JV
Fairview, Oregon
Global executive administrative center; counterbalanced
development center for design and testing of lift trucks,
prototype equipment and component parts
Cleveland, Ohio
Hyster-Yale corporate
headquarters
Danville, Illinois
Americas parts
distribution center
Irvine, Scotland
European administrative
center
Hanoi, Vietnam
Manufacture
components for
Sumitomo NACCO JV
Sydney, Australia
Divisional headquarters and sales
and marketing for Asia-Pacific
Pune, India
Engineering design
services
Manufacturing and Assembly
Sales, Marketing and Administrative
Charlotte, North Carolina
Customer experience and training
center
Frimley, Surrey UK
Divisional
headquarters,
European executive
center and marketing
and sales operations for
Hyster
®
and
Yale
®
in
Europe
Kuala Lumpur, Malaysia
Asia support office
Geographically balanced manufacturing structure reduces working capital requirements,
currency exposure and freight costs, while driving enhanced returns on
capital |
 7
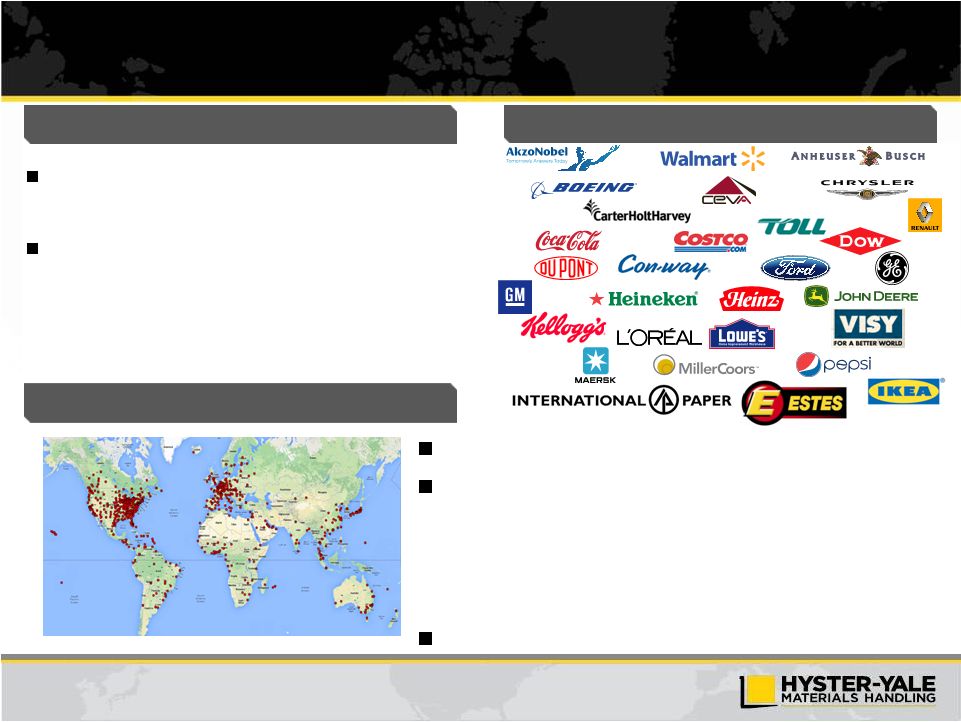
Distribution Channel Strength and Diverse
Customer Base
Represented in 132 countries
334 independent dealerships serving every region in the world
–
Approximately 2,400 sales people
–
Approximately 11,600 service technicians
–
Approximately 1,300 locations
Number of Dual Brand Dealers: 25
Dealer Profile
National Accounts Profile
Blue Chip Customer Base
Focused on strategic customers with centralized
purchasing and geographically dispersed operations
across dealer territories
Fleet Management Program provides customers with
value-added services that include aftermarket parts,
service and comprehensive management of materials
handling operations |
 8
Parts and Service Contribution to
Hyster-Yale’s and Dealers’
Profitability
Growing unit field population of approximately 815,000 units globally at 12/31/13
Hyster-Yale realizes significant additional margin from service parts over the life
of the truck Also critical to the success of our Independent Dealers:
–
Parts and Service are significant components of a typical dealers revenue and
margin Sales
Margin
units
Parts
Service
Rental
units
Parts
Service
Rental |
 9
Products
Comprehensive, updated global product line
Product Development focus on delivering Low Cost of Ownership based on customer
applications: Deliver Tier 4 solutions
Electric product with “ICE Like” performance
Integrate advanced technology solutions: Lithium Ion, Hybrid, Fuel Cell
Utility and Standard models designed to best fit needs of lower duty cycles
Manufacturing
Globally integrated, lean operations with economies of scale
Assemble in market of sale
Continuous efficiency improvements
DFT implementation in Brazil and Japan in 2014/2015
Supply Chain
Highly flexible low cost supply chain
Low cost country sourcing > 30%
Number of production suppliers reduced by > 50% since 2007
~ 80% improvement in delivered supplier quality (defects per million)
Ongoing Transformation of Business
Global Factory Productivity
Supplier quality
75%
65%
55%
2009
2010
2011
2012
2013
2009
2010
2011
2012
2013
3,000
2,000
1,000
0 |
 10
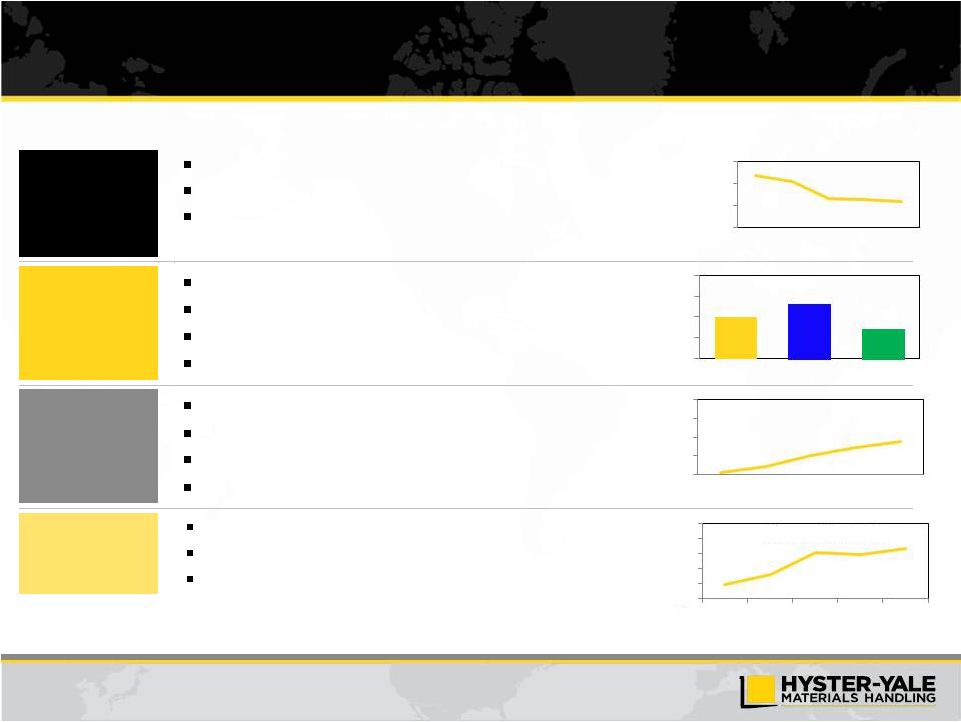
Quality
50% decrease in standard warranty costs in North America since 2009
Initial quality has improved in North America by >40% since 2009
Model year update to ensure smooth implementation of upgrades
Distribution
Network
Only major manufacturer with exclusive independent distribution
Dealer excellence programs drive continuous improvement
Entrepreneurial leadership
Industry-leading National Accounts program
Aftermarket
Excellence
Expanding fleet under management
Deployed service life-cycle management system
Deployed market-based pricing system / Low-cost country sourcing
Meeting dealer demands for all makes
Investing for
Growth
Marketing organization focused on product and industry solutions
Sales teams expanded / focus on product segments
National Accounts organization building global strength
Ongoing Transformation of Business
Full Service Management Units (000)
Warranty Costs (% of Sales)
Distribution “% restructured”
2009
2010
2011
2012
2013
2009
2010
2011
2012
2013
2009
2010
2011
2012
2013
3.0%
2.0%
1.0%
0.0%
100%
75%
50%
25%
0%
80
70
60
50
40
3.5
3.0
2.5
2.0
1.5
1.0
Revenue Growth ($b)
Americas
EMEA
Asia Pacific |
 11
Hyster-Yale –
Industry Sales Growth
(units in thousands)
Hyster-Yale Sales vs. Global Lift Truck Industry
Source: WITS and Company data. Represents order intake.
Hyster-Yale sales grew faster than industry through 2013
European distribution and economic challenges in Q1 2014
Strong position in recovering North America market
Focus on key product segments delivering benefits
Five key initiatives beginning to take hold
Key Themes
22.8%
-3.2%
6.9%
9.6%
41.0%
-2.8%
8.0%
4.8%
-5%
5%
15%
25%
35%
45%
FY-11
FY-12
FY-13
Q1-14
WITS Orders
Hyster-Yale Revenue |
 12
Operating Profit Trends
Operating Profit $ and % of Sales
($ in millions)
Prior Cycle Market Peak
Mid-Cycle Market
$57
$112
$134
$134
2.1%
4.5%
5.0%
5.0%
0.0%
2.0%
4.0%
6.0%
$25
$50
$75
$100
$125
$150
2007
2012
2013
LTM 3/31/14 |
 13
Gap to Target Economics
Goal
is
to
achieve
minimum
operating
profit
margin
of
7%
at
mid-cycle
and
to
achieve
7%
operating
profit
margin
at
the peak of the current market cycle
3/31/14 LTM Gap to Target Economics
Margin variances:
+0.3%
Target Economics gap closure can be
achieved by:
1.
Increased margin on ICE trucks
-
Segmentation
-
Low cost of ownership
2.
Unit volume
-
Share growth
-
Stronger industry
-
Volume leverage
Volume variances:
Operating Profit % Gap
(2.0%)
Operating Profit $ Opportunity
$55m
–
Unit margin
(0.6%)
–
Parts/other
+0.9%
–
Manufacturing variances/other
(0.8%)
–
Operating Expenses
(1.5%) |
 14
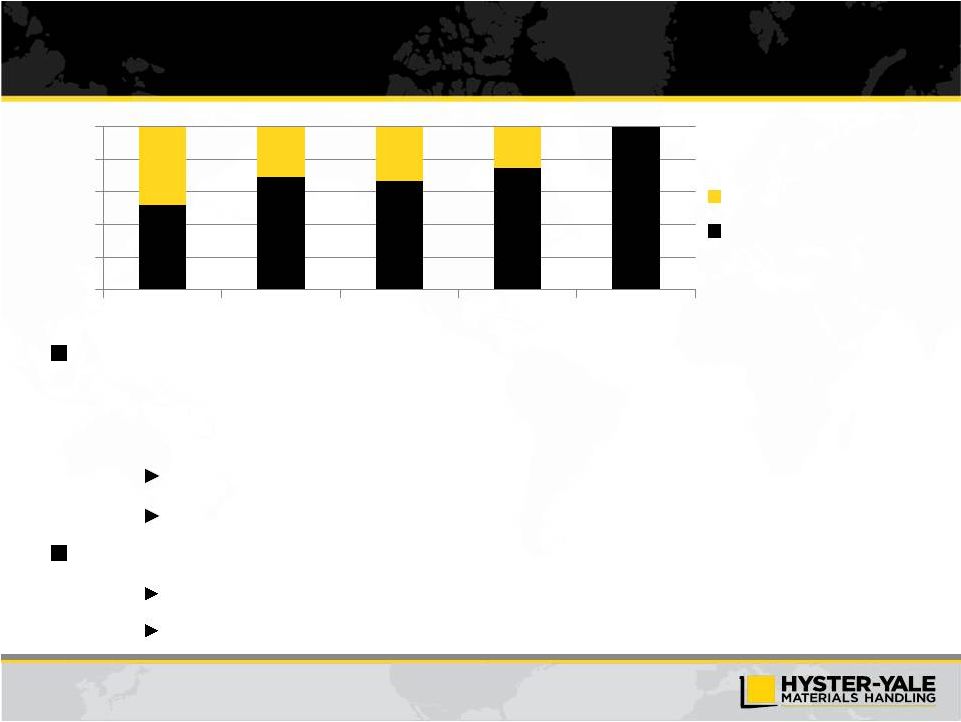
Volume Leverage on Manufacturing Capacity
Approximately $125m manufacturing fixed cost
–
Ability to produce 115,000* units annually
–
At capacity
Approximately $30m additional fixed cost absorption
Operating costs aligned with targets at increased sales volumes
Objective of minimum 25,000 unit volume increase from 2013 levels
$600m additional revenue
$70m+ incremental operating profit
* Excludes UTILEV and SN Products
48%
31%
33%
25%
0%
20%
40%
60%
80%
100%
2010
2011
2012
2013
2016-2017
Unused Capacity
Unit Volume |
 15
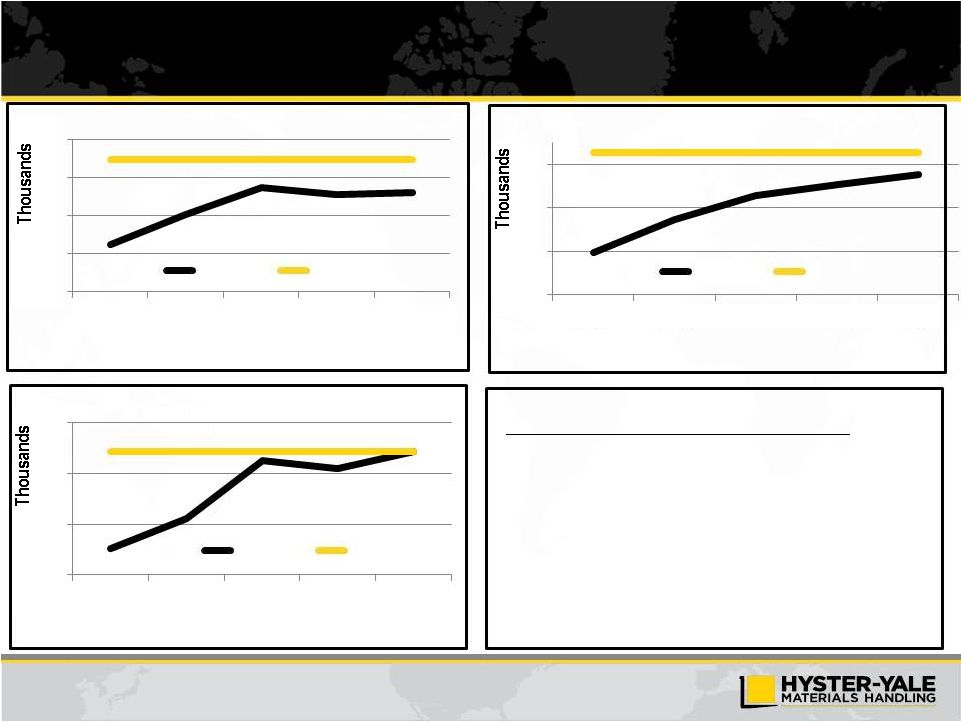
Over the Remainder of this Market Cycle, Target
Volumes Driven by…
Share growth of approx. 2% pts
>5 Strategic initiatives
>3 Supplemental initiatives
Growth of 20-25% by 2017
Growth of 10-15% by 2017
Growth of 10-15% by 2017
2009
2010
2011
2012
2013
2009
2010
2011
2012
2013
2009
2010
2011
2012
2013
500
400
300
200
100
EMEA Industry
Actual
Prior Peak
450
350
250
150
200
150
100
50
Americas Industry
Asia Industry
Actual
Prior Peak
Actual
Peak |
 16
Applications
–
Launched strategy guides for Trucking, Grocery and
Steel
–
Actively engaged in several new Steel Accounts
–
New business wins
In trucking, grocery, steel and paper
Segment the global market
Best product fit for customer application
Develop solutions for major segments
Segmentation
–
Additional standard and utility models
–
Separated standard/premium segments
–
All products available by 2016
Tailored application solutions
Strengthened product positioning
Strong relationship with customers in target industries
Enhanced Understanding of Customer
Needs to Drive Tailored Solutions
Win in Targeted Major Accounts and Applications
Outcome:
Strategic Objectives
Key Elements
Progress and Expectations |
 17
Masters of the World of Low Cost of Ownership
Revenue growth by delivering lowest cost of
ownership in target applications
Expand fleet management
Cost of truck/lease
–
Supplier Day programs at each factory
–
Attractive lease rates through improved
understanding of applications and operating costs
Fuel energy efficiency
–
15%+ improvement in fuel efficiency
–
Improved energy efficiency of electric trucks
Service/repair costs
–
Reduced service/repair costs per hour
–
Service cost calculator rolled out in Europe
–
Telemetry product offering launched
Understand major cost drivers:
Direct (truck price, fuel, service, operator)
Indirect (safety, litigation, pollution)
Competitive Advantage across Product Segments
Outcome:
Strategic Objectives
Strategic Objectives
Progress and Expectations |
 18
Strategic Objectives
Progress and Expectations
Key Elements
Enhanced dealer organization and structure
Add new products tailored to needs of Asian markets
Strengthened local presence in Asia and India
Continued development of strategic relationships
Established new office in Malaysia
Sales and marketing resources added
New major account business won
Indian and Chinese partners producing locally
New dealers appointed
Increase Asian presence
Strengthen dealer organization
Strong local partners in China, India & Japan
Leverage Sumitomo Heavy Industries strength
with Japanese customers
Succeed in Asian Markets
Grow Share and Distribution at Accelerated Pace
Outcome: |
 19
Strategic Objectives
Progress and Expectations
Key Elements
Recruit/develop strongest dealers
Opportunity for dealers to make strong returns
on investment
Combine dealer entrepreneurship and
performance with world class OEM support
Enhanced sales specialization
Dedicated dealer development team
25 dual-brand dealers, 10 appointed since 1/1/2013
8 competitor dealers converted in 2013, 6 in 2014
Strengthened European network
Major effort underway on account identification and
enhanced coverage
Dealer restructuring
Expanded dual-brand ownership
Dealer excellence program
Customer / industry intelligence
Enhanced Independent Distribution
Best Distribution Channels in the Industry
Outcome: |
 20
Strategic Objectives
Progress and Expectations
Key Elements
Gain share in faster growing segment of market
Improve dealer value proposition
Engage dealers in developing capabilities
Product gap closure
Investment in specialist talent
New product launches
Global product developed
800 dealer sales people trained in
warehouse product in the Americas in 2013
Europe and Asian initiatives launched
New major account business awarded
Dedicated warehouse specialist teams
Product enhancements
Leverage competitive advantages
–
Dealer engagement
–
Fleet management
Significantly Improve Warehouse Business Position
Be a Top Tier Global Competitor in Warehouse Equipment
Outcome: |
 21
Supplemental Initiatives and a Facilitating Program
Big Trucks
–
Growth opportunity
–
Additional resources
Global team
Focus on industry and
customer solutions
–
Tier 4 leadership
Sales and Marketing Organization
–
Alignment with strategy execution
–
Focus on accountability
–
Talent management
Brazil
–
New manufacturing facility
–
Strengthened management team
–
Expand local production
–
Enhanced distribution
Global Systems
–
Common manufacturing processes
–
Parts distribution system
–
Product configurator
–
Fleet management |
 22
Key Initiatives Drive Sustainable Long Term Growth
Strong Dealer and Customer Loyalty driving a
growing population, increased service and parts
revenue and strong profitability
National Accounts
Leaders
in
Independent
Distribution
Crack the Code in
Warehouse
Target Big Trucks
Succeed in Asia
Aftermarket Excellence
Understand Needs of
Customers
Low Cost of Ownership |
 23
Economic Engine is Driven by Unit Volume
Geographic
and Product
Balance
Worldwide
Distribution
Strength to Drive
Market Share
Parts and Service
Volume
Large Lift Truck
Population in Service
Volume
Economies
of Scale
Design
Component Commonality
Supply Chain
Manufacturing
Quality
Marketing
Parts
Infrastructure
Capital Requirements
A large lift truck population base drives parts
and service volume resulting in enhanced
profitability for dealers and Hyster-Yale
Basic Business Areas
Drivers of long term competitive advantage
Leaders in
Independent
Distribution
National
Accounts
Crack the Code in
Warehouse
Target Big Trucks
Succeed in Asia
Aftermarket
Excellence
Understand Needs of
Customers
Low Cost of
Ownership |
 24
Positive Environment for Hyster-Yale to Gain Share
and
Margin
Performance
Over
Next
Years
Product gaps filled to position Hyster-Yale in most application segments and
improve margins
Low-cost manufacturing base relative to German-centric and Japanese-centric
competitors
Second-tier competitors in the ICE segment more vulnerable due to their
weakened economy of scale position
Key warehouse segment competitors are regional
Key Big Truck segment competitors are niche |
 25
Historical Revenue
_____________________
(1)
As of March 31, 2014.
(1)
$1,780
$2,057
$2,400
$2,489
$2,720
$2,824
$1,475
$1,802
$2,541
$2,469
$2,666
$2,697
$0
$1,000
$2,000
$3,000
2003
2004
2005
2006
2007
2008
2009
2010
2011
2012
2013
2014 LTM
Revenue
($ in millions) |
 26
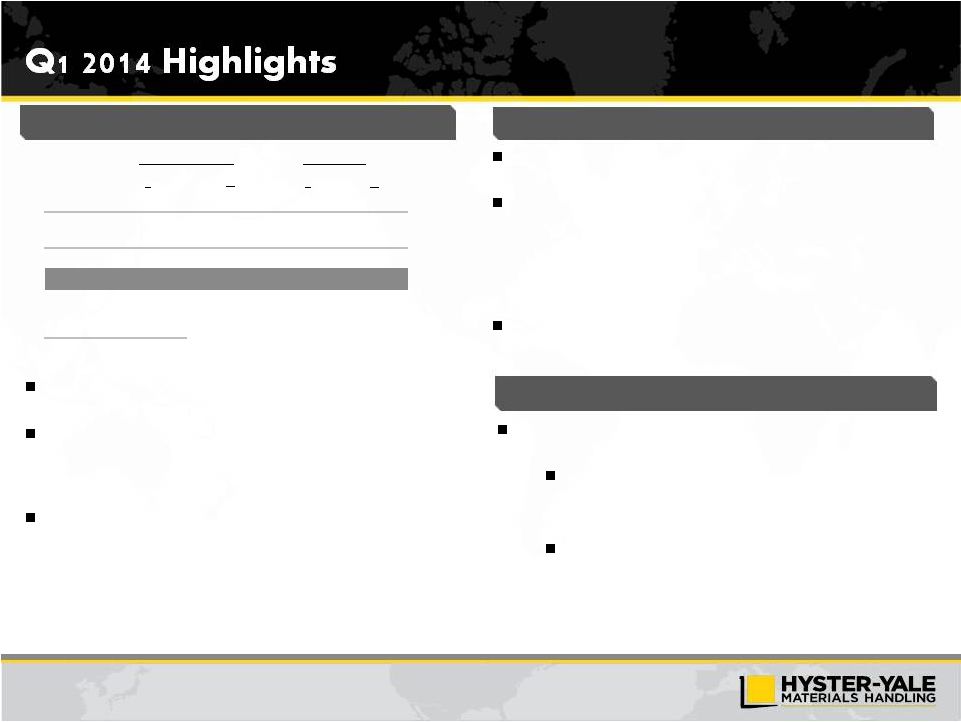
Q1 2014 Results
Hyster-Yale
Outlook
–
Longer-term
2014
global
lift
truck
market
expected
to
grow
moderately
in
all
major
global regions.
Expected improvements in unit and parts volumes, market share and
gross
profit
expected
to
be
partially
offset
by
full
year
impact
of
higher
SG&A to support strategic initiatives and unfavorable foreign currency
movements, resulting in moderate improvements in 2014 operating profit
and net income, excluding the effects of a gain on sale of the Brazil
facility expected in 2014 and tax benefits recorded in 2013.
Backlog of 28,900 units, or approximately $715m at 3/31/14 represents
>16
weeks
of
production
and
supports
2
nd
quarter
2014
production
plan.
($ in millions)
Hyster-Yale
Outlook
–
Short
Term
Close gap to 7% target economics at mid-cycle and 7% at the peak of
the current market cycle
29%+ unit volume growth
•
Industry recovery
•
Share growth
Unit margin enhancement
•
Product segmentation
•
Low cost of ownership
_____________________
(1)
EBITDA
is
a
non-GAAP
measure
and
should
not
be
considered
in
isolation
or
as
a
substitute
for
GAAP
measures.
For
discussion
of
non-GAAP
items
and
the
related
reconciliations
to
GAAP
measures,
see
pages
starting
on
30.
$
$
%
Revenue
$676.0
100.0%
$2,697.4
100.0%
Operating
Profit
31.6
4.7%
133.8
5.0%
Net Income
22.1
3.3%
107.5
4.0%
EBITDA
(1)
$39.6
5.9%
$164.0
6.1%
Debt
$33.0
Cash
$107.3
Net Cash
$74.3
2014 First Quarter
3/31/14 LTM
%
4.8% growth in Q1 2014 revenue, but a 1.6% decline in operating
profit vs. Q1 2013.
Revenue growth from more sales of higher-priced lift trucks, unit price
increases, increased fleet services and higher parts volume, partially
offset by slightly lower unit volumes and unfavorable currency
movements.
Operating
profit
and
net
income
down
slightly
as
favorable
gross
profit
and lower interest expense were more than offset by higher SG&A
costs related to investments to support the strategic initiatives and
higher income tax expense. |
 27
Strong Free Cash Generation and Conservative
Capital Structure
Strong cash generation with $436 million cumulative cash flow before financing
from 2009 to 2013
Conservative capital structure as of 3/31/14 with debt of $33 million and cash of
$107.3 million
Debt / LTM EBITDA
(2)
Cash Flow before Financing
(1)
_____________________
.(1)
Cash Flow before Financing is defined as cash from operating activities less cash from
investing activities. (2) EBITDA
is
a
non-GAAP
measure
and
should
not
be
considered
in
isolation
or
as
a
substitute
for
GAAP
measures.
For
discussion
of
non-GAAP
items
and
the
related
reconciliations
to
GAAP
measures,
see
pages
starting
on
30.
Net Debt
Gross Debt
0.0x
$122
$39
$39
$109
$127
$113
$0
$50
$100
$150
2009
2010
2011
2012
2013
3/31/14 LTM
0.2x
0.0x
0.5x
1.0x
1.5x
2.0x
3/31/14
Stability to weather market changes with significant flexibility for growth ($ in millions)
|
 28
Rationale
for
Investing
in
Hyster-Yale
1)
Leading position in growing industry benefiting from globalization and worldwide
economic recovery and development
2)
Premier brands, comprehensive global product line and exclusive,
global independent
distribution network
3)
Strong economic engine driven by volume economies of scale
4)
Focused
strategic
initiatives
to
gain
market
share
and
enhance
margins
over
next
3
–
5
years
5)
Strong balance sheet, financial flexibility and attractive returns on capital
employed 6)
High potential for partnership and consolidation opportunities
7)
Focused investment in capital goods sector with growth opportunity:
a)
In developed countries from exposure to goods movement, distribution and warehousing
b)
In
developing
countries
(Brazil,
Eastern
Europe,
India
and
Asia)
from
exposure
to
industrialization |
 Appendix
30 |
 30
Non-GAAP Disclosure
EBITDA
and
return
on
total
capital
employed
are
not
measurements
under
U.S.
GAAP,
should
not
be
considered in
isolation or as a substitute for GAAP measures, and are not necessarily comparable with
similarly titled measures of other companies. Hyster-Yale defines each
as the following: For reconciliations from GAAP measurements to non-GAAP
measurements, see pages 31 and 32. EBITDA is defined as income before income
taxes and non-controlling interest income (loss) plus net interest expense
and depreciation and amortization expense; Return on total capital employed
(“ROTCE”) is defined as net income before interest expense, after tax, divided
by average capital employed. Average capital employed is defined as average
stockholder’s equity plus average debt less average cash.
|
 31
Non-GAAP Reconciliation
Year Ended December 31
Qtr.
Trailing 12
Months
2009
2010
2011
2012
2013
3/31/14
3/31/14
Reconciliation of EBITDA
Net income (loss) attributable to stockholders
($43.1)
$32.4
$82.6
$98.0
$110.0
$22.1
$107.5
Noncontrolling interest (income) loss
(0.1)
(0.1)
–
0.1
0.2
–
0.2
Income taxes provision (benefit)
(3.6)
1.8
18.9
7.0
17.2
9.5
20.6
Interest expense
19.0
16.6
15.8
12.4
9.0
0.9
7.4
Interest income
(2.8)
(2.3)
(1.8)
(1.5)
(1.8)
(0.4)
(1.9)
Depreciation and amortization expense
36.2
33.9
31.3
28.0
30.2
7.5
30.2
EBITDA
$5.6
$82.3
$146.8
$144.0
$164.8
$39.6
$164.0
($ in millions)
_____________________
Note: *EBITDA in this investor presentation is provided solely as a supplemental
disclosure with respect to operating results. EBITDA does not represent net income, as defined by U.S. GAAP and should not be considered as a substitute for net income or
net loss, or as an indicator of operating performance. The Company defines EBITDA as
income before income taxes and non-controlling interest income (loss) plus net interest expense and depreciation and amortization expense. EBITDA is not a
measurement under U.S. GAAP and is not necessarily comparable with similarly titled
measures of other companies. |
 32
Non-GAAP Reconciliation (continued)
($ in millions)
Reconciliation of Return on Total Capital Employed (ROTCE)
3/31/14 LTM
LTM Average Stockholders' Equity (3/31/14, 12/31/13, 9/30/13, 6/30/13 and
3/31/13) $415.6
LTM Average Debt (3/31/14, 12/31/13, 9/30/13, 6/30/13 and 3/31/13)
99.6
LTM Average Cash (3/31/14, 12/31/13, 9/30/13, 6/30/13 and 3/31/13)
(152.3)
LTM average capital employed
$362.9
LTM Net income
$107.5
Plus: LTM Interest expense, net
5.5
Less: Income taxes on interest expense, net at 38%
(2.1)
Actual return on capital employed = actual net income before interest expense, net, after
tax $110.9
Actual return on capital employed percentage
30.6%
_____________________
Note: Return on capital employed is provided solely as a supplemental disclosure with
respect to income generation because management believes it provides useful information with respect to earnings in a form that is comparable to the Company’s cost of capital
employed,
which
includes
both
equity
and
debt
securities,
net
of
cash. |
 33
Cash Flow before Financing Calculation
($ in millions)
Year Ended December 31
Trailing 12
Months
2009
2010
2011
2012
2013
3/31/14
Reconciliation of Cash Flow before Financing
Net cash provided by operations
$115.9
$47.5
$54.6
$128.7
$152.9
$135.6
Net cash provided by (used) for investing activities
5.8
(8.5)
(15.9)
(19.5)
(26.1)
(22.6)
Cash Flow before Financing
$121.7
$39.0
$38.7
$109.2
$126.8
$113.0
|
 Supplemental Perspective
35 |
 35
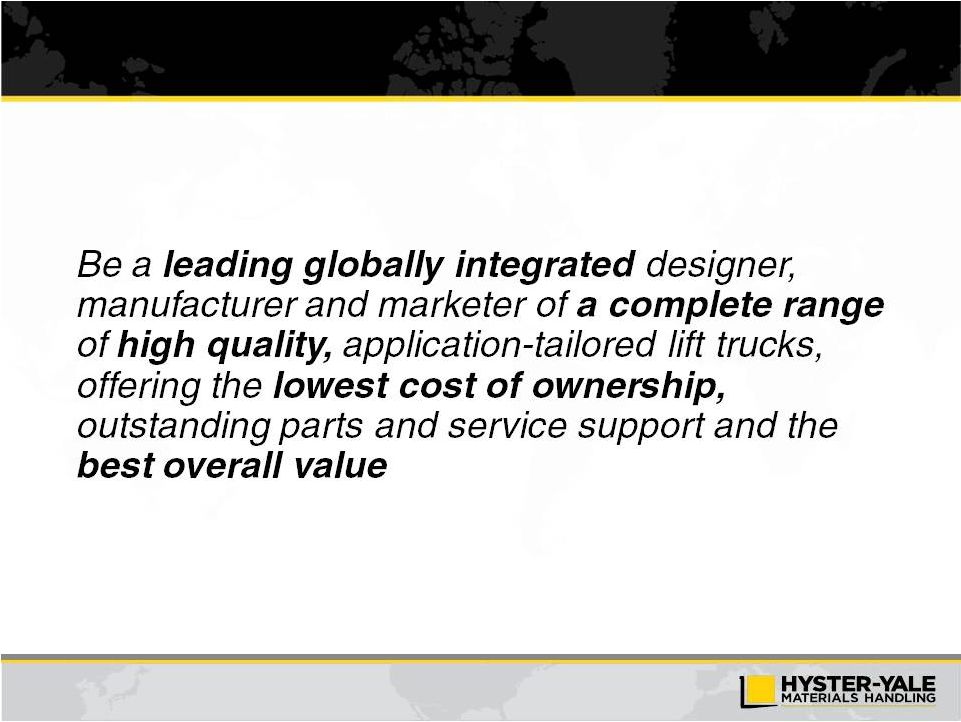
Mission Statement |
 36
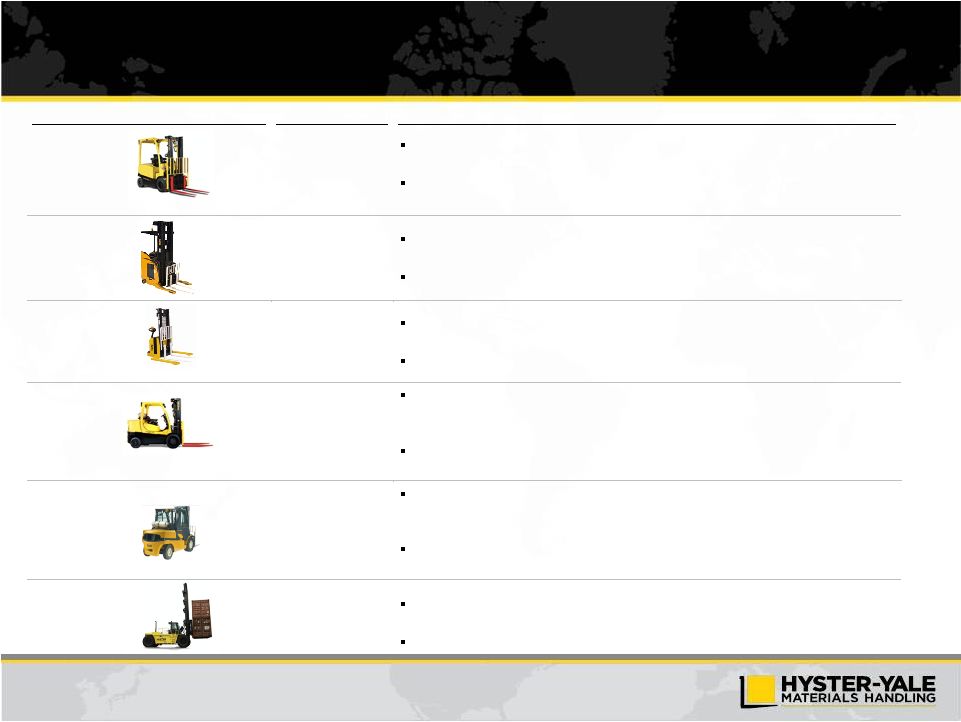
Class
Capacity Range
Description / Illustrative Application
Class I
1 ton – 5.5 tons
Electric counterbalanced trucks used in warehousing and manufacturing operations
where noise or fuel emissions are undesirable
A distribution center customer uses a Class I truck to move pallets from one trailer
to another
Class II
1.5 tons – 6 tons
Electric narrow aisle trucks used indoors to handle high-density storage of
materials in narrow-aisled buildings
Retail and warehouse customers rely on Class II trucks to pick orders off their
shelves Class III
1.5 tons – 8 tons
Electric hand trucks used indoors and outdoors for applications requiring the user to
select and transport materials
Retail customers use Class III trucks to move pallets of goods to their store aisles
Class IV
1 ton – 7 tons
Internal combustion engine counterbalanced trucks with cushion tires used indoors in
warehousing and manufacturing operations and outdoors on smooth surfaces.
Utility, standard and premium models for different customer applications.
A customer relies on Class IV trucks to move heavy parts on a pallet from the
machining area in a factory to assembly
Class V
1 ton – 8 tons
Internal combustion engine counterbalanced trucks with pneumatic tires used indoors
and outdoors in warehousing and manufacturing operations. Utility, standard and
premium models to address different customer applications.
A warehouse or manufacturer relies on Class V trucks to move coils of steel from the
mill to a storage area
Class V Big
Trucks
8
ton – 52 tons
Internal combustion engine counterbalanced trucks with pneumatic tires used indoors
and outdoors in ports and heavy manufacturing operations
A port relies on Class V Big Trucks to move containers from the port to a rail area
Comprehensive Updated Global Product Line |
 37
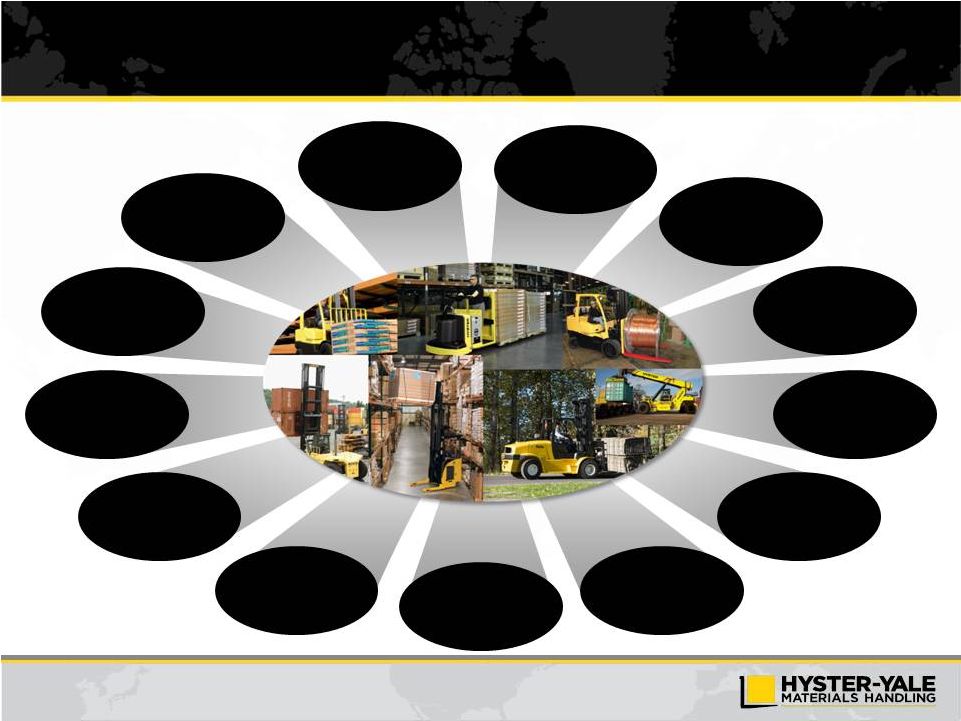
Key Investment Highlights
Leading Market
Share in Materials
Handling
Comprehensive
Global Product Line
Large Installed
Base Worldwide
Established
Brand Strength
Global
Independent Dealer
Network
Long-Term
Relationships
with Diverse
Customer Base
Experienced
Management Team
Modest Leverage
& Strong
Cash Flow
High-Impact
Strategic Initiatives
Continuous Focus on
Product Development
and Innovation
Worldwide
Economies
of Scale
Highly Flexible,
Low Cost Supply Chain
and Efficient Operating
Structure
Global Scope of
Manufacturing |