Attached files
| file | filename |
|---|---|
| 8-K - CURRENT REPORT ON FORM 8-K - DELTA AIR LINES, INC. | delta_8k.htm |
| EX-99.1 - PRESS RELEASE - DELTA AIR LINES, INC. | delta_8k-ex9901.htm |
Exhibit 99.2

Delta: Setting A New Standard May 6, 2014

2 This presentation contains various projections and other forward - looking statements which represent Delta’s estimates or expectations regarding future events. All forward - looking statements involve a number of assumptions, risks and uncertainties, many of which are beyond Delta’s control, that could cause the actual results to differ materially from the projected results. Factors which could cause such differences include, without limitation, business, economic, competitive, industry, regulatory, market and financial uncertainties and contingencies, as well as the “Risk Factors” discussed in Delta’s SEC filings. Caution should be taken not to place undue reliance on Delta’s forward - looking statements, which represent Delta’s views only as of the date of this presentation, and which Delta has no current intention to update. In this presentation, we will discuss certain non - GAAP financial measures. You can find the reconciliations of those measures to comparable GAAP measures on our website at delta.com. Safe Harbor
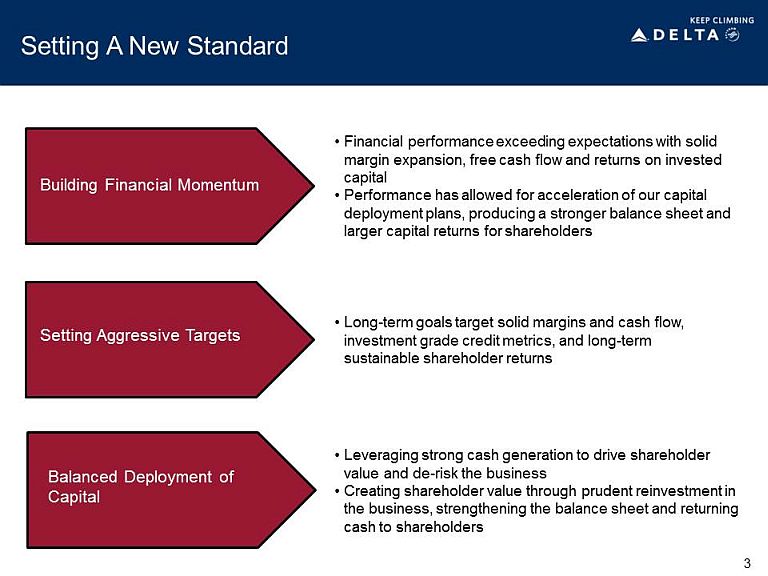
3 Setting A New Standard Building Financial Momentum Setting Aggressive Targets Balanced Deployment of Capital • Long - term goals target solid margins and cash flow, investment grade credit metrics, and long - term sustainable shareholder returns • Financial performance exceeding expectations with solid margin expansion, free cash flow and returns on invested capital • Performance has allowed for acceleration of our capital deployment plans, producing a stronger balance sheet and larger capital returns for shareholders • Leveraging strong cash generation to drive shareholder value and de - risk the business • Creating shareholder value through prudent reinvestment in the business, strengthening the balance sheet and returning cash to shareholders

4 Strong Financial Foundation With Building Momentum… • Delta’s financial foundation has strengthened considerably since 2009, with a pipeline of initiatives in place for further improvement • Recent performance has exceeded expectations under 2013’s five year plan, with solid margin expansion, free cash flow and returns on invested capital - 3.9% 4.6% 8.0% 2009 LTM 1Q13 LTM 1Q14 Pre - Tax Margin $ 0.1B $ 0.7B $ 2.0B 2009 LTM 1Q13 LTM 1Q14 Free Cash Flow 1.5% 11.9% 16.4% 2009 LTM 1Q13 LTM 1Q14 ROIC Excludes special items

5 …Drives Acceleration of Capital Deployment Plans • Strong financial performance has allowed for acceleration of our capital deployment plans, producing a stronger balance sheet and larger capital returns for shareholders $ 11.7B $ 9.1B 2012 1Q14 Adjusted Net Debt $ 365M $ 700M 1st year plan 1st year actual Shareholder Returns $ 13.3B $ 10.1B 2012 2013 Unfunded Pension Liability • Reduced debt $8 billion since 2009 • 2014 interest expense projected at $750M, savings of $100M compared to 2013 and more than $500M compared to 2009 • Will return $700M in first 12 months of program through $200M dividends and $500M buy backs • On track to complete initial repurchase authorization two years ahead of schedule • Contributed $250M above required amounts for 2013 and 2014 • Incremental contributions, combined with higher interest rates and asset returns have reduced liability by more than $3B • Pension expense reduced by $200 million since 2009 Excludes special items

6 Long - Term Goals Guide the Planning Process • 10 - 12% annual operating margins Operating Margin • Annual EPS growth of 10% - 15% EPS Growth • 15%+ return on invested capital ROIC • $5+ billion annual operating cash flow with ~50% reinvested back into the business Cash Flow • Investment grade credit metrics and $7 billion adjusted net debt by 2015 Balance Sheet Long - term goals provided the core foundation… • Our long - term goals target solid margins and cash flow, investment grade quality balance sheet, and sustainable shareholder returns • 11 - 14% operating margins Operating Margin • Annual EPS growth of 10% - 15% after 2014 EPS Growth • 15 - 18% return on invested capital ROIC • $6 billion annual operating cash flow and $3 billion free cash flow Cash Flow • $5 billion adjusted net debt by 2016 and pension at 80% funded status by 2020 Balance Sheet …for our updated five year plan targets
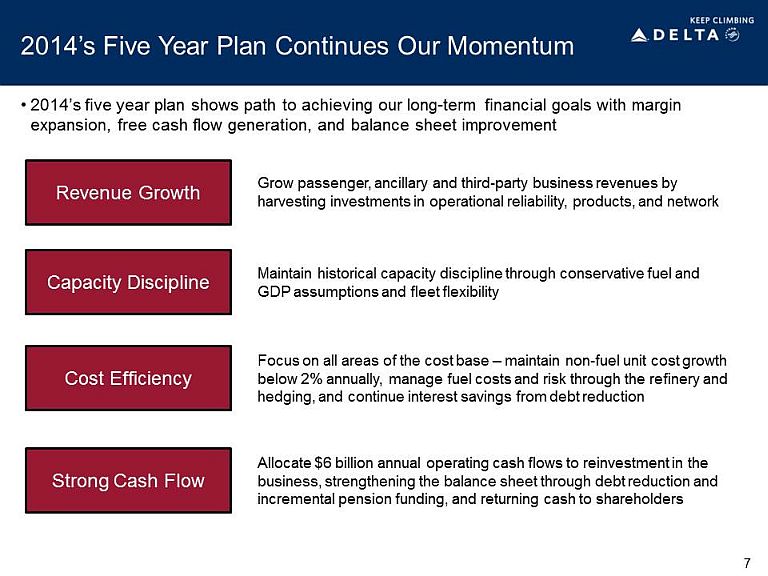
7 2014’s Five Year Plan Continues Our Momentum • 2014’s five year plan shows path to achieving our long - term financial goals with margin expansion, free cash flow generation, and balance sheet improvement Revenue Growth Strong Cash Flow Cost Efficiency Capacity Discipline Grow passenger, ancillary and third - party business revenues by harvesting investments in operational reliability, products, and network Maintain historical capacity discipline through conservative fuel and GDP assumptions and fleet flexibility Focus on all areas of the cost base – maintain non - fuel unit cost growth below 2% annually, manage fuel costs and risk through the refinery and hedging, and continue interest savings from debt reduction Allocate $6 billion annual operating cash flows to reinvestment in the business, strengthening the balance sheet through debt reduction and incremental pension funding, and returning cash to shareholders

$2.6 $3.8 $4.1 $4.8 $4.1 $2.9 $1.8 $1.3 $1.2 $0.9 $2.1 $2.6 $1.2 $1.3 $1.3 $2.0 $2.9 $2.3 $(2.0) $(1.0) $- $1.0 $2.0 $3.0 $4.0 $5.0 $6.0 1997 1998 1999 2000 2001 2002 2003 2004 2005 2006 2007 2008 2009 2010 2011 2012 2013 2014E CapEx Operating Cash Flow 8 Strong Cash Generation in the Business • Strong operating cash flow, combined with disciplined capital spending, produces sustainable free cash flow Capital Spending and Operating Cash Flow ($B) Note: Includes pre - merger NWA; Excludes special items

9 Appropriate Investment In The Business • Funding prudent investment in the business through operating cash flow while also generating $3 billion in annual free cash flow • Annual capital expenditures in the range of $2 - $3 billion per year over the next five years – Reinvesting approximately 50% of operating cash flow back into the business • Rigorous capital process requires projects to have returns well above 15% and rapid cash payback periods, generally under two years • Targeted fleet purchases allow for capacity growth of ~2% annually – Continues successful fleet strategy of investing in mix of new and pre - owned aircraft $1.0 $2.0 $3.0 2014E 2015E 2016E 2017E 2018E Capital Expenditures ($B)
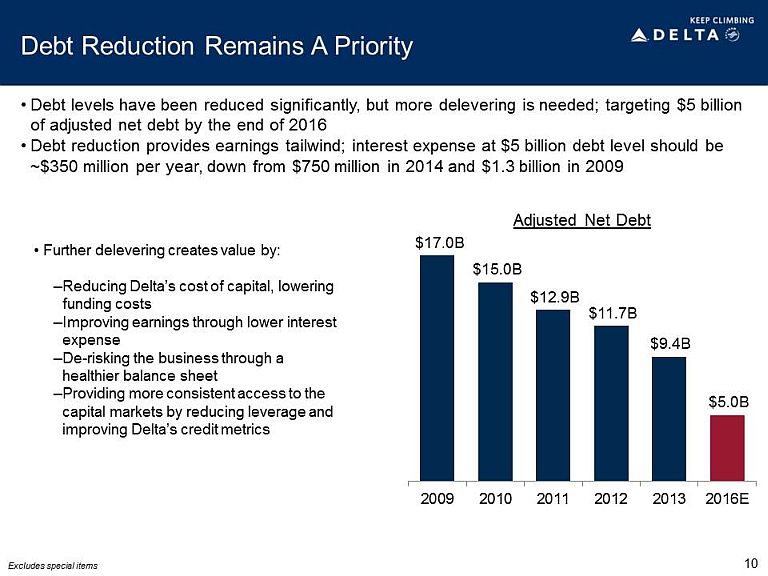
10 Debt Reduction Remains A Priority • Debt levels have been reduced significantly, but more delevering is needed; targeting $5 billion of adjusted net debt by the end of 2016 • Debt reduction provides earnings tailwind; interest expense at $5 billion debt level should be ~$350 million per year, down from $750 million in 2014 and $1.3 billion in 2009 Adjusted Net Debt $ 17.0B $ 15.0B $ 12.9B $ 11.7B $ 9.4B $ 5.0B 2009 2010 2011 2012 2013 2016E • Further delevering creates value by: – Reducing Delta’s cost of capital, lowering funding costs – Improving earnings through lower interest expense – De - risking the business through a healthier balance sheet – Providing more consistent access to the capital markets by reducing leverage and improving Delta’s credit metrics Excludes special items
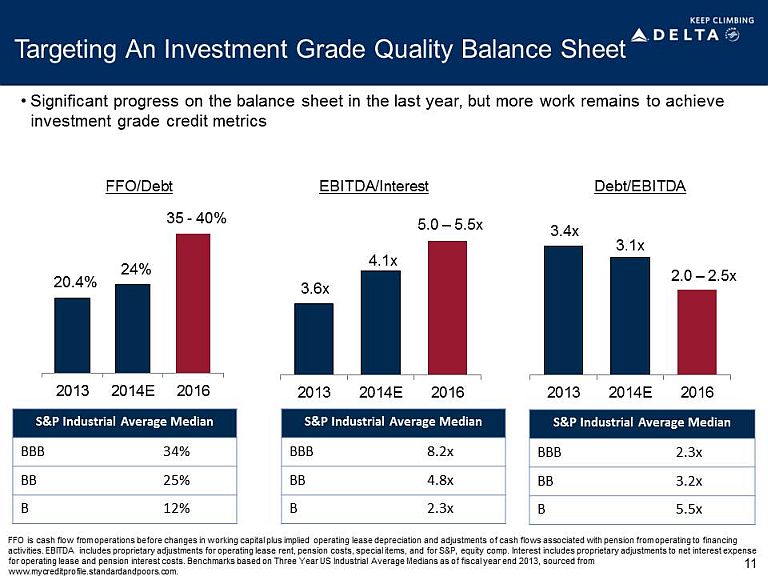
2013 2014E 2016 Targeting An Investment Grade Quality Balance Sheet • Significant progress on the balance sheet in the last year, but more work remains to achieve investment grade credit metrics 2013 2014E 2016 2013 2014E 2016 FFO/Debt EBITDA/Interest Debt/EBITDA 11 20.4% 35 - 40% 3.6x 5.0 – 5.5x 3.4x 2.0 – 2.5x S&P Industrial Average Median BBB 34% BB 25% B 12% S&P Industrial Average Median BBB 8.2x BB 4.8x B 2.3x S&P Industrial Average Median BBB 2.3x BB 3.2x B 5.5x FFO is cash flow from operations before changes in working capital plus implied operating lease depreciation and adjustments of cash flows associated with pension from operating to financing activities. EBITDA includes proprietary adjustments for operating lease rent, pension costs, special items, and for S&P, equi ty comp. Interest includes proprietary adjustments to net interest expense for operating lease and pension interest costs. Benchmarks based on Three Year US Industrial Average Medians as of fiscal yea r e nd 2013, sourced from www.mycreditprofile.standardandpoors.com. 24% 4.1x 3.1x

12 Addressing Long - Term Pension Obligations • Plan to maintain pension funding at $1 billion per year through 2020, consistent with 2013 - 14 levels • Incremental pension funding helps drive balance sheet improvement – At current rates, pension would be 80% funded and balance sheet liability reduced to $3.5 billion by 2020 – With a 100 bps increase in discount rates, the liability would decline to $2 billion over that time • Higher funded status will reduce pension expense, currently at $230 million for 2014 • Plans are permanently frozen and closed to new participants. No additional benefits are accruing to existing plan participants • Continued flexibility on future funding as a result of airline relief contained in the Pension Protection Act of 2006 – Delta has until 2031 to fully fund pensions Pension Funded Status 40% 50% 60% 70% 80% 90% 100% 2014 2017 2020 At current discount rates With 100 bps increase in discount rates • Targeting 80% funded status by 2020

13 Increasing Shareholder Returns • Demonstrating a strong commitment to shareholder returns with 50% increase to the dividend and a new $2 billion share repurchase authorization • Return levels moving closer to averages of high quality industrial peer set Regular Dividend $300 million per year Share Repurchase Authorization $2 billion through 2016 • Dividend represents a long - term commitment to returning cash to our owners • Increasing quarterly dividend by 50% to $0.09 per share beginning in the September 2014 quarter - At Monday’s closing price, this represents ~1% dividend yield • Share repurchase program provides flexibility to adapt to seasonal cash flows and changing economic conditions - Have shown our willingness to accelerate buybacks with excess free cash flow • New $2 billion share repurchase has been authorized, to be completed no later than December 31, 2016 - May 2013 $500 million authorization set to be completed in early June 2014, two years ahead of its expiration date Plan To Return Additional $2.75 Billion To Shareholders Through 2016
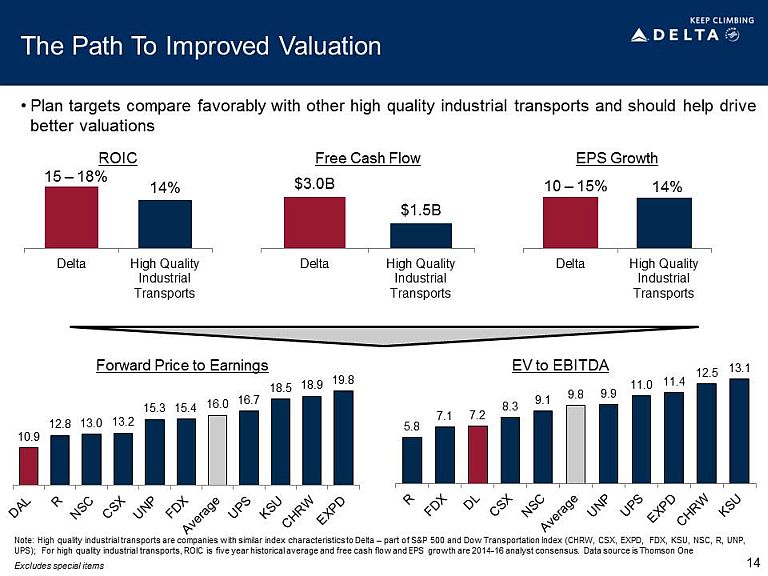
• Plan targets compare favorably with other high quality industrial transports and should help drive better valuations 14 The Path To Improved Valuation 14% Delta High Quality Industrial Transports ROIC Delta High Quality Industrial Transports EPS Growth $ 3.0B $ 1.5B Delta High Quality Industrial Transports Free Cash Flow Note: High quality industrial transports are companies with similar index characteristics to Delta – part of S&P 500 and Dow Tra nsportation Index (CHRW, CSX, EXPD, FDX, KSU, NSC, R, UNP, UPS); For high quality industrial transports, ROIC is five year historical average and free cash flow and EPS growth are 201 4 - 1 6 analyst consensus. Data source is Thomson One 10 – 15% 10.9 12.8 13.0 13.2 15.3 15.4 16.0 16.7 18.5 18.9 19.8 Forward Price to
E
arnings EV to EBITDA 5.8 7.1 7.2 8.3 9.1 9.8 9.9 11.0 11.4 12.5 13.1 15 – 18% 14% Excludes special items

| 15 |
Non-GAAP Financial Measures
Delta sometimes uses information ("non-GAAP financial measures") that is derived from our Consolidated Financial Statements, but that is not presented in accordance with accounting principles generally accepted in the U.S. (“GAAP”). Under the U.S. Securities and Exchange Commission rules, non-GAAP financial measures may be considered in addition to results prepared in accordance with GAAP, but should not be considered a substitute for or superior to GAAP results. The tables below show reconciliations of non-GAAP financial measures used in this presentation to the most directly comparable GAAP financial measures.
Forward Looking Projections: Delta is unable to reconcile certain forward-looking projections to GAAP as the nature or amount of special items cannot be estimated at this time.
Pre-Tax Margin
Delta excludes special items from pre-tax margin because management believes the exclusion of these items is helpful to investors to evaluate the company’s recurring core operational performance in the periods shown. Therefore, we adjust for these amounts to arrive at more meaningful financial measures. Special items excluded in the table below showing the reconciliation of pre-tax margin are:
Mark-to-market adjustments on fuel hedges recorded in periods other than the settlement period ("MTM adjustments"). MTM adjustments are based on market prices at the end of the reporting period for contracts settling in future periods. Such market prices are not necessarily indicative of the actual future value of the underlying hedge in the contract settlement period. Therefore, excluding these adjustments allows investors to better understand and analyze the company’s core operational performance in the periods shown.
Restructuring and other items. Because of the variability in restructuring and other items, the exclusion of this item is helpful to investors to analyze the company’s recurring core operational performance in the periods shown.
Loss on extinguishment of debt and other. Because of the variability in loss on extinguishment of debt and other, the exclusion of this item is helpful to investors to analyze the company’s recurring core operational performance in the periods shown.
| Last Twelve Months Ended | ||||||||||||
| March 31, | Year Ended | |||||||||||
| 2014 | 2013 | 2009 | ||||||||||
| Pre-tax margin | 7.5% | 2.5% | -5.6% | |||||||||
| Adjustments: | ||||||||||||
| MTM adjustments | -0.6% | 0.3% | – | |||||||||
| Restructuring and other items | 0.9% | 1.5% | 1.4% | |||||||||
| Loss on extinguishment of debt and other | 0.2% | 0.3% | 0.3% | |||||||||
| Pre-tax margin excluding special items | 8.0% | 4.6% | -3.9% | |||||||||
| 16 |
Free Cash Flow
Delta presents free cash flow because management believes this metric is helpful to investors to evaluate the company's ability to generate cash that is available for use for debt service or general corporate initiatives.
| Last Twelve Months Ended | ||||||||||||
| March 31, | Year Ended | |||||||||||
| (in billions) | 2014 | 2013 | 2009 | |||||||||
| Net cash provided by operating activities | $ | 4.4 | $ | 2.6 | $ | 1.4 | ||||||
| Net cash used in investing activities | (2.7 | ) | (2.2 | ) | (1.0 | ) | ||||||
| Adjustments: | ||||||||||||
| SkyMiles used pursuant to advance purchase under AMEX agreement | 0.3 | 0.3 | ||||||||||
| Aircraft purchases under seller financing | (0.2 | ) | ||||||||||
| Decrease in short-term investments | (0.2 | ) | ||||||||||
| Proceeds from sale of flight equipment | 0.1 | |||||||||||
| Total free cash flow | $ | 2.0 | $ | 0.7 | $ | 0.1 | ||||||
Return on Invested Capital
Delta presents return on invested capital as management believes this metric is helpful to investors in assessing the company’s ability to generate returns.
| Last Twelve | Last Twelve | |||||||||||
| Months Ended | Months Ended | Year Ended | ||||||||||
| (in billions, except % of return) | March 31, 2014 | March 31, 2013 | 2009 | |||||||||
| Adjusted book value of equity | $ | 16.1 | $ | 13.6 | $ | 12.9 | ||||||
| Average adjusted net debt | 10.0 | 11.7 | 16.8 | |||||||||
| Average invested capital | $ | 26.1 | $ | 25.3 | $ | 29.7 | ||||||
| Adjusted total operating income | $ | 4.27 | $ | 3.00 | $ | 0.45 | ||||||
| Return on invested capital | 16.4% | 11.9% | 1.5% | |||||||||
| 17 |
Adjusted Net Debt
Delta uses adjusted total debt, including aircraft rent, in addition to long-term adjusted debt and capital leases, to present estimated financial obligations. Delta reduces adjusted total debt by cash, cash equivalents and short-term investments resulting in adjusted net debt to present the amount of assets needed to satisfy the debt. Management believes this metric is helpful to investors in assessing the company’s overall debt profile.
| Three Months Ended | |||||||||||||||||||||||||||||||||||||||||||||||
| (in billions) | March 31, 2014 |
December 31, 2013 |
December 31, 2012 |
December 31, 2011 |
December 31, 2010 |
December 31, 2009 | |||||||||||||||||||||||||||||||||||||||||
| Debt and capital lease obligations | $ | 11.0 | $ | 11.3 | $ | 12.7 | $ | 13.8 | $ | 15.3 | $ | 17.2 | |||||||||||||||||||||||||||||||||||
| Plus: unamortized discount, net from purchase accounting and fresh start reporting | 0.4 | 0.4 | 0.5 | 0.6 | 0.6 | 1.1 | |||||||||||||||||||||||||||||||||||||||||
| Adjusted debt and capital lease obligations | $ | 11.4 | $ | 11.7 | $ | 13.2 | $ | 14.4 | $ | 15.9 | $ | 18.3 | |||||||||||||||||||||||||||||||||||
| Plus: 7x last twelve months' aircraft rent | 1.4 | 1.5 | 1.9 | 2.1 | 2.7 | 3.4 | |||||||||||||||||||||||||||||||||||||||||
| Adjusted total debt | 12.8 | 13.2 | 15.1 | 16.5 | 18.6 | 21.7 | |||||||||||||||||||||||||||||||||||||||||
| Less: cash, cash equivalents and short-term investments | (3.7 | ) | (3.8 | ) | (3.4 | ) | (3.6 | ) | (3.6 | ) | (4.7) | ||||||||||||||||||||||||||||||||||||
| Adjusted net debt | $ | 9.1 | $ | 9.4 | $ | 11.7 | $ | 12.9 | $ | 15.0 | $ | 17.0 | |||||||||||||||||||||||||||||||||||
Capital Spending
Delta presents combined capital spending as if the company’s merger with Northwest Airlines had occurred at the beginning of the period presented because management believes this metric is helpful to investors to evaluate the company’s combined investing activities and provides a more meaningful comparison to our post-merger amounts.
| Full Year | Full Year | |||||||
| (in billions) | 2013 | 2008 | ||||||
| Delta capital expenditures | $ | 2.6 | $ | 1.5 | ||||
| Investment in Virgin Atlantic | 0.3 | – | ||||||
| Northwest capital expenditures | – | 1.1 | ||||||
| Total combined capital spending | $ | 2.9 | $ | 2.6 | ||||
| 18 |
Operating Cash Flow (net cash provided by operating activities, adjusted)
Delta presents net cash provided by operating activities because management believes this metric is helpful to investors to evaluate the company’s operating activities and cash flows.
| Full Year | Full Year | Full Year | ||||||||||
| (in billions) | 2013 | 2012 | 2008 | |||||||||
| Delta operating cash flow | $ | 4.5 | $ | 2.5 | $ | (1.7 | ) | |||||
| SkyMiles used pursuant to advance purchase under AMEX agreement | 0.3 | 0.3 | – | |||||||||
| Northwest operating cash flow | – | – | 0.2 | |||||||||
| Net cash provided by operating activities, adjusted | $ | 4.8 | $ | 2.8 | $ | (1.5 | ) | |||||
| 19 |
Financial Metrics
Delta presents these measures to compare certain financial metrics for our operations to the same metrics of other companies. Management believes these metrics are helpful to investors in assessing the company’s overall financial operations.
| Full Year | ||||
| (in billions) | 2013 | |||
| Income before income taxes | $ | 2.5 | ||
| Imputed operating lease depreciation | 0.9 | |||
| Depreciation and amortization | 1.7 | |||
| Postretirement benefit obligations (tax effected) | (0.3 | ) | ||
| Share-based compensation and other | 0.4 | |||
| Funds From Operations, adjusted (FFO) | $ | 5.2 | ||
| Full Year | ||||
| (in billions) | 2013 | |||
| Operating income | $ | 3.4 | ||
| Depreciation and amortization | 1.7 | |||
| Imputed operating lease interest and depreciation | 1.5 | |||
| Postretirement expense less service cost | 0.4 | |||
| Restructuring and other items | 0.5 | |||
| EBITDA, adjusted | $ | 7.5 | ||
| Calculations using adjusted data above | ||
| FFO/Debt | 20.4% | |
| EBITDA/Interest | 3.6 | |
| Debt/EBITDA | 3.4 |
| Full Year | ||||
| (in billions) | 2013 | |||
| Interest expense, net | $ | 0.7 | ||
| Amortization of debt discount, net | 0.2 | |||
| Postretirement interest cost less imputed return on plan assets | 0.6 | |||
| Imputed operating lease interest | 0.6 | |||
| Interest, adjusted | $ | 2.1 | ||
| December 31, | ||||
| (in billions) | 2013 | |||
| Total debt and capital lease obligations | $ | 11.3 | ||
| Plus: Imputed amortized operating leases | 8.0 | |||
| Postretirement benefit obligations/deferred compensation | 8.0 | |||
| Surplus cash | (1.8 | ) | ||
| Debt, adjusted | $ | 25.5 | ||
FFO is cash flow from operations before changes in working capital plus implied operating lease depreciation and adjustments of cash flows associated with pension from operating to financing activities. EBITDA includes proprietary adjustments for operating lease rent, pension costs, special items, and for S&P, equity comp. Interest includes proprietary adjustments to net interest expense for operating lease and pension interest costs.
| 20 |