Attached files
| file | filename |
|---|---|
| 8-K - ARROW ELECTRONICS, INC. 8-K - ARROW ELECTRONICS INC | a50858464.htm |
| EX-99.1 - EXHIBIT 99.1 - ARROW ELECTRONICS INC | a50858464_ex99-1.htm |
Exhibit 99.2
First-Quarter 2014 CFO Commentary
As reflected in our earnings release, there are a number of items that impact the comparability of our results with those in the trailing quarter and the first quarter of last year. Any discussion of our results will exclude these items to give you a better sense of our operating results. As always, the operating information we provide to you should be used as a complement to GAAP numbers. For a complete reconciliation between our GAAP and Non-GAAP results, please refer to our earnings release and the earnings reconciliation found at the end of this document.
The following first quarter as reported and adjusted information included in this CFO commentary is unaudited and should be read in conjunction with the Form 10-Q for the quarterly period ended March 29, 2014 and the company’s 2013 Annual Report on Form 10-K as filed with the Securities and Exchange Commission.
First-Quarter Summary
We executed well on our profitability, cash flow, and returns priorities in the first quarter and we were encouraged by the early results of our strategic growth investments. The demand environment in our Global Components business matched our expectations as we entered 2014, while the environment for ECS was somewhat mixed. Our consolidated sales were $5.1 billion and diluted earnings per share were $1.22. Revenue was slightly below the low end of our guidance while EPS came in above the midpoint of our guidance range. Operating income and diluted earnings per share advanced 19% and 28%, respectively, year over year. Operating margins were up over last year’s first quarter in both businesses. Cash generation was, again, strong at $124 million. Return on working capital at a healthy 24%, advanced again year over year. We continue to invest in our business, expanding our line card and geographic footprint, driving the value-added portion of our business and developing solutions that enable migration to next-generation IT architectures.
1
Global components saw revenue advance in line with our expectations and traditional seasonality. Demand strengthened through the quarter. The overall market remains stable, with lead times and cancellation rates operating in normal ranges. Our sales of $3.4 billion were at the midpoint of our expectations, advancing 7% year over year, with double-digit increases in both Europe and Asia. Book to bill remained positive at 1.04, up from 1.03 in the fourth quarter of 2013. Arrow’s global components business continues to deliver increasing value to both our customers and our suppliers. We are achieving this through our extensive design and engineering capabilities, and leading value-added services.
Demand conditions for enterprise computing solutions softened exiting our record fourth quarter. Sales were flat year over year and declined 11% adjusted for acquisitions and changes in foreign currencies. We experienced a pause in our hardware business, but our software and security related businesses were on plan and delivered growth. Overall, we were pleased with ECS’ execution in the quarter. As we look to the second quarter, we have been encouraged by activity levels in April, and we expect sequential growth to be above the traditional range.
2
Consolidated Overview – First Quarter
|
P&L Highlights*
|
Q1 2014 |
Y/Y
Change
|
Y/Y Change
Adjusted for
Acquisitions &
Currency
|
Q/Q
Change
|
|||||||||
|
Sales
|
$ | 5,082 | +5% | -1% | -17% | ||||||||
|
Gross Profit Margin
|
13.8 | % |
+60bps
|
+40bps
|
+100bps
|
||||||||
|
Operating Expense/Sales
|
9.9 | % |
+10bps
|
-10bps
|
+140bps
|
||||||||
|
Operating Income
|
$ | 200 | +19% | +14% | -25% | ||||||||
|
Operating Margin
|
3.9 | % |
+50bps
|
+50bps
|
-40bps
|
||||||||
|
Net Income
|
$ | 124 | +20% | +15% | -28% | ||||||||
|
Diluted EPS
|
$ | 1.22 | +28% | +22% | -28% |
* $ in millions, except per share data, may reflect rounding
|
●
|
First-quarter sales were $5.1 billion
|
|
|
o
|
Increased 5% year over year and decreased 17% sequentially
|
|
|
o
|
Adjusted for the impact of acquisitions and changes in foreign currencies, sales decreased 1% year over year
|
|
●
|
Consolidated gross profit margin was 13.8%
|
|
|
o
|
Increased 60 basis points year over year, principally due to improving profitability within the EMEA region for both global components and enterprise computing solutions
|
|
|
§
|
Increased 100 basis points sequentially due to a higher mix of global components sales
|
|
●
|
Operating expenses as a percentage of sales were 9.9%
|
|
|
o
|
Increased 10 basis points year over year and 140 basis points sequentially
|
|
|
§
|
On an absolute dollar basis, operating expenses increased 6% year over year
|
|
|
§
|
Adjusted for the impact of acquisitions and changes in foreign currencies, operating expenses were 10 basis points lower year over year as a percentage of sales, driven by our operating leverage and efficiency initiatives
|
|
●
|
Operating income was $200 million
|
|
|
o
|
Increased 19% year over year as reported, more than 3 x our sales growth
|
|
|
o
|
Increased 14% year over year as adjusted for the impact of acquisitions and changes in foreign currencies
|
|
●
|
Operating income as a percentage of sales was 3.9%
|
3
|
|
o
|
Increased 50 basis points year over year
|
|
●
|
Effective tax rate for the quarter was 27.9%
|
|
●
|
Net income was $124 million
|
|
|
o
|
Increased $21 million year over year
|
|
●
|
Earnings per share were $1.24 and $1.22 on a basic and diluted basis, respectively
|
|
|
o
|
Diluted EPS increased 28% year over year
|
4
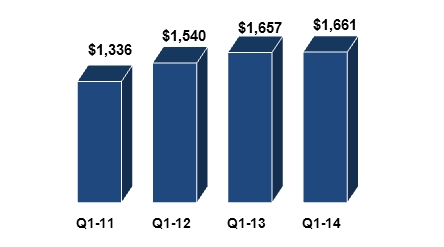
Global Components
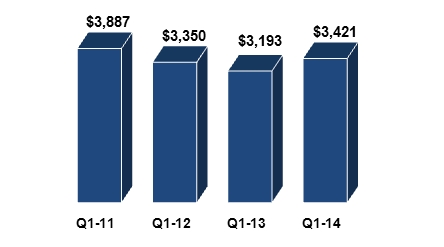
Sales ($ in millions)
|
●
|
Sales increased 7% year over year and were flat sequentially
|
|
●
|
Gross profit dollars increased 8% year over year and were up 2% sequentially
|
|
|
o
|
Sales growth and an improvement in European gross margin drove the improvement year over year
|
|
●
|
Book-to-bill was 1.04
|
|
|
o
|
Book-to-bill up from 1.03 in the fourth quarter of 2013
|
|
●
|
Leading indicators, including lead times and cancellation rates, are in line with historical norms
|
|
●
|
Gross margins increased 10 basis points year over year and increased 40 basis points sequentially
|
|
●
|
Operating margin of 4.9%
|
|
|
o
|
Increased 70 basis points year over year and as adjusted for the impact of acquisitions, primarily driven by operating leverage and our efficiency initiatives
|
|
●
|
Return on working capital increased 130 basis points year over year, driven by higher operating income
|
5
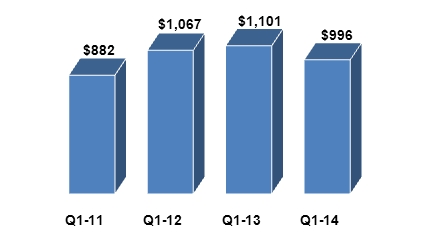
Americas Components Region
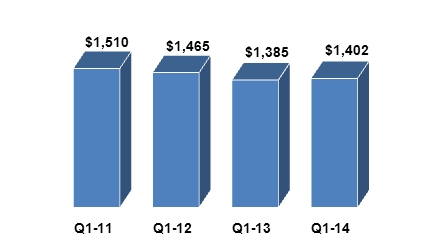
Sales ($ in millions)
|
●
|
Sales increased 1% year over year and were down 6% sequentially
|
|
|
o
|
Good growth in the medical and lighting verticals year over year
|
|
|
o
|
In line with normal seasonality on a sequential basis
|
|
●
|
Operating income increased 16% year over year
|
|
|
o
|
Operating margin was up 90 basis points year over year
|
|
●
|
Looking ahead to the second quarter, we expect sales in our core Americas components business to be in line with seasonality
|
6
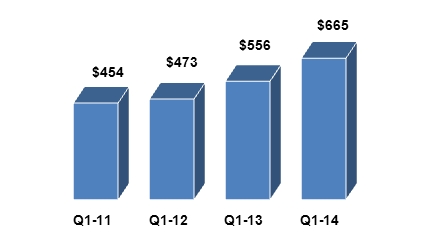
Europe Components Region
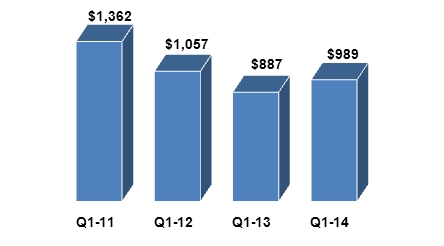
Sales ($ in millions)
|
●
|
Sales increased 12% year over year and sequentially
|
|
|
o
|
Adjusted for the impact of acquisitions and changes in foreign currencies, sales increased 7% year over year and 10% sequentially
|
|
|
o
|
Sequential sales in line with traditional seasonality
|
|
●
|
Operating income increased 52% year over year
|
|
|
o
|
Operating margins increased 140 basis points year over year driven by improvement in gross margins, operating leverage, and our efficiency initiatives
|
|
●
|
Looking ahead to the second quarter, we expect sales in our core European components business to be in line with seasonality
|
7
Asia Pacific Components Region
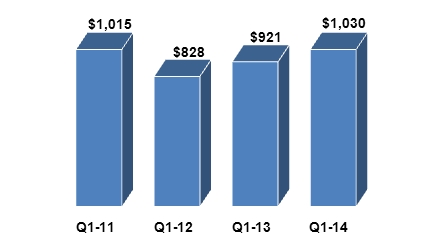
Sales ($ in millions)
|
●
|
Sales increased 12% year over year and were down 3% sequentially
|
|
|
o
|
China growth remained strong year over year
|
|
|
o
|
Sequential sales toward the upper end of traditional seasonality
|
|
●
|
Operating income increased 15% year over year
|
|
|
o
|
Primarily due to improving gross margins in our core business and operating leverage
|
|
|
o
|
Operating margin increased 10 basis points year over year
|
|
●
|
Looking ahead to the second quarter, we expect sales in our core Asia Pacific components business to be near the low end of our seasonality range
|
8
Global Enterprise Computing Solutions
Sales ($ in millions)
|
●
|
Sales were flat year over year and decreased 39% sequentially
|
|
●
|
Gross margin was up 140 basis points year over year and sequentially due to more favorable mix of more software and fewer low-margin industry standard servers
|
|
●
|
Operating margin of 4.2%
|
|
|
o
|
Up 20 basis points year over year
|
|
|
o
|
Operating income increased 6% year over year
|
|
●
|
Return on working capital continues to excel, increasing year over year
|
9
ECS America
Sales ($ in millions)
|
●
|
Sales decreased 10% year over year and 40% sequentially
|
|
●
|
Operating income increased 1% year over year and decreased 46% sequentially
|
|
|
o
|
Operating margin increased 60 basis points year over year
|
|
●
|
Looking ahead to the second quarter, we expect sales in our core Americas value-added computing solutions business to be above seasonality
|
10
ECS Europe
Sales ($ in millions)
|
●
|
Sales increased 20% year over year and decreased 37% sequentially
|
|
|
o
|
Adjusted for the impact of acquisitions and changes in foreign currencies, sales decreased 11% year over year
|
|
●
|
Operating income increased 34% year over year
|
|
|
o
|
Operating margin increased 30 basis points year over year
|
|
●
|
Looking ahead to the second quarter, we expect sales in our core European value-added computing solutions business to be above seasonality
|
11
Cash Flow and Balance Sheet Highlights
|
●
|
Cash Flow from Operations
|
Cash generated from operating activities in the first quarter was $124 million and $754 million on a trailing 12-month basis. We converted more than 175% of GAAP net income to cash over the last 12-months, well in excess of our target.
|
●
|
Working Capital
|
Working capital to sales was 16.3%. Return on working capital was 24.2%.
|
●
|
Return on Invested Capital
|
Return on invested capital in the first quarter was 9.3%, an increase over the prior year, and ahead of our weighted average cost of capital.
|
●
|
Share Buyback
|
We repurchased $75 million of our stock in the first quarter, bringing our total cash returned to shareholders over the last twelve months to approximately $320 million.
|
●
|
Debt and Liquidity
|
Our balance sheet and capital structure remain very strong with conservative debt levels and a net debt to EBITDA ratio of approximately 2.1x. Our total liquidity is $2.7 billion when including our cash of $258 million. Our capital structure strategy includes remaining investment grade over the long term, as well as maintaining the flexibility to invest in our strategy and execute on our share repurchase program.
|
Second-Quarter 2014 Guidance
|
|
|
Consolidated Sales
|
$5.45 billion to $5.85 billion
|
|
Global Components
|
$3.45 billion to $3.65 billion
|
|
Global ECS
|
$2 billion to $2.2 billion
|
|
Diluted Earnings per Share*
|
$1.35 to $1.47
|
* Second quarter guidance assumes average diluted shares outstanding of 101 million.
12
Arrow Electronics Updated Revenue Seasonality*
|
Global
Components
|
NAC
|
EMEA ex FX
|
AAP
|
|
Q1
|
-7% to +1%
|
+9% to +17%
|
-10% to -2%
|
|
Q2
|
-1% to +7%
|
-5% to +3%
|
+9% to +17%
|
|
Q3
|
-6% to +2%
|
-3% to +5%
|
-4% to +4%
|
|
Q4
|
-3% to +5%
|
-13% to -5%
|
-4% to +4%
|
|
Global ECS
|
NA
|
EMEA ex FX
|
|
Q1
|
-27% to -19%
|
-34% to -26%
|
|
Q2
|
+15% to +23%
|
+3% to +11%
|
|
Q3
|
-15% to -7%
|
-25% to -17%
|
|
Q4
|
+31% to +39%
|
+75% to +83%
|
* Revenue seasonality based on historical sequential sales growth for our components and ECS businesses, updated1/1/2014
13
Risk Factors
The discussion of the company’s business and operations should be read together with the risk factors contained in Item 1A of its 2013 Annual Report on Form 10-K, filed with the Securities and Exchange Commission, which describe various risks and uncertainties to which the company is or may become subject. If any of the described events occur, the company’s business, results of operations, financial condition, liquidity, or access to the capital markets could be materially adversely affected.
Information Relating to Forward-Looking Statements
This CFO Commentary includes forward-looking statements that are subject to numerous assumptions, risks, and uncertainties, which could cause actual results or facts to differ materially from such statements for a variety of reasons, including, but not limited to: industry conditions, the company's implementation of its new enterprise resource planning system, changes in product supply, pricing and customer demand, competition, other vagaries in the global components and global enterprise computing solutions markets, changes in relationships with key suppliers, increased profit margin pressure, the effects of additional actions taken to become more efficient or lower costs, risks related to the integration of acquired businesses, changes in legal and regulatory matters, and the company’s ability to generate additional cash flow. Forward-looking statements are those statements, which are not statements of historical fact. These forward-looking statements can be identified by forward-looking words such as "expects," "anticipates," "intends," "plans," "may," "will," "believes," "seeks," "estimates," and similar expressions. Shareholders and other readers are cautioned not to place undue reliance on these forward-looking statements, which speak only as of the date on which they are made. The company undertakes no obligation to update publicly or revise any of the forward-looking statements.
For a further discussion of factors to consider in connection with these forward-looking statements, investors should refer to Item 1A Risk Factors of the company’s Annual Report on Form 10-K for the year ended December 31, 2013.
14
Certain Non-GAAP Financial Information
In addition to disclosing results that are determined in accordance with Generally Accepted Accounting Principles ("GAAP"), the company provides certain non-GAAP financial information relating to operating income, net income attributable to shareholders, and net income per basic and diluted share, each as adjusted for certain charges, credits, gains, and losses that the company believes impact the comparability of its results of operations. These charges, credits, gains, and losses arise out of the company's efficiency enhancement initiatives, acquisitions (including intangible assets amortization expense), prepayment of debt, and adjustments related to certain tax matters. A reconciliation of the company's non-GAAP financial information to GAAP is set forth in the table below.
The company believes that such non-GAAP financial information is useful to investors to assist in assessing and understanding the company's operating performance and underlying trends in the company's business because management considers the charges, credits, gains and losses referred to above to be outside the company's core operating results. This non-GAAP financial information is among the primary indicators management uses as a basis for evaluating the company's financial and operating performance. In addition, the company's Board of Directors may use this non-GAAP financial information in evaluating management performance and setting management compensation.
The presentation of this additional non-GAAP financial information is not meant to be considered in isolation or as a substitute for, or alternative to, operating income, net income attributable to shareholders and net income per basic and diluted share determined in accordance with GAAP. Analysis of results and outlook on a non-GAAP basis should be used as a complement to, and in conjunction with, data presented in accordance with GAAP.
15
Earnings Reconciliation
($ in thousands, except per share data)
| Q1 2014 | Q4 2013 | Q1 2013 | ||||||||||
|
Operating income, as Reported
|
$ | 177,740 | $ | 237,337 | $ | 137,552 | ||||||
|
Intangible assets amortization expense
|
10,947 | 10,007 | 8,957 | |||||||||
|
Restructuring, integration, and other charges
|
11,614 | 18,248 | 21,610 | |||||||||
|
Operating income, as Adjusted
|
$ | 200,301 | $ | 265,592 | $ | 168,119 | ||||||
|
Net income attributable to shareholders, as Reported
|
$ | 107,120 | $ | 134,831 | $ | 77,875 | ||||||
|
Intangible assets amortization expense
|
8,907 | 8,120 | 7,116 | |||||||||
|
Restructuring, integration, and other charges
|
8,020 | 13,341 | 15,495 | |||||||||
|
Loss on prepayment of debt
|
-- | -- | 2,627 | |||||||||
|
Settlement of tax matters
|
||||||||||||
|
Income taxes
|
-- | 15,447 | -- | |||||||||
|
Interest (net of taxes)
|
-- | 297 | -- | |||||||||
|
Net income attributable to shareholders, as Adjusted
|
$ | 124,047 | $ | 172,036 | $ | 103,113 | ||||||
|
Diluted EPS, as Reported
|
$ | 1.06 | $ | 1.32 | $ | .72 | ||||||
|
Intangible assets amortization expense
|
.09 | .08 | .07 | |||||||||
|
Restructuring, integration, and other charges
|
.08 | .13 | .14 | |||||||||
|
Loss on prepayment of debt
|
-- | -- | .02 | |||||||||
|
Settlement of tax matters
|
||||||||||||
|
Income taxes
|
-- | .15 | -- | |||||||||
|
Interest (net of taxes)
|
-- | -- | -- | |||||||||
|
Diluted EPS, as Adjusted
|
$ | 1.22 | $ | 1.69 | $ | .96 |
The sum of the components for diluted EPS, as Adjusted, may not agree to totals, as presented, due to rounding.
Earnings Reconciliation
References to restructuring and other charges refer to the following incremental charges taken in the periods indicated:
Q1-14 Intangible Assets Amortization Expense: During the first quarter of 2014, the company recorded intangible assets amortization expense of $10.9 million ($8.9 million net of related taxes or $.09 per share on both a basic and diluted basis).
Q1-14 Restructuring, Integration, and Other Charges: During the first quarter of 2014, the company recorded restructuring, integration, and other charges of $11.6 million ($8.0 million net of related taxes or $.08 per share on both a basic and diluted basis).
Q4-13 Intangible Assets Amortization Expense: During the fourth quarter of 2013, the company recorded intangible assets amortization expense of $10.0 million ($8.1 million net of related taxes or $.08 per share on both a basic and diluted basis).
16
Q4-13 Restructuring, Integration, and Other Charges: During the fourth quarter of 2013, the company recorded restructuring, integration, and other charges of $18.2 million ($13.3 million net of related taxes or $.13 per share on both a basic and diluted basis).
Q4-13 Settlement of tax matters: During the fourth quarter of 2013, the company recorded an increase in the provision for income taxes of $15.4 million ($.15 per share on both a basic and diluted basis) and interest expense (net of related taxes) of $.3 million relating to the settlement of certain international tax matters.
Q1-13 Intangible Assets Amortization Expense: During the first quarter of 2013, the company recorded intangible assets amortization expense of $9.0 million ($7.1 million net of related taxes or $.07 per share on both a basic and diluted basis).
Q1-13 Restructuring, Integration, and Other Charges: During the first quarter of 2013, the company recorded restructuring, integration, and other charges of $21.6 million ($15.5 million net of related taxes or $.15 and $.14 per share on a basic and diluted basis, respectively).
Q1-13 Loss on Prepayment of Debt: During the first quarter of 2013, the company recorded a loss on prepayment of debt of $4.3 million ($2.6 million net of related taxes or $.02 on both a basic and diluted basis).
17