Attached files
| file | filename |
|---|---|
| 8-K - FORM 8-K - SUSQUEHANNA BANCSHARES INC | d718986d8k.htm |
 Susquehanna Bancshares, Inc.
Investor Presentation
2
nd
Quarter
2014
Exhibit 99.1 |
 Forward-Looking Statements
During
the
course
of
this
presentation,
we
may
make
forward-looking
statements
regarding
priorities
and
strategic
objectives
of
Susquehanna
Bancshares,
Inc.,
as
well
as
capital
ratios,
efficiency
ratios,
net
income
and
earnings.
Investors
should
understand
that
these
forward-looking
statements
are
strategic
objectives
rather
than
projections
of
future
performance.
We
wish
to
caution
you
that
actual
results
and
trends
could
differ
materially
from
those
set
forth
in
such
statements
due
to
various
risks,
uncertainties
and
other
factors.
The
risks,
uncertainties
and
other
factors
that
could
cause
actual
results
and
experience
to
differ
from
those
projected
include,
but
are
not
limited
to,
the
following:
ineffectiveness
of
Susquehanna’s
business
strategy
due
to
changes
in
current
or
future
market
conditions;
the
effects
of
competition,
including
industry
consolidation
and
development
of
competing
financial
products
and
services;
the
costs
and
effects
of
legal
and
regulatory
developments
including
the
resolution
of
legal
proceedings
or
regulatory
or
other
governmental
inquiries
and
the
results
of
regulatory
examinations
or
reviews;
interest
rate
movements;
changes
in
credit
quality;
deteriorating
economic
conditions;
other
risks
and
uncertainties;
and
our
success
at
managing
the
risks
involved
in
the
foregoing
items.
For
a
more
detailed
description
of
the
factors
that
may
affect
Susquehanna’s
operating
results,
we
refer
you
to
our
filings
with
the
Securities
&
Exchange
Commission,
including
our
annual
report
on
Form
10-K
for
the
year
ended
December
31,
2013
and
Form
10-Q
for
the
quarter
ended
September
30,
2013.
Susquehanna
assumes
no
obligation
to
update
the
forward-looking
statements
made
during
this
presentation.
For more information, please visit our Website at:
www.susquehanna.net
2 |
 Why
Susquehanna? 3
Business Strategy
Regional
bank
with
a
customer-focused
“community
bank”
delivery
model
Grow
deposits
–
attractive
markets
with
rich
deposit
base
and
favorable
demographics
Commercial
loan
focus
–
ample
small
business
opportunities
within
footprint
Enhance
fee
income
activities
–
capital
markets,
cash
management,
mortgage
and
wealth
Invest
to
enhance
customer
experience,
employee
engagement
and
risk
management
Management Team
Executive
management
team
with
200+
years
of
combined
banking
experience
Deep
knowledge
of
the
markets
Susquehanna
serves
Interests
aligned
with
stockholders
through
short-term
incentives
tied
to
strategic
goals
and
long-
term
incentives
tied
to
relative
total
shareholder
return
and
return
on
tangible
common
equity
(“ROTCE”)
Valuation
Trade
at
a
discount
to
peers
on
an
earnings
and
book
value
basis
Very
attractive
dividend
yield
at
3.09%¹
Long-Term Upside
Execution
of
strategy
builds
attractive
deposit
franchise
and
enhances
the
long-term
earnings
power
of
Susquehanna
Potential
P/E
expansion
due
to
higher
earnings
growth
and
lower
cost
of
equity
Stronger
balance
sheet
and
fee
income
activities
while
improving
liquidity
and
interest
rate
risk
profile
1
Based on current annualized dividend of $0.32 per share and closing price on April
30, 2014. |
 Table
of Contents 4
Susquehanna Overview
5
Financial Review: First Quarter 2014
10
Business Strategy: Regional Bank With a Customer-Focused
“Community
Bank”
Delivery
Model
14
Valuation and Long-Term Upside
27
Quarterly Financial Supplement
30 |
 Susquehanna Overview
5 |
 Susquehanna Overview
6
Corporate Overview
Regional bank headquartered in Lititz, PA
245 banking offices concentrated in Central PA,
Western MD, and Philadelphia and Baltimore
MSAs
38
th
largest U.S. commercial bank by assets
and 2
nd
largest headquartered in PA
Experienced management team with extensive
market knowledge
Franchise is a diversified mix of consumer and
business customers, products and revenue
sources
Non-bank affiliates offering products and
services in:
–
Wealth management
–
Insurance brokerage and
employee benefits
–
Commercial finance
–
Vehicle leasing
Assets:
$18.4 billion
Deposits:
$13.1 billion
Loans & Leases:
$13.6 billion
Assets under management
$7.7 billion
and administration:
Market cap
1
:
$1.9 billion
Average daily volume
:
~1.3 million shares
Institutional ownership:
>70%
Dividend yield
:
3.09%
NASDAQ:
SUSQ
1
Based on closing price on April 30, 2014.
2
Over the last 52 weeks.
3
Based on current annualized dividend of $0.32 per share and closing price on April
30, 2014. Selected Data as of 3/31/2014
3
2 |
 Uniquely Positioned
7
Source: SNL Financial.
Note: Regulatory branch and deposit data as of June 30, 2013; banks and thrifts with
deposits in counties SUSQ operates in PA/NJ/MD/WV; traditional and
in-store branches only, as defined by SNL. Counties
of
operation
are
listed
in
the
“Quarterly
Financial
Supplement”
slides
at
the
conclusion
of
this
presentation.
Proven ability to grow share and
rank in key markets of operation:
–
Top 3 market share in 11 of 40
counties
–
10%+ market share in
13 counties
–
Top 5 market share in half the
MSAs where we do business
Largest locally based community
bank in our market
Ample opportunity to grow
deposits with small market share
gains:
–
Increasing market share 30 bps to
4.9% would bring loan to deposit
ratio just below 100%, in-line with
our 2014 target
Deposit Market Share: Counties of Operation
Rank
Institution
Branch
Count
Total Deposits in
Market ($000)
Total Market
Share (%)
1
Wells Fargo
377
41,514,008
14.9%
2
PNC
393
28,419,912
10.2%
3
Bank of America
217
25,180,194
9.1%
4
M&T Bank
324
24,420,075
8.8%
5
Toronto-Dominion Bank
167
20,925,057
7.5%
6
Royal Bank of Scotland
217
18,654,030
6.7%
7
Susquehanna
245
12,790,628
4.6%
8
Fulton
191
9,513,532
3.4%
9
Banco Santander
178
9,222,815
3.3%
10
National Penn
120
5,945,401
2.1%
11
BB&T
68
4,327,798
1.6%
12
Beneficial
60
3,777,354
1.4%
13
Citi
13
2,811,745
1.0%
14
First Niagara
61
2,481,487
0.9%
15
Customers
12
2,270,071
0.8%
Total
(1-15)
2,665
212,254,107
76.4%
Total
(1-239)
4,146
277,747,024
100.0% |
 Leading Competitive Position
8
Better positioned with a stronger market concentration than peers
Markets of operation are wealthier than peers
Market presence in 14 of the 20 most affluent counties in PA by median household
income –
Maryland market includes Baltimore and three of the nation’s 40
most-affluent counties including no. 3, Howard County Source: SNL
Financial, U.S. Census. Peer data reflects median of peer companies. Identification of peer companies is included
in
the
“Quarterly
Financial
Supplement”
at
the
conclusion
of
this
presentation.
Deposit
data
as
of
June
30,
2013
1
Reflects weighted average by deposits at the county level. Household income as of
2013. SUSQ
Peers
% of Deposits in Counties
with #1 Rank
31%
22%
% of Deposits in Counties
with 25% Market Share
32%
18%
Attractive Market Demographics and Leading Competitive Position
SUSQ
Peers
Median Household
Income¹
$58,718
$51,374
% of Deposits in Counties
with HHI Over $60,000
29%
17% |
 Positioned for Further Growth
9
Pennsylvania Market
Delaware Valley Market
Maryland Market
115 branches
Foundation for growth with stable commercial
and retail banking base providing ample deposits
Home to distribution hubs for global retailers,
manufacturers and distributors serving Northeast
and Mid-Atlantic markets
69 branches
Growth opportunities fueled by world-leading
education, health care and research institutions
61 branches
Growth opportunities fueled by world-leading
education, health care and research institutions,
as well as major federal agencies and
contractors
Small Business Density Complements Branch Footprint
Source: Bank Intelligence. “Small Business”
defined as businesses with less than $10 million in annual sales.
The 16 counties comprising the company’s Pennsylvania Market, the 10 counties
comprising the company’s Delaware Valley Market and the 14 counties comprising the company’s Maryland Market are listed in
the “Quarterly Financial Supplement”
slides at the conclusion of this presentation. |
 Financial Review: First Quarter 2014
10 |
 First
Quarter 2014 Highlights 11
GAAP
EPS
of
$0.20
Modestly lower than $0.22 in 4Q13 and $0.23 in 1Q13
Fee
Income
Impacted
by
Weather
&
Seasonality
Capital
markets
revenue
of
$1.2
million
compared
to
$3.2
million
in
the
prior
quarter;
increased 37.5% year-over-year
Wealth revenue declined to $12.7 million compared to $13.0 million in the prior
quarter; increased 2.7% year-over-year
Mortgage banking revenue essentially flat at $2.4 million
Service charges and other income impacted by weather and seasonality; service
charges increased 3.8% year-over-year
Commercial
Loan
Growth
Commercial loans grew 0.7% linked quarter and 4.3% year-over-year
Continued
Focus
on
Deposit
Growth
Deposits increased by 1.6% linked quarter and 3.1% year-over-year
Interest-bearing deposit costs remained flat at 50bps linked quarter
Focused
on
Returns
ROAA of 0.82% compared to 0.89% and 0.95% in 4Q13 and 1Q13, respectively
ROATE
1
of 11.08% compared to 12.49% and 13.87% in 4Q13 and 1Q13, respectively
Solid
Credit
Quality
Metrics
and
Capital
Ratios
NPAs moved to 0.89% of loans, leases and foreclosed real estate
Strong coverage ratio with allowance representing 142% of nonaccrual loans and
leases Tangible common ratio
1
of 8.67%; regulatory ratios exceed “well capitalized”
1
Non-GAAP
based
financial
measures;
please
refer
to
the
“Quarterly
Financial
Supplement”
slides
at
the
conclusion
of
this
presentation
for
calculations. |
 First
Quarter Purchase Accounting Impact
12
Tower’s purchased credit impaired fair value marks are
amortized by pooling like asset classes while Abington’s marks
are amortized at the loan level
Non-purchased credit impaired fair value marks are amortized
at the loan level
Predicting future amortization is challenging due to
prepayment/refinancing, customer behavior and the overall
health of the economy
Total purchase accounting benefit was 21 bps in 1Q14
compared to15bps in 4Q13
Loan amortization was 17bps in 1Q14 compared to 11bps in
4Q13
Deposit and borrowing amortization was 4bps in 1Q14
compared to 4ps in 4Q13
Net
interest
margin,
excluding
purchase
accounting,
1
declined
5bps from 3.45% in 4Q13 to 3.40% in 1Q14
Non purchase accounting roll forward
Note:
Additional
information
on
purchase
accounting
impact
is
included
in
the
“Quarterly
Financial
Supplement”
slides
at
the
conclusion
of
this
presentation.
1
Non-GAAP
based
financial
measures;
please
refer
to
the
“Quarterly
Financial
Supplement”
slides
at
the
conclusion
of
this
presentation
for
calculations
. |
 Susquehanna
Peer
Median
5
ROAA
0.82%
0.88%
ROATE
1
11.08%
10.71%
Net Interest Margin
3.61%
3.36%
Loans % of Deposits
104%
86%
Loan Growth
(0.01%)
2.2%
Deposit Growth
1.6%
1.4%
Deposit Cost
0.43%
0.24%
C&I % of Total Loans
2
14.2%
22.9%
Checking Deposits %
of Total Deposits
2,3
23.6%
31.1%
Efficiency Ratio
1
66.18%
66.04%
Fee
Income
%
of
Operating
Revenue
4
23.1%
25.7%
NPAs % of Loans and Leases and
Foreclosed Real Estate
0.89%
1.02%
NCOs % of Average Loans and Leases
0.28%
0.23%
Tier
1
Common
Ratio
6
10.84%
10.47%
1Q14 Performance vs. Peers
13
Source: SNL Financial and company filings
1
Non-GAAP
based
financial
measures;
please
refer
to
the
“Quarterly
Financial
Supplement”
slides
at
the
conclusion
of
this
presentation
for
calculations.
2
Per 12/31/13 regulatory filings.
3
Interest-bearing and non-interest bearing transaction deposits per
regulatory filings. 4
As
reported
by
SNL.
Excludes
securities
gains
and
losses
and
other
non-recurring
items.
5
Please
refer
to
the
“Quarterly
Financial
Supplement”
slides
at
the
conclusion
of
this
presentation
for
the
listing
of
the
peer
companies.
6
Most recent available data
Solid profitability
Focus on improving loan to deposit ratio
Fee income activities in place to deepen
relationships and close the gap to peers
NCOs/Avg. loans and leases trending
towards peers while the Tier 1 common
ratio is slightly better than peers
Working to close the gap to peers by
growing checking deposits and commercial
loans in attractive markets
Comments |
 Business Strategy: Regional Bank With a
Customer-Focused “Community Bank”
Delivery Model
14 |
 Strategic Focus: Multi-Year Plan
15
OBJECTIVE: Transition to a Robust Relationship-Based Customer Model
1.
Shift in Model and
Focus
New investments
focused on:
–
Technology
–
Risk management
–
Employee engagement
–
Customer experience
–
Service delivery
–
Marketing
–
Pricing
–
Products
Evaluating new and existing relationships for relationship profitability
2.
Hiring and Talent
Recruiting experienced leaders across the bank
Hiring individuals and teams
Employee engagement at all levels
Building capabilities to foster existing employee development
3.
Redesigned Incentive
Structure
New profitability model to drive bankers’
incentives
Incentives promote cross selling, risk management and total portfolio
management |
 Investing for Tomorrow
16
Investments Focused on What We Can Control
Aligning Infrastructure With Our
Growth into Top 50 Bank Rankings
Ensuring systems, processes and capabilities can accommodate growth
beyond the $18 billion institution Susquehanna is today
Focus on Scalable Investments
Software and technology
Fee income activities
Risk management
Customer experience
Service delivery
Investments for Business Demand
4 of the top 5 budgeted capital expenditures for 2014 are for business
demand: -
ATMs
-
Branch relocation
-
Product software
-
Commercial Banking online upgrades
Investments today position Susquehanna for future growth and performance
Business demand drives
84% of budgeted spend
for top 5 capital
expenditures in 2014
Higher expenses in the
near-term |
 Investing in Talent
17
Approximately
45%
of
Susquehanna’s
top
60
leaders
have
joined
within
the
last
two
years,
bringing
new
ideas
and
best
practices to bear
Aligning corporate and individual objectives with strategic plan
and stockholders’
interests
–
Short-term incentives tied to strategic goals
–
Long-term incentive plan tied to relative total shareholder return and
ROTCE WILLIAM
REUTER
Chairman and CEO
39 years banking experience,
including 23 years with Susquehanna
ANDREW
SAMUEL
Bank President and CEO
29 years banking experience
2 years with Susquehanna
MICHAEL
HARRINGTON
Chief Financial Officer
27 years banking experience
2 years with Susquehanna
MICHAEL
QUICK
Chief Corporate
Credit Officer
42 years banking experience
23 years with Susquehanna
GREGORY
DUNCAN
Chief Operating Officer
30 years banking experience
23 years with Susquehanna
CARL
LUNDBLAD
Chief Legal &
Administrative Officer
16 years banking / legal
experience
2 years with Susquehanna
BEVERLY
WISE
Chief Human
Resources Officer
25 years banking experience
2 years with Susquehanna
KEVIN
BURNS
Chief Risk Officer
15 years banking experience
<1 year with Susquehanna |
 Business Strategy
18
Strategic Priorities for 2014
Focus on
Deposits
Helps achieve balance sheet objectives
Significant opportunity in existing client base
Take
share
from
larger
competitors
with
“community
bank”
delivery
model
Complements strategy to grow commercial loans and success of Stellar Checking
retail campaign Optimize
Balance Sheet
Focus on growing commercial loans while limiting indirect auto and selling more
mortgage production –
Dense population of small businesses in-market
–
Product offerings position us to compete with small and large banks
Small business relationships provide opportunities in wealth, capital markets and
cash management –
Growing fee income reduces spread-reliance and promotes stable revenue
stream Customer
Experience
and Employee
Engagement
Delivering a differentiated customer experience with premier service and
simplified processes Fueling customer-centric culture through
investments in talent, technology, products and delivery Aligning
compensation around drivers of sustainable and profitable relationships
–
Incentives
tied
to
full
customer
relationships,
measured
through
profitability
model
Enterprise
Risk
Management
Investments in people and processes to effectively manage risk commensurate with
our size, complexity, strategy and growth
More efficient pricing and capital allocation decisions
Enhanced governance and controls |
 Focus: Deposits
19
Loan to Deposit Ratio %
Rationale
Ample opportunity to capture greater wallet share and profitability from existing
customers while improving liquidity and interest risk profile
Strategic
Initiatives
Enhanced profitability models to inform pricing and investment decisions
Focus on deposit-rich markets with ample small business opportunities
Investing in people and technology to streamline loan approval and closing and
deposit account opening process
Sales training and development, emphasizing cross-sell
Increasing marketing spend
Trade-Off
Desire to lower loan to deposit ratio is a constraint on loan growth and earnings
in the short-term. Long-term benefits will be realized when
interest rates rise Source: SNL Financial.
Please
refer
to
the
“Quarterly
Financial
Supplement”
slides
at
the
conclusion
of
this
presentation
for
the
listing
of
the
peer
companies. |
 Strong Deposit Growth
20
Organic Non-CD
Deposit CAGR:
7.3%
Strong Deposit Growth Momentum
Positive
results
in
mobile
deposit
services
and
Stellar
Checking
account
Non-CD deposits now account for 70% of total deposits
Non-CD growth of 2.0% since 1Q13, including strategic exit from certain
relationships Cost of deposits decreased from 2.86% in 4Q07 to 0.43% in
1Q14 Total Deposits 12/31/2007
$8.9 Billion
Total Deposits 3/31/2014
$13.1 Billion
Time < $100K
Time of $100K or more
Savings
Interest-bearing demand
Demand deposits |
 Deposit Initiatives
21
Innovative Deposit Strategies Driving Growth
Strategic
Building
on
2.3%
deposit
growth
in
2013
to
achieve
balance
sheet
objectives
Exiting non-strategic relationships and limiting exception pricing
Lowered deposit cost by 9 bps in 2013
Streamlined
Focused on cross-sell opportunities and commercial deposits
Three retail checking accounts today vs. 10+ at the start of 2013
Customer-Centric
Stellar Checking launched in 2013
–
70,610 accounts in first 13 months with $166M in
balances and $600,000 in total rewards paid out
–
30% from new customers, with higher average
balances than converted accounts
–
Driving new fee income through increased debit
card usage
Digital channel in 1Q14 vs. 1Q13
–
Mobile banking users up 72%
–
E-statements up 29%
–
Total online banking users up 14% |
 Disciplined Asset Allocation:
Focus on Commercial Loans
22
Organic Loan
CAGR: 3.8%
Slowing Loan Growth Momentum, Focus on Mix
Rotating assets to achieve more valuable mix
Commercial loan growth of 4.3% since 1Q13, including strategic exit from certain
relationships Limit indirect portfolio growth while selling more
residential production in secondary market Average commercial loan yield in
1Q14 was 4.78%, compared to 3.38% for indirect auto leases 12/31/2007
$8.8 Billion
3/31/2013
$13.6 Billion
Commercial, financial and agricultural
Leases
Consumer
Real estate secured -
residential
Real estate secured -
commercial
Real estate -
construction |
 Net
Interest Margin 23
Net interest margin of 3.61% in the quarter versus 3.60% in the prior quarter
Net interest margin, excluding purchase accounting, was down 5 bps, but remains
in-line with peer reported net interest margin
The net interest margin decline is a primarily a function of existing loans
repricing at lower rates and a change in the mix of loans
Deposit growth and strategic shift toward commercial lending expected to provide
more stability to the net interest margin going forward
Source:
SNL
Financial.
Please
refer
to
the
“Quarterly
Financial
Supplement”
slides
at
the
conclusion
of
this
presentation
for
the
listing
of
the
peer
companies.
1
Non-GAAP
based
financial
measure;
please
refer
to
the
“Quarterly
Financial
Supplement”
slides
at
the
conclusion
of
this
presentation
for
calculation.
Net Interest Margin
1 |
 Focus on cross-sell as commercial loan and deposit relationships grow
–
Closing the gap to peers on fee income/operating revenue
Diversifying revenue and becoming less reliant on spread revenue
–
Momentum in wealth management, capital markets and cash management
–
Increased 2.7% year-over-year
Capital markets growing
–
Increased 37.5% year-over-year
–
$52 million in new demand deposits and revenue up 7.4% year-over-year
Non-Interest Income
24
Non-interest Income ($000) -
Quarter Ending
Mar. 31, 2013
Dec. 31, 2013
Mar. 31, 2014
Service Charges on Deposit Accounts
8,672
9,456
9,000
Vehicle Origination and Servicing Fees
3,354
3,057
2,968
Wealth Management Commissions and Fees
12,390
13,048
12,719
Commissions on Property and Casualty
Insurance Sales
4,542
4,023
5,666
Other Commissions and Fees
4,328
5,077
5,035
Mortgage Banking Revenue
4,110
2,483
2,410
Fee
Income
%
of
Operating
Revenue
1
1
As
reported
by
SNL
Financial.
Excludes
securities
gains
and
losses
and
other
non-recurring
items.
Please
refer
to
the
“Quarterly
Financial
Supplement”
slides
at
the
conclusion
of
this
presentation
for
the
listing
of
the
peer
companies.
Wealth management continues to expand
Cash management driving deposit growth and income |
 Expense Management
25
Successfully lowered efficiency ratio from 66.83% for 2011 to 62.55% for 2013
–
Recent elevation in efficiency ratio reflects expenses associated with incentive
compensation, branch consolidation costs and investments to build out ERM,
compliance and other strategic initiatives –
Targeted long-term efficiency ratio of 60%
–
Efficiency is a part of our culture; always looking for ways to improve expense
management Note:
Efficiency
ratio
excludes
net
realized
gain
on
acquisition,
merger
related
expenses
and
loss
on
extinguishment
of
debt
and
is
a
non-GAAP
based
financial
measure;
please
refer
to
the
“Quarterly
Financial
Supplement”
slides
at
the
conclusion
of
this
presentation
for
calculations. |
 2Q14
Outlook & Current Trends 26
Strategic Priorities Reflected in Second Quarter 2014 Outlook
Net Interest Margin
May decline slightly in second quarter due to competitive pressure on existing
loan portfolio Range of 3.36% -
3.40%
Average Earning
Assets
Limited average earning asset growth
Commercial loan growth is priority
Focus on rotating the balance sheet mix rather than on total loan growth
Securities portfolio expected to remain relatively flat
Credit
Provision is expected to trend in line with the last four quarters
Expenses
Expenses expected to increase linked quarter as normal inflation
factors are fully realized
Measured investments in the franchise continue
Fee Income
Expected to increase linked quarter as capital markets rebounds and we get a lift
from the mortgage business as we enter the spring selling season
|
 Valuation and Long Term Upside
27 |
 Price / Tangible Book Value
Price / Forward Earnings (2014)
2
Dividend
Yield
1
Price / Book Value
Valuation
28
Execution of strategy could result in P/E expansion due to higher earnings growth
and lower cost of equity –
Close the P/E discount to peers
Attractive dividend yield provides meaningful return in the near-term
Source:
SNL
Financial.
As
of
April
30,
2014.
Please
refer
to
the
“Quarterly
Financial
Supplement”
slides
at
the
conclusion
of
this
presentation
for
the
listing
of
the
peer
companies.
1
Based
on
current
annualized
dividend
of
$0.32
per
share
and
closing
price
on
April
30,
2014.
2
Reflects
mean
IBES
estimate
for
2014. |
 At
March 31, 2014 Tangible
Common
Equity¹
Tier 1
Common /
RWA
Tier 1
Leverage
Tier 1
Risk-Based
Total
Risk-Based
Susquehanna
8.67%
10.84%
9.72%
11.95%
13.23%
Management Minimum
Target
7.50%
8.00%
6.00%
9.50%
11.50%
Solid Capital Generation
29
1
The
tangible
common
equity
ratio
is
a
non-GAAP
based
financial
measure;
please
refer
to
the
“Quarterly
Financial
Supplement”
slides
at
the
conclusion
of
this
presentation
for
calculation.
Do not expect Basel III to have a material impact to our risk-weighted
assets –
We believe we would be fully compliant with revised capital requirements, including
the capital conservation buffer Capital generation has benefited from strong
profitability and approximately 40% dividend payout ratio Status quo until we
receive feedback from regulators on stress test –
If deemed to have capital beyond what is required by regulators and internal
capital targets, Susquehanna may look to distribute a portion of its excess
capital –
All capital distribution strategies will be evaluated
|
 Quarterly Financial Supplement
30 |
 Susquehanna Bank Markets
Pennsylvania Market
Maryland Market
Delaware Valley Market
Adams, PA
Berks, PA
Centre, PA
Cumberland, PA
Dauphin, PA
Lancaster, PA
Lebanon, PA
Lehigh, PA
Luzerne, PA
Lycoming, PA
Northampton, PA
Northumberland, PA
Schuylkill, PA
Snyder, PA
Union, PA
York, PA
Allegany, MD
Anne Arundel, MD
Baltimore, MD
Baltimore City, MD
Bedford, PA
Berkley, WV
Carroll, MD
Franklin, PA
Fulton, PA
Garrett, MD
Harford, MD
Howard, MD
Washington, MD
Worcester, MD
Atlantic, NJ
Bucks, PA
Burlington, NJ
Camden, NJ
Chester, PA
Cumberland, NJ
Delaware, PA
Gloucester, NJ
Montgomery, PA
Philadelphia, PA
31 |
 Peer
Companies Associated Banc-Corp
Hancock Holding Co.
BancorpSouth Inc.
IBERIABANK Corp.
City National Corp.
People's United Financial
Commerce Bancshares
Prosperity Bancshares Inc.
Cullen/Frost Bankers Inc.
Signature Bank
F.N.B. Corp.
TCF Financial Corp.
First Horizon Nat’l Corp.
UMB Financial Corp.
First Niagara Financial Group
Valley National Bancorp
FirstMerit Corp.
Webster Financial Corp.
Fulton Financial Corp.
Wintrust Financial Corp.
32 |
 Loan
and Lease Originations Average Balance*
1Q13
2Q13
3Q13
4Q13
1Q14
($ in Millions)
Balance
Origina-
tions
Balance
Origina-
tions
Balance
Origina-
tions
Balance
Origina-
tions
Balance
Origina-
tions
Commercial
$ 1,996
$ 224
$ 2,005
$ 221
$ 1,997
$ 166
$ 1,997
$ 189
$ 2,045
$ 112
Real Estate –
Const & Land
797
137
777
148
752
196
736
184
707
76
Real Estate –
1-4 Family Res
2,266
57
2,262
67
2,258
90
2,276
66
2,279
56
Real Estate –
Commercial
4,295
206
4,356
263
4,440
267
4,406
180
4,413
131
Real Estate –
HELOC
1,235
113
1,285
154
1,358
160
1,450
130
1,478
93
Tax-Free
427
3
420
2
402
42
418
34
438
6
Consumer Loans
820
114
853
149
887
128
908
125
912
110
Commercial Leases
287
78
300
124
319
101
320
89
310
89
Consumer Leases
644
138
698
87
756
122
837
142
922
112
VIE
162
-
156
-
122
-
74
-
71
-
Total Loans
$ 12,929
$ 1,070
$ 13,112
$ 1,215
$ 13,291
$ 1,272
$13,422
$ 1,137
$13,575
$785
33
*By collateral type. |
 Loan
Mix & Yield 34
*By collateral type.
Average Balance*
($ in Millions)
1Q13
2Q13
3Q13
4Q13
1Q14
INT % QTR
Commercial
$ 1,996
5.28%
$ 2,005
5.03%
$ 1,997
5.00%
$ 1,997
4.81%
$ 2,045
4.78%
Real Estate –
Const & Land
797
6.05%
777
6.69%
752
5.21%
736
5.37%
707
5.35%
Real Estate –
1-4 Family Res
2,266
4.91%
2,262
4.82%
2,258
4.60%
2,276
4.69%
2,279
4.63%
Real Estate –
Commercial
4,295
5.43%
4,356
5.22%
4,440
4.99%
4,406
4.65%
4,413
4.68%
Real Estate –
HELOC
1,235
3.68%
1,285
3.64%
1,358
3.59%
1,450
3.53%
1,478
3.51%
Tax-Free
427
5.10%
420
5.09%
402
5.07%
418
5.02%
438
4.92%
Consumer Loans
820
4.77%
853
4.52%
887
4.33%
908
4.25%
912
4.20%
Commercial Leases
287
7.56%
300
7.15%
319
6.64%
320
6.46%
310
6.67%
Consumer Leases
644
3.88%
698
3.68%
756
3.51%
837
3.39%
922
3.38%
VIE
162
4.36%
156
4.34%
122
4.92%
74
4.88%
71
4.83%
Total Loans
$ 12,929
5.03%
$ 13,112
4.95%
$ 13,291
4.70%
$ 13,422
4.55%
$ 13,575
4.51% |
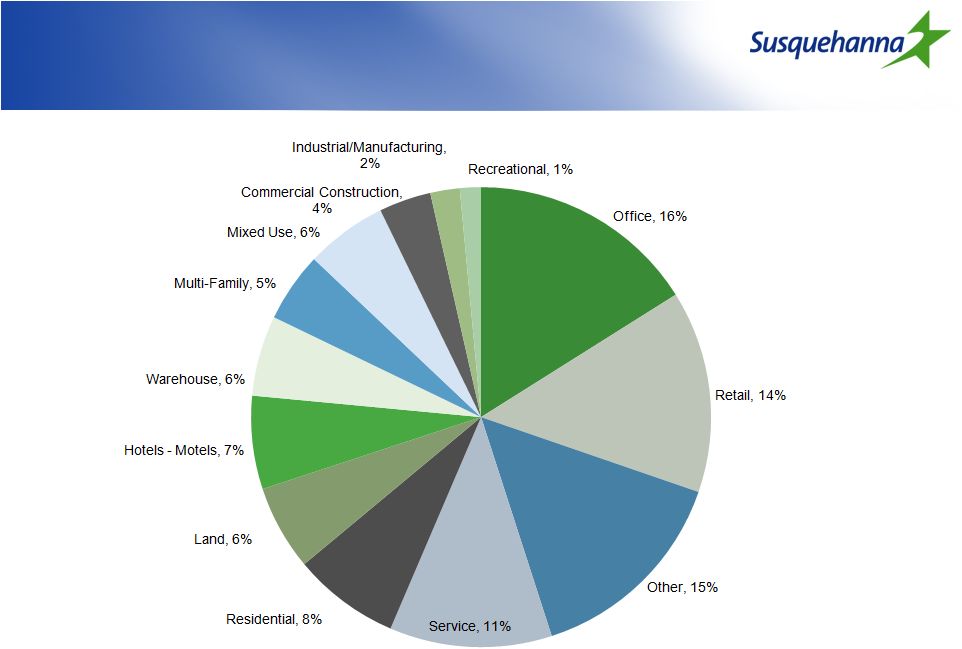 CRE
and Construction Composition 35
1Q14 |
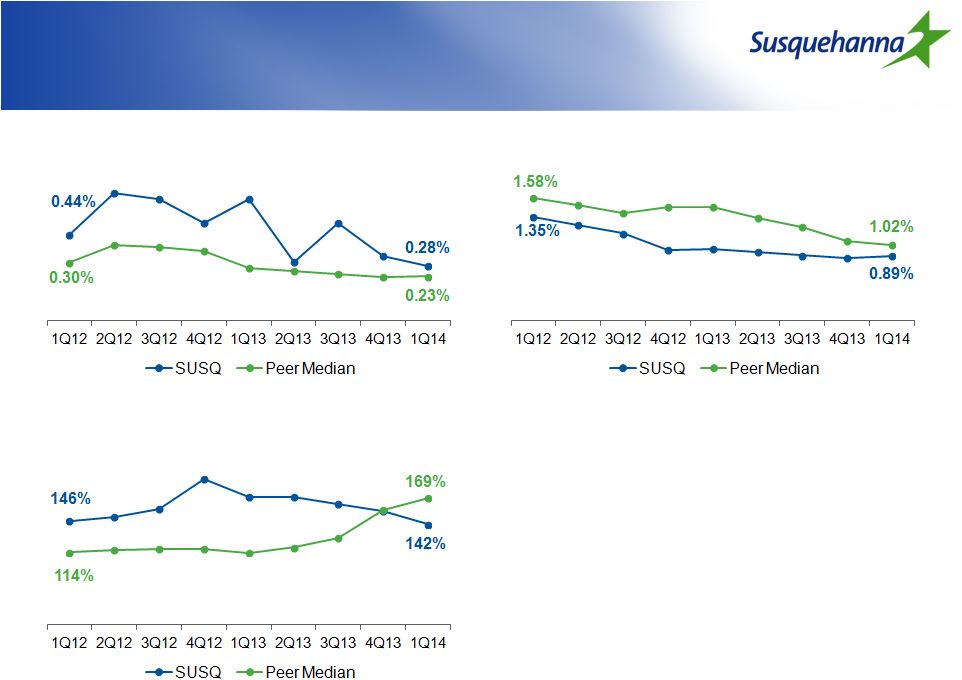 Asset
Quality 36
NPAs / Loans & leases +
Foreclosed Real Estate
Net Charge-Offs /
Average Loans & Leases
ALLL / Nonaccrual Loans and Leases
Source: SNL Financial |
 TDRs
Asset Quality
($ in Millions)
37
Non Accruals
1Q13
2Q13
3Q13
4Q13
1Q14
NPL's Beginning of Period
$ 97.8
$ 103.4
$ 105.1
$ 102.0
$ 100.8
New Non Accruals
23.1
23.6
23.1
29.4
25.4
Cure/Exits/Other
0.4
(13.4)
(12.6)
(21.7)
(8.3)
Gross Charge-Offs
(15.5)
(5.0)
(8.9)
(5.3)
(7.0)
Transfer to OREO
(2.4)
(3.5)
(4.7)
(3.6)
(2.5)
NPL's End of Period
$ 103.4
$ 105.1
$ 102.0
$ 100.8
$ 108.4 |
 Asset
Quality ($ in Millions)
38
Substandard
OAEM
Past Due 90 Days or More
Past Due 30-89 Days |
 Investment Securities
39
EOP Balance
1Q13
2Q13
3Q13
4Q13
1Q14
($ in Millions)
QTR Yield
Total Investment Securities
$2,553
$2,494
$2,644
$2,533
$2,445
Duration (years)
3.6
4.3
4.1
3.5
3.4
Yield
2.64%
2.61%
2.67%
2.65%
2.72%
Unrealized Gain/(Loss)
$50.6
($2.7)
$1.3
($12.0)
$4.1 |
 Deposit Mix & Cost
40
Average Balance
1Q13
2Q13
3Q13
4Q13
1Q14
($ in Millions)
INT % QTR
Demand
$ 1,918
0.00%
$ 1,912
0.00%
$ 1,911
0.00%
$ 1,881
0.00%
$ 1,831
0.00%
Interest Bearing Demand
5,895
0.32%
5,984
0.28%
5,937
0.26%
6,058
0.26%
6,033
0.25%
Savings
1,049
0.11%
1,080
0.11%
1,076
0.11%
1,076
0.11%
1,100
0.11%
Certificates of Deposits
3,778
1.21%
3,892
1.20%
3,871
1.05%
3,792
1.00%
3,911
1.00%
Total Interest-Bearing Deposits
$ 10,722
0.61%
$ 10,956
0.59%
$ 10,884
0.53%
$ 10,926
0.50%
$ 11,044
0.50%
Non-CD Deposits/Total
70.1%
69.8%
69.7%
70.4%
69.6%
Loans(excluding VIE)/Deposits
101.0%
100.7%
102.9%
104.2%
104.9% |
 Borrowing Mix & Cost
41
Average Balance
1Q13
2Q13
3Q13
4Q13
1Q14
($ in Millions)
INT % QTR
Short-Term Borrowings
$ 817
0.25%
$ 728
0.26%
$ 758
0.27%
$ 672
0.25%
$ 672
0.25%
FHLB Advances
1,155
0.33%
1,042
0.36%
1,285
0.33%
1,502
0.32%
1,387
0.35%
Long Term Debt
509
3.28%
496
3.32%
476
3.45%
456
3.51%
451
3.46%
Total Borrowings
$ 2,481
0.91%
$ 2,266
0.98%
$ 2,519
0.90%
$ 2,630
0.86%
$ 2,510
0.88%
Off Balance Sheet Swap Impact
927
0.73%
927
0.82%
927
0.78%
1,100
0.80%
1,100
0.87%
Total Borrowing Cost
1.64%
1.80%
1.68%
1.66%
1.75%
Total Borrowings / Total Assets
13.8%
12.5%
13.8%
14.3%
13.6% |
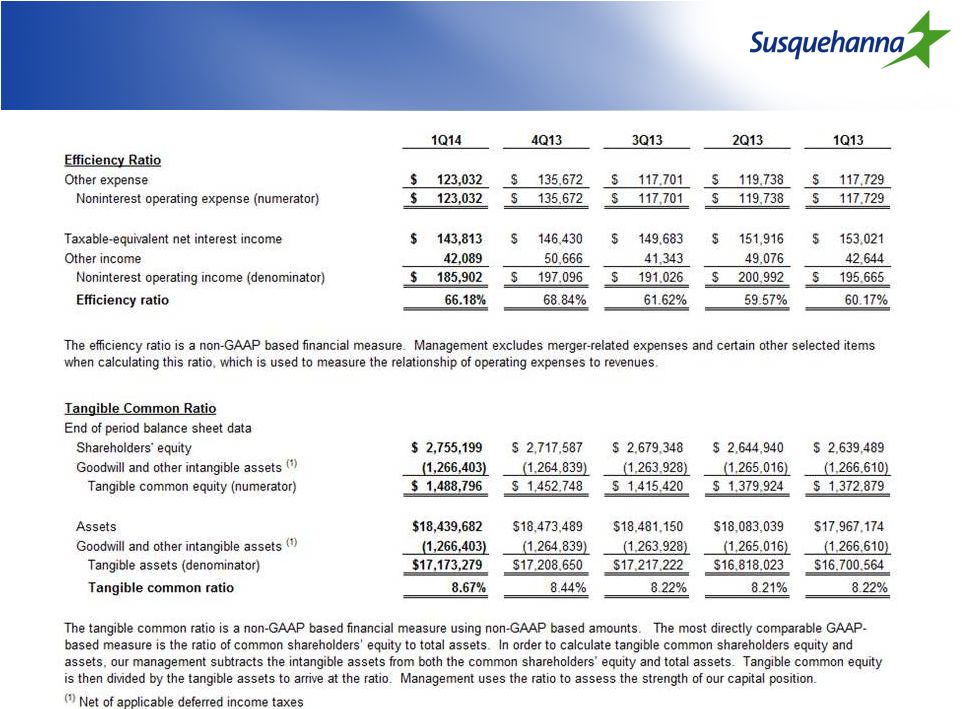 Non-GAAP Reconciliation
($ in thousands)
42 |
 Non-GAAP Reconciliation
($ in thousands)
43 |
 Non-GAAP Reconciliation
44 |