Attached files
| file | filename |
|---|---|
| 8-K - 8-K - PREFERRED APARTMENT COMMUNITIES INC | a8-k_xx1q14xearningsxrelea.htm |
| EX-99.1 - EARNINGS RELEASE - PREFERRED APARTMENT COMMUNITIES INC | a1q2014_earningsxpressxrel.htm |

First Quarter 2014 Supplemental Financial Data Table of Contents Company Profile 3 Highlights of the First Quarter 2014 and Subsequent Events 4 Normalized Funds From Operations and Adjusted Funds From Operations Guidance 5 Consolidated Statements of Operations 6 Reconciliation of Funds From Operations Attributable to Common Stockholders and Unitholders, Normalized Funds From Operations Attributable to Common Stockholders and Unitholders, and Adjusted Funds From Operations Attributable to Common Stockholders and Unitholders to Net Income (Loss) Attributable to Common Stockholders 7 Notes to Consolidated Statements of Operations and Reconciliation of Funds From Operations Attributable to Common Stockholders and Unitholders, Normalized Funds From Operations Attributable to Common Stockholders and Unitholders, and Adjusted Funds From Operations Attributable to Common Stockholders and Unitholders to Net Income (Loss) Attributable to Common Stockholders 8 Consolidated Balance Sheets 9 Consolidated Statements of Cash Flows 10 Real Estate Loan Portfolio, Capital Expenditures 11 Physical and Average Economic Occupancy and Same Store Financial Data 12 Definitions of Non-GAAP Measures 12

First Quarter 2014 Supplemental Financial Data Page 3 Preferred Apartment Communities, Inc. Preferred Apartment Communities, Inc. (NYSE MKT: APTS), or the Company, is a Maryland corporation formed primarily to acquire and operate multifamily properties in select targeted markets throughout the United States. As part of our business strategy, we may enter into forward purchase contracts or purchase options for to-be-built multifamily communities and we may make mezzanine loans, provide deposit arrangements, or provide performance assurances, as may be necessary or appropriate, in connection with the construction of multifamily communities and other properties. As a secondary strategy, we also may acquire or originate senior mortgage loans, subordinate loans or mezzanine debt secured by interests in multifamily properties, membership or partnership interests in multifamily properties and other multifamily related assets and invest not more than 10% of our total assets in other real estate related investments, as determined by Preferred Apartment Advisors, LLC, or our Manager, as appropriate for us. We elected to be taxed as a REIT for U.S. federal income tax purposes, commencing with our tax year ended December 31, 2011. Forward-Looking Statements “Safe Harbor” Statement under the Private Securities Litigation Reform Act of 1995: Estimates of future earnings and performance are, by definition, and certain other statements in this Supplemental Financial Data Report may constitute, “forward-looking statements” within the meaning of the Private Securities Litigation Reform Act of 1995 and involve known and unknown risks, uncertainties and other factors that may cause our actual results, performance, achievements or transactions to be materially different from the results, performance, achievements or transactions expressed or implied by the forward-looking statements. Factors that impact such forward-looking statements include, among others, our business and investment strategy; legislative or regulatory actions; the state of the U.S. economy generally or in specific geographic areas; economic trends and economic recoveries; our ability to obtain and maintain debt or equity financing; financing and advance rates for our target assets; our leverage level; changes in the values of our assets; availability of attractive investment opportunities in our target markets; our ability to maintain our qualification as a real estate investment trust, or REIT, for U.S. federal income tax purposes; our ability to maintain our exemption from registration under the Investment Company Act of 1940, as amended; availability of quality personnel; our understanding of our competition; and market trends in our industry, interest rates, real estate values, the debt securities markets and the general economy. Except as otherwise required by the federal securities laws, we assume no liability to update the information in this Supplemental Financial Data Report. We refer you to the sections entitled “Risk Factors” and “Management’s Discussion and Analysis of Financial Condition and Results of Operations” in our Annual Report on Form 10-K for the twelve months ended December 31, 2013 that was filed with the Securities and Exchange Commission, or SEC, on March 17, 2014, which discusses various factors that could adversely affect our financial results. Such risk factors and information may have been updated or supplemented by our Form 10-Q and Form 8-K filings and other documents filed from time to time with the SEC.
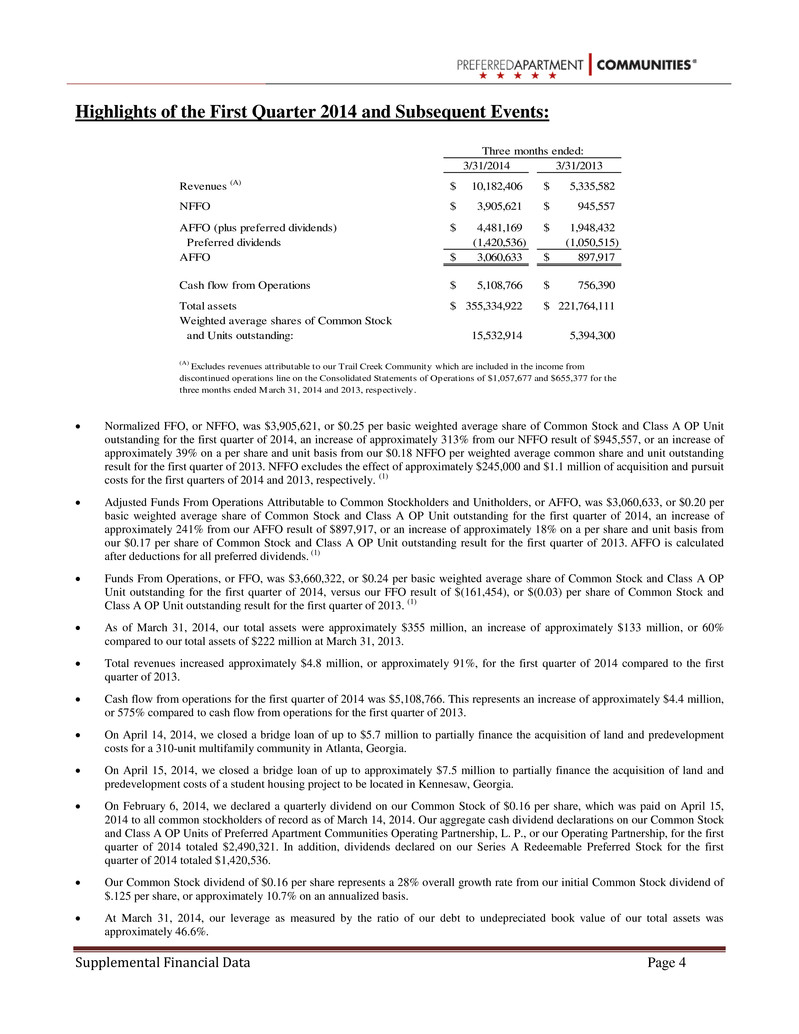
First Quarter 2014 Supplemental Financial Data Page 4 Highlights of the First Quarter 2014 and Subsequent Events: 3/31/2014 3/31/2013 Revenues (A) 10,182,406$ 5,335,582$ NFFO 3,905,621$ 945,557$ AFFO (plus preferred dividends) 4,481,169$ 1,948,432$ Preferred dividends (1,420,536) (1,050,515) AFFO 3,060,633$ 897,917$ Cash flow from Operations 5,108,766$ 756,390$ Total assets 355,334,922$ 221,764,111$ Weighted average shares of Common Stock and Units outstanding: 15,532,914 5,394,300 Three months ended: (A) Excludes revenues attributable to our Trail Creek Community which are included in the income from discontinued operations line on the Consolidated Statements of Operations of $1,057,677 and $655,377 for the three months ended March 31, 2014 and 2013, respectively. • Normalized FFO, or NFFO, was $3,905,621, or $0.25 per basic weighted average share of Common Stock and Class A OP Unit outstanding for the first quarter of 2014, an increase of approximately 313% from our NFFO result of $945,557, or an increase of approximately 39% on a per share and unit basis from our $0.18 NFFO per weighted average common share and unit outstanding result for the first quarter of 2013. NFFO excludes the effect of approximately $245,000 and $1.1 million of acquisition and pursuit costs for the first quarters of 2014 and 2013, respectively. (1) • Adjusted Funds From Operations Attributable to Common Stockholders and Unitholders, or AFFO, was $3,060,633, or $0.20 per basic weighted average share of Common Stock and Class A OP Unit outstanding for the first quarter of 2014, an increase of approximately 241% from our AFFO result of $897,917, or an increase of approximately 18% on a per share and unit basis from our $0.17 per share of Common Stock and Class A OP Unit outstanding result for the first quarter of 2013. AFFO is calculated after deductions for all preferred dividends. (1) • Funds From Operations, or FFO, was $3,660,322, or $0.24 per basic weighted average share of Common Stock and Class A OP Unit outstanding for the first quarter of 2014, versus our FFO result of $(161,454), or $(0.03) per share of Common Stock and Class A OP Unit outstanding result for the first quarter of 2013. (1) • As of March 31, 2014, our total assets were approximately $355 million, an increase of approximately $133 million, or 60% compared to our total assets of $222 million at March 31, 2013. • Total revenues increased approximately $4.8 million, or approximately 91%, for the first quarter of 2014 compared to the first quarter of 2013. • Cash flow from operations for the first quarter of 2014 was $5,108,766. This represents an increase of approximately $4.4 million, or 575% compared to cash flow from operations for the first quarter of 2013. • On April 14, 2014, we closed a bridge loan of up to $5.7 million to partially finance the acquisition of land and predevelopment costs for a 310-unit multifamily community in Atlanta, Georgia. • On April 15, 2014, we closed a bridge loan of up to approximately $7.5 million to partially finance the acquisition of land and predevelopment costs of a student housing project to be located in Kennesaw, Georgia. • On February 6, 2014, we declared a quarterly dividend on our Common Stock of $0.16 per share, which was paid on April 15, 2014 to all common stockholders of record as of March 14, 2014. Our aggregate cash dividend declarations on our Common Stock and Class A OP Units of Preferred Apartment Communities Operating Partnership, L. P., or our Operating Partnership, for the first quarter of 2014 totaled $2,490,321. In addition, dividends declared on our Series A Redeemable Preferred Stock for the first quarter of 2014 totaled $1,420,536. • Our Common Stock dividend of $0.16 per share represents a 28% overall growth rate from our initial Common Stock dividend of $.125 per share, or approximately 10.7% on an annualized basis. • At March 31, 2014, our leverage as measured by the ratio of our debt to undepreciated book value of our total assets was approximately 46.6%.
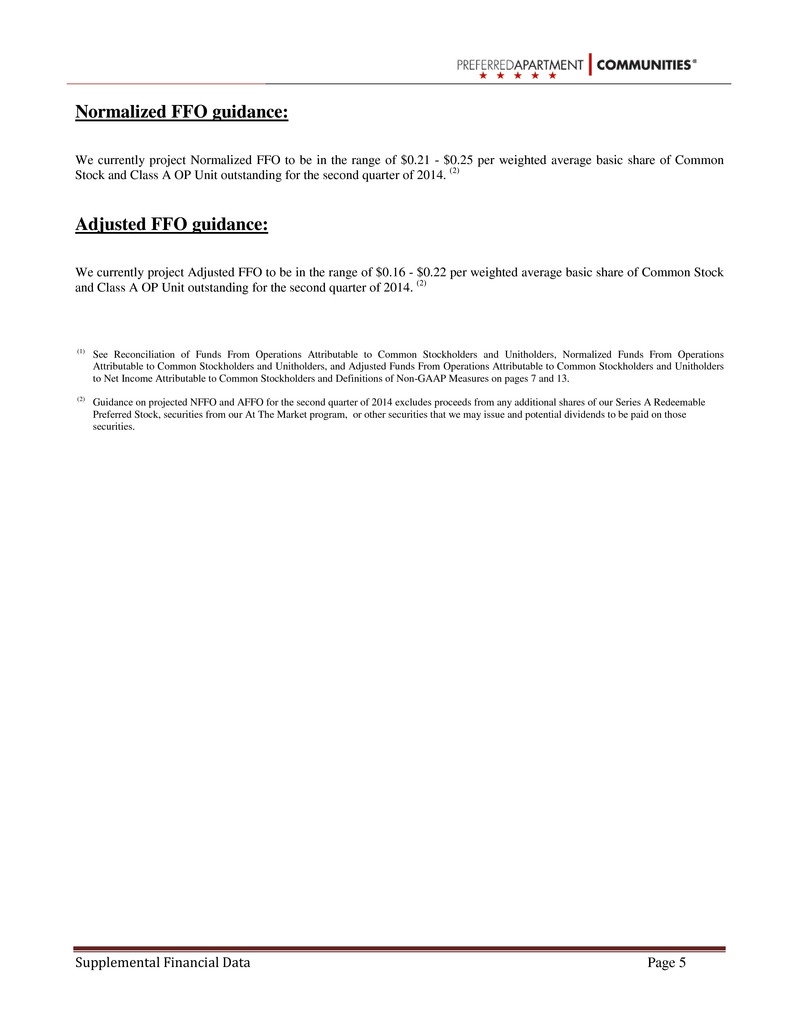
First Quarter 2014 Supplemental Financial Data Page 5 Normalized FFO guidance: We currently project Normalized FFO to be in the range of $0.21 - $0.25 per weighted average basic share of Common Stock and Class A OP Unit outstanding for the second quarter of 2014. (2) Adjusted FFO guidance: We currently project Adjusted FFO to be in the range of $0.16 - $0.22 per weighted average basic share of Common Stock and Class A OP Unit outstanding for the second quarter of 2014. (2) (1) See Reconciliation of Funds From Operations Attributable to Common Stockholders and Unitholders, Normalized Funds From Operations Attributable to Common Stockholders and Unitholders, and Adjusted Funds From Operations Attributable to Common Stockholders and Unitholders to Net Income Attributable to Common Stockholders and Definitions of Non-GAAP Measures on pages 7 and 13. (2) Guidance on projected NFFO and AFFO for the second quarter of 2014 excludes proceeds from any additional shares of our Series A Redeemable Preferred Stock, securities from our At The Market program, or other securities that we may issue and potential dividends to be paid on those securities.
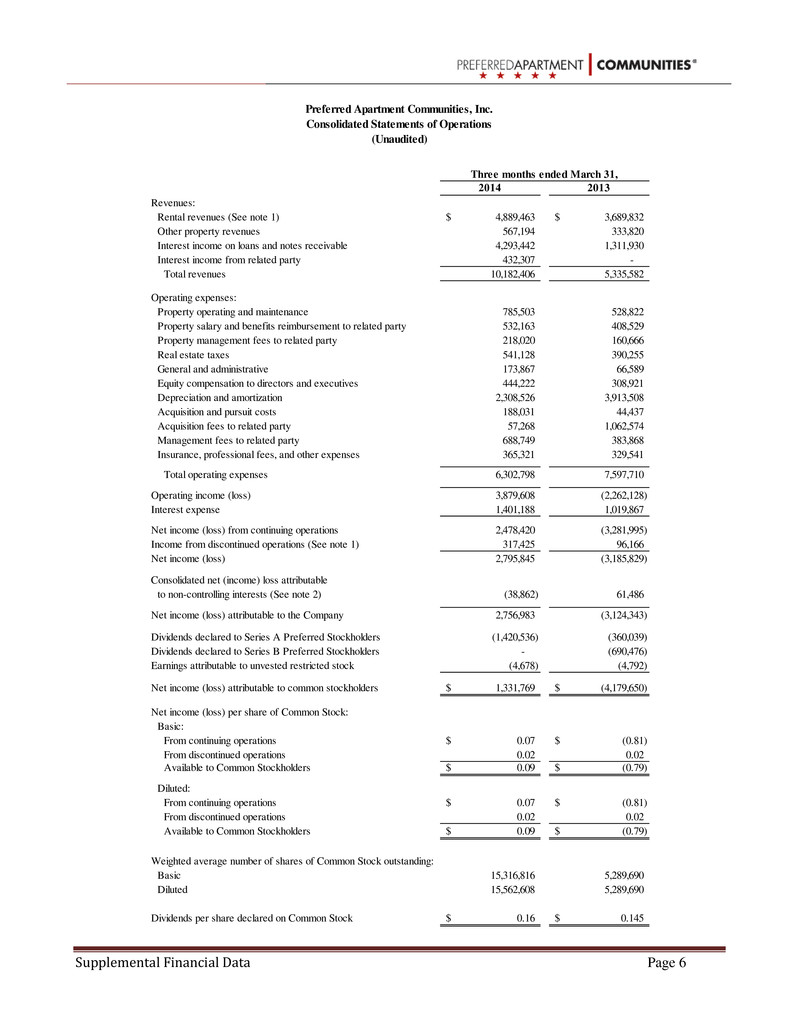
First Quarter 2014 Supplemental Financial Data Page 6 2014 2013 Revenues: Rental revenues (See note 1) 4,889,463$ 3,689,832$ Other property revenues 567,194 333,820 Interest income on loans and notes receivable 4,293,442 1,311,930 Interest income from related party 432,307 - Total revenues 10,182,406 5,335,582 Operating expenses: Property operating and maintenance 785,503 528,822 Property salary and benefits reimbursement to related party 532,163 408,529 Property management fees to related party 218,020 160,666 Real estate taxes 541,128 390,255 General and administrative 173,867 66,589 444,222 308,921 Depreciation and amortization 2,308,526 3,913,508 Acquisition and pursuit costs 188,031 44,437 Acquisition fees to related party 57,268 1,062,574 Management fees to related party 688,749 383,868 Insurance, professional fees, and other expenses 365,321 329,541 Total operating expenses 6,302,798 7,597,710 Operating income (loss) 3,879,608 (2,262,128) Interest expense 1,401,188 1,019,867 Net income (loss) from continuing operations 2,478,420 (3,281,995) Income from discontinued operations (See note 1) 317,425 96,166 Net income (loss) 2,795,845 (3,185,829) Consolidated net (income) loss attributable to non-controlling interests (See note 2) (38,862) 61,486 Net income (loss) attributable to the Company 2,756,983 (3,124,343) Dividends declared to Series A Preferred Stockholders (1,420,536) (360,039) Dividends declared to Series B Preferred Stockholders - (690,476) Earnings attributable to unvested restricted stock (4,678) (4,792) Net income (loss) attributable to common stockholders 1,331,769$ (4,179,650)$ Net income (loss) per share of Common Stock: Basic: From continuing operations 0.07$ (0.81)$ From discontinued operations 0.02 0.02 Available to Common Stockholders 0.09$ (0.79)$ Diluted: From continuing operations 0.07$ (0.81)$ From discontinued operations 0.02 0.02 Available to Common Stockholders 0.09$ (0.79)$ Weighted average number of shares of Common Stock outstanding: Basic 15,316,816 5,289,690 Diluted 15,562,608 5,289,690 Dividends per share declared on Common Stock 0.16$ 0.145$ Equity compensation to directors and executives (Unaudited) Three months ended March 31, Preferred Apartment Communities, Inc. Consolidated Statements of Operations
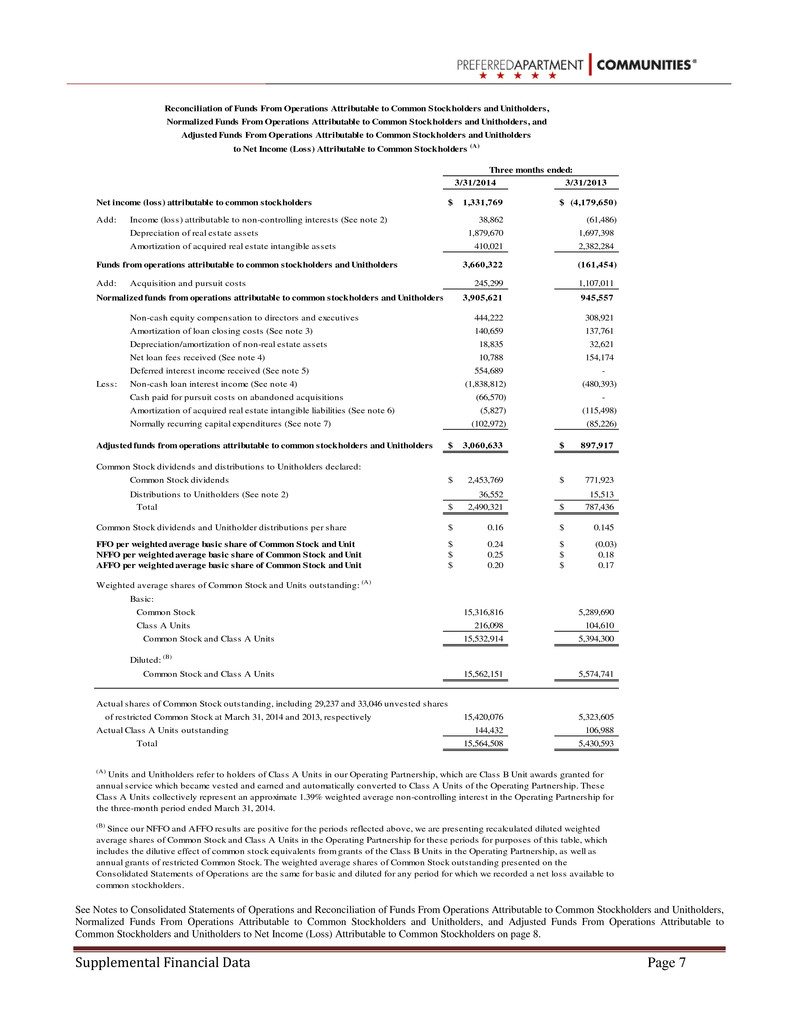
First Quarter 2014 Supplemental Financial Data Page 7 3/31/2014 3/31/2013 Net income (loss) attributable to common stockholders 1,331,769$ (4,179,650)$ Add: Income (loss) attributable to non-controlling interests (See note 2) 38,862 (61,486) Depreciation of real estate assets 1,879,670 1,697,398 Amortization of acquired real estate intangible assets 410,021 2,382,284 Funds from operations attributable to common stockholders and Unitholders 3,660,322 (161,454) Add: Acquisition and pursuit costs 245,299 1,107,011 Normalized funds from operations attributable to common stockholders and Unitholders 3,905,621 945,557 Non-cash equity compensation to directors and executives 444,222 308,921 Amortization of loan closing costs (See note 3) 140,659 137,761 Depreciation/amortization of non-real estate assets 18,835 32,621 Net loan fees received (See note 4) 10,788 154,174 Deferred interest income received (See note 5) 554,689 - Less: Non-cash loan interest income (See note 4) (1,838,812) (480,393) Cash paid for pursuit costs on abandoned acquisitions (66,570) - Amortization of acquired real estate intangible liabilities (See note 6) (5,827) (115,498) Normally recurring capital expenditures (See note 7) (102,972) (85,226) Adjusted funds from operations attributable to common stockholders and Unitholders 3,060,633$ 897,917$ Common Stock dividends and distributions to Unitholders declared: Common Stock dividends 2,453,769$ 771,923$ Distributions to Unitholders (See note 2) 36,552 15,513 Total 2,490,321$ 787,436$ Common Stock dividends and Unitholder distributions per share 0.16$ 0.145$ FFO per weighted average basic share of Common Stock and Unit 0.24$ (0.03)$ NFFO per weighted average basic share of Common Stock and Unit 0.25$ 0.18$ AFFO per weighted average basic share of Common Stock and Unit 0.20$ 0.17$ Weighted average shares of Common Stock and Units outstanding: (A) Basic: Common Stock 15,316,816 5,289,690 Class A Units 216,098 104,610 Common Stock and Class A Units 15,532,914 5,394,300 Diluted: (B) Common Stock and Class A Units 15,562,151 5,574,741 Actual shares of Common Stock outstanding, including 29,237 and 33,046 unvested shares of restricted Common Stock at March 31, 2014 and 2013, respectively 15,420,076 5,323,605 Actual Class A Units outstanding 144,432 106,988 Total 15,564,508 5,430,593 Reconciliation of Funds From Operations Attributable to Common Stockholders and Unitholders, Adjusted Funds From Operations Attributable to Common Stockholders and Unitholders to Net Income (Loss) Attributable to Common Stockholders (A) Three months ended: Normalized Funds From Operations Attributable to Common Stockholders and Unitholders, and (A) Units and Unitholders refer to holders of Class A Units in our Operating Partnership, which are Class B Unit awards granted for annual service which became vested and earned and automatically converted to Class A Units of the Operating Partnership. These Class A Units collectively represent an approximate 1.39% weighted average non-controlling interest in the Operating Partnership for the three-month period ended March 31, 2014. (B) Since our NFFO and AFFO results are positive for the periods reflected above, we are presenting recalculated diluted weighted average shares of Common Stock and Class A Units in the Operating Partnership for these periods for purposes of this table, which includes the dilutive effect of common stock equivalents from grants of the Class B Units in the Operating Partnership, as well as annual grants of restricted Common Stock. The weighted average shares of Common Stock outstanding presented on the Consolidated Statements of Operations are the same for basic and diluted for any period for which we recorded a net loss available to common stockholders. See Notes to Consolidated Statements of Operations and Reconciliation of Funds From Operations Attributable to Common Stockholders and Unitholders, Normalized Funds From Operations Attributable to Common Stockholders and Unitholders, and Adjusted Funds From Operations Attributable to Common Stockholders and Unitholders to Net Income (Loss) Attributable to Common Stockholders on page 8.
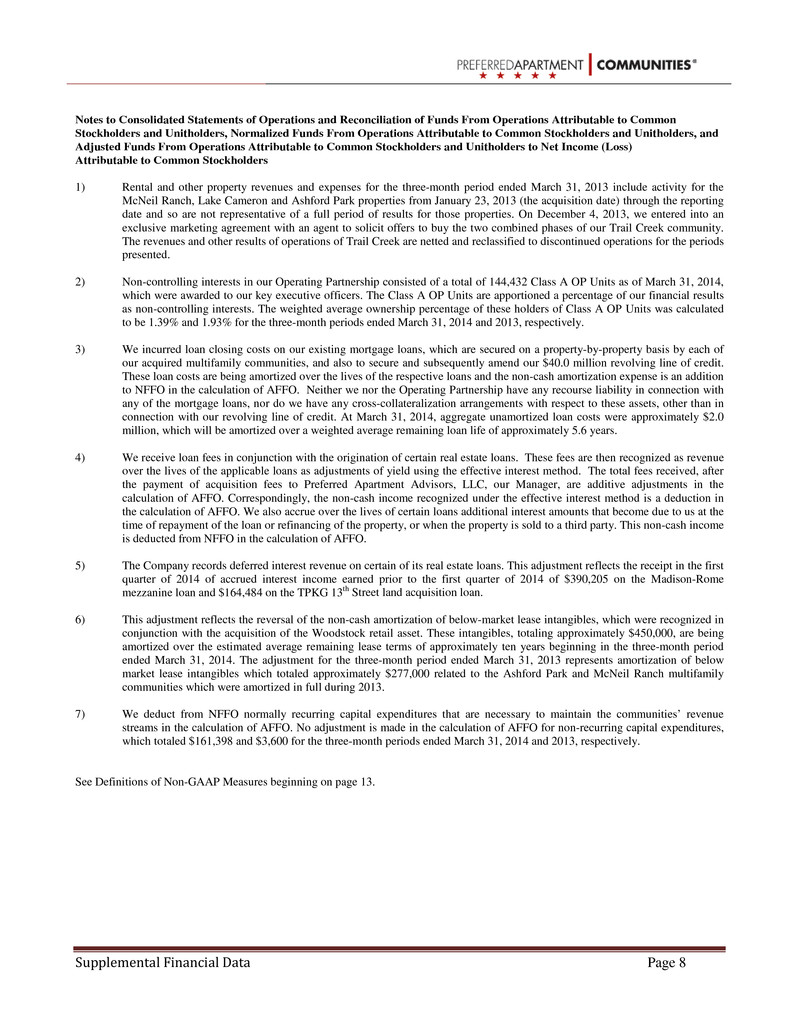
First Quarter 2014 Supplemental Financial Data Page 8 Notes to Consolidated Statements of Operations and Reconciliation of Funds From Operations Attributable to Common Stockholders and Unitholders, Normalized Funds From Operations Attributable to Common Stockholders and Unitholders, and Adjusted Funds From Operations Attributable to Common Stockholders and Unitholders to Net Income (Loss) Attributable to Common Stockholders 1) Rental and other property revenues and expenses for the three-month period ended March 31, 2013 include activity for the McNeil Ranch, Lake Cameron and Ashford Park properties from January 23, 2013 (the acquisition date) through the reporting date and so are not representative of a full period of results for those properties. On December 4, 2013, we entered into an exclusive marketing agreement with an agent to solicit offers to buy the two combined phases of our Trail Creek community. The revenues and other results of operations of Trail Creek are netted and reclassified to discontinued operations for the periods presented. 2) Non-controlling interests in our Operating Partnership consisted of a total of 144,432 Class A OP Units as of March 31, 2014, which were awarded to our key executive officers. The Class A OP Units are apportioned a percentage of our financial results as non-controlling interests. The weighted average ownership percentage of these holders of Class A OP Units was calculated to be 1.39% and 1.93% for the three-month periods ended March 31, 2014 and 2013, respectively. 3) We incurred loan closing costs on our existing mortgage loans, which are secured on a property-by-property basis by each of our acquired multifamily communities, and also to secure and subsequently amend our $40.0 million revolving line of credit. These loan costs are being amortized over the lives of the respective loans and the non-cash amortization expense is an addition to NFFO in the calculation of AFFO. Neither we nor the Operating Partnership have any recourse liability in connection with any of the mortgage loans, nor do we have any cross-collateralization arrangements with respect to these assets, other than in connection with our revolving line of credit. At March 31, 2014, aggregate unamortized loan costs were approximately $2.0 million, which will be amortized over a weighted average remaining loan life of approximately 5.6 years. 4) We receive loan fees in conjunction with the origination of certain real estate loans. These fees are then recognized as revenue over the lives of the applicable loans as adjustments of yield using the effective interest method. The total fees received, after the payment of acquisition fees to Preferred Apartment Advisors, LLC, our Manager, are additive adjustments in the calculation of AFFO. Correspondingly, the non-cash income recognized under the effective interest method is a deduction in the calculation of AFFO. We also accrue over the lives of certain loans additional interest amounts that become due to us at the time of repayment of the loan or refinancing of the property, or when the property is sold to a third party. This non-cash income is deducted from NFFO in the calculation of AFFO. 5) The Company records deferred interest revenue on certain of its real estate loans. This adjustment reflects the receipt in the first quarter of 2014 of accrued interest income earned prior to the first quarter of 2014 of $390,205 on the Madison-Rome mezzanine loan and $164,484 on the TPKG 13th Street land acquisition loan. 6) This adjustment reflects the reversal of the non-cash amortization of below-market lease intangibles, which were recognized in conjunction with the acquisition of the Woodstock retail asset. These intangibles, totaling approximately $450,000, are being amortized over the estimated average remaining lease terms of approximately ten years beginning in the three-month period ended March 31, 2014. The adjustment for the three-month period ended March 31, 2013 represents amortization of below market lease intangibles which totaled approximately $277,000 related to the Ashford Park and McNeil Ranch multifamily communities which were amortized in full during 2013. 7) We deduct from NFFO normally recurring capital expenditures that are necessary to maintain the communities’ revenue streams in the calculation of AFFO. No adjustment is made in the calculation of AFFO for non-recurring capital expenditures, which totaled $161,398 and $3,600 for the three-month periods ended March 31, 2014 and 2013, respectively. See Definitions of Non-GAAP Measures beginning on page 13.
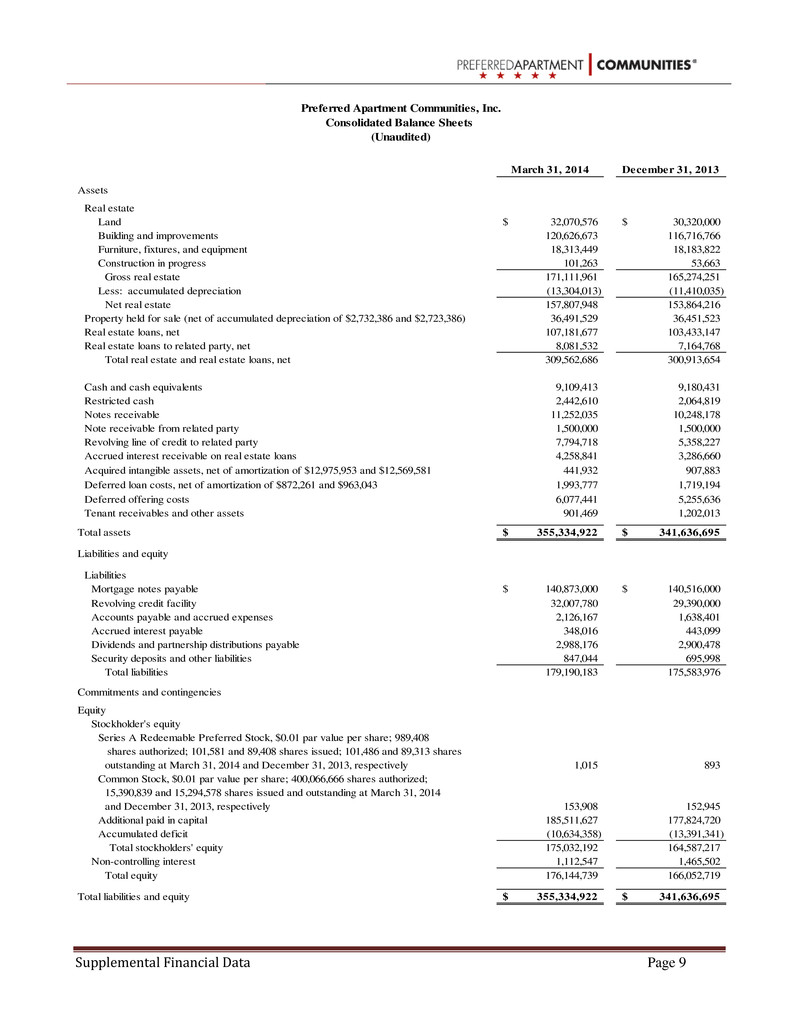
First Quarter 2014 Supplemental Financial Data Page 9 March 31, 2014 December 31, 2013 Assets Real estate Land 32,070,576$ 30,320,000$ Building and improvements 120,626,673 116,716,766 Furniture, fixtures, and equipment 18,313,449 18,183,822 Construction in progress 101,263 53,663 Gross real estate 171,111,961 165,274,251 Less: accumulated depreciation (13,304,013) (11,410,035) Net real estate 157,807,948 153,864,216 Property held for sale (net of accumulated depreciation of $2,732,386 and $2,723,386) 36,491,529 36,451,523 Real estate loans, net 107,181,677 103,433,147 Real estate loans to related party, net 8,081,532 7,164,768 Total real estate and real estate loans, net 309,562,686 300,913,654 Cash and cash equivalents 9,109,413 9,180,431 Restricted cash 2,442,610 2,064,819 Notes receivable 11,252,035 10,248,178 Note receivable from related party 1,500,000 1,500,000 Revolving line of credit to related party 7,794,718 5,358,227 Accrued interest receivable on real estate loans 4,258,841 3,286,660 Acquired intangible assets, net of amortization of $12,975,953 and $12,569,581 441,932 907,883 Deferred loan costs, net of amortization of $872,261 and $963,043 1,993,777 1,719,194 Deferred offering costs 6,077,441 5,255,636 Tenant receivables and other assets 901,469 1,202,013 Total assets 355,334,922$ 341,636,695$ Liabilities and equity Liabilities Mortgage notes payable 140,873,000$ 140,516,000$ Revolving credit facility 32,007,780 29,390,000 Accounts payable and accrued expenses 2,126,167 1,638,401 Accrued interest payable 348,016 443,099 Dividends and partnership distributions payable 2,988,176 2,900,478 Security deposits and other liabilities 847,044 695,998 Total liabilities 179,190,183 175,583,976 Commitments and contingencies Equity Stockholder's equity Series A Redeemable Preferred Stock, $0.01 par value per share; 989,408 shares authorized; 101,581 and 89,408 shares issued; 101,486 and 89,313 shares outstanding at March 31, 2014 and December 31, 2013, respectively 1,015 893 Common Stock, $0.01 par value per share; 400,066,666 shares authorized; 15,390,839 and 15,294,578 shares issued and outstanding at March 31, 2014 and December 31, 2013, respectively 153,908 152,945 Additional paid in capital 185,511,627 177,824,720 Accumulated deficit (10,634,358) (13,391,341) Total stockholders' equity 175,032,192 164,587,217 Non-controlling interest 1,112,547 1,465,502 Total equity 176,144,739 166,052,719 Total liabilities and equity 355,334,922$ 341,636,695$ Preferred Apartment Communities, Inc. Consolidated Balance Sheets (Unaudited)
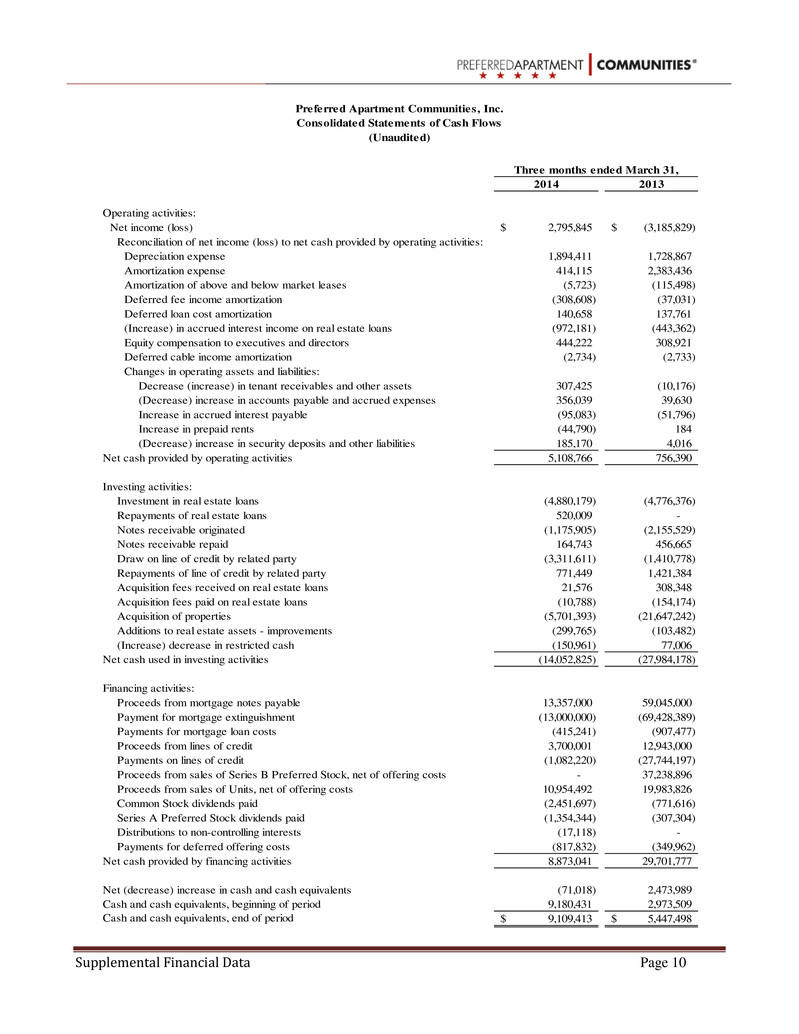
First Quarter 2014 Supplemental Financial Data Page 10 2014 2013 Operating activities: Net income (loss) 2,795,845$ (3,185,829)$ Reconciliation of net income (loss) to net cash provided by operating activities: Depreciation expense 1,894,411 1,728,867 Amortization expense 414,115 2,383,436 Amortization of above and below market leases (5,723) (115,498) Deferred fee income amortization (308,608) (37,031) Deferred loan cost amortization 140,658 137,761 (Increase) in accrued interest income on real estate loans (972,181) (443,362) Equity compensation to executives and directors 444,222 308,921 Deferred cable income amortization (2,734) (2,733) Changes in operating assets and liabilities: Decrease (increase) in tenant receivables and other assets 307,425 (10,176) (Decrease) increase in accounts payable and accrued expenses 356,039 39,630 Increase in accrued interest payable (95,083) (51,796) Increase in prepaid rents (44,790) 184 (Decrease) increase in security deposits and other liabilities 185,170 4,016 Net cash provided by operating activities 5,108,766 756,390 Investing activities: Investment in real estate loans (4,880,179) (4,776,376) Repayments of real estate loans 520,009 - Notes receivable originated (1,175,905) (2,155,529) Notes receivable repaid 164,743 456,665 Draw on line of credit by related party (3,311,611) (1,410,778) Repayments of line of credit by related party 771,449 1,421,384 Acquisition fees received on real estate loans 21,576 308,348 Acquisition fees paid on real estate loans (10,788) (154,174) Acquisition of properties (5,701,393) (21,647,242) Additions to real estate assets - improvements (299,765) (103,482) (Increase) decrease in restricted cash (150,961) 77,006 Net cash used in investing activities (14,052,825) (27,984,178) Financing activities: Proceeds from mortgage notes payable 13,357,000 59,045,000 Payment for mortgage extinguishment (13,000,000) (69,428,389) Payments for mortgage loan costs (415,241) (907,477) Proceeds from lines of credit 3,700,001 12,943,000 Payments on lines of credit (1,082,220) (27,744,197) Proceeds from sales of Series B Preferred Stock, net of offering costs - 37,238,896 Proceeds from sales of Units, net of offering costs 10,954,492 19,983,826 Common Stock dividends paid (2,451,697) (771,616) Series A Preferred Stock dividends paid (1,354,344) (307,304) Distributions to non-controlling interests (17,118) - Payments for deferred offering costs (817,832) (349,962) Net cash provided by financing activities 8,873,041 29,701,777 Net (decrease) increase in cash and cash equivalents (71,018) 2,473,989 Cash and cash equivalents, beginning of period 9,180,431 2,973,509 Cash and cash equivalents, end of period 9,109,413$ 5,447,498$ Preferred Apartment Communities, Inc. Consolidated Statements of Cash Flows (Unaudited) Three months ended March 31,

First Quarter 2014 Supplemental Financial Data Page 11 Real Estate Loan Portfolio The following table presents details of our real estate loan portfolio as of March 31, 2014: Total units upon Loan balance at March 31, Total loan Purchase Project/Property (1) Location completion 2014 (7) commitments Begin End option price Crosstown Walk (2) Tampa, FL 342 10,204,723$ 10,962,000$ 7/1/2016 12/31/2016 39,654,273$ City Park Charlotte, NC 284 9,934,190 10,000,000 11/1/2015 3/31/2016 30,945,845$ City Vista Pittsburgh, PA 272 12,071,059 12,153,000 2/1/2016 5/31/2016 43,560,271$ Madison - Rome (3) Rome, GA - 5,328,725 5,360,042 N/A N/A N/A Lely Naples, FL 308 11,645,390 12,713,242 4/1/2016 8/30/2016 43,500,000$ Overton Atlanta, GA 294 14,799,950 16,600,000 7/8/2016 12/8/2016 51,500,000$ Haven West (4) Carrollton, GA 160 6,494,067 6,940,795 8/1/2016 1/31/2017 26,138,466$ Starkville (5) Starkville, MS 168 1,587,466 1,730,000 N/A N/A N/A Founders' Village Williamsburg, VA 247 8,954,522 10,346,000 2/1/2016 9/15/2016 44,266,000$ Encore (6) Atlanta, GA 340 8,694,101 16,026,525 N/A N/A N/A Manassas (8) Northern VA 304 10,707,000 10,707,000 N/A N/A N/A Irvine (9) Irvine, CA 280 14,842,016 16,250,000 N/A N/A N/A 2,999 115,263,209$ 129,788,604$ (1) All loans are mezzanine loans pertaining to developments of multifamily communities, except as otherwise indicated. (2) (3) (4) Planned 568-bed student housing community adjacent to the campus of the University of West Georgia. (5) Bridge loan in support of a planned 168-unit, 536-bed student housing community adjacent to the campus of Mississippi State University. (6) (7) Loan balances are presented net of any associated deferred revenue related to loan fees. (8) (9) Bridge loan of up to approximately $16.3 million to partially finance the acquisition of land and predevelopment costs for a 280-unit multifamily community in Irvine, California. Purchase option window Crosstown Walk was a land acquisition bridge loan that was converted to a mezzanine loan in April 2013. Madison-Rome is a mezzanine loan for an 88,351 square foot retail development project. Bridge loan of up to approximately $16.0 million to partially finance the acquisition of land and predevelopment costs for a 340-unit multifamily community in suburban Atlanta, Georgia. Bridge loan of up to approximately $10.7 million to partially finance the acquisition of land and predevelopment costs for a 304-unit multifamily community in Northern Virginia. Capital Expenditures We regularly incur capital expenditures related to our owned properties. Capital expenditures may be nonrecurring and discretionary, as part of a strategic plan intended to increase a property’s value and corresponding revenue-generating ability, or may be normally recurring and necessary to maintain the income streams and present value of a property. Certain capital expenditures may be budgeted and reserved for upon acquiring a property as initial expenditures necessary to bring a property up to our standards or to add features or amenities that we believe make the property a compelling value to prospective residents in its individual market. These budgeted nonrecurring capital expenditures in connection with an acquisition are funded from the capital source(s) for the acquisition and are not dependent upon subsequent property operational cash flows for funding. For the three-month period ended March 31, 2014, our capital expenditures were: Summit Crossing Trail Creek Stone Rise Ashford Park McNeil Ranch Lake Cameron Total Nonrecurring capital expenditures: Budgeted at property acquisition -$ -$ -$ 10,523$ -$ 35,026$ 45,549$ Other nonrecurring capital expenditures 55,584 580 12,248 10,664 1,722 35,051 115,849 Total nonrecurring capital expenditures 55,584 580 12,248 21,187 1,722 70,077 161,398 Normally recurring capital expenditures 23,175 16,017 12,059 21,677 9,062 20,982 102,972 Total capital expenditures 78,759 16,597 24,307 42,864 10,784 91,059 264,370
First Quarter 2014 Supplemental Financial Data Page 12 Physical and Average Economic Occupancy On March 31, 2014, our aggregate physical occupancy (excluding the Trail Creek community) was 95.2%. For the three-month period ended March 31, 2014, our average monthly economic occupancy was 93.1% and our average physical occupancy was 95.3%. We define “physical occupancy” as the number of units occupied divided by total apartment units. We calculate “average economic occupancy” by dividing gross potential rent less vacancy losses, model expenses, bad debt expenses and concessions by gross potential rent. Same Store Financial Data We present same store operating results for our multifamily communities that have been owned for at least 15 full months, enabling comparisons of the current reporting period to the prior year comparative period. For the three month period ended March 31, 2014, only our Stone Rise community met the definition of same store for disclosure purposes. Our Trail Creek and Summit Crossing communities’ results are excluded from the same store presentation because they now reflect our acquisition during the same store period of the second phases of those communities subsequent to the acquisition dates of June 25, 2013 and December 31, 2013, respectively. Management believes that such a presentation is not meaningful; therefore, Same Store Financial Data is not presented for the first quarter of 2014. Beginning with the three month period ended June 30, 2014, we will resume presentation of this measure, adding our Lake Cameron, McNeil Ranch, and Ashford Park communities to Stone Rise, which will comprise a more meaningful measure. Same store net operating income is a non-GAAP measure that is most directly comparable to net income/loss. Definitions of Non-GAAP Measures Funds From Operations Attributable to Common Stockholders and Unitholders (“FFO”) Analysts, managers and investors have, since the first real estate investment trusts were created, made certain adjustments to reported net income amounts under U.S. GAAP in order to better assess these vehicles’ liquidity and cash flows. FFO is one of the most commonly utilized Non-GAAP measures currently in practice. In its 2002 “White Paper on Funds From Operations,” which was most recently revised in 2012, the National Association of Real Estate Investment Trusts, or NAREIT, standardized the definition of how Net income/loss should be adjusted to arrive at FFO, in the interests of uniformity and comparability. The NAREIT definition of FFO (and the one reported by the Company) is: Net income/loss: • excluding impairment charges on and gains/losses from sales of depreciable property; • plus depreciation and amortization of real estate assets; and • after adjustments for unconsolidated partnerships and joint ventures. Not all companies necessarily utilize the standardized NAREIT definition of FFO, so caution should be taken in comparing the Company’s reported FFO results to those of other companies. The Company’s FFO results are comparable to the FFO results of other companies that follow the NAREIT definition of FFO and report these figures on that basis. The Company believes FFO is useful to investors as a supplemental gauge of our operating and cash-generating results. FFO is a non-GAAP measure that is reconciled to its most comparable GAAP measure, net income/loss available to common stockholders. Normalized Funds From Operations Attributable to Common Stockholders and Unitholders (“NFFO”) Normalized FFO makes certain adjustments to FFO, which are either not likely to occur on a regular basis or are otherwise not representative of the Company’s ongoing operating performance. For example, since the Company is acquiring properties on a regular basis, it incurs substantial costs related to such acquisitions, which
First Quarter 2014 Supplemental Financial Data Page 13 are required under GAAP to be recognized as expenses when they are incurred. The Company adds back any such acquisition and pursuit costs to FFO in its calculation of NFFO since such costs are not representative of our fund generating results on an ongoing basis. NFFO figures reported by us may not be comparable to those reported by other companies. We utilize NFFO as a measure of the operating performance of our portfolio of real estate assets. We believe NFFO is useful to investors as a supplemental gauge of our operating performance and is useful in comparing our operating performance with other real estate companies that are not as involved in ongoing acquisition activities. NFFO is a non-GAAP measure that is reconciled to its most comparable GAAP measure, net income/loss available to common stockholders. Adjusted Funds From Operations Attributable to Common Stockholders and Unitholders (“AFFO”) AFFO makes further adjustments to NFFO results in order to arrive at a more refined measure of operating and financial performance. There is no industry standard definition of AFFO and practice is divergent across the industry. The Company calculates AFFO as: NFFO, plus: • non-cash equity compensation to directors and executives; • amortization of loan closing costs; • depreciation and amortization of non-real estate assets; • net loan fees received; • deferred interest income received; and • adjustments for non-cash dividends; Less: • non-cash loan interest income; • cash paid for pursuit costs on abandoned acquisitions; • amortization of acquired real estate intangible liabilities; and • normally recurring capital expenditures. AFFO figures reported by us may not be comparable to those reported by other companies. We utilize AFFO to measure the liquidity generated by our portfolio of real estate assets. We believe AFFO is useful to investors as a supplemental gauge of our operating performance and is useful in comparing our operating performance with other real estate companies. AFFO is a non-GAAP measure that is reconciled to its most comparable GAAP measure, net income/loss available to common stockholders. Additional Information The SEC has declared effective the registration statement (including prospectus) filed by the Company for each of the offerings to which this communication may relate. Before you invest, you should read the final prospectus, and any prospectus supplements, forming a part of the registration statement and other documents the Company has filed with the SEC for more complete information about the Company and the offering to which this communication may relate. In particular, you should carefully read the risk factors described in the final prospectus and in any related prospectus supplement and in the documents incorporated by reference in the final prospectus and any related prospectus supplement to which this communication may relate. You may get these documents for free by visiting EDGAR on the SEC website at www.sec.gov. Alternatively the Company or its dealer manager, International Assets Advisory, LLC (with respect to the offering of up to a maximum of 900,000 Units, with each Unit consisting of one share of Series A Redeemable Preferred Stock and one Warrant to purchase up to 20 shares of our Common Stock, or the Follow-On Offering), or its sales agent, MLV & Co. LLC (with respect to the issuance and offering of up to $100 million of its Common Stock from time to time in

First Quarter 2014 Supplemental Financial Data Page 14 an "at the market" offering, or the ATM Offering), will arrange to send you the prospectus if you request it by calling Leonard A. Silverstein at (770) 818-4100, 3625 Cumberland Boulevard, Suite 1150, Atlanta, Georgia 30339. The final prospectus for the Follow-On Offering, dated October 11, 2013, can be accessed through the following link: http://www.sec.gov/Archives/edgar/data/1481832/000148183213000128/a424b3prospectus900m.htm The final prospectus and prospectus supplement for the ATM Offering, dated July 19, 2013 and February 28, 2014, respectively, can be accessed through the following link: http://www.sec.gov/Archives/edgar/data/1481832/000148183214000015/prospectussupplementatm-20.htm For further information: Leonard A. Silverstein President and Chief Operating Officer Preferred Apartment Communities, Inc. lsilverstein@pacapts.com +1-770-818-4147
