Attached files
| file | filename |
|---|---|
| 8-K - ALBANY INTERNATIONAL CORP. 8-K - ALBANY INTERNATIONAL CORP /DE/ | a50857766.htm |
| EX-99.1 - EXHIBIT 99.1 - ALBANY INTERNATIONAL CORP /DE/ | a50857766-ex991.htm |
Exhibit 99.2
Albany International Corp. Q1 Financial Performance May 5, 2014
‘Non‐GAAP’ Items and Forward‐Looking Statements This presentation contains certain items, such as net income attributable to the Company, excluding adjustments, earnings before interest, taxes, depreciation and amortization (EBITDA), adjusted EBITDA and net debt, that could be considered ‘non‐GAAP’ financial measures under SEC rules. We think such items provide useful information to investors regarding the Company’s operational performance. This presentation also may contain statements, estimates, or projections that constitute “forward‐looking statements” as defined under U.S. federal securities laws. Forward‐looking statements are subject to certain risks and uncertainties that could cause actual results to differ materially from the Company’s historical experience and our present expectations or projections. We disclaim any obligation to update any information in this presentation to reflect any changes or developments after the date on the cover page. Certain additional disclosures regarding our use of these ‘non‐GAAP’ items and forward‐looking statements are set forth in our first quarter earnings press release dated May 5, 2014 and in our SEC filings, including our most recent annual and quarterly reports. Our use of such items in this presentation is subject to those additional disclosures, which we urge you to read.
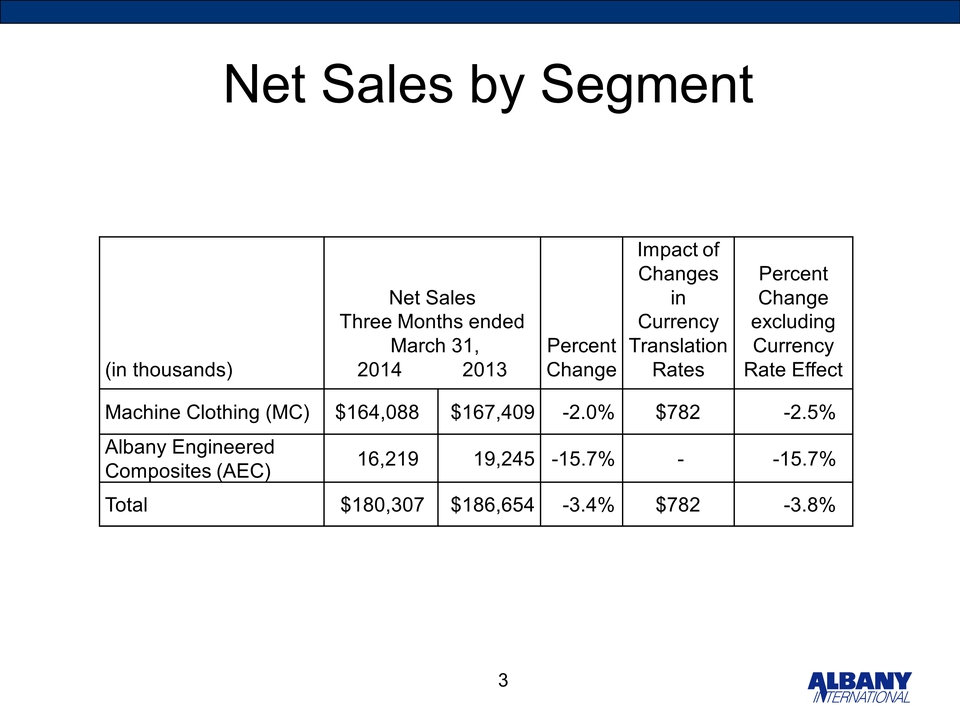
Net Sales by Segment (in thousands) Net Sales Three Months ended March 31, 2014 2013 Percent Change Impact of Changes in Currency Translation Rates Percent Change excluding Currency Rate Effect Machine Clothing (MC) 164,088 $167,409 -2.0% $782 -2.5% Albany Engineered Composites (AEC) 16,219 19,245 -15.7% - -15.7% Total 180,307 $186,654 -3.4% $782 -3.8%
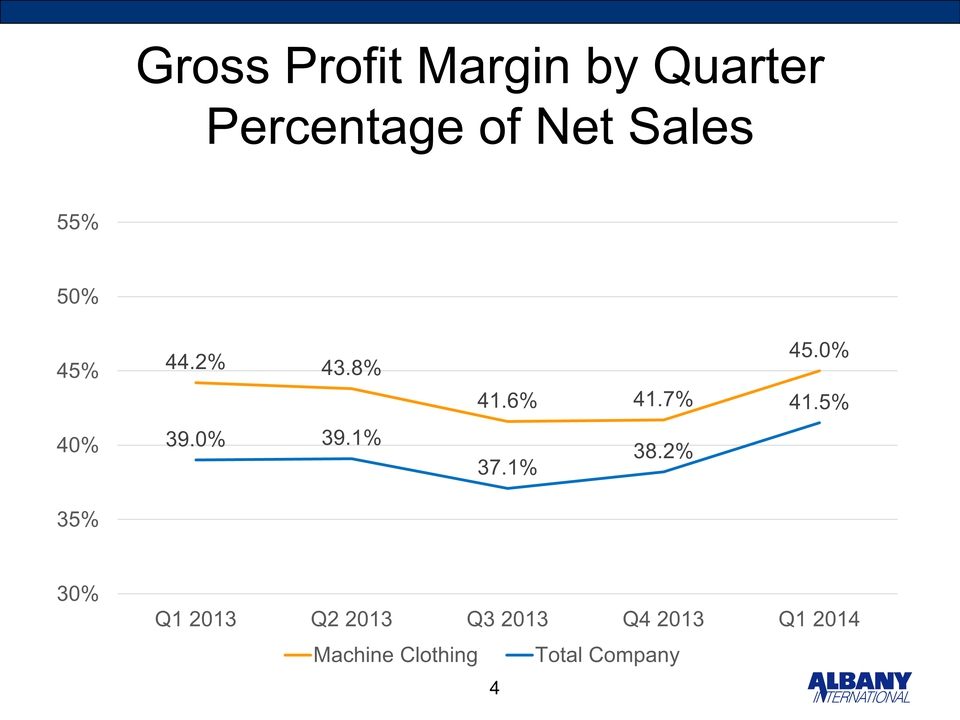
Gross Profit Margin by Quarter Percentage of Net Sales 44.2% 43.8% 41.6% 41.7% 45.0% 39.0% 39.1% 37.1% 38.2% 41.5% 30% 35% 40% 45% 50% 55% Q1 '13 Q2 '13 Q3 '13 Q4 '13 Q1 '14 Machine Clothing Total Company
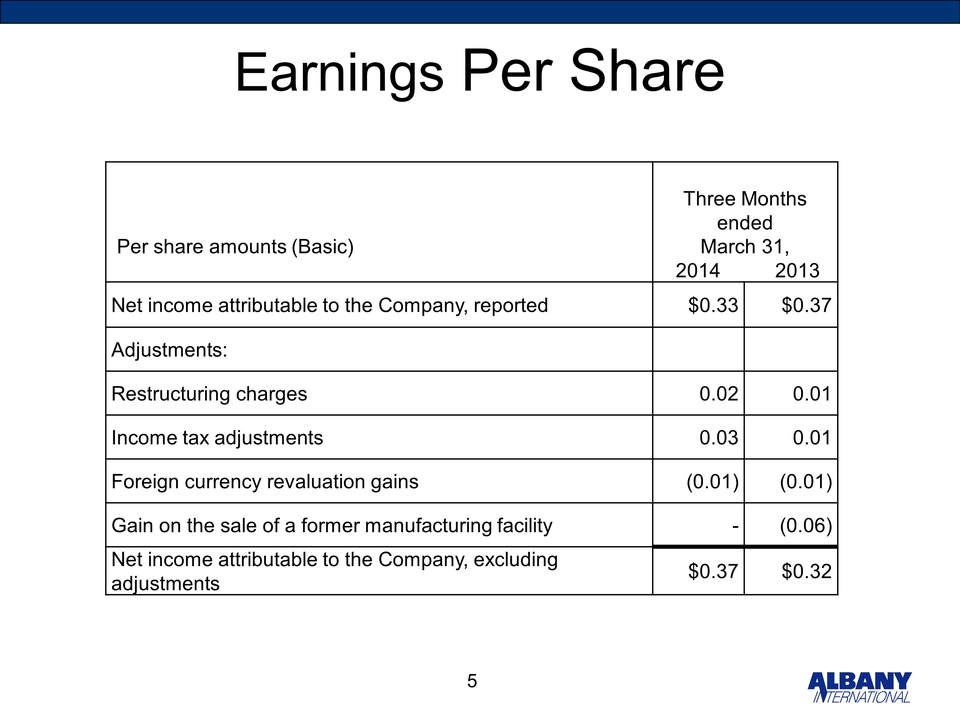
Earnings Per Share Per share amounts (Basic) Three Months ended March 31, 2014 2013 Net income attributable to the Company, reported $0.33 $0.37 Adjustments: Restructuring charges $0.02 $0.01 Income tax adjustments $0.03 $0.01 Foreign currency revaluation gains ($0.01) ($0.01) Gain on the sale of a former manufacturing facility - ($0.06) Net income attributable to the Company, excluding adjustments $0.37 $0.32
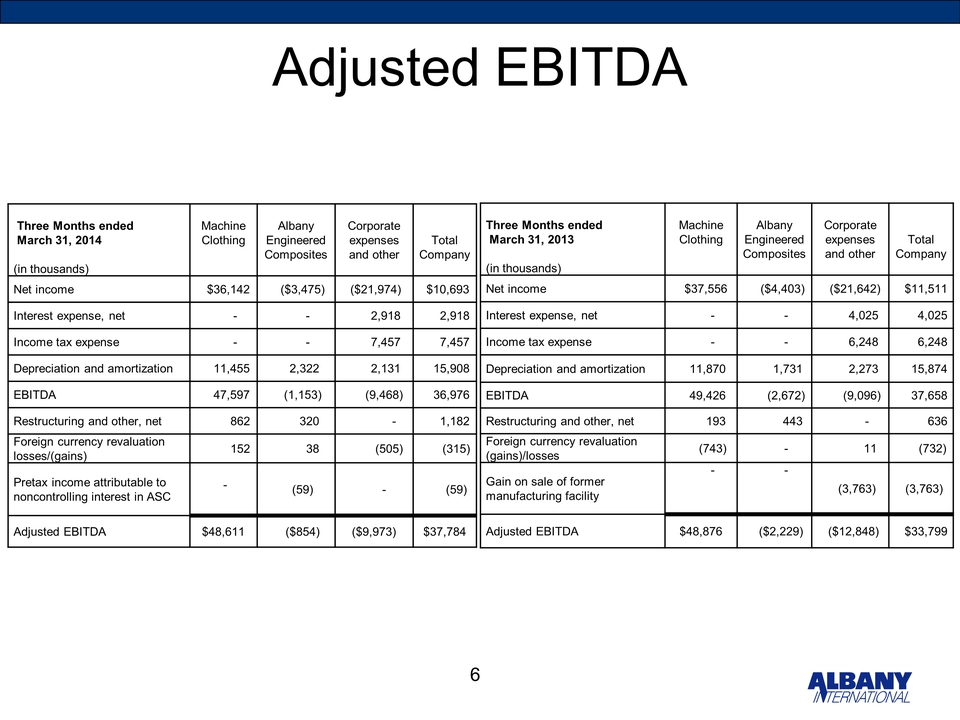
Adjusted EBITDA Three Months ended March 31, 2014 (in thousands) Machine Clothing Albany Engineered Composites Corporate expenses and other Total Company Net income $36,142 ($3,475) ($21,974) $10,693 Interest expense, net - - 2,918 2,918 Income tax expense - - 7,457 7,457 Depreciation and amortization 11,455 2,322 2,131 15,908 EBITDA 47,597 (1,153) (9,468) 36,976 Restructuring and other, net 862 320 - 1,182 Foreign currency revaluation losses/(gains) 152 38 (505) (315) Pretax income attributable to noncontrolling interest in ASC - (59) - (59) Adjusted EBITDA $48,611 ($854) ($9,973) $37,784 Three months ended March 31, 2013 (in thousands) Machine Clothing Albany Engineered Composites Corporate expenses and other Total Company Net income 37,556 ($4,403) ($21,642) $11,511 Interest expense, net - - 4,025 4,025 Income tax expense - - 6,248 6,248 Depreciation and amortization 11,870 1,731 2,273 15,874 EBITDA 49,426 (2,672) (9,096) 37,658 Restructuring and other, net 193 443 - 636 Foreign currency revaluation (gains)/losses (743) - 11 (732) Gain on sale of former manufacturing facility - - (3,763) (3,763) Adjusted EBITDA $48,876 ($2,229) ($12,848) $33,799
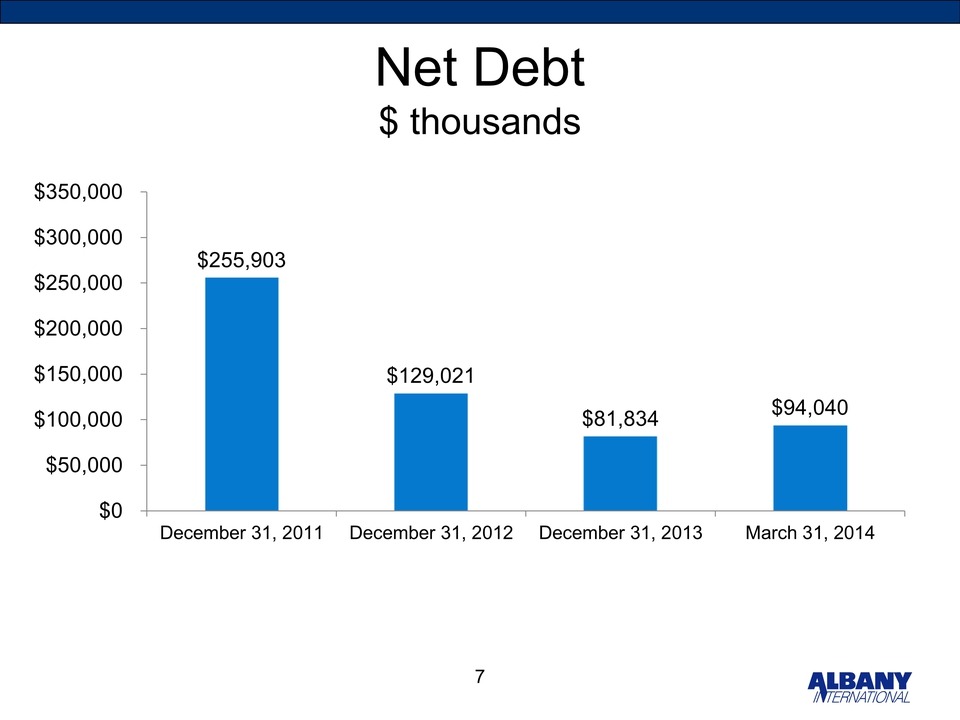
Net Debt $ millions $255.9 $129.0 $81.8 $94.0 $0 $50 $100 $150 $200 $250 $300 $350 Dec. 2011 Dec. 2012 Dec. 2013 Mar. 2014