Attached files
| file | filename |
|---|---|
| EX-99.1 - EXHIBIT 99.1 - Exelis Inc. | a50856547ex99_1.htm |
| 8-K - EXELIS INC. 8-K - Exelis Inc. | a50856547.htm |
Exhibit 99.2

First Quarter 2014 Earnings Presentation David Melcher Chief Executive Officer and President Peter Milligan Senior Vice President and Chief Financial Officer May 2, 2014
Safe Harbor Statement Safe Harbor Statement under the Private Securities Litigation Reform Act of 1995 (the “Act”): Some of the information included herein includes forward‐looking statements intended to qualify for the safe harbor from liability established by the Act. Whenever used, words such as “anticipate,” “estimate,” “expect,” “project,” “intend,” “plan,” “believe,” “target,” “may,” “could,” “outlook” and other terms of similar meaning are intended to identify such forward‐looking statements. Forward‐looking statements are uncertain and to some extent unpredictable, and involve known and unknown risks, uncertainties and other important factors that could cause actual results to differ materially from those expressed in, or implied from, such forward‐looking statements. The company undertakes no obligation to update any forward‐looking statements, whether as a result of new information, future events or otherwise, except as required by law. In addition, forwardlooking statements are subject to certain risks and uncertainties that could cause actual results to differ materially from the company’s historical experience and our present expectations or projections. These risks and uncertainties include, but are not limited to: The timing and completion of the tax‐free spin‐off described in this presentation; Our dependence on the defense industry and the business risks peculiar to that industry, including changing priorities or reductions in the U.S. Government or international defense budgets; Government regulations and compliance therewith, including changes to the Department of Defense procurement process; Our international operations, including sales to foreign customers; Competition, industry capacity and production rates; Misconduct of our employees, subcontractors, agents and business partners; The level of returns on postretirement benefit plan assets and potential employee benefit plan contributions and other employment and pension matters; Changes in interest rates and other factors that affect earnings and cash flows; The mix of our contracts and programs, our performance, and our ability to control costs; Governmental investigations; Our level of indebtedness and our ability to make payments on or service our indebtedness; Subcontractor performance; Economic and capital markets conditions; The availability and pricing of raw materials and components; Ability to retain and recruit qualified personnel; Protection of intellectual property rights; Changes in technology; Contingencies related to actual or alleged environmental contamination, claims and concerns; Security breaches and other disruptions to our information technology and operations; Unanticipated changes in our tax provisions or exposure to additional income tax liabilities; and Ability to execute our internal performance plans including restructuring, productivity improvements and cost reduction initiatives. The forward‐looking statements in this presentation are made as of the date hereof and the company undertakes no obligation to update any forward‐looking statements, whether as a result of new information, future events or otherwise. In addition, forward‐looking statements are subject to certain risks and uncertainties that could cause actual results to differ materially from the company’s historical experience and our present expectations or projections. These risks and uncertainties include, but are not limited to, those described in the Exelis Inc. Form 10‐K for the fiscal year ended December 31, 2013, and those described from time to time in our future reports filed with the Securities and Exchange Commission. 2
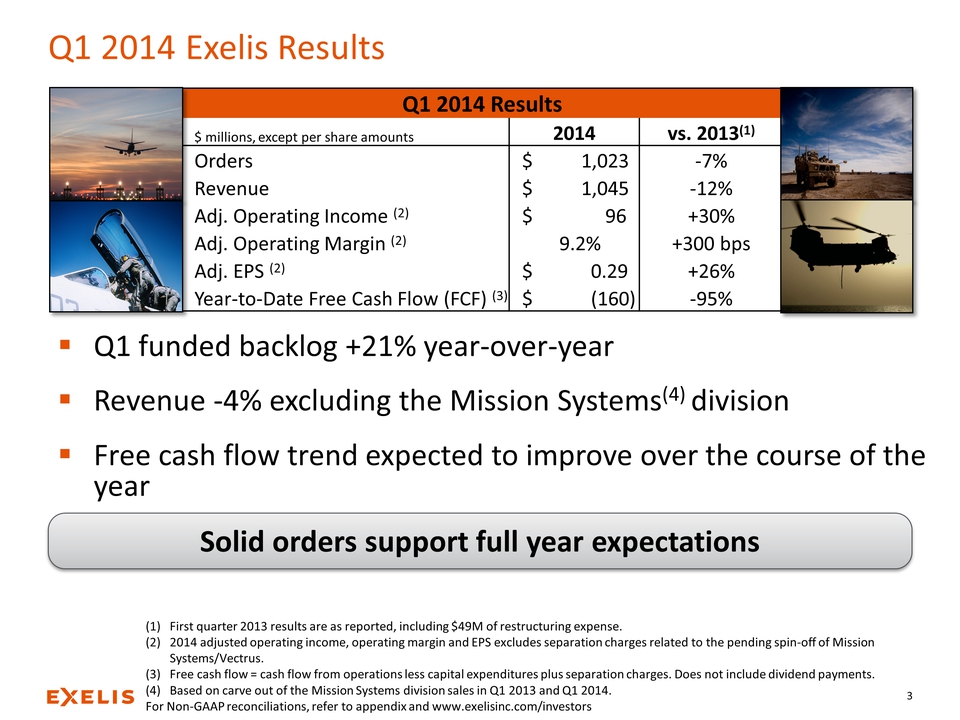
Q1 2014 Exelis Results Q1 2014 Results $ millions, except per share amounts 2014 vs. 2013(1) Orders $ 1,023 ‐7% Revenue $ 1,045 ‐12% Adj. Operating Income (2) $ 96 +30% Adj. Operating Margin (2) 9.2% +300 bps Adj. EPS (2) $ 0.29 +26% Year‐to‐Date Free Cash Flow (FCF) (3) $ (160) ‐95% Q1 funded backlog +21% year‐over‐year Revenue ‐4% excluding the Mission Systems(4) division Free cash flow trend expected to improve over the course of the year Solid orders support full year expectations (1) First quarter 2013 results are as reported, including $49M of restructuring expense. (2) 2014 adjusted operating income, operating margin and EPS excludes separation charges related to the pending spin‐off of Mission Systems/Vectrus. (3) Free cash flow = cash flow from operations less capital expenditures plus separation charges. Does not include dividend payments. (4) Based on carve out of the Mission Systems division sales in Q1 2013 and Q1 2014. For Non‐GAAP reconciliations, refer to appendix and www.exelisinc.com/investors 3
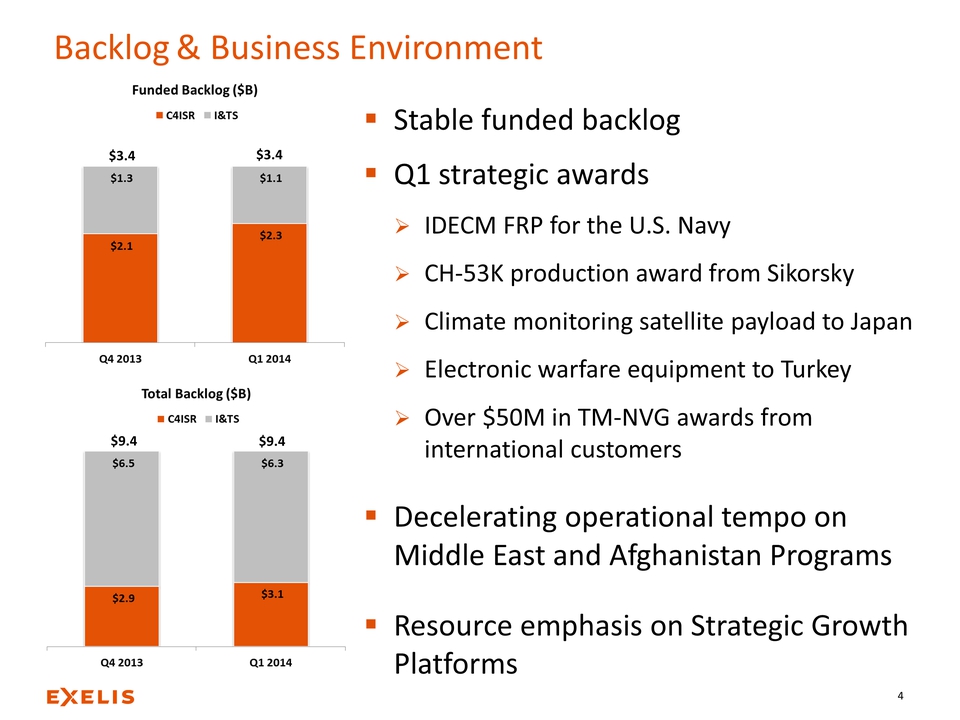
Backlog & Business Environment $3.4 $3.4 $1.3 $1.1 $2.1 $2.3 Q4 2013 Q1 2014 Funded Backlog ($B) $9.4 $9.4 $6.5 $6.3 $2.9 $3.1 Q4 2013 Q1 2014 Total Backlog ($B) Stable funded backlog Q1 strategic awards IDECM FRP for the U.S. Navy CH‐53K production award from Sikorsky Climate monitoring satellite payload to Japan Electronic warfare equipment to Turkey Over $50M in TM‐NVG awards from international customers Decelerating operational tempo on Middle East and Afghanistan Programs Resource emphasis on Strategic Growth Platforms 4
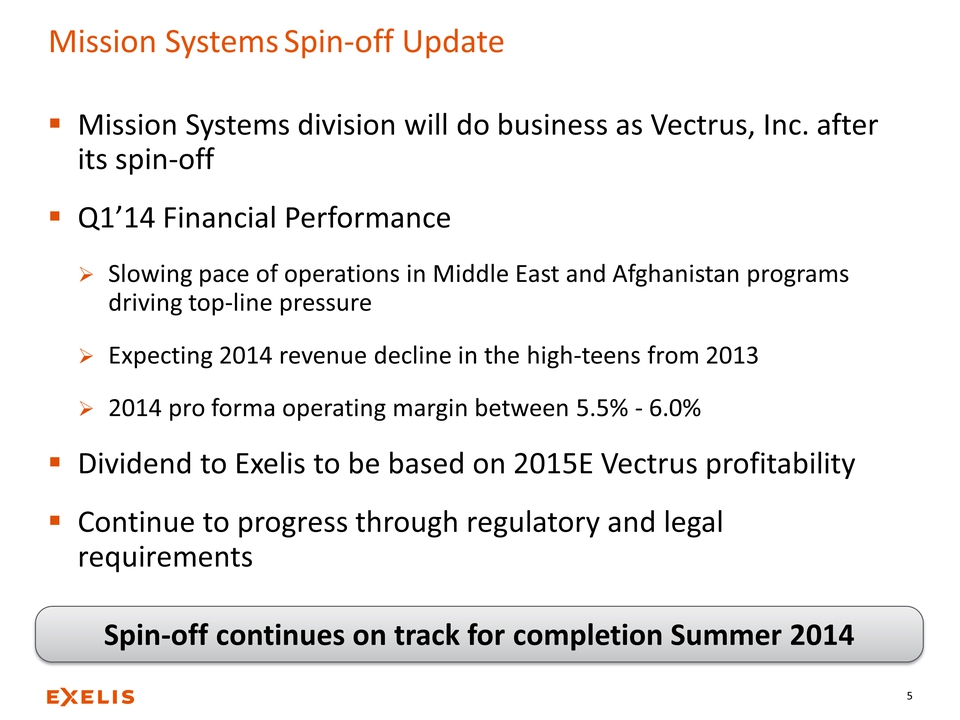
Mission Systems Spin‐off Update Mission Systems division will do business as Vectrus, Inc. after its spin‐off Q1’14 Financial Performance Slowing pace of operations in Middle East and Afghanistan programs driving top‐line pressure Expecting 2014 revenue decline in the high‐teens from 2013 2014 pro forma operating margin between 5.5% ‐ 6.0% Dividend to Exelis to be based on 2015E Vectrus profitability Continue to progress through regulatory and legal requirements Spin‐off continues on track for completion Summer 2014 5
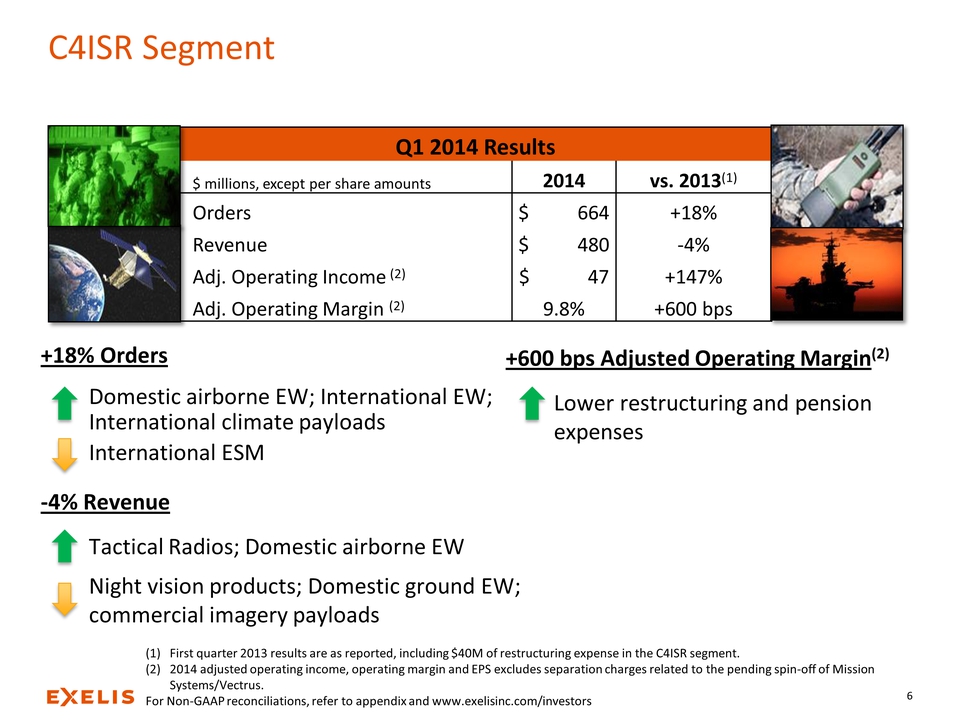
C4ISR Segment Q1 2014 Results $ millions, except per share amounts 2014 vs. 2013(1) Orders $ 664 +18% Revenue $ 480 ‐4% Adj. Operating Income(2) $ 47 +147% Adj. Operating Margin (2) 9.8% +600 bps +18% Orders Domestic airborne EW; International EW; International climate payloads International radars ‐4% Revenue Tactical Radios; Domestic airborne EW Night vision products; Domestic ground EW; commercial imagery payloads +600 bps Adjusted Operating Margin(2) Lower restructuring and pension expenses (1) First quarter 2013 results are as reported, including $40M of restructuring expense in the C4ISR segment. (2) 2014 adjusted operating income, operating margin and EPS excludes separation charges related to the pending spin‐off of Mission Systems/Vectrus. For Non‐GAAP reconciliations, refer to appendix and www.exelisinc.com/investors 6
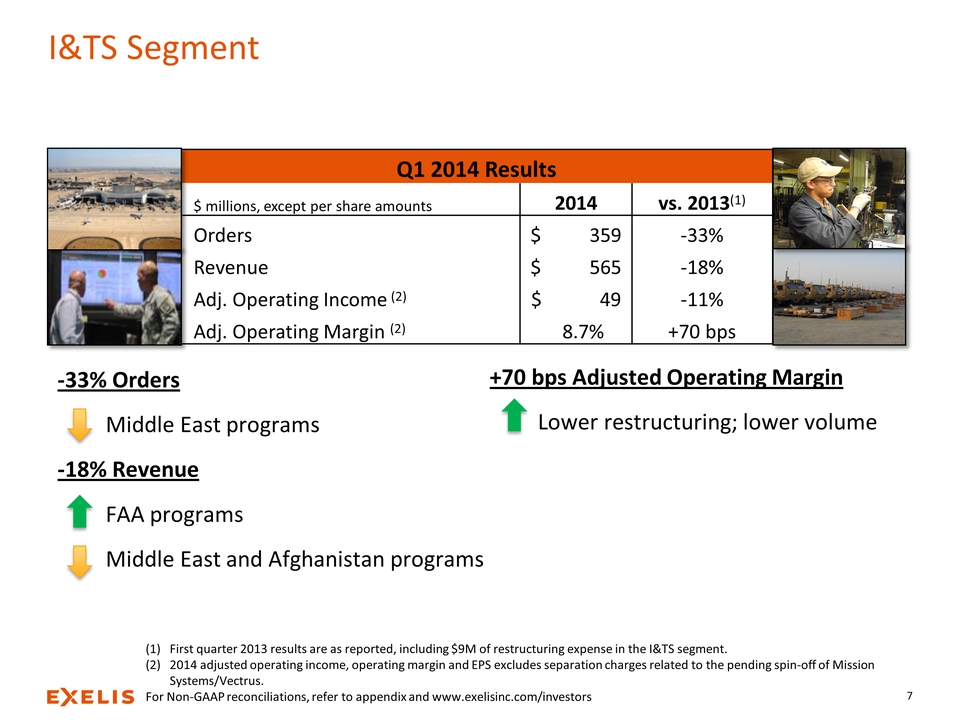
I&TS Segment Q1 2014 Results $ millions, except per share amounts 2014 vs. 2013(1) Orders $ 359 ‐33% Revenue $ 565 ‐18% Adj. Operating Income(2) $ 49 ‐11% Adj. Operating Margin (2) 8.7% +70 bps ‐33% Orders Middle East programs ‐18% Revenue FAA programs Middle East and Afghanistan programs +70 bps Adjusted Operating Margin Lower restructuring; lower volume (1) First quarter 2013 results are as reported, including $9M of restructuring expense in the I&TS segment. (2) 2014 adjusted operating income, operating margin and EPS excludes separation charges related to the pending spin‐off of Mission Systems/Vectrus. For Non‐GAAP reconciliations, refer to appendix and www.exelisinc.com/investors 7
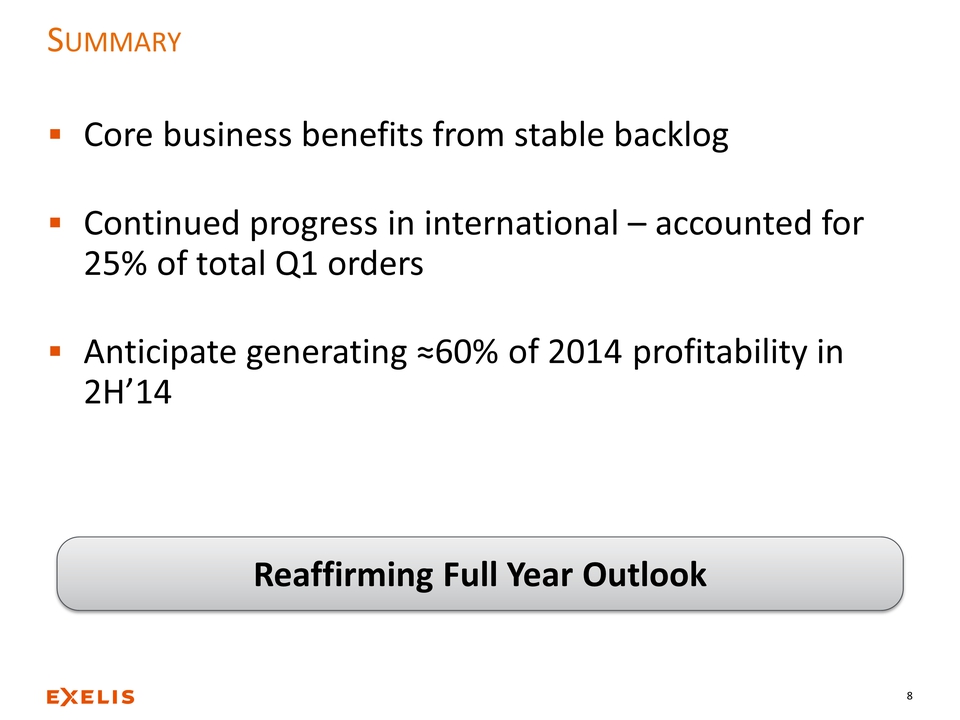
SUMMARY Core business benefits from stable backlog Continued progress in international – accounted for 25% of total Q1 orders Anticipate generating ≈60% of 2014 profitability in 2H’14 Reaffirming Full Year Outlook 8

Appendix
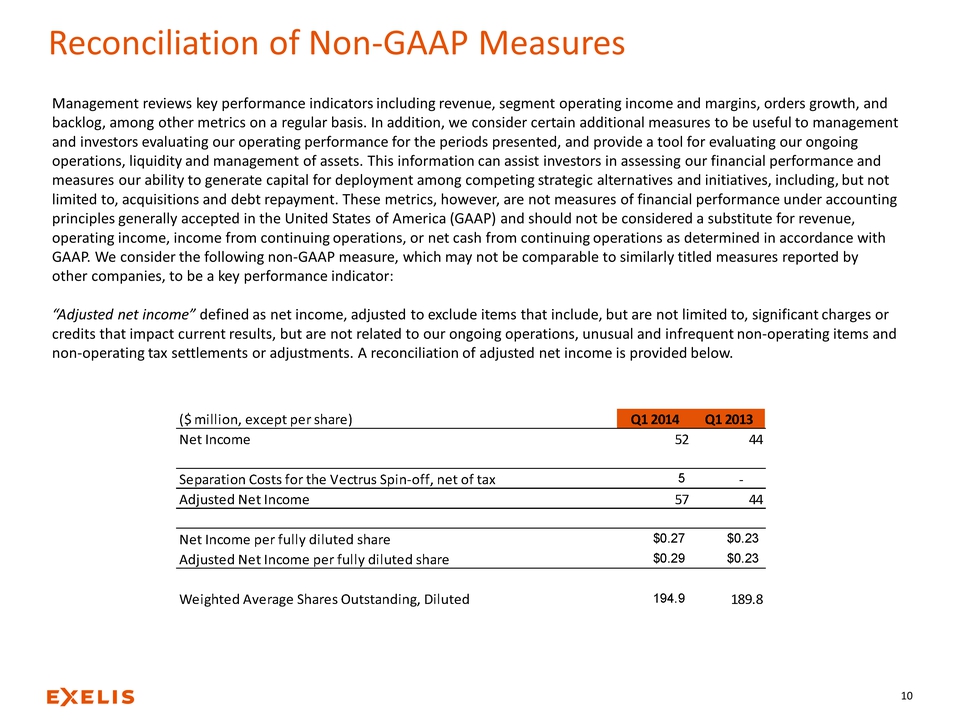
Reconciliation of Non‐GAAP Measures Management reviews key performance indicators including revenue, segment operating income and margins, orders growth, and backlog, among other metrics on a regular basis. In addition, we consider certain additional measures to be useful to management and investors evaluating our operating performance for the periods presented, and provide a tool for evaluating our ongoing operations, liquidity and management of assets. This information can assist investors in assessing our financial performance and measures our ability to generate capital for deployment among competing strategic alternatives and initiatives, including, but not limited to, acquisitions and debt repayment. These metrics, however, are not measures of financial performance under accounting principles generally accepted in the United States of America (GAAP) and should not be considered a substitute for revenue, operating income, income from continuing operations, or net cash from continuing operations as determined in accordance with GAAP. We consider the following non‐GAAP measure, which may not be comparable to similarly titled measures reported by other companies, to be a key performance indicator: “Adjusted net income” defined as net income, adjusted to exclude items that include, but are not limited to, significant charges or credits that impact current results, but are not related to our ongoing operations, unusual and infrequent non‐operating items and non‐operating tax settlements or adjustments. A reconciliation of adjusted net income is provided below. ($ million, except per share) Q1 2014 Q1 2013 Net Income 52 44 Separation Costs for the Vectrus Spin‐off, net of tax 5 ‐ Adjusted Net Income 57 44 Net Income per fully diluted share $0.27 $0.23 Adjusted Net Income per fully diluted share $0.29 $0.23 Weighted Average Shares Outstanding, Diluted 194.9 189.8 10
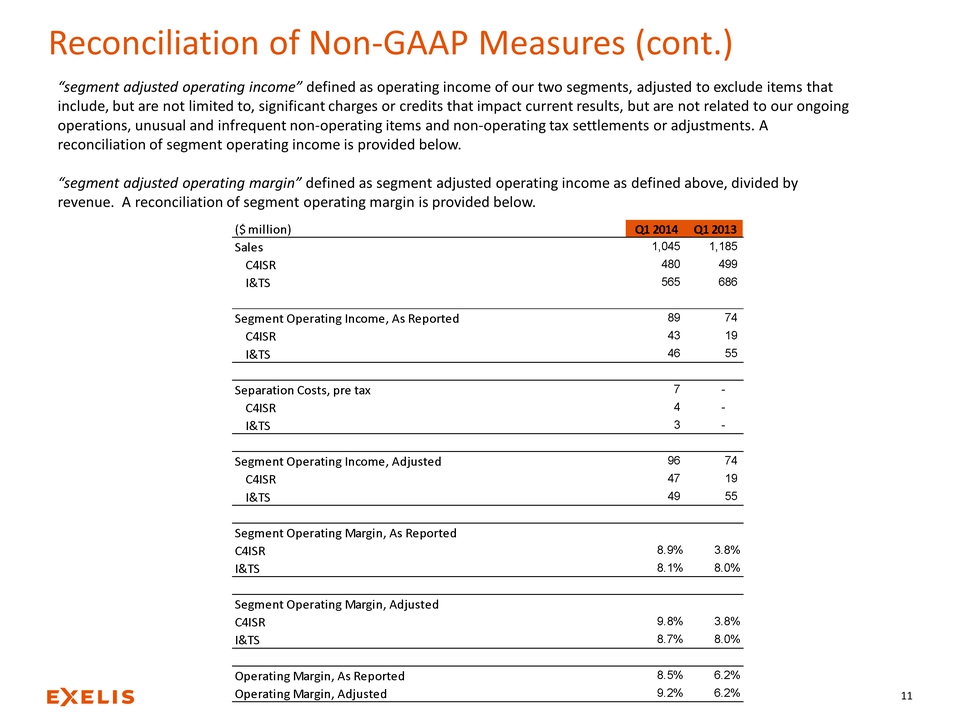
Reconciliation of Non‐GAAP Measures (cont.) “segment adjusted operating income” defined as operating income of our two segments, adjusted to exclude items that include, but are not limited to, significant charges or credits that impact current results, but are not related to our ongoing operations, unusual and infrequent non‐operating items and non‐operating tax settlements or adjustments. A reconciliation of segment operating income is provided below. “segment adjusted operating margin” defined as segment adjusted operating income as defined above, divided by revenue. A reconciliation of segment operating margin is provided below. ($ million) Q1 2014 Q1 2013 Sales 1,045 1,185 C4ISR 480 499 I&TS 565 686 Segment Operating Income, As Reported 89 74 C4ISR 43 19 I&TS 46 55 Separation Costs, pre tax 7 - C4ISR 4 - I&TS 3 - Segment Operating Income, Adjusted 96 74 C4ISR 47 19 I&TS 49 55 Segment Operating Margin, As Reported C4ISR 8.9% 3.8% I&TS 8.1% 8.0% Segment Operating Margin, Adjusted C4ISR 9.8% 3.8% I&TS 8.7% 8.0% Operating Margin, As Reported 8.5% 6.2% Operating Margin, Adjusted 9.2% 6.2% 11
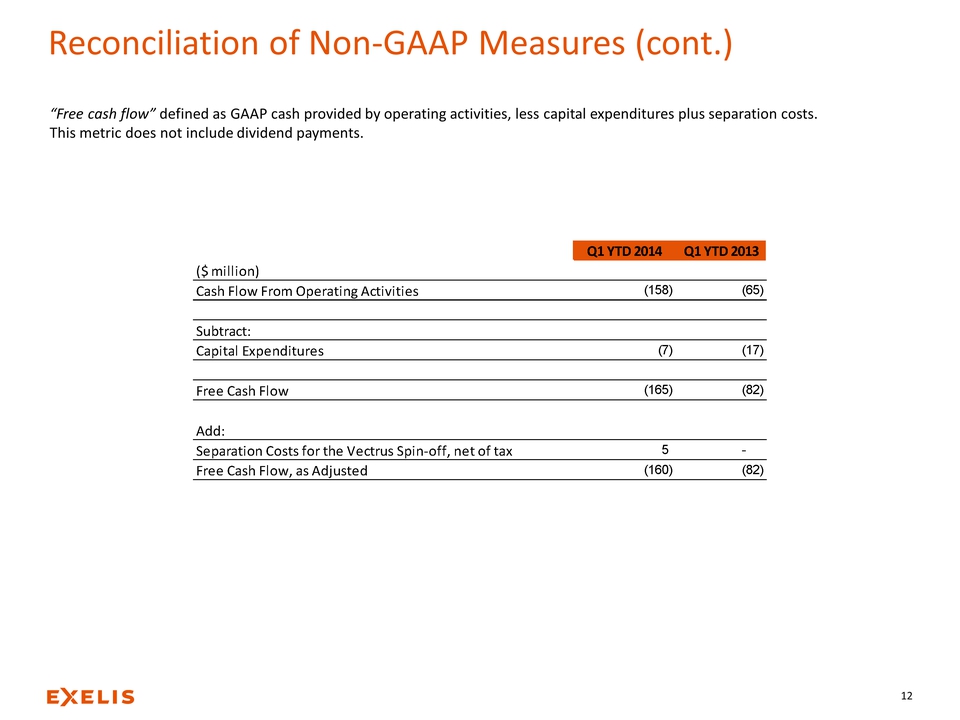
Reconciliation of Non‐GAAP Measures (cont.) “Free cash flow” defined as GAAP cash provided by operating activities, less capital expenditures plus separation costs. This metric does not include dividend payments. Q1 YTD 2014 Q1 YTD 2013 ($ million) Cash Flow From Operating Activities (158) (65) Subtract: Capital Expenditures (7) (17) Free Cash Flow (165) (82) Add: Separation Costs for the Vectrus Spin‐off, net of tax 5 - Free Cash Flow, as Adjusted (160) (82) 12