Attached files
| file | filename |
|---|---|
| 8-K - 8-K - SCANSOURCE, INC. | a2014-q3form8xk.htm |
| EX-99.1 - EXHIBIT 99.1 - SCANSOURCE, INC. | a2014-q3exhibit991.htm |
Q3 FY 2014 FINANCIAL RESULTS CONFERENCE CALL May 1, 2014 at 5:00 pm ET Exhibit 99.2
Safe Harbor This presentation may contain certain comments, which are “forward-looking” statements that involve plans, strategies, economic performance and trends, projections, expectations, or beliefs about future events and other statements that are not descriptions of historical facts, may be forward-looking statements within the meaning of the Private Securities Litigation Reform Act of 1995, Section 27A of the Securities Act of 1933 and Section 21E of the Securities Exchange Act of 1934. Forward-looking information is inherently subject to risks and uncertainties; these statements are subject to the safe harbor created by the Private Securities Litigation Reform Act of 1995. Any number of factors could cause actual results to differ materially from anticipated results. For more information concerning factors that could cause actual results to differ from anticipated results, see the “Risk Factors” included in the Company’s annual report on Form 10-K for the fiscal year ended June 30, 2013, as well as the quarterly report on Form 10-Q for the quarter ended December 31, 2013, filed with the Securities and Exchange Commission (“SEC”). Although ScanSource believes the expectations reflected in its forward-looking statements are reasonable, it cannot guarantee future results, levels of activity, performance or achievements. ScanSource disclaims any intentions or obligation to update or revise any forward-looking statements, whether as a result of new information, future events, or otherwise, except as may be required by law. In addition to disclosing results that are determined in accordance with United States Generally Accepted Accounting Principles (“GAAP”), the Company also discloses certain non-GAAP measures, including return on invested capital (“ROIC”) and the percentage change in net sales excluding the impact of foreign currency exchange rates. A reconciliation of the Company's non-GAAP financial information to GAAP financial information is provided in the Company’s Form 8-K, filed with the SEC, with the quarterly earnings press release for the period indicated. 2
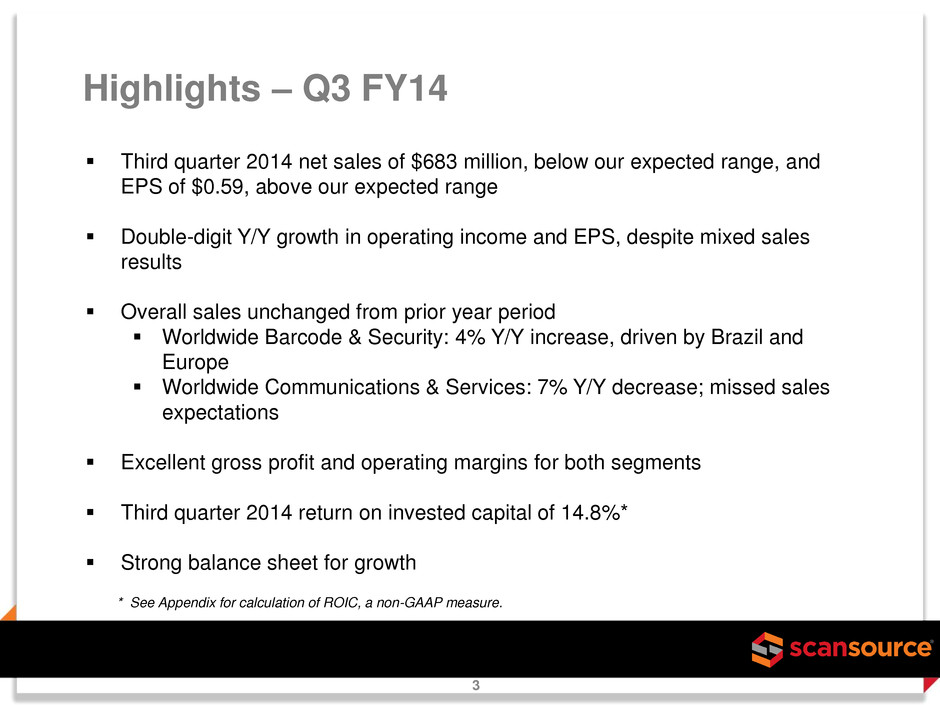
Highlights – Q3 FY14 3 Third quarter 2014 net sales of $683 million, below our expected range, and EPS of $0.59, above our expected range Double-digit Y/Y growth in operating income and EPS, despite mixed sales results Overall sales unchanged from prior year period Worldwide Barcode & Security: 4% Y/Y increase, driven by Brazil and Europe Worldwide Communications & Services: 7% Y/Y decrease; missed sales expectations Excellent gross profit and operating margins for both segments Third quarter 2014 return on invested capital of 14.8%* Strong balance sheet for growth * See Appendix for calculation of ROIC, a non-GAAP measure.
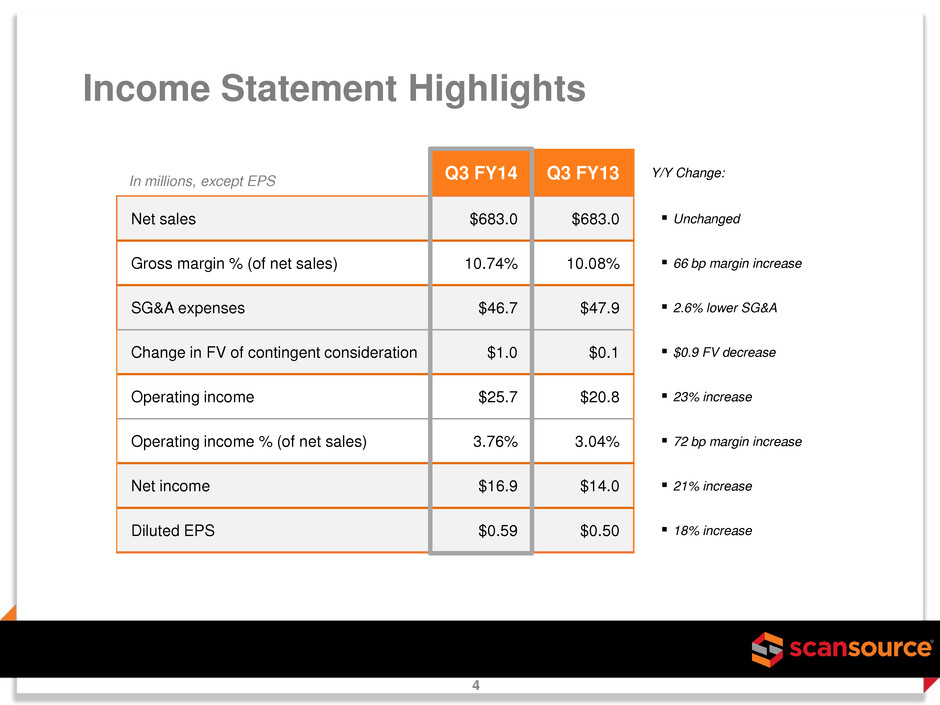
Q3 FY14 Q3 FY13 Y/Y Change: Net sales $683.0 $683.0 Unchanged Gross margin % (of net sales) 10.74% 10.08% 66 bp margin increase SG&A expenses $46.7 $47.9 2.6% lower SG&A Change in FV of contingent consideration $1.0 $0.1 $0.9 FV decrease Operating income $25.7 $20.8 23% increase Operating income % (of net sales) 3.76% 3.04% 72 bp margin increase Net income $16.9 $14.0 21% increase Diluted EPS $0.59 $0.50 18% increase Income Statement Highlights In millions, except EPS 4
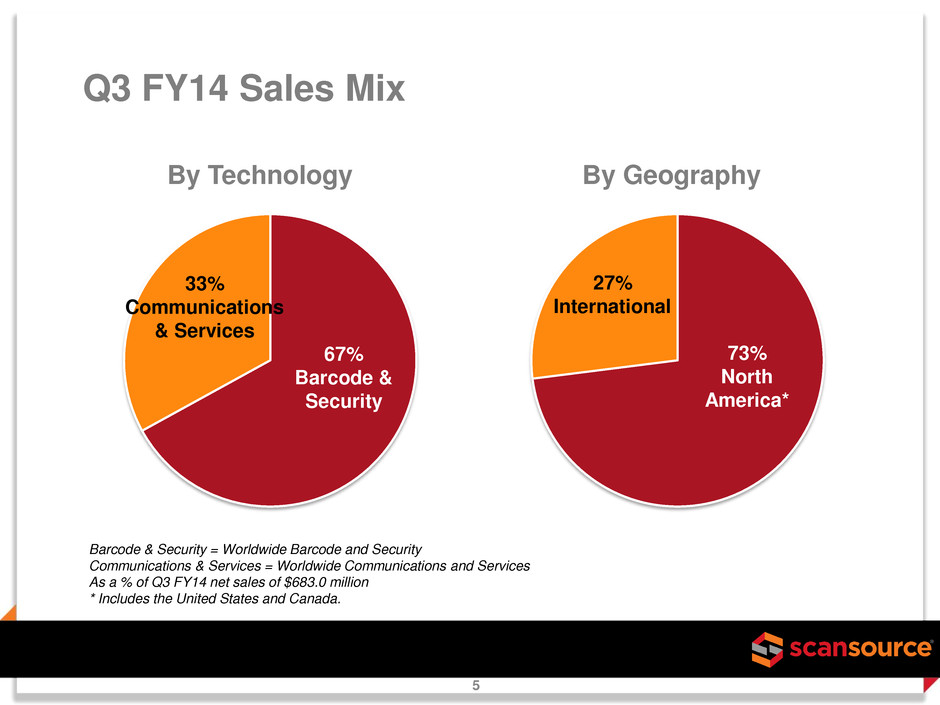
Q3 FY14 Sales Mix Barcode & Security = Worldwide Barcode and Security Communications & Services = Worldwide Communications and Services As a % of Q3 FY14 net sales of $683.0 million * Includes the United States and Canada. 67% Barcode & Security 73% North America* 33% Communications & Services 5 By Technology By Geography 27% International

Q3 FY14 Q3 FY13 Net sales $455.8 $438.2 Gross profit $43.0 $39.1 Gross margin 9.4% 8.9% Operating income $13.8 $10.4 Operating income % 3.0% 2.4% $438 $456 Q3 FY13 Q3 FY14 WW Barcode & Security Net Sales, $ in millions Up 4.0% Excluding FX, Up 4.8% $ in millions 6 * See Appendix for reconciliation of net sales excluding impact of foreign exchange to a GAAP measure.

Q3 FY14 Q3 FY13 Net sales $227.2 $244.8 Gross profit $30.3 $29.8 Gross margin 13.3% 12.2% Operating income $11.8 $10.4 Operating income % 5.2% 4.2% $245 $227 Q3 FY13 Q3 FY14 WW Communications & Services $ in millions Net Sales, $ in millions Down (7.2)% Excluding FX, Down (7.4)% 7 * See Appendix for reconciliation of net sales excluding impact of foreign exchange to a GAAP measure.
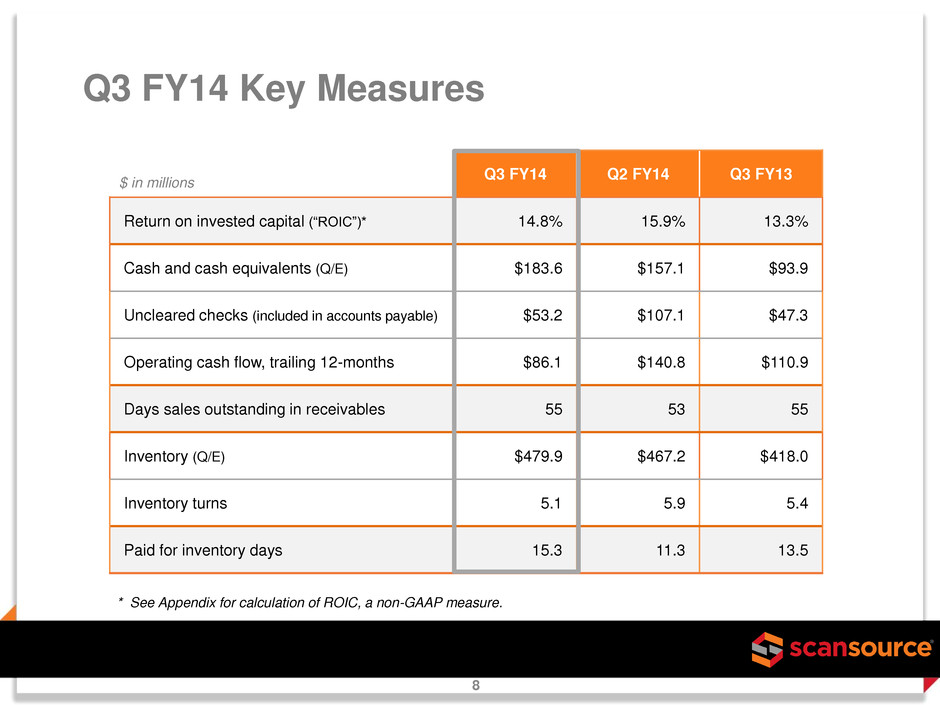
Q3 FY14 Q2 FY14 Q3 FY13 Return on invested capital (“ROIC”)* 14.8% 15.9% 13.3% Cash and cash equivalents (Q/E) $183.6 $157.1 $93.9 Uncleared checks (included in accounts payable) $53.2 $107.1 $47.3 Operating cash flow, trailing 12-months $86.1 $140.8 $110.9 Days sales outstanding in receivables 55 53 55 Inventory (Q/E) $479.9 $467.2 $418.0 Inventory turns 5.1 5.9 5.4 Paid for inventory days 15.3 11.3 13.5 Q3 FY14 Key Measures $ in millions 8 * See Appendix for calculation of ROIC, a non-GAAP measure.
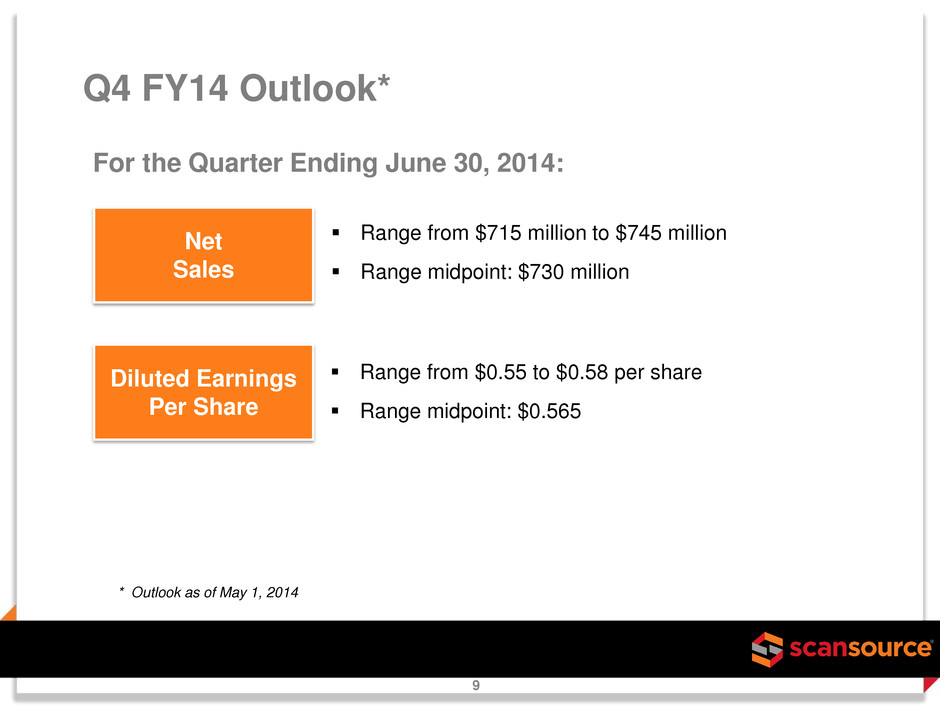
Q4 FY14 Outlook* For the Quarter Ending June 30, 2014: Net Sales Diluted Earnings Per Share Range from $715 million to $745 million Range midpoint: $730 million Range from $0.55 to $0.58 per share Range midpoint: $0.565 * Outlook as of May 1, 2014 9
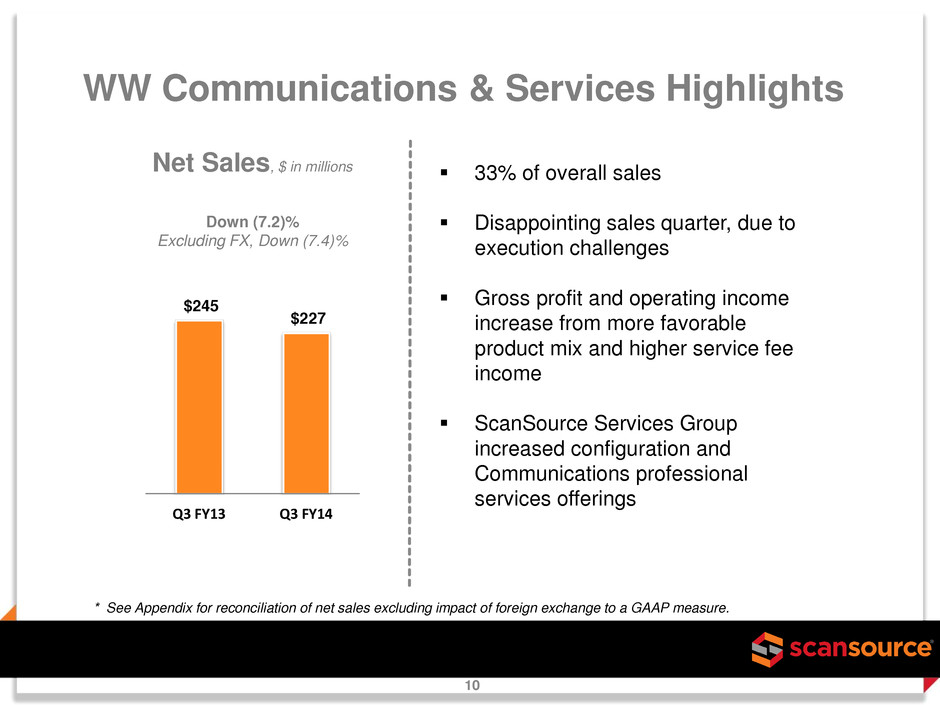
$245 $227 Q3 FY13 Q3 FY14 WW Communications & Services Highlights Net Sales, $ in millions Down (7.2)% Excluding FX, Down (7.4)% 10 * See Appendix for reconciliation of net sales excluding impact of foreign exchange to a GAAP measure. 33% of overall sales Disappointing sales quarter, due to execution challenges Gross profit and operating income increase from more favorable product mix and higher service fee income ScanSource Services Group increased configuration and Communications professional services offerings
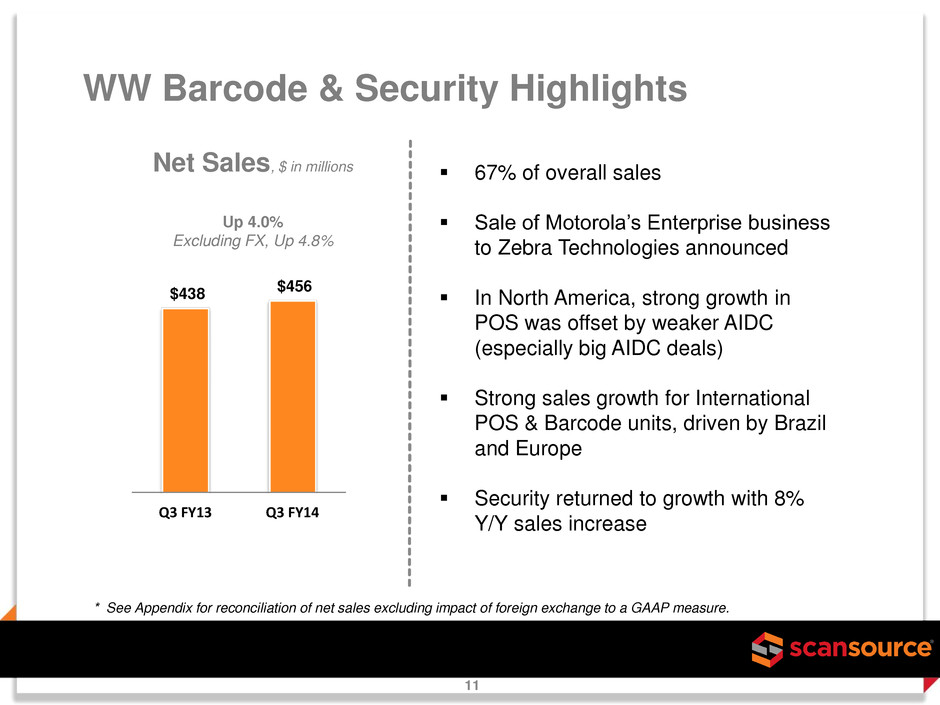
$438 $456 Q3 FY13 Q3 FY14 WW Barcode & Security Highlights Net Sales, $ in millions Up 4.0% Excluding FX, Up 4.8% 11 * See Appendix for reconciliation of net sales excluding impact of foreign exchange to a GAAP measure. 67% of overall sales Sale of Motorola’s Enterprise business to Zebra Technologies announced In North America, strong growth in POS was offset by weaker AIDC (especially big AIDC deals) Strong sales growth for International POS & Barcode units, driven by Brazil and Europe Security returned to growth with 8% Y/Y sales increase
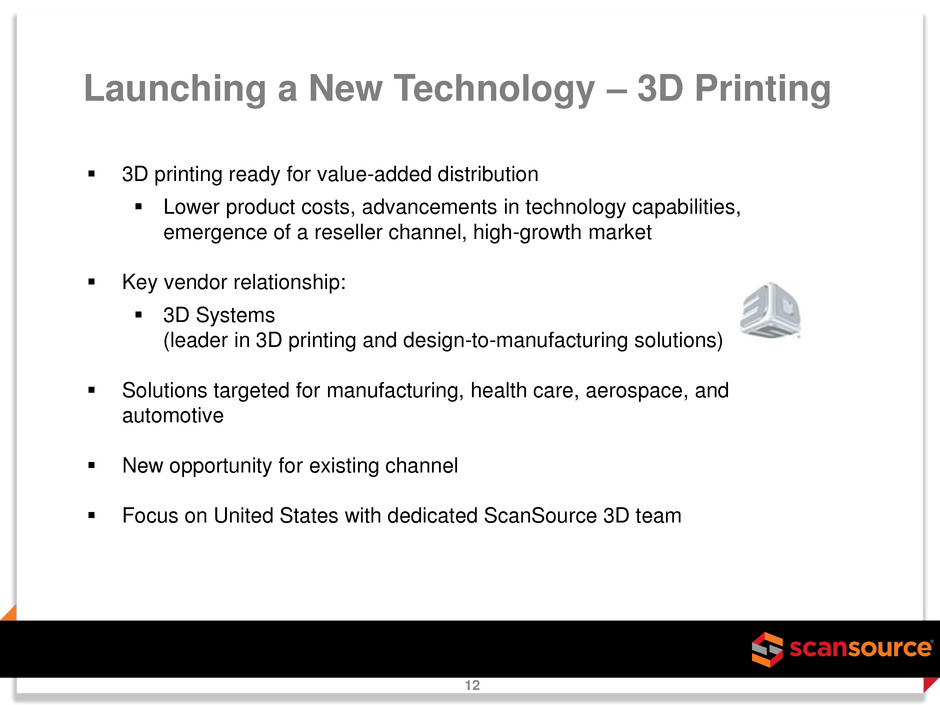
Launching a New Technology – 3D Printing 12 3D printing ready for value-added distribution Lower product costs, advancements in technology capabilities, emergence of a reseller channel, high-growth market Key vendor relationship: 3D Systems (leader in 3D printing and design-to-manufacturing solutions) Solutions targeted for manufacturing, health care, aerospace, and automotive New opportunity for existing channel Focus on United States with dedicated ScanSource 3D team
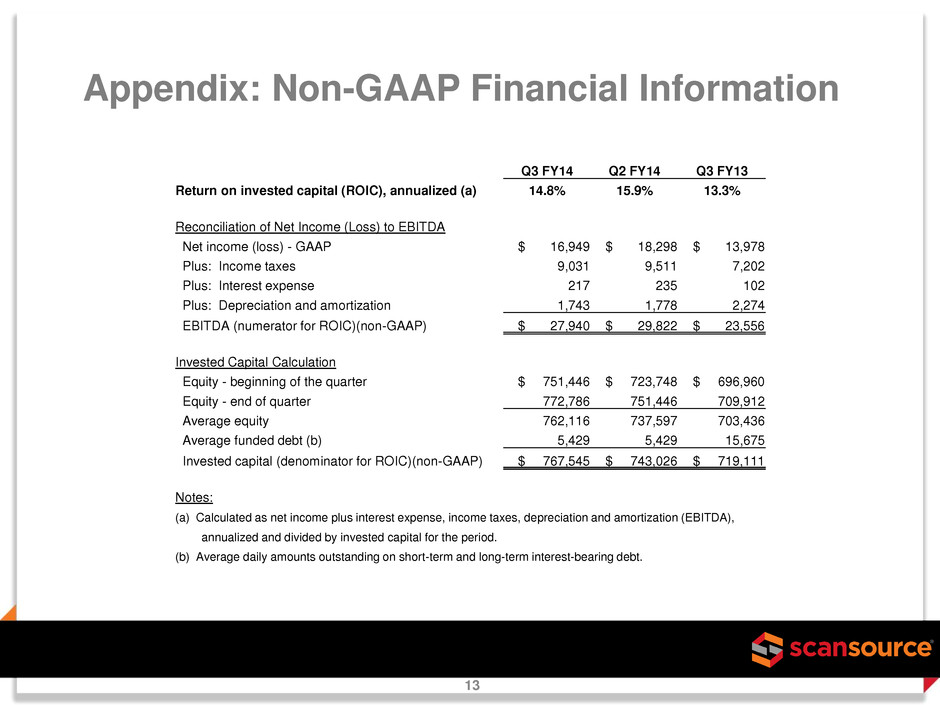
Appendix: Non-GAAP Financial Information 13 Q3 FY14 Q2 FY14 Q3 FY13 Return on invested capital (ROIC), annualized (a) 14.8% 15.9% 13.3% Reconciliation of Net Income (Loss) to EBITDA Net income (loss) - GAAP $ 16,949 $ 18,298 $ 13,978 Plus: Income taxes 9,031 9,511 7,202 Plus: Interest expense 217 235 102 Plus: Depreciation and amortization 1,743 1,778 2,274 EBITDA (numerator for ROIC)(non-GAAP) $ 27,940 $ 29,822 $ 23,556 Invested Capital Calculation Equity - beginning of the quarter $ 751,446 $ 723,748 $ 696,960 Equity - end of quarter 772,786 751,446 709,912 Average equity 762,116 737,597 703,436 Average funded debt (b) 5,429 5,429 15,675 Invested capital (denominator for ROIC)(non-GAAP) $ 767,545 $ 743,026 $ 719,111 Notes: (a) Calculated as net income plus interest expense, income taxes, depreciation and amortization (EBITDA), annualized and divided by invested capital for the period. (b) Average daily amounts outstanding on short-term and long-term interest-bearing debt.
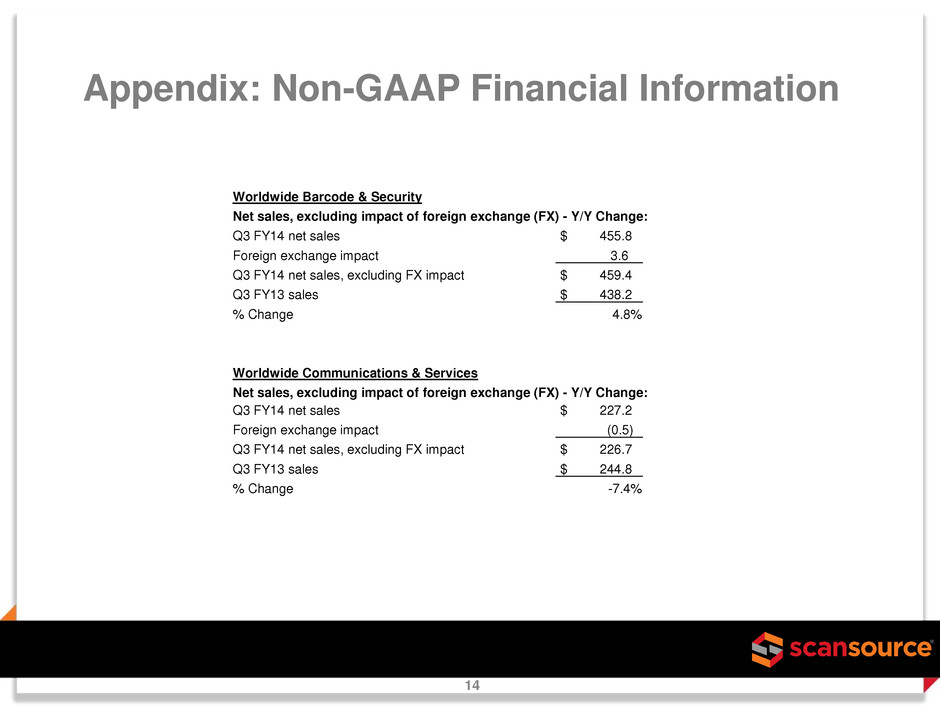
Appendix: Non-GAAP Financial Information 14 Worldwide Barcode & Security Net sales, excluding impact of foreign exchange (FX) - Y/Y Change: Q3 FY14 net sales $ 455.8 Foreign exchange impact 3.6 Q3 FY14 net sales, excluding FX impact $ 459.4 Q3 FY13 sales $ 438.2 % Change 4.8% Worldwide Communications & Services Net sales, excluding impact of foreign exchange (FX) - Y/Y Change: Q3 FY14 net sales $ 227.2 Foreign exchange impact (0.5) Q3 FY14 net sales, excluding FX impact $ 226.7 Q3 FY13 sales $ 244.8 % Change -7.4%
