Attached files
| file | filename |
|---|---|
| 8-K - 8-K - Alon USA Energy, Inc. | alj2014shareholdermeetingp.htm |

Annual Shareholders Meeting May 1, 2014

Forward-Looking Statements All statements contained in or made in connection with this presentation that are not statements of historical fact are forward-looking statements intended to be covered by the safe harbor provisions of the Securities Act of 1933 or the Securities Exchange Act of 1934. Forward-looking statements reflect the current expectations of the management of Alon USA Energy, Inc. (“Alon”) regarding future events, results or outcomes. These expectations may or may not be realized and actual results could differ materially from those projected in forward-looking statements. Alon’s businesses and operations involve numerous risks and uncertainties, many of which are beyond our control, which could result in the expectations reflected in forward-looking statements not being realized or which may otherwise affect Alon’s financial condition, results of operations and cash flows. Alon undertakes no obligation to update or publicly release the results of any revisions to any forward-looking statements that may be made to reflect events or circumstances that occur, or that we become aware of, after the date of this presentation or to reflect the occurrence of unanticipated events.

2013 Focus Areas (from last year’s meeting) • Operate Safely & Environmentally Compliant • Execution – Take Advantage of Opportunities • Develop and Execute Plan for California • Improve Asphalt Profitability • Pay off Krotz Springs Bonds • Perform Strategic Review to Look for Growth Opportunities 3

2013 Highlights • Adjusted EBITDA of $271MM • Reduced Net Debt by $83MM • Successfully issued $150MM of 3% convertible debt • Paid off $140MM of Krotz Springs Bonds • Reduced losses in California and improved profitability at Krotz Springs • Initiated review of strategic plans for the future 4

Gross Margin $9.58/bbl Gross Margin $11.19/bbl Gross Margin $11.19/bbl 5 Gross Margin $17.10/bbl Gross Margin $11.19/bbl Gross Margin $17.10/bbl Gross Margin $11.19/bbl • Big Spring Profitability Dropped as Margins Narrowed – Still Generated More than $1B in Operating Profit Over Last 3 Years 2014 Focus Areas • Successfully Complete the 2014 Turnaround • Complete the Revamp of the Vacuum Tower • Continue Process Improvement Initiatives • Develop Capital Projects to Further Improve Profitability Big Spring Refinery
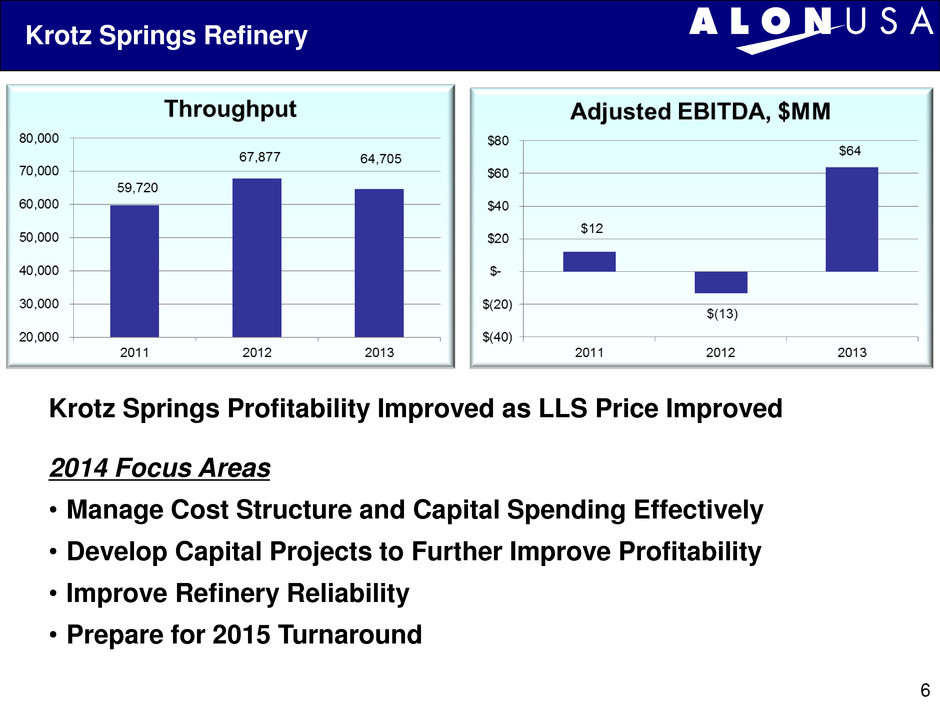
Gross Margin $9.58/bbl Gross Margin $11.19/bbl Gross Margin $11.19/bbl 6 Gross Margin $17.10/bbl Gross Margin $11.19/bbl Gross Margin $17.10/bbl Gross Margin $11.19/bbl Krotz Springs Profitability Improved as LLS Price Improved 2014 Focus Areas • Manage Cost Structure and Capital Spending Effectively • Develop Capital Projects to Further Improve Profitability • Improve Refinery Reliability • Prepare for 2015 Turnaround Krotz Springs Refinery
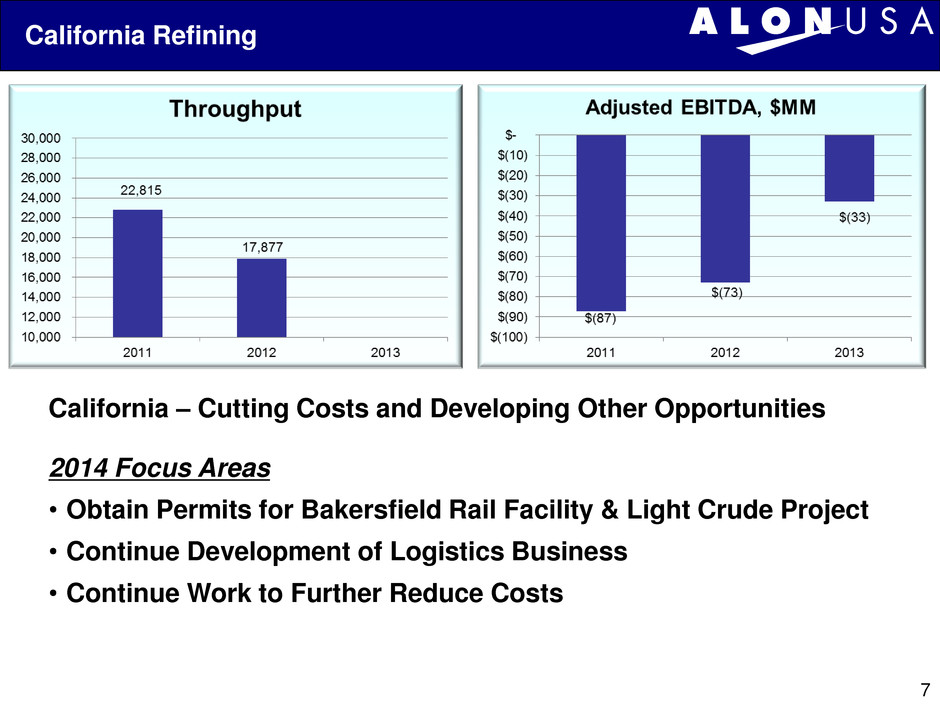
Gross Margin $9.58/bbl Gross Margin $11.19/bbl Gross Margin $11.19/bbl 7 Gross Margin $17.10/bbl Gross Margin $11.19/bbl Gross Margin $17.10/bbl Gross Margin $11.19/bbl California – Cutting Costs and Developing Other Opportunities 2014 Focus Areas • Obtain Permits for Bakersfield Rail Facility & Light Crude Project • Continue Development of Logistics Business • Continue Work to Further Reduce Costs California Refining

Gross Margin $9.58/bbl Gross Margin $11.19/bbl Gross Margin $11.19/bbl 8 Gross Margin $17.10/bbl Gross Margin $11.19/bbl Gross Margin $17.10/bbl Gross Margin $11.19/bbl 2014 Focus Areas • Manage Cost Structure and Capital Spending Effectively • Maximize Production of Higher Margin Specialty Asphalt Products • Increase Sales to Increase Asset Utilization • Optimize Logistics 1,096,000 947,000 789,000 500,000 600,000 700,000 800,000 900,000 1,000,000 1,100,000 1,200,000 2011 2012 2013 Sales, tons $(13) $9 $8 -$35 -$30 -$25 -$20 -$15 -$10 -$5 $0 $5 $10 $15 2011 2012 2013 Adjusted EBITDA, $MM Asphalt Marketing
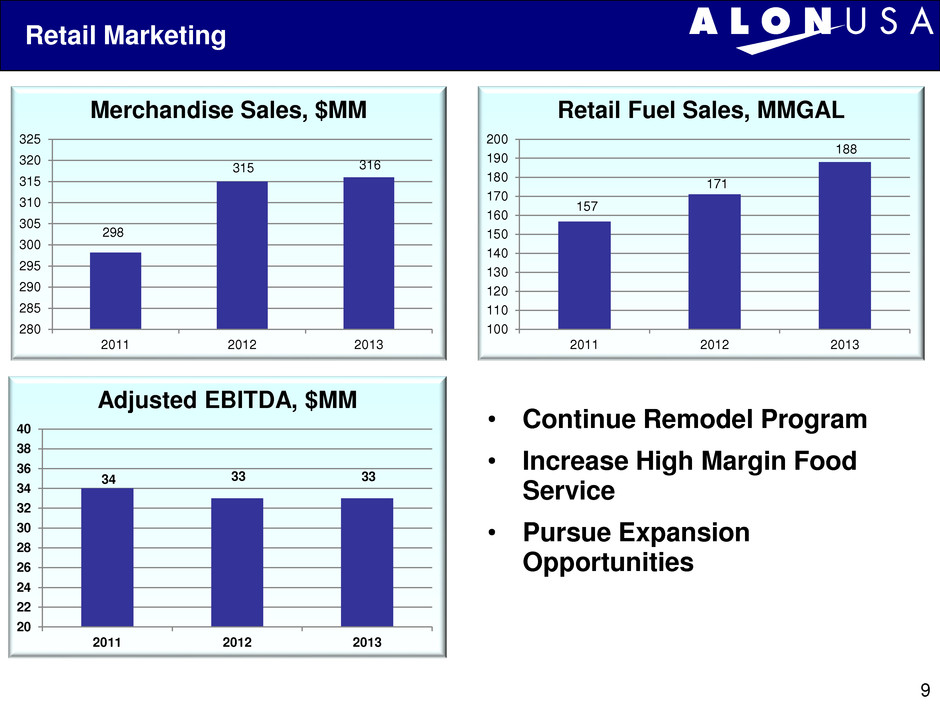
• Continue Remodel Program • Increase High Margin Food Service • Pursue Expansion Opportunities 157 171 188 100 110 120 130 140 150 160 170 180 190 200 2011 2012 2013 Retail Fuel Sales, MMGAL 298 315 316 280 285 290 295 300 305 310 315 320 325 2011 2012 2013 Merchandise Sales, $MM 34 33 33 20 22 24 26 28 30 32 34 36 38 40 2011 2012 2013 Adjusted EBITDA, $MM Retail Marketing 9

2014 Focus Areas • Operate Safely & Environmentally Compliant • Execution – Take Advantage of Opportunities • Successfully complete the Big Spring turnaround • Develop West Coast logistics business (BKF permit) • Improve Asphalt Profitability • Pay off remaining Krotz Springs Bonds • Develop and implement strategic plans to grow our business 10
11 Appendix
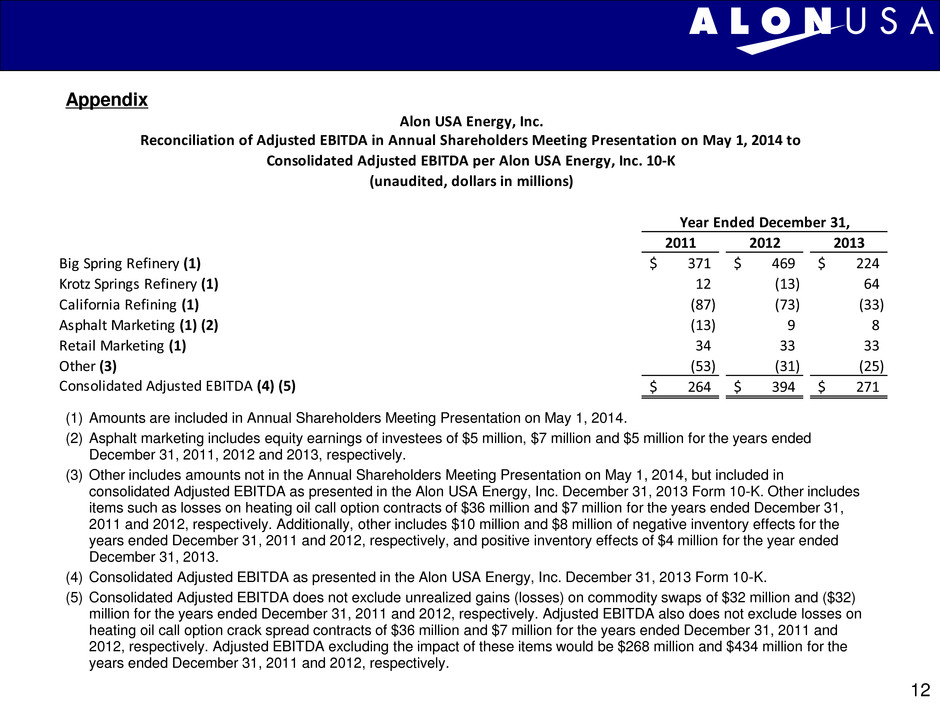
12 Appendix (1) Amounts are included in Annual Shareholders Meeting Presentation on May 1, 2014. (2) Asphalt marketing includes equity earnings of investees of $5 million, $7 million and $5 million for the years ended December 31, 2011, 2012 and 2013, respectively. (3) Other includes amounts not in the Annual Shareholders Meeting Presentation on May 1, 2014, but included in consolidated Adjusted EBITDA as presented in the Alon USA Energy, Inc. December 31, 2013 Form 10-K. Other includes items such as losses on heating oil call option contracts of $36 million and $7 million for the years ended December 31, 2011 and 2012, respectively. Additionally, other includes $10 million and $8 million of negative inventory effects for the years ended December 31, 2011 and 2012, respectively, and positive inventory effects of $4 million for the year ended December 31, 2013. (4) Consolidated Adjusted EBITDA as presented in the Alon USA Energy, Inc. December 31, 2013 Form 10-K. (5) Consolidated Adjusted EBITDA does not exclude unrealized gains (losses) on commodity swaps of $32 million and ($32) million for the years ended December 31, 2011 and 2012, respectively. Adjusted EBITDA also does not exclude losses on heating oil call option crack spread contracts of $36 million and $7 million for the years ended December 31, 2011 and 2012, respectively. Adjusted EBITDA excluding the impact of these items would be $268 million and $434 million for the years ended December 31, 2011 and 2012, respectively. Alon USA Energy, Inc. Reconciliation of Adjusted EBITDA in Annual Shareholders Meeting Presentation on May 1, 2014 to Consolidated Adjusted EBITDA per Alon USA Energy, Inc. 10-K (unaudited, dollars in millions) Year Ended December 31, 2011 2012 2013 Big Spring Refinery (1) 371$ 469$ 224$ Krotz Springs Refinery (1) 12 (13) 64 California Refining (1) (87) (73) (33) sphalt Marketing (1) (2) (13) 9 8 Retail Marketing (1) 34 33 33 Other (3) (53) (31) (25) Consolidated Adjusted EBITDA (4) (5) 264$ 394$ 271$

