Attached files
| file | filename |
|---|---|
| 8-K - FORM 8-K - WESTERN DIGITAL CORP | d720152d8k.htm |
| EX-99.1 - EX-99.1 - WESTERN DIGITAL CORP | d720152dex991.htm |
Exhibit 99.2
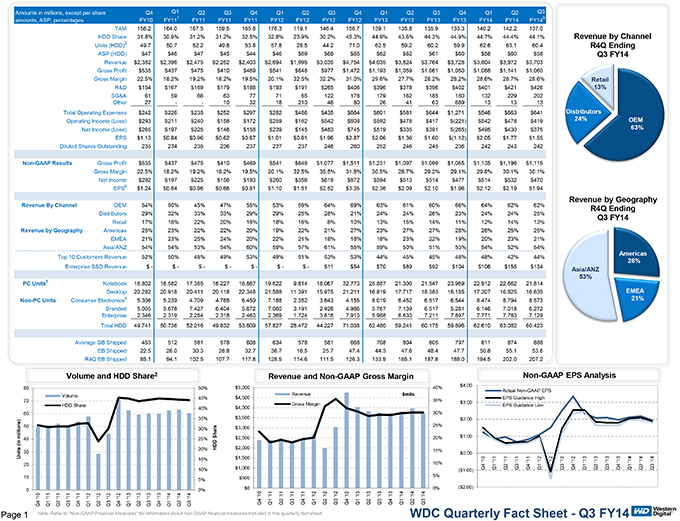
TAM 156.2 164.0 167.5 159.5 165.8 176.3 119.1 146.4 156.7 139.1 135.8 135.9 133.3 140.2 142.2 137.0
HDD Share 31.8% 30.9% 31.2% 31.2% 32.5% 32.8% 23.9% 30.2% 45.3% 44.9% 43.6% 44.3% 44.9% 44.7% 44.4% 44.1%
Units (HDD)2 49.7 50.7 52.2 49.8 53.8 57.8 28.5 44.2 71.0 62.5 59.2 60.2 59.9 62.6 63.1 60.4
ASP (HDD) $47 $46 $47 $45 $44 $46 $69 $68 $65 $62 $62 $61 $60 $58 $60 $58
Revenue $2,382 $2,396 $2,475 $2,252 $2,403 $2,694 $1,995 $3,035 $4,754 $4,035 $3,824 $3,764 $3,728 $3,804 $3,972 $3,703
Gross Profit $535 $437 $475 $410 $469 $541 $648 $977 $1,472 $1,193 $1,059 $1,061 $1,050 $1,088 $1,141 $1,060
Gross Margin 22.5% 18.2% 19.2% 18.2% 19.5% 20.1% 32.5% 32.2% 31.0% 29.6% 27.7% 28.2% 28.2% 28.6% 28.7% 28.6%
R&D $154 $167 $169 $179 $188 $193 $191 $265 $406 $396 $378 $396 $402 $401 $421 $426
SG&A 61 59 66 63 77 71 85 122 178 179 162 185 180 132 229 202
Other 27
— 10 32 18 210 48 80 26 41 63 689 13 13 13
Total Operating Expenses $242 $226 $235 $252 $297 $282 $486 $435 $664 $601 $581 $644 $1,271 $546 $663 $641
Operating Income (Loss) $293 $211 $240 $158 $172 $259 $162 $542 $808 $592 $478 $417 $(221) $542 $478 $419
Net Income (Loss) $265 $197 $225 $146 $158 $239 $145 $483 $745 $519 $335 $391 $(265) $495 $430 $375
EPS $1.13 $0.84 $0.96 $0.62 $0.67 $1.01 $0.61 $1.96 $2.87 $2.06 $1.36 $1.60 $(1.12) $2.05 $1.77 $1.55
Diluted Shares Outstanding 235 234 235 236 237 237 237 246 260 252 246 245 236 242 243 242
Non-GAAP Results Gross Profit $535 $437 $475 $410 $469 $541 $648 $1,077 $1,511 $1,231 $1,097 $1,099 $1,085 $1,135 $1,196 $1,115
Gross Margin 22.5% 18.2% 19.2% 18.2% 19.5% 20.1% 32.5% 35.5% 31.8% 30.5% 28.7% 29.2% 29.1% 29.8% 30.1% 30.1%
Net Income $292 $197 $225 $156 $193 $260 $358 $619 $872 $594 $513 $514 $477 $514 $532 $470
EPS6 $1.24 $0.84 $0.96 $0.66 $0.81 $1.10 $1.51 $2.52 $3.35 $2.36 $2.09 $2.10 $1.96 $2.12 $2.19 $1.94
Revenue By Channel OEM 54% 50% 45% 47% 55% 53% 59% 64% 69% 63% 61% 60% 66% 64% 62% 62%
Distributors 29% 32% 33% 33% 29% 29% 25% 28% 21% 24% 24% 26% 23% 24% 24% 25%
Retail 17% 18% 22% 20% 16% 18% 16% 8% 10% 13% 15% 14% 11% 12% 14% 13%
Revenue
by Geography Americas 25% 23% 22% 22% 20% 19% 22% 21% 27% 23% 27% 27% 28% 26% 25% 25%
EMEA 21% 23% 25% 24% 20% 22% 21% 18% 18% 18% 23% 22% 19% 20% 23% 21%
Asia/ANZ 54% 54% 53% 54% 60% 59% 57% 61% 55% 59% 50% 51% 53% 54% 52% 54%
Top
10 Customers Revenue 52% 50% 48% 49% 53% 49% 51% 53% 53% 44% 45% 45% 48% 48% 42% 44%
Enterprise SSD Revenue $—$—$—$—$—$—$—$11
$54 $70 $89 $92 $104 $106 $155 $134
PC Units5 Notebook 16.802 16.582 17.385 16.227 16.867 19.622 9.814 18.067 32.773 25.887 21.300 21.547 23.989 22.912 22.662
21.814
Desktop 20.282 20.918 20.411 20.118 22.348 21.588 11.391 15.975 21.211 16.819 17.717 18.383 16.185 17.307 16.825 16.635
Non-PC Units Consumer Electronics4 5.306 5.239 4.709 4.765 6.459 7.188 2.352 3.643 4.155 8.019 6.452 6.517 6.544 8.474 8.794 8.573
Branded 5.005 5.678 7.427 6.404 5.672 7.060 3.191 2.926 4.986 5.767 7.139 6.517 5.281 6.146 7.018 6.272
Enterprise 2.346 2.319 2.284 2.318 2.463 2.369 1.724 3.616 7.913 5.988 6.633 7.211 7.897 7.771 7.783 7.129
Total HDD 49.741 50.736 52.216 49.832 53.809 57.827 28.472 44.227 71.038 62.480 59.241 60.175 59.896 62.610 63.082 60.423
Average GB Shipped 453 512 581 578 608 634 578 581 668 708 804 805 797 811 874 888
EB Shipped
22.5 26.0 30.3 28.8 32.7 36.7 16.5 25.7 47.4 44.3 47.6 48.4 47.7 50.8 55.1 53.6
R4Q EB Shipped 85.1 94.1 102.5 107.7 117.8 128.5 114.6 111.5 126.3 133.9 165.1
187.8 188.0 194.5 202.0 207.2
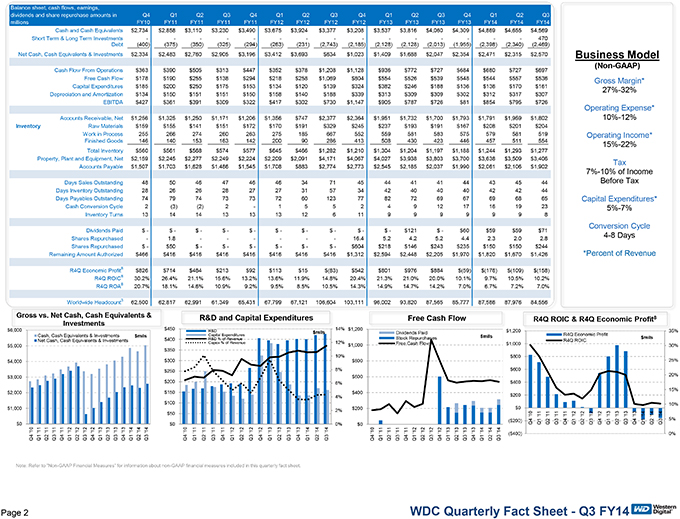
Cash and Cash Equivalents $2,734 $2,858 $3,110 $3,230 $3,490 $3,675 $3,924 $3,377 $3,208 $3,537 $3,816 $4,060 $4,309 $4,869 $4,655 $4,569 Short Term & Long Term Investments — — — — — — ——470 Debt (400) (375) (350) (325) (294) (263) (231) (2,743) (2,185) (2,128) (2,128) (2,013) (1,955) (2,398) (2,340) (2,469) Net Cash, Cash Equivalents & Investments $2,334 $2,483 $2,760 $2,905 $3,196 $3,412 $3,693 $634 $1,023 $1,409 $1,688 $2,047 $2,354 $2,471 $2,315 $2,570 Cash Flow From Operations $363 $390 $505 $313 $447 $352 $378 $1,208 $1,128 $936 $772 $727 $684 $680 $727 $697 Free Cash Flow $178 $190 $255 $138 $294 $218 $258 $1,069 $804 $554 $526 $539 $548 $544 $557 $536 Capital Expenditures $185 $200 $250 $175 $153 $134 $120 $139 $324 $382 $246 $188 $136 $136 $170 $161 Depreciation and Amortization $134 $150 $151 $151 $150 $158 $140 $188 $339 $313 $309 $309 $302 $312 $317 $307 EBITDA $427 $361 $391 $309 $322 $417 $302 $730 $1,147 $905 $787 $726 $81 $854 $795 $726 Accounts Receivable, Net $1,256 $1,325 $1,250 $1,171 $1,206 $1,356 $747 $2,377 $2,364 $1,951 $1,732 $1,700 $1,793 $1,791 $1,959 $1,802 Inventory Raw Materials $159 $155 $141 $151 $172 $170 $191 $329 $245 $237 $193 $191 $167 $208 $201 $204 Work in Process 255 266 274 260 263 275 185 667 552 559 581 583 575 579 581 519 Finished Goods 146 140 153 163 142 200 90 286 413 508 430 423 446 457 511 554 Total Inventory $560 $561 $568 $574 $577 $645 $466 $1,282 $1,210 $1,304 $1,204 $1,197 $1,188 $1,244 $1,293 $1,277 Property, Plant and Equipment, Net $2,159 $2,245 $2,277 $2,249 $2,224 $2,209 $2,091 $4,171 $4,067 $4,027 $3,938 $3,803 $3,700 $3,638 $3,509 $3,406 Accounts Payable $1,507 $1,703 $1,628 $1,486 $1,545 $1,708 $883 $2,774 $2,773 $2,545 $2,185 $2,037 $1,990 $2,061 $2,106 $1,902 Days Sales Outstanding 48 50 46 47 46 46 34 71 45 44 41 41 44 43 45 44 Days Inventory Outstanding 28 26 26 28 27 27 31 57 34 42 40 40 40 42 42 44 Days Payables Outstanding 74 79 74 73 73 72 60 123 77 82 72 69 67 69 68 65 Cash Conversion Cycle 2 (3) (2) 2—1 5 5 2 4 9 12 17 16 19 23 Inventory Turns 13 14 14 13 13 13 12 6 11 9 9 9 9 9 9 8 Dividends Paid $—$—$—$—$—$—$—$—$—$—$121 $—$60 $59 $59 $71 Shares Repurchased—1.8 — — — 16.4 5.2 4.2 5.2 4.4 2.3 2.0 2.8 Shares Repurchased $—$50 $—$—$—$—$—$—$604 $218 $146 $243 $235 $150 $150 $244 Remaining Amount Authorized $466 $416 $416 $416 $416 $416 $416 $416 $1,312 $2,594 $2,448 $2,205 $1,970 $1,820 $1,670 $1,426 R4Q Economic Profit8 $826 $714 $484 $213 $92 $113 $15 $(83) $542 $801 $976 $884 $(59) $(176) $(109) $(158) R4Q ROIC8 30.2% 26.4% 21.1% 15.6% 13.2% 13.6% 11.9% 14.8% 20.4% 21.3% 21.0% 20.0% 10.1% 9.7% 10.5% 10.2% R4Q ROA8 20.7% 18.1% 14.6% 10.9% 9.2% 9.5% 8.5% 10.5% 14.3% 14.9% 14.7% 14.2% 7.0% 6.7% 7.2% 7.0% Worldwide Headcount3 62,500 62,817 62,991 61,349 65,431 67,799 67,121 106,604 103,111 96,002 93,820 87,565 85,777 87,586 87,976 84,556
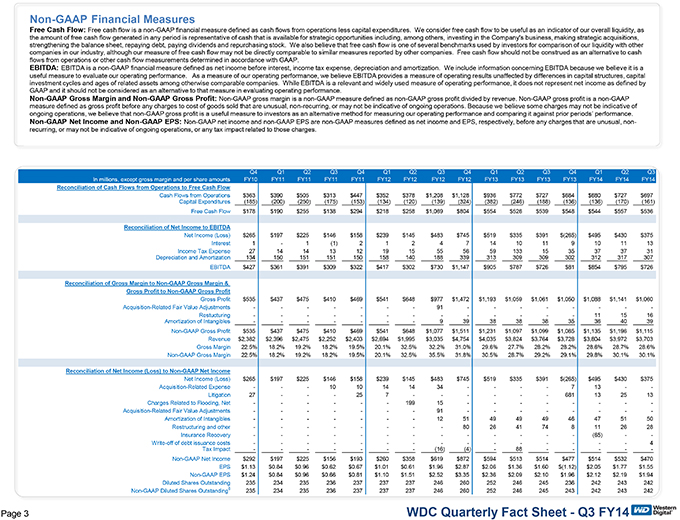
Non-GAAP Financial Measures Free Cash Flow: Free cash flow is a non-GAAP financial measure defined as cash flows from operations less capital expenditures. We consider free cash flow to be useful as an indicator of our overall liquidity, as the amount of free cash flow generated in any period is representative of cash that is available for strategic opportunities including, among others, investing in the Company’s business, making strategic acquisitions, strengthening the balance sheet, repaying debt, paying dividends and repurchasing stock. We also believe that free cash flow is one of several benchmarks used by investors for comparison of our liquidity with other companies in our industry, although our measure of free cash flow may not be directly comparable to similar measures reported by other companies. Free cash flow should not be construed as an alternative to cash flows from operations or other cash flow measurements determined in accordance with GAAP. EBITDA: EBITDA is a non-GAAP financial measure defined as net income before interest, income tax expense, depreciation and amortization. We include information concerning EBITDA because we believe it is a useful measure to evaluate our operating performance. As a measure of our operating performance, we believe EBITDA provides a measure of operating results unaffected by differences in capital structures, capital investment cycles and ages of related assets among otherwise comparable companies. While EBITDA is a relevant and widely used measure of operating performance, it does not represent net income as defined by GAAP and it should not be considered as an alternative to that measure in evaluating operating performance. Non-GAAP Gross Margin and Non-GAAP Gross Profit: Non-GAAP gross margin is a non-GAAP measure defined as non-GAAP gross profit divided by revenue. Non-GAAP gross profit is a non-GAAP measure defined as gross profit before any charges to cost of goods sold that are unusual, non-recurring, or may not be indicative of ongoing operations. Because we believe some charges may not be indicative of ongoing operations, we believe that non-GAAP gross profit is a useful measure to investors as an alternative method for measuring our operating performance and comparing it against prior periods’ performance. Non-GAAP Net Income and Non-GAAP EPS: Non-GAAP net income and non-GAAP EPS are non-GAAP measures defined as net income and EPS, respectively, before any charges that are unusual, non-recurring, or may not be indicative of ongoing operations, or any tax impact related to those charges. Reconciliation of Cash Flows from Operations to Free Cash Flow Cash Flows from Operations $363 $390 $505 $313 $447 $352 $378 $1,208 $1,128 $936 $772 $727 $684 $680 $727 $697 CapitalExpenditures(185) (200) (250) (175) (153) (134) (120) (139) (324) (382) (246) (188) (136) (136) (170) (161) Free Cash Flow $178 $190 $255 $138 $294 $218 $258 $1,069 $804 $554 $526 $539 $548 $544 $557 $536 Reconciliation of Net Income to EBITDA Net Income (Loss) $265 $197 $225 $146 $158 $239 $145 $483 $745 $519 $335 $391 $(265) $495 $430 $375 Interest 1—1 (1) 2 1 2 4 7 14 10 11 9 10 11 13 Income Tax Expense 27 14 14 13 12 19 15 55 56 59 133 15 35 37 37 31 Depreciation and Amortization 134 150 151 151 150 158 140 188 339 313 309 309 302 312 317 307 EBITDA $427 $361 $391 $309 $322 $417 $302 $730 $1,147 $905 $787 $726 $81 $854 $795 $726 Reconciliation of Gross Margin to Non-GAAP Gross Margin & Gross Profit to Non-GAAP Gross Profit Gross Profit $535 $437 $475 $410 $469 $541 $648 $977 $1,472 $1,193 $1,059 $1,061 $1,050 $1,088 $1,141 $1,060 Acquisition-Related Fair Value Adjustments — — ——91 — — — — Restucturing — — — — — ——11 15 16 Amortization of Intangibles — — ——9 39 38 38 38 35 36 40 39 Non-GAAP Gross Profit $535 $437 $475 $410 $469 $541 $648 $1,077 $1,511 $1,231 $1,097 $1,099 $1,085 $1,135 $1,196 $1,115 Revenue $2,382 $2,396 $2,475 $2,252 $2,403 $2,694 $1,995 $3,035 $4,754 $4,035 $3,824 $3,764 $3,728 $3,804 $3,972 $3,703 Gross Margin 22.5% 18.2% 19.2% 18.2% 19.5% 20.1% 32.5% 32.2% 31.0% 29.6% 27.7% 28.2% 28.2% 28.6% 28.7% 28.6% Non-GAAP Gross Margin 22.5% 18.2% 19.2% 18.2% 19.5% 20.1% 32.5% 35.5% 31.8% 30.5% 28.7% 29.2% 29.1% 29.8% 30.1% 30.1% Reconciliation of Net Income (Loss) to Non-GAAP Net Income Net Income (Loss) $265 $197 $225 $146 $158 $239 $145 $483 $745 $519 $335 $391 $(265) $495 $430 $375 Acquisition-Related Expense ——10 10 14 14 34 — — 7 13 — Litigation 27 ——25 7 — — — 681 13 25 15 Charges Related to Flooding, Net — — — 199 15 — — — — Acquisition-Related Fair Value Adjustments — — ——91 — — — — Amortization of Intangibles — — ——12 51 49 49 49 46 47 51 50 Restructuring and other — — — — 80 26 41 74 8 11 26 26 Insurance Recovery — — — — — ——(65) — Extinguishment of debt issuance costs — — — — — — ——4 Tax Impact — — ——(16) (4)—88 — — - Non-GAAP Net Income $292 $197 $225 $156 $193 $260 $358 $619 $872 $594 $513 $514 $477 $514 $532 $470 EPS $1.13 $0.84 $0.96 $0.62 $0.67 $1.01 $0.61 $1.96 $2.87 $2.06 $1.36 $1.60 $(1.12) $2.05 $1.77 $1.55 Non-GAAP EPS $1.24 $0.84 $0.96 $0.66 $0.81 $1.10 $1.51 $2.52 $3.35 $2.36 $2.09 $2.10 $1.96 $2.12 $2.19 $1.94 Diluted Shares Outstanding 235 234 235 236 237 237 237 246 260 252 246 245 236 242 243 242 Non-GAAP Diluted Shares Outstanding6 235 234 235 236 237 237 237 246 260 252 246 245 243 242 243 242
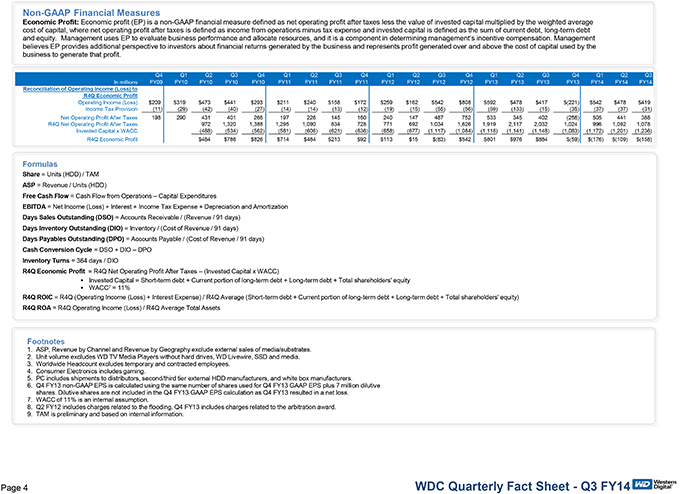
Non-GAAP Financial Measures Economic Profit: Economic profit (EP) is a non-GAAP financial measure defined as net operating profit after taxes less the value of invested capital multiplied by the weighted average cost of capital, where net operating profit after taxes is defined as income from operations minus tax expense and invested capital is defined as the sum of current debt, long-term debt and equity. Management uses EP to evaluate business performance and allocate resources, and it is a component in determining management’s incentive compensation. Management believes EP provides additional perspective to investors about financial returns generated by the business and represents profit generated over and above the cost of capital used by the business to generate that profit. 14 Reconciliation of Operating Income (Loss) to R4Q Economic Profit Operating Income (Loss) $209 $319 $473 $441 $293 $211 $240 $158 $172 $259 $162 $542 $808 $592 $478 $417 $(221) $542 $478 $419 Income Tax Provision (11) (29) (42) (40) (27) (14) (14) (13) (12) (19) (15) (55) (56) (59) (133) (15) (35) (37) (37) (31) Net Operating Profit After Taxes 198 290 431 401 266 197 226 145 160 240 147 487 752 533 345 402 (256) 505 441 388 R4Q Net Operating Profit After Taxes 972 1,320 1,388 1,295 1,090 834 728 771 692 1,034 1,626 1,919 2,117 2,032 1,024 996 1,092 1,078 Invested Capital x WACC(488) (534) (562) (581) (606) (621) (636) (658) (677) (1,117) (1,084) (1,118) (1,141) (1,148) (1,083) (1,172) (1,201) (1,236) R4Q Economic Profit $484 $786 $826 $714 $484 $213 $92 $113 $15 $(83) $542 $801 $976 $884 $(59) $(176) $(109) $(158) Free Cash Flow = Cash Flow from Operations – Capital Expenditures EBITDA = Net Income (Loss) + Interest + Income Tax Expense + Depreciation and Amortization Days Sales Outstanding (DSO) = Accounts Receivable / (Revenue / 91 days) Days Inventory Outstanding (DIO) = Inventory / (Cost of Revenue / 91 days) Days Payables Outstanding (DPO) = Accounts Payable / (Cost of Revenue / 91 days) Cash Conversion Cycle = DSO + DIO – DPO Inventory Turns = 364 days / DIO R4Q Economic Profit = R4Q Net Operating Profit After Taxes – (Invested Capital x WACC) ? Invested Capital = Short-term debt + Current portion of long-term debt + Long-term debt + Total shareholders’ equity ? WACC7 = 11% R4Q ROIC = R4Q (Operating Income (Loss) + Interest Expense) / R4Q Average (Short-term debt + Current portion of long-term debt + Long-term debt + Total shareholders’ equity) R4Q ROA = R4Q Operating Income (Loss) / R4Q Average Total Assets